Satellite-Observed Black Water Events off Southwest Florida: Implications for Coral Reef Health in the Florida Keys National Marine Sanctuary

Abstract
:
1. Introduction
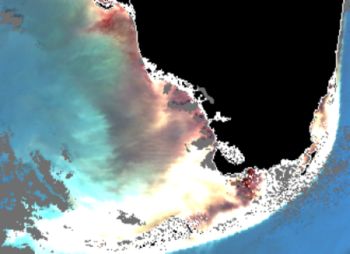
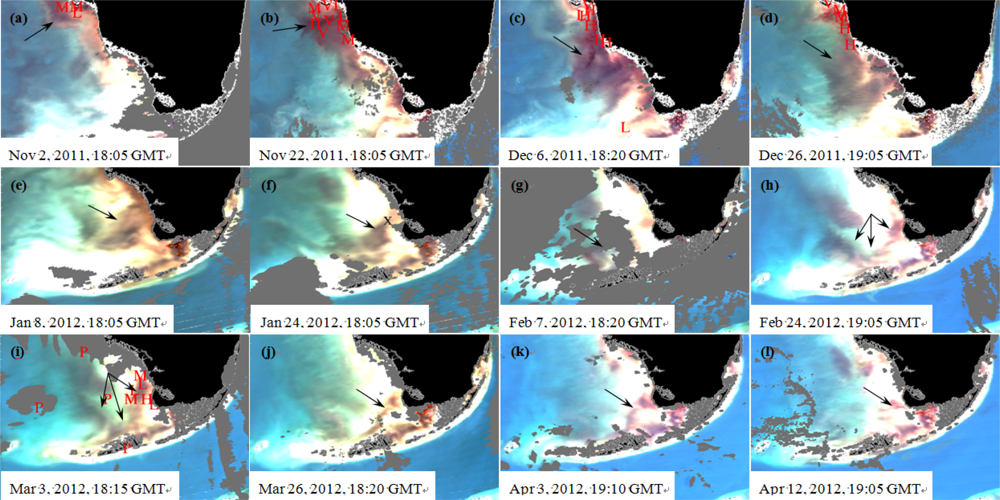
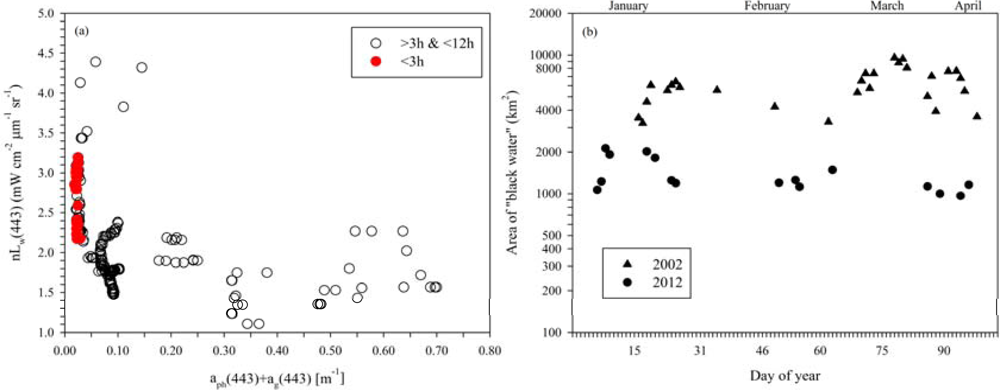
- To document the 2012 black water event in southwest Florida coastal waters using Moderate-Resolution Imaging Spectroradiometer (MODIS) measurements, and compare it with the 2002 black water event in the same region but studied with the Sea-viewing Wide Field-of-view Sensor (SeaWiFS) measurements;
- To understand what caused the black water event in 2012.
2. Data and Methods
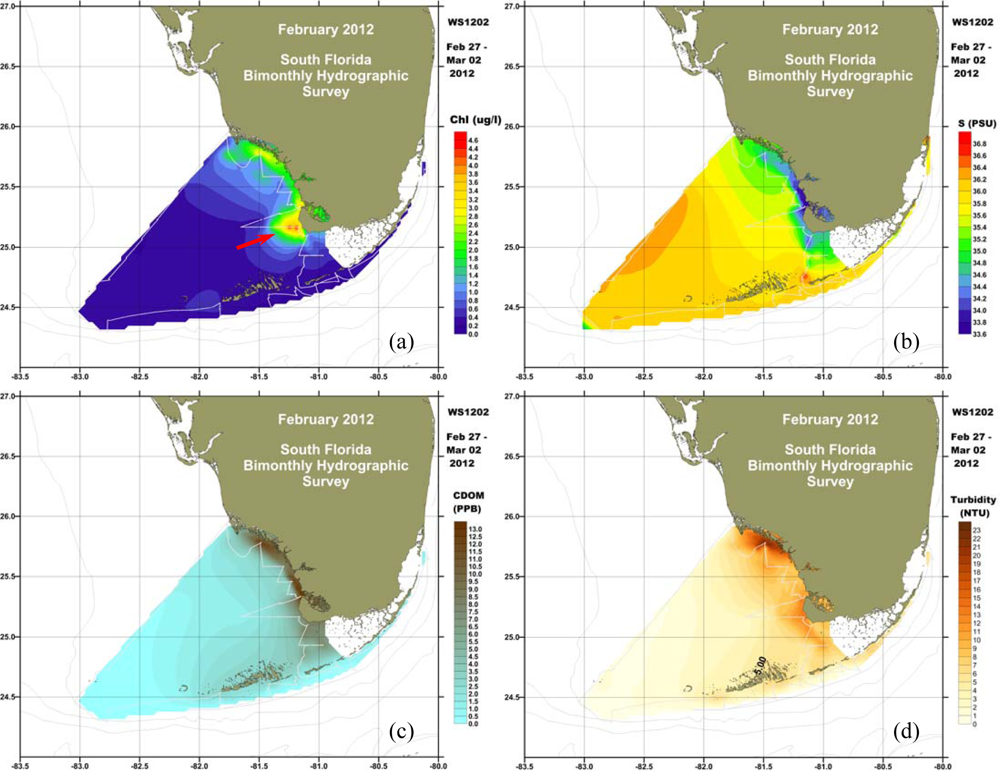
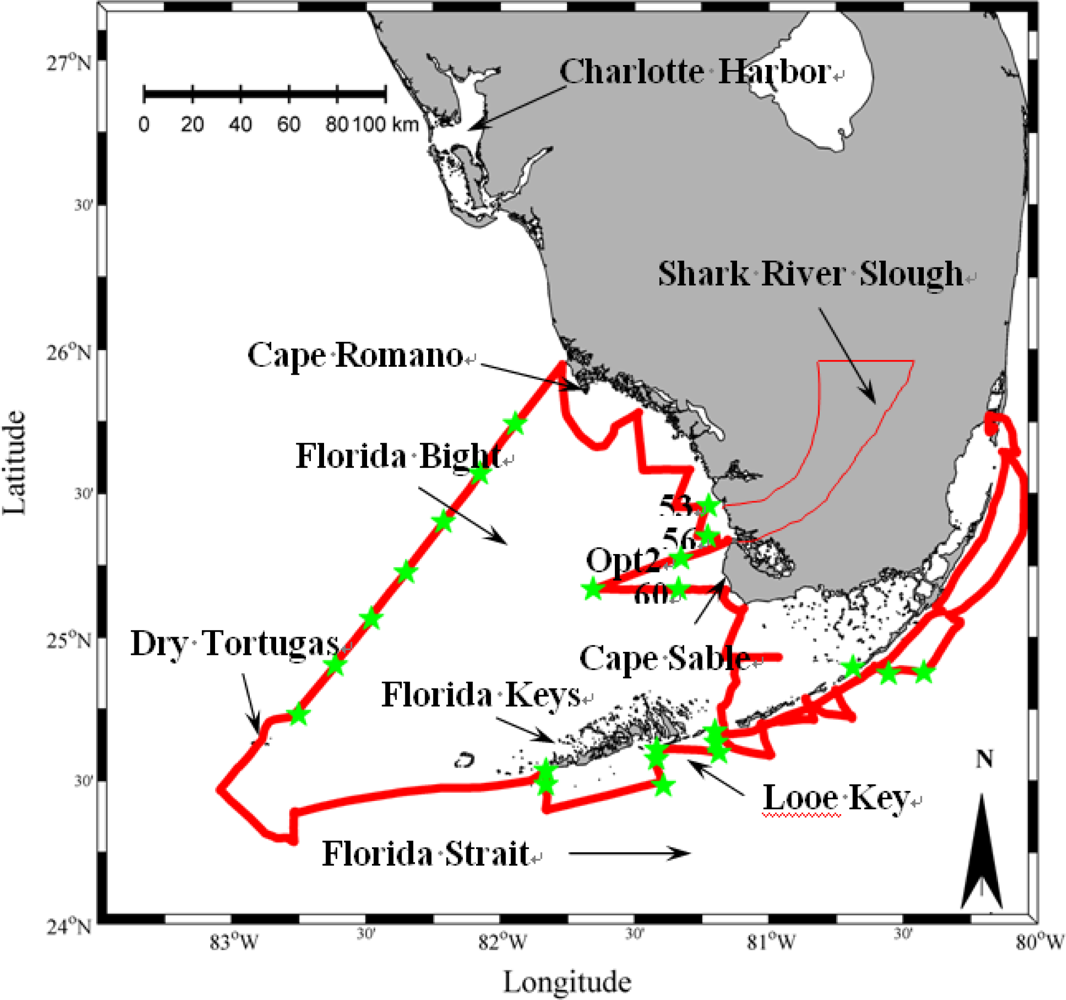
2.1. In Situ Survey
2.2. Satellite Data
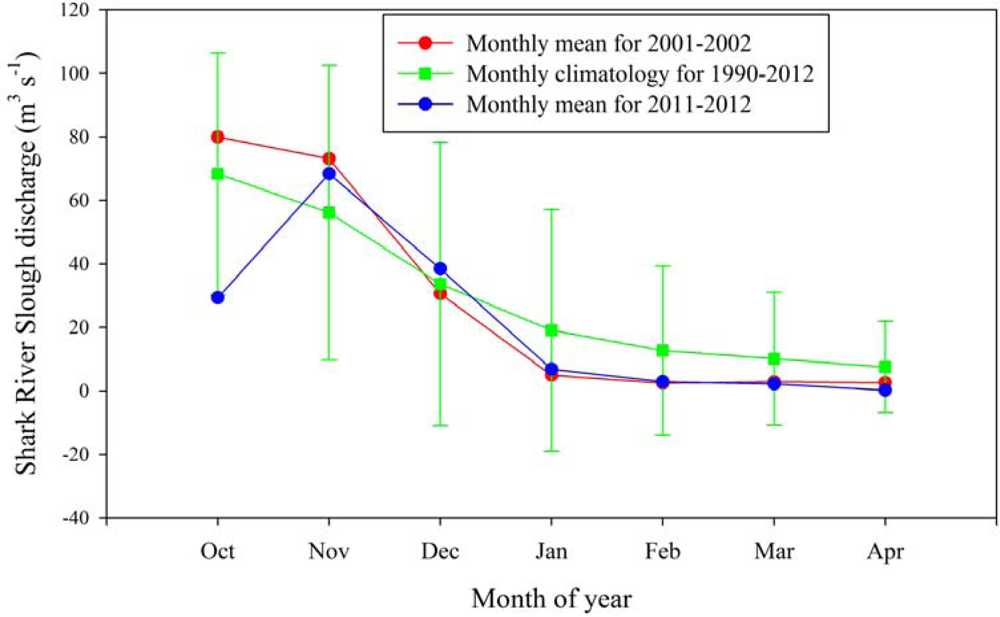
2.3. River Discharge and Nutrient Concentrations
2.4. Determining nLw Threshold
3. Results
4. Discussion
4.1. Causes of the 2012 Black Water Event
4.2. Impacts of Black Water Events on Coral Reef Health
5. Conclusion
Acknowledgments
References
- Causey, B.D. The role of the Florida Keys National Marine Sanctuary in the South Florida Ecosystem Restoration Initiative. In The Everglades, Florida Bay, and Coral Reefs of the Florida Keys: An Ecosystem Sourcebook; Porter, J.W., Porter, K.G., Eds.; CRC Press: Boca Raton, FL, USA, 2002; pp. 883–894. [Google Scholar]
- Keller, B.D.; Causey, D.B. Linkages between the Florida Keys National Marine Sanctuary and the South Florida Ecosystem Restoration Initiative. Ocean Coast. Manage 2005, 48, 869–900. [Google Scholar]
- Hu, C.; Muller-Karger, F.E. On the Connectivity and “Black Water” Phenomena near the FKNMS: A Remote Sensing Perspective. In Proceedings of Science, People and Policy in the Florida Keys National Marine Sanctuary Connectivity Colloquium, Key West, FL, USA, 19–21 August 2004; Keller, B.D., Wilmot, F.C., Eds.; Department of Commerce National Oceanic and Atmospheric Administration, National Marine Sanctuary Program: Silver Spring, MD, USA, 2007; pp. 47–55. [Google Scholar]
- Lapointe, B.E.; Matzie, W.R.; Barile, P.J. Biotic Phase-Shifts in Florida Bay and Fore Reef Communities in the Florida Keys: Linkages with Historical Freshwater Flows and Nitrogen Loading from Everglades Runoff. In The Everglades, Florida Bay, and Coral Reefs of the Florida Keys: An Ecosystem Sourcebook; Porter, J.W., Porter, K.G., Eds.; CRC Press: Boca Raton, FL, USA, 2002; pp. 629–648. [Google Scholar]
- Lapointe, B.E.; Matzie, W.R.; Barlie, P.J. Anthropogenic nutrient enrichment of seagrass and coral reef communities in the Lower Florida Keys: Discrimination of local versus regional nitrogen sources. J. Exp. Mar. Biol. Ecol 2004, 308, 23–58. [Google Scholar]
- Lapointe, B.E.; Matzie, W.R.; Clark, M.W. Phosphorus Inputs and Eutrophication on the Florida Reef Tract. In Global Coral Reefs: Health, Hazards, and History; Ginsberg, R.N., Ed.; Rosenstiel School of Marine and Atmospheric Sciences, University of Miami: Miami, FL, USA, 1993; pp. 106–112. [Google Scholar]
- Porter, J.W.; Kosmynin, V.; Patterson, K.L.; Porter, K.G.; Jaap, W.C.; Wheaton, J.L.; Hackett, K.; Lybolt, M.; Tosolos, C.P.; Yanev, G.; et al. Detection of Coral Reef Change by the Florida Keys Coral Reef Monitoring Project. In The Everglades, Florida Bay, and Coral Reefs of the Florida Keys: An Ecosystem Sourcebook; Porter, J.W., Porter, K.G., Eds.; CRC Press: Boca Raton, FL, USA, 2002; pp. 749–769. [Google Scholar]
- The South-West Florida Dark-Water Observations Group (SWFDOG). Satellite images track “black water” event off Florida coast. EoS Trans. AGU 2002, 83, 281–285. [Google Scholar]
- Neely, M.B.; Bartels, E.; Cannizzaro, J.; Carder, K.L.; Coble, O.; English, D.; Heil, C.; Hu, C.; Hunt, J.; Ivey, J.; et al. Florida’s Black Water Event. In Proceedings of the Xth International Conference on Harmful Algae, Saint Petersburg Beach, FL, USA, 21–25 October 2002; Steidinger, K.A., Landsberg, J.H., Tomas, C.R., Vargo, G.A., Eds.; Florida Marine Research Institute: Saint Petersburg, FL, USA, 2004; pp. 377–379. [Google Scholar]
- Hu, C.; Hackett, K.E.; Callahan, M.K.; Andréfouët, S.; Wheaton, J.L.; Porter, J.W.; Muller-Karger, F.E. The 2002 ocean color anomaly in the Florida Bight: A cause of local coral reef decline? Geophys. Res. Lett. 2003. [Google Scholar] [CrossRef]
- Hu, C.; Muller-Karger, F.E.; Vargo, G.A.; Neely, M.B.; Johns, E. Linkages between coastal runoff and the Florida Keys ecosystem: A study of a dark plume event. Geophys. Res. Lett. 2004. [Google Scholar] [CrossRef]
- Hedley, J.D.; Roelfsema, C.M.; Phinn, S.R.; Mumby, P.J. Environmental and sensor limitations in optical remote sensing of coral reefs: Implications for monitoring and sensor design. Remote Sens. 2012. [Google Scholar] [CrossRef]
- Cannizzaro, J.P; Carder, K.L.; Chen, F.R.; Heil, C.A.; Vargo, G.A. A novel technique for detection of the toxic dinoflagellate, Karenia brevis, in the Gulf of Mexico from remotely sensed ocean color data. Cont. Shelf Res 2008, 28, 137–158. [Google Scholar]
- Lee, Z.P.; Carder, K.L.; Arnone, R.A. Deriving inherent optical properties from water color: A multiband quasi-analytical algorithm for optically deep waters. Appl. Opt 2002, 41, 5755–5772. [Google Scholar]
- Zhao, J.; Barnes, B.; Melo, N.; English, D.; Lapointe, B.; Muller-Karger, F.; Schaeffer, B.; Hu, C. Assessment of satellite-derived diffuse attenuation coefficients and euphotic depths in south Florida coastal waters. Remote Sens. Environ 2013, 131, 38–50. [Google Scholar]
- Hu, C.; Lee, Z.; Ma, R.; Yu, K.; Li, D.; Shang, S. Moderate Resolution Imaging Spectroradiometer (MODIS) observations of cyanobacteria blooms in Taihu Lake, China. J. Geophys. Res. 2010. [Google Scholar] [CrossRef]
- Lee, T.N.; Johns, E.; Wilson, D.; Williams, E.; Smith, N. Transport processes linking south florida coastal ecosystems. In The Everglades, Florida Bay, and Coral Reefs of the Florida Keys, an Ecosystem Source Book; Porter, J.W., Porter, K.G., Eds.; CRC Press: Boca Raton, FL, USA, 2002; pp. 309–342. [Google Scholar]
- Yentsch, C.S.; Lapointe, B.E.; Poulton, N.; Phinney, D.A. Anatomy of a red tide bloom off the southwest coast of Florida. Harmful Algae 2008, 7, 817–826. [Google Scholar]
- Hu, C.; Cannizzaro, J.; Carder, K.L.; Muller-Karger, F.E.; Hardy, R. Remote detection of Trichodesmium blooms in optically complex coastal waters: Examples with MODIS full-spectral data. Remote Sens. Environ 2010, 114, 2048–2058. [Google Scholar]
- Bell, P.R.F. Eutrophication and coral reefs—Some examples in the Great Barrier Reef lagoon. Water Res 1992, 26, 553–568. [Google Scholar]
- Lapointe, B.E.; Bedford, B.J.; Littler, M.M.; Littler, D.S. Shifts in coral overgrowth by sponges and algae. Coral Reef. 2007. [Google Scholar] [CrossRef]
- Yentsch, C.S.; Yentsch, C.M.; Cullen, J.J.; Lapointe, B.E.; Phinney, D.A.; Woodman, S.F. Sunlight and water transparency: Cornerstones in coral research. J. Exp. Mar. Biol. Ecol 2002, 268, 171–183. [Google Scholar]
- Howarth, R.; Anderson, D.; Cloem, J.; Elfring, C.; Hopkinson, C.; Lapointe, B.; Malone, T.; Marcus, N.; McGlathery, K.; Sharkley, A.; et al. Nutrient pollutions of coastal rivers, bays, and seas. Issue. Ecol 2000, 7, 1–15. [Google Scholar]
- Lapointe, B.E.; Bedford, B.; Baumberger, R; Looe Key, FL. Nutrients and Climate Change Pose Threat to Coral Reefs. In Effects of Nutrient Enrichment in the Nation’s Estuaries: A Decade of Change; Bricker, S., Longstaff, B.J., Dennison, W.C., Jones, A.B., Boicourt, K., Wicks, E.C., Woerner, J.L., Eds.; National Centers for Coastal Ocean Science: Silver Spring, MD, USA, 2007; pp. 104–105. [Google Scholar]


Share and Cite
Zhao, J.; Hu, C.; Lapointe, B.; Melo, N.; Johns, E.M.; Smith, R.H. Satellite-Observed Black Water Events off Southwest Florida: Implications for Coral Reef Health in the Florida Keys National Marine Sanctuary. Remote Sens. 2013, 5, 415-431. https://doi.org/10.3390/rs5010415
Zhao J, Hu C, Lapointe B, Melo N, Johns EM, Smith RH. Satellite-Observed Black Water Events off Southwest Florida: Implications for Coral Reef Health in the Florida Keys National Marine Sanctuary. Remote Sensing. 2013; 5(1):415-431. https://doi.org/10.3390/rs5010415
Chicago/Turabian StyleZhao, Jun, Chuanmin Hu, Brian Lapointe, Nelson Melo, Elizabeth M. Johns, and Ryan H. Smith. 2013. "Satellite-Observed Black Water Events off Southwest Florida: Implications for Coral Reef Health in the Florida Keys National Marine Sanctuary" Remote Sensing 5, no. 1: 415-431. https://doi.org/10.3390/rs5010415
APA StyleZhao, J., Hu, C., Lapointe, B., Melo, N., Johns, E. M., & Smith, R. H. (2013). Satellite-Observed Black Water Events off Southwest Florida: Implications for Coral Reef Health in the Florida Keys National Marine Sanctuary. Remote Sensing, 5(1), 415-431. https://doi.org/10.3390/rs5010415