Relationship between Hyperspectral Measurements and Mangrove Leaf Nitrogen Concentrations


Abstract
: The use of spectral response curves for estimating nitrogen (N) leaf concentrations generally has been found to be a challenging task for a variety of plant species. In this investigation, leaf N concentration and corresponding laboratory hyperspectral data were examined for two species of mangrove (Avicennia germinans, Rhizophora mangle) representing a variety of conditions (healthy, poor condition, dwarf) of a degraded mangrove forest located in the Mexican Pacific. This is the first time leaf nitrogen content has been examined using close range hyperspectral remote sensing of a degraded mangrove forest. Simple comparisons between individual wavebands and N concentrations were examined, as well as two models employed to predict N concentrations based on multiple wavebands. For one model, an Artificial Neural Network (ANN) was developed based on known N absorption bands. For comparative purposes, a second model, based on the well-known Stepwise Multiple Linear Regression (SMLR) approach, was employed using the entire dataset. For both models, the input data included continuum removed reflectance, band depth at the centre of the absorption feature (BNC), and log (1/BNC). Weak to moderate correlations were found between N concentration and single band spectral responses. The results also indicate that ANNs were more predictive for N concentration than was SMLR, and had consistently higher r2 values. The highest r2 value (0.91) was observed in the prediction of black mangrove (A. germinans) leaf N concentration using the BNC transformation. It is thus suggested that artificial neural networks could be used in a complementary manner with other techniques to assess mangrove health, thereby improving environmental monitoring in coastal wetlands, which is of prime importance to local communities. In addition, it is recommended that the BNC transformation be used on the input for such N concentration prediction models.1. Introduction
Nitrogen (N) is one of the most important components in plant tissues and, consequently, changes in leaf nitrogen concentration could adversely affect the function, structure, and condition of an ecosystem. The nitrogen cycle is also closely related to the carbon cycle within forest ecosystems [1]. Leaf N concentration therefore indicates the overall nutritional status of forests, including mangroves. Traditional methods for analyzing N concentration are quite slow and prohibitively expensive. Remote sensing techniques have recently been shown to be the only feasible alternative to these traditional approaches for mapping the spatial distribution of N concentration over large areas. Studies employing remote sensing have focused on both the leaf (e.g., [2–5]) and canopy (e.g., [6,7]) levels. Moreover, research on the relationships between N and spectral response have been conducted on a large variety of tree species, including eucalyptus (e.g., [5,6]), red oak, red maple, larch, red pine, as well as many others (e.g., [8]).
Mangrove forests are the basis of coastal communities throughout the tropics and subtropics. Unfortunately, these forested wetlands are being cut or degraded as the result of various human activities such as hydrological modifications, aquaculture, and pollution [9]. Given the importance of these coastal wetlands to a myriad of organisms and as a renewable resource for local communities worldwide, it is crucial that the condition of these forests be properly monitored. Consequently, leaf N concentration could be used as a possible indicator of mangrove health. In fact, several studies have already investigated the changes of N concentration in mangrove leaves in response to changing environmental conditions (e.g., [10–14]). However, these studies collected point N concentration data, and it is difficult to extrapolate these values to indicate spatial variations. Due to limited accessibility and difficulty of movement through these forested wetlands, only a few studies have applied remote sensing techniques for identifying plant biochemical component changes in mangroves (e.g., [15]) and linking the changes of leaf N concentration with variations in spectral responses (airborne) for mangrove forests (e.g., [16,17]). N concentration has been extracted using support vector regression [16] and a radiative transfer model [17] using hyperspectral imagery. No N concentration studies have been conducted for degraded mangrove forests using close range hyperspectral data.
Various methods have been applied to examine the relationships between leaf N concentration and spectral information in other vegetation types, and could provide the most appropriate technique in monitoring N within mangrove forests. For example, linear and non-linear regression have been used to study the relationships based on single wavebands or on narrow band vegetation indices (e.g., [18,19]). However, the correlation between leaf N concentration and these spectral responses are generally not very high, although a r2 value of 0.7 was recently reported in one of many controlled experiments (e.g., [20–22]). Stepwise multiple linear regression (SMLR) has also been used to determine the relationship of N concentration and spectral properties (e.g., [2,21,23]). Although conventional SMLR is a popular approach, an approximately linear relationship between the input and the response variables must be assumed. Data transformations may be helpful in making relationships more linear, but they often cannot account for complex nonlinearities in the input-response relationship [24]. Furthermore, bands selected from SMLR are not necessarily related to N absorption [2]. Consequently, nonlinear regression may be used for suspected nonlinear relationships. However, this approach assumes that an a priori model be specified when such detailed information is often unknown [24]. Alternatively, the partial least squares regression (PLSR) can be applied to reduce the dimensionality of hyperspectral data to a few uncorrelated principal components (e.g., [6,25,26]). PLSR models can decrease background effects and avoid the potential overfitting problem typically associated with stepwise regression analysis [6]. Useful wavebands for N assessment could be decided based on their factor loadings of the principal components from PLSR [25] or from the correlation between reflectance and N concentration [6]. Nonetheless, modified PLSR methods were reported to provide non-stable results in comparison to the widely varying results from stepwise regression [6].
To address some of the shortcomings of regression-based techniques, artificial neural networks (ANNs), a computational intelligence technique, were employed in this investigation. ANNs provide one approach for modeling the relationships—linear or nonlinear—between input and response variables. ANNs were originally developed to model neural interconnections in the brain. They consist of an input layer of “neurons” into which input variables (e.g., spectral reflectance values) are presented. The inputs are connected to one or more hidden layers (to introduce nonlinearity), which are subsequently connected to an output layer consisting of response variables (e.g., N concentration). Each connection has its own weight, roughly analogous to coefficients in nonlinear regression. The ANN is “trained” by repeated supervised presentation of input values. This training allows the ANN to adaptively “learn” the weights that best represent the relationship between input and response variables. Such learning is accomplished through an iterative optimization technique, such as gradient descent or Levenberg-Marquardt optimization. ANNs are particularly useful in nonlinear modeling because of their predictive power and robustness in the presence of noisy or incomplete data [27]. However, the use of ANNs for nonlinear modeling has some drawbacks, including complex input-response relationships that may not correspond to biological or physical models, the (mostly) empirical selection of network architecture (i.e., number of hidden neurons and layers), the sometimes unpredictable behaviour in the presence of outlier or boundary data, and long training time. In addition, as a computational intelligence technique that relies on stochasticity, very different network weights may be obtained from the same architecture after different training sessions, making rigorous analysis difficult. Nevertheless, in applications where nonlinear relationships are sought, the benefits of using ANNs outweigh the potential shortcomings. ANNs have been used in estimating vegetation canopy properties, including estimating forest cover from AVHRR images [27], estimating grass quality from spectroscopy data [24], and calculating leaf N concentration from HYMAP data [6,7].
In this investigation, relationships are examined between laboratory hyperspectral data and N concentration for mangrove leaves collected from a degraded mangrove forest of the Mexican Pacific. In order to determine the most appropriate technique for, ideally, estimating mangrove leaf N concentration, the SMLR and ANN are applied to data from both black (Avicennia germinans) and red mangroves (Rhizophora mangle).
2. Study Area
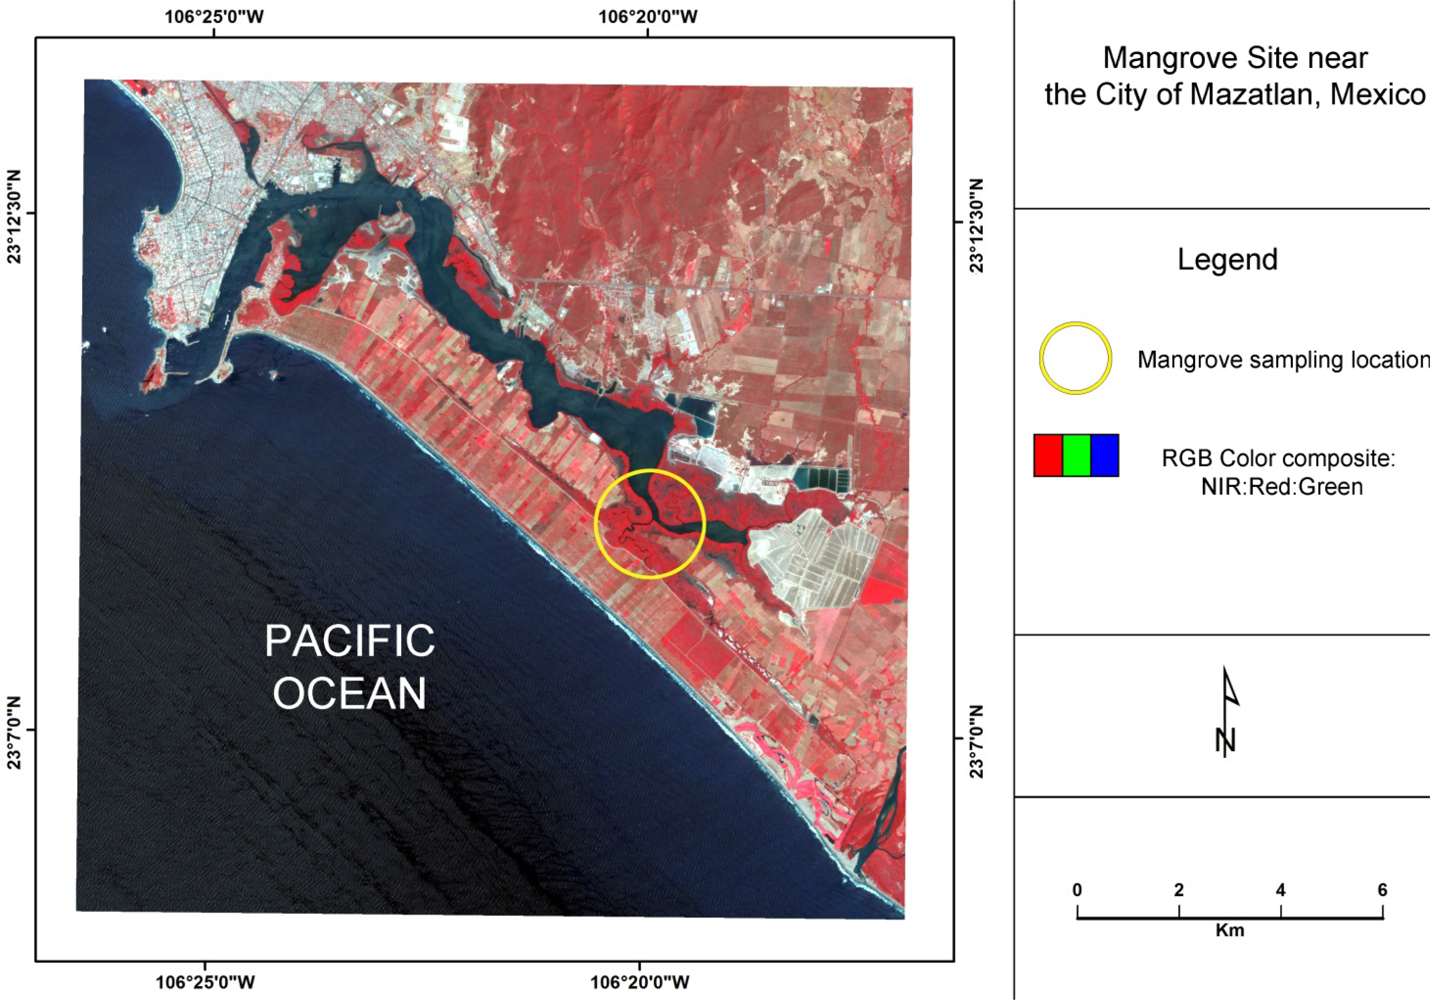
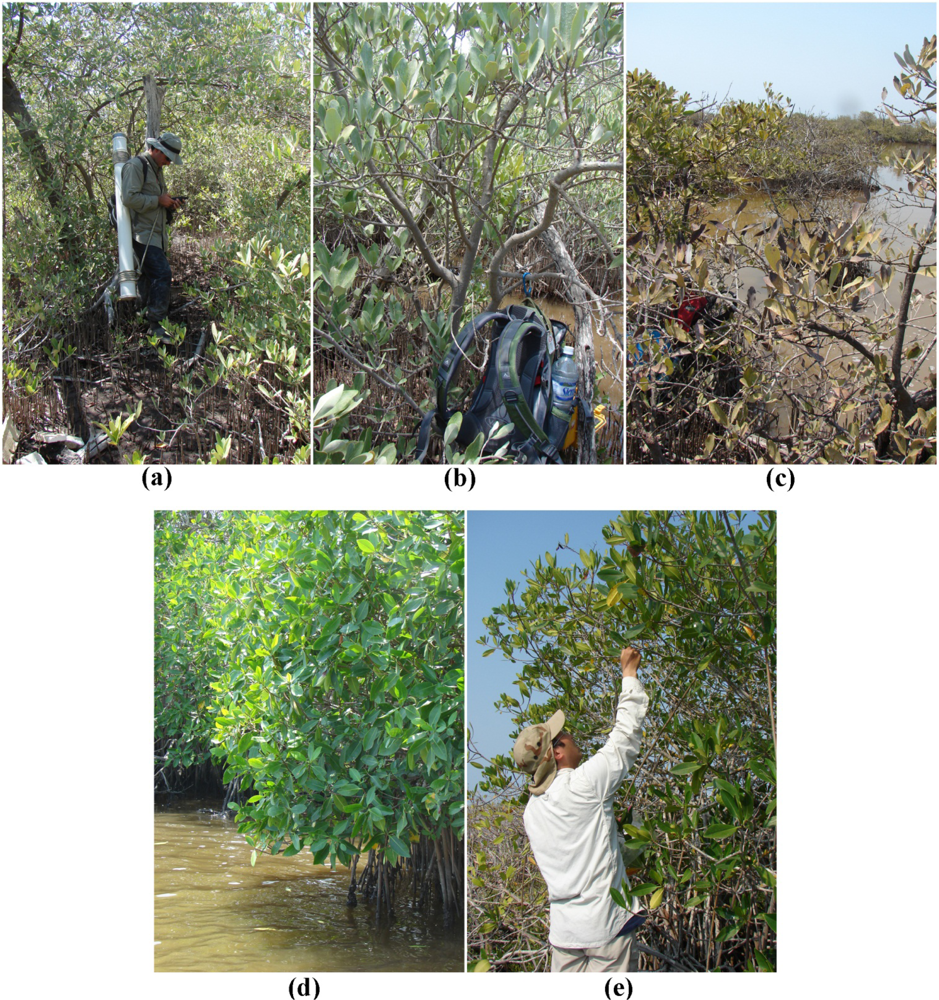
The area of investigation is a mangrove forest located directly south of the city of Mazatlan, Mexico, (Figure 1) that is characterized by a sub-tropical savanna climate with distinct dry and rainy seasons. Within this lagoon mangrove complex, the black mangrove dominates. Based on their height, leaf color, Leaf Area Index, and distance to water, mangroves in this system can be classified according to three conditions: tall healthy, dwarf healthy, and poor condition (Figure 2) [28]. The tall healthy black mangroves are found immediately inland along a very thin fringe of mixed mangrove that consists primarily of healthy red mangrove and some white mangrove (Laguncularia racemosa). Located further inland from the fringe, dwarf black mangroves are commonly found. These trees are generally 1.5–2 m in height with green leaves, but often lacking a main stem. In other areas, highly stressed poor condition red mangroves can be located further inland from the lagoons and tidal channels. Many of the leaves of these trees are yellowish in color, which is indicative of a highly stressed condition. The frequency of tidal inundation for these areas may have decreased, and therefore changes of hydro-edaphic conditions may have contributed to the observed degradation [12].
3. Methods
3.1. Field Data Collection
Field work was conducted in mid-December 2008. Leaves from red and black mangroves of various conditions were collected from the top canopy branches with the aid of a hook device. For healthy tall black and red mangroves, leaves were collected along the water’s edge using the hook device operated from a boat. In total, 90 samples for black mangrove and 60 samples for red mangrove were collected, resulting in thirty samples for each condition. The collected leaves were placed into plastic bags and stored in a cooler at 4 °C prior to analysis of reflectance, conducted on the same day.
3.2. Spectral Measurements, Leaf Measurements and Leaf N Concentration
An indoor black house lab was set up to measure the leaf spectral responses. The leaf reflectance was measured using an ASD FieldSpec® 3 JR spectroradiometer (Analytical Spectral Devices, Inc., Boulder, CO, USA), whose measurement range is 350–2,500 nm. The spectral resolution is 3 nm from 350 to 1,000 nm and 30 nm from 1,000 to 2,500 nm. A 50 W halogen light source with an incident angle of 80° was used for the indoor measurements. Two layers of mangrove leaves were stacked face-up on a matte black 25 cm diameter plate. A 25° viewing angle sensor was mounted directly above the plate at a distance of 30 cm. A white reference (spectralon) was then used to calibrate the measurements at 5-min intervals. For each measurement, the recorded numbers were based on an average of 15 spectral measurements. In addition, to minimize impacts from variations in leaf N concentration, a measurement was made after the plate was rotated roughly 90°, resulting in a total of four measurements for each sample [29]. The final spectral reflectance data (R) for each sample was based on the average of these four measurements.
Each leaf was then measured individually with a Li-Cor LI-3000C Portable Area Meter. The leaves were dried in an oven at 70 °C for 72 h, weighed, and then ground. One gram of dry leaf from each sample was then used to determine leaf N concentration following a standard micro-Kjeldahl procedure [30].
3.3. Statistical Analysis
A one-way ANOVA was used to test the differences in leaf traits and N concentration for the various mangrove samples [31]. The ANNs were trained to determine nonlinear relationships between spectra and various transformations of these spectra, using reflectance values from 17 wavebands corresponding to known N absorption features. These wavebands included 640, 660, 910, 1,020, 1,510, 1,645, 1,980, 2,060, 2,130, 2,140, 2,150, 2,160, 2,170, 2,180 (the last six wavebands represent an absorption feature within wavelength 2130–2180), 2,240, 2,300, and 2,350 nm [32,33]. Stepwise multiple linear regression (SMLR) and ANNs were employed to estimate leaf N concentration in red and black mangroves. Prior to their input into the ANNs and into the SMLR, various transformations were made on these data. Such transformations are commonplace to improve algorithm and network performance [6]. The specific transformations included in this study are: (1) continuum removal, (2) log transformation of continuum-removed data, (3) band depth normalized to the centre of the absorption feature (BNC) [6], and (4) a log transformation of the BNC. Different networks were then constructed using one hidden layer consisting of 10, 15, and 20 neurons with the single output neuron represented the N concentration.
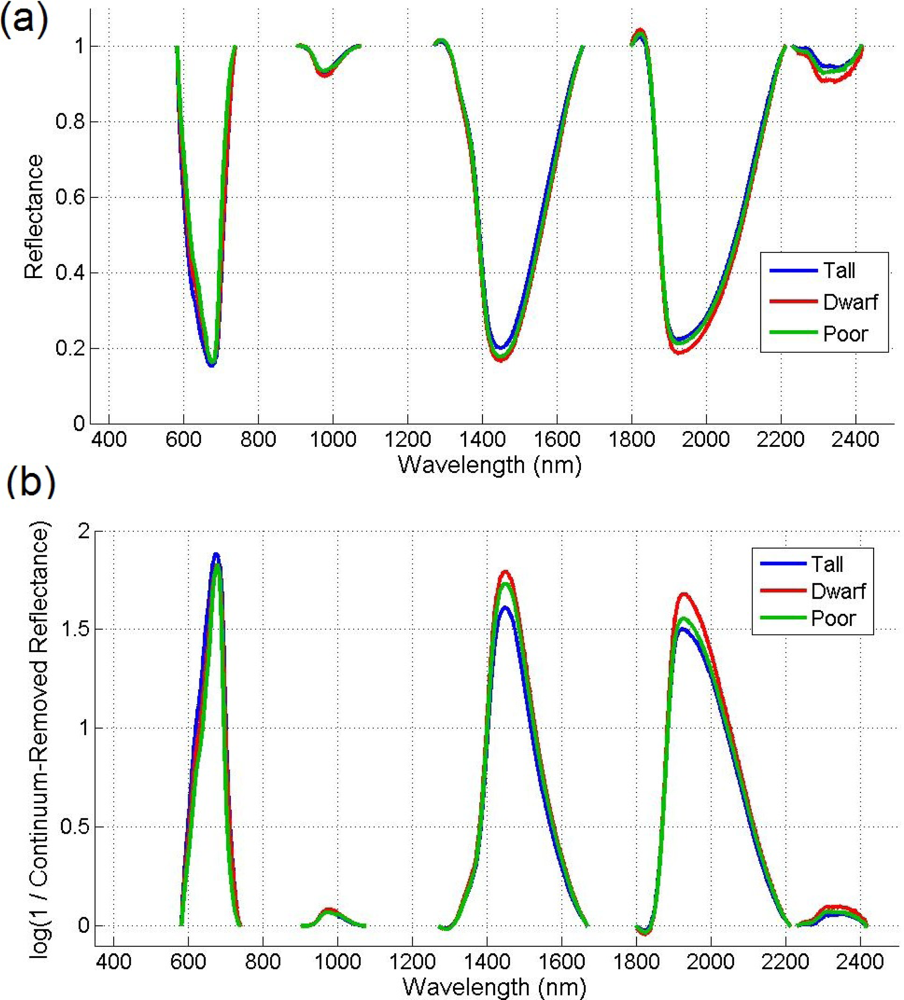
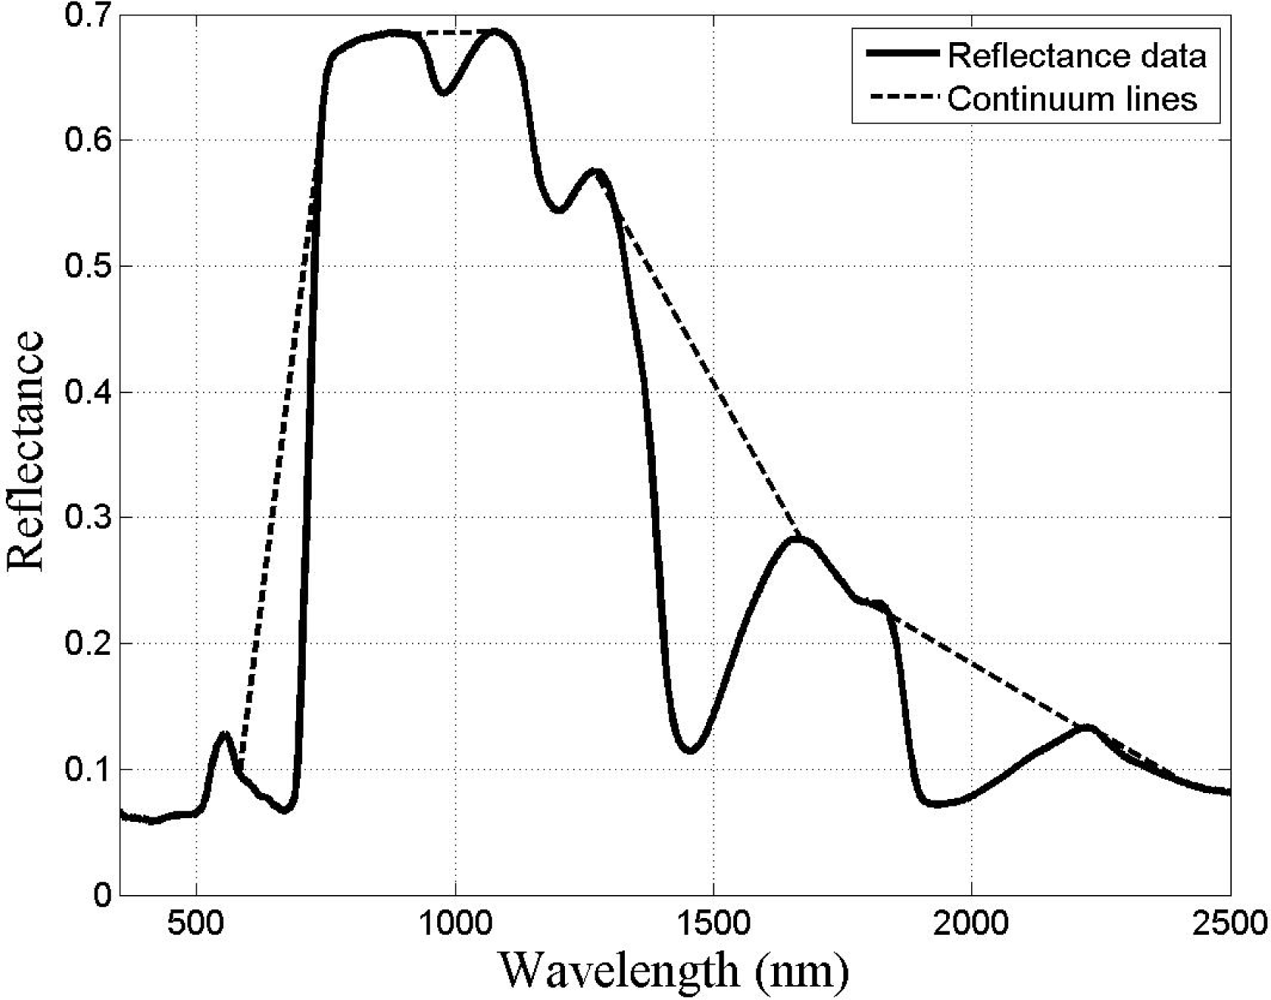
Given that there are reflectance differences influenced by N absorption, continuum removal analysis, one of the most common methods for measuring depths of N absorption, is generally applied prior to statistical analysis. The purpose of this technique is to remove the effects of absorption not caused by the waveband of interest [23]. For this transformation, the equation of a line segment connecting the reflectance values of the lowest and highest bands in a waveband range of interest R is computed (see Figure 3). Wavebands are typically chosen on the basis of known nitrogen absorption features. The different continuum-removed spectra are calculated for each waveband in each range of interest (see Figure 4). Based on the literature [6] as well as on empirical investigation, the selected wavebands were 583–740 nm, 904–1,076 nm, 1,270–1,669 nm, 1,798–2,211 nm, and 2,230–2,415 nm. The continuum-removed spectrum C is given as C = R/Ri where Ri represents the reflectance of the continuum line and where the endpoints of C have values of 1. Various transformations of C were examined. Pseudo-absorption, a log transformation (Clog = log(1/C)), was first calculated. The spectra were further normalized to either the band depth at the center or the area of the absorption region [21]. A different transformation is required to normalize C to the band depth at the centre of the absorption feature. This band depth normalized to centre transformation, or BNC, is given as BNC = (1 − C)/(1 − Rc/Ric), where Rc denotes the reflectance at the absorption feature centre, and Ric is the corresponding reflectance of the continuum line at the feature centre [6]. The feature centre is defined as the minimum value of the continuum-removed spectrum of a waveband range of interest [6]. The log transformation of BNC is given as BNClog = log(1/BNC). The contrast of reflectance is then increased after the log transformation (Figure 4). In addition, the first derivative of reflectance was also calculated based on the difference in pseudo absorption values from two bands with a spectral distance of 4 nm and the range of wavelengths [3,5]. The derivatives were then used to locate the red edge position (REP), which indicates the rapid increase in reflectance from the red to the near infrared region of the spectrum. The position of the red edge was determined by the wavelength corresponding to the largest first derivative value between 680 and 750 nm.
For the ANNs procedure, the 60 red mangrove and the 90 black mangrove samples were randomly divided into groups for the training (36 red, 54 black), validation (12 red, 18 black), and testing (12 red, 18 black) of the models. For consistency, all ANNs used 15 hidden neurons in one hidden layer, which generally provided the best overall results amongst all architectures attempted. The validation step minimizes network overfitting (or overtraining), wherein the network “memorizes” the N concentration given specific input values. The validation samples are not used in the training procedure. However, during training, if the errors in the outputs of the validation inputs increase while training errors decrease, then overfitting is occurring, and thus the training should be terminated. Testing samples are also not employed during network training but rather are used to verify that the network can generalize to recognize new, previously unseen inputs.
4. Results and Discussion
4.1. Mangrove Leaf Size and N concentration
Significant differences in leaf size were observed between the different mangrove species and conditions. Leaves of Rhizophora mangle were generally larger than those of Avicennia germinans (35.17 cm2 vs 16.93 cm2, p < 0.001). Healthy leaves were also generally larger than those of poor condition leaves (46.50 cm2vs. 23.84 cm2 for Rhizophora mangle and 24.42 cm2vs. 14.38 cm2 for Avicennia germinans, p < 0.001). Dwarf mangrove leaves were significantly smaller than any of the other mangrove conditions at a mean size of only 11.74 cm2. The smaller leaves of the dwarf plants indicate a low capacity for water transport and reduced turgor, cell expansion, and growth [34].
Based on the leaf N concentration, mangroves in the study area exhibit large variation (Table 1). Black mangrove leaves had a significantly higher N concentration than red mangrove leaves (1.15% vs. 0.82%, p < 0.001). For each species, significant variation between the sampled conditions was also observed. For black mangrove, the poor condition indicated the highest leaf N concentration, followed by dwarf black and tall black. For the red mangrove, healthy trees recorded higher leaf N concentrations than for the poor condition trees. Although these two recorded observations based on the two mangrove species appear to be contradictory, either of the observed trends could be validated based on previous literature (e.g., [10,12,14]). For example, leaf N concentrations of Rhizophora mangle in Belize were found increased along a gradient from fringe, transitional, to dwarf mangrove [10], whereas N concentrations of tall Rhizophora mangle in south Florida were reported significantly higher than that of dwarf for the same species [13]. Naidoo [12] reported that for Avicennia marina N concentrations were 20% higher in the dwarf mangrove than in the fringe mangrove (2.3% vs. 1.7%). A decline in leaf N (range of 0.787%–1.4%) was also recently observed from the fringe to the interior for a Campnosperma panamense wetland [35]. A lower leaf N concentration was also found for an area with high salinity [36].
These observed variations can be attributed to a variety of causes. Salinity is one of the most important factors controlling the local distributions of mangrove ecosystems [11,37,38], and consequently is one of the primary reasons that N concentrations vary within these forests [14]. Mangroves evolved in a setting where the rates of photosynthesis and growth are restricted by the capacity to maintain a favorable water balance with minimum salt uptake [39]. Lugo et al.[14] recently reported that N concentration is related positively to salinity for a variety of mangrove species. Variations in N concentration may also be explained by leaf senescence. Finally, nutrient limitations are also quite common in mangrove environments [10,12,13,39–41]. Nutrient concentrations in mangrove tissues result from long-term adaptations to nutrient availability in the surrounding environment. Consequently, local conditions could greatly affect the variation of N concentration, and more information is needed regarding the soil type and content as well as the local hydrological regime in order to explain such seemingly contradictory observations.
4.2. Mangrove Spectral Properties
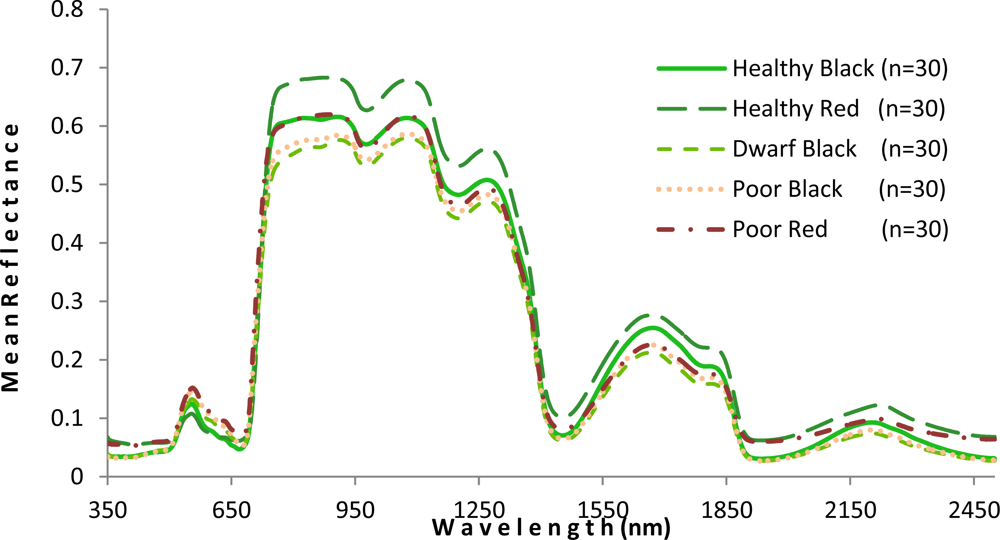
As shown in Figure 5, the mangrove leaves of the forest studied depict the typical vegetation curve with high reflectance in the near-infrared (NIR) and low reflectance in the visible and short wavelength infrared regions. However, there is considerable difference between the two mangrove species with respect to spectral reflectance, particularly in the NIR region. Compared with the healthy black mangrove, the healthy red mangrove has a much higher reflectance in the NIR and the short wavelength infrared bands, and a lower spectral reflectance in the visible region. Although the curves for healthy black and poor red are similar in the NIR region, higher reflectance (p < 0.001) in the visual light region indicates a yellowish leaf color for poor red. Moreover, the physiological condition also appears to influence the spectral response. In particular, the poor condition mangrove has lower reflectance in the NIR and a higher reflectance in the visible and short wavelength infrared regions. The higher reflectance in the visible region would explain the yellowish leaf color observed for the degraded mangroves.
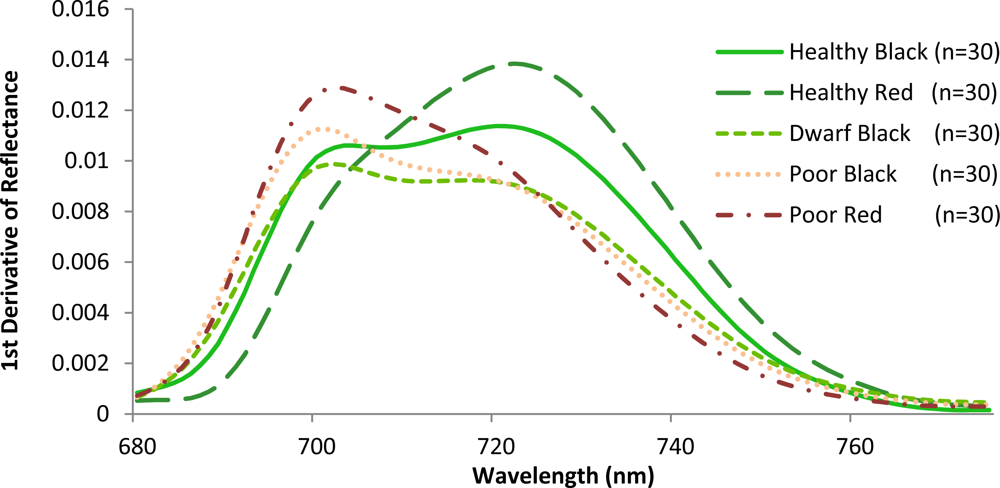
Variations amongst the various mangrove types were also observed when the slopes in the red and the red edge position were calculated (Figure 6). The red edge position is known to be related to chlorophyll absorption [42], and is therefore closely related to N concentration. The red edge often shifts with vegetation conditions such as stress and aging. A strong correlation between red edge position and N concentration was recently reported at the canopy level for various grass species [43]. In this investigation, healthy red has a steep slope with a peak near 724 nm. This corresponds to the sharp change of the spectral curve from concave to convex. For the healthy black, the peak was also close to 724 nm. However, these mangroves exhibit a gradually increasing plateau. Poor condition mangroves have a peak around 703 nm with steep slopes to the right of the peak. In contrast to the poor condition, dwarf black appears less stressed, exhibiting a more gradual decreasing plateau. These results are identical to what other investigators have observed for other plant types. Specifically, that low leaf chlorophyll concentration (and therefore, N concentration) is associated with REP values near 700 nm, while high chlorophyll concentration in combination with leaf internal scattering influence REP values near 725 nm [44,45]. Consequently, the results of this study confirm that the location of the peaks varies with the amount of chlorophyll or N contained in the plant material [42].
4.3. N Concentration and Wavebands
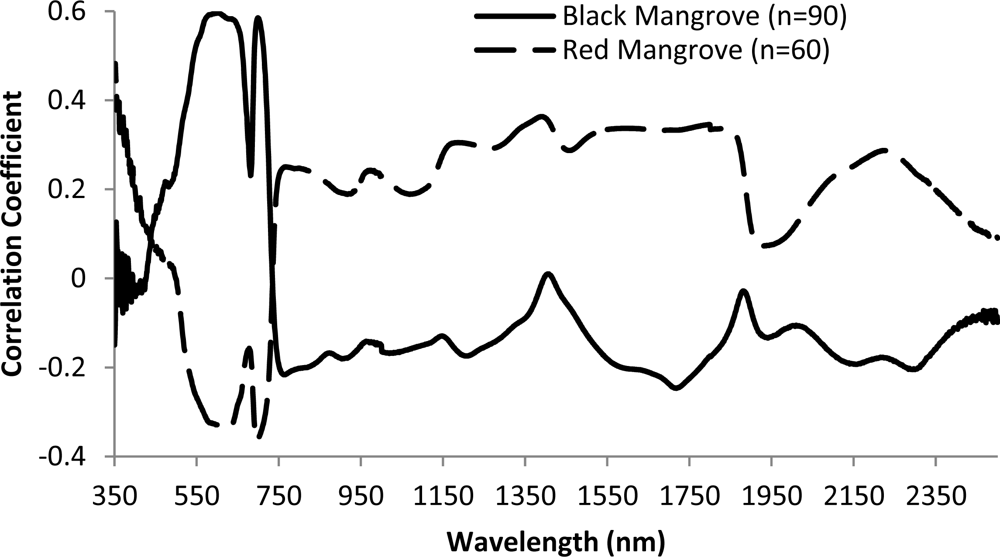
Overall, there is low correlation between reflectance/pseudo absorption and N concentration for single waveband (Figure 7). Moderate correlations were observed for wavebands in the green, red and red edge regions. Specifically, the largest correlation coefficient is −0.60 for black mangrove at waveband 599 nm (p < 0.001). This observation agrees with previous studies (e.g., [6]). Consequently, multiple wavebands are required to explore the relationships between N concentration and spectral responses. The relationships between spectral responses and N concentration are different for black and red mangroves, especially for visual light and red edge wavelength regions. There are positive correlations between reflectance and N concentration in the green light portion for black mangrove, and negative correlation for red mangrove.
4.4. Predicting N Concentration Using Spectral Responses
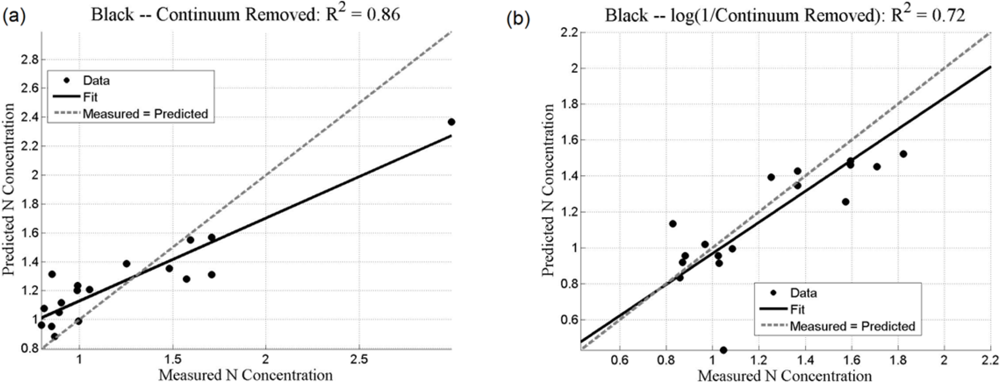
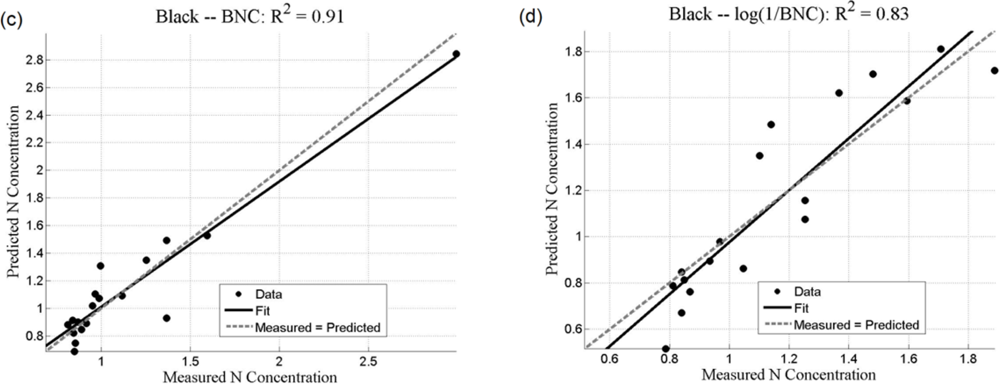
Both the SMLR and the ANNs could be used to predict N concentration, as quantified by the r2 values (coefficient of determination), which measures how well future outcomes will be predicted by a model (Table 2). The SMLR model was robust, as regressions were all significant at α = 0.05, with all p-values less than 0.001 (for instance, for black mangroves, the significance for continuum removal (C) is p = 5.71 × 10⁻¹⁰; for log(1/BNC) for red mangroves, p = 1.23 × 10⁻¹²). In this case, r2 measures the match between observed N concentrations and those predicted by the model. The r2 values are generally higher than 0.7 for the analyses using the BNC and the log(1/BNC) (Table 2). However, there are consistently larger r2 values calculated for the testing ANN results than for the SMLR. Training r2 values for the ANNs were consistently close to 1.0, and therefore are not shown in Table 2. ANN performance, indicated by r2 values obtained after training with CR, log(1/CR), BNC, and log(1/BNC) are shown for red and black mangroves in Figures 8 and 9, respectively. These figures show how well predictions (data points) obtained from the ANNs correspond to the measured values.
For SMLR, BNC and log(1/BNC) resulted in better linear models for both black and red mangroves with a relatively small number of wavebands (between 6 and 10). The BNC transformation generally also yielded the best results for the ANNs (Figures 8 and 9). Although the high N concentration point seen in Figure 9(a,c) may appear to affect the r2 value, removal of this single point does not substantially affect the overall fit. Additionally, because this N concentration value was measured, it was included in the analysis. The log transformation reduces the effect of such points. BNC transformations were also found to improve the predictive capabilities of ANNs in another study [6]. For both SMLR and ANNs, the models for black mangrove N concentration had higher r2 values than for red mangroves (see Figure 9).
Transformations of the continuum-removed reflectance of waveband ranges of interest, particularly BNC and log(1/BNC), yield r2 values greater than 0.7 for SMLR. This observation, along with the relatively good results for C and log(1/C), especially for red mangrove leaves, suggest a degree of nonlinearity between leaf reflectance and N concentration that is better modeled with the nonlinear ANN approach.
Although the results were favourable, they should be approached with caution. Validation r2 values are consistently under 0.5 for most predictions, indicating that overfitting is a potential problem. A thorough statistical analysis of network weights should be undertaken to assess the relative importance of the wavebands selected as inputs [46]. Furthermore, feature selection techniques may indicate inputs to maximize network performance [24,47], but nonetheless may not select biochemically meaningful features. Consequently, the approach taken in this study, selecting a relatively large number of inputs corresponding to known N absorption features, steers a middle course between maximizing network performance and producing a model that can be better explained in biochemical terms.
5. Conclusions
Environmental monitoring is becoming increasingly important due to observed global and local climactic changes, as well as to the impact of environmental factors on communities, particularly those in areas with fragile ecosystems that are more likely to be affected by climactic factors. Consequently, the value of predictive models correspondingly increases. Assessing the health of mangroves and mangrove forests provides vital information about the habitat of tropical coastal wetland areas. In this study, predictions of leaf N concentration, one of the indicators of wetland health, based on spectral data collected from a degraded system were found to be a potentially important alternative approach for monitoring the condition of these important coastal wetlands. This is especially true given the range of conditions examined for two of the most common species of mangroves found in the Americas and Western Africa.
In this investigation, significant differences were found between the spectral responses of the red and black mangroves, especially in the NIR region. Chemically, black mangrove leaves were also found to have a significantly higher N concentration than the red mangrove leaves (1.15% vs. 0.82%). When comparing individual wavebands to N concentrations, only weak to moderate correlations (−0.6–0.6) were found for these mangrove species. Continuum removed reflectance and other transformations of multiple wavebands were utilized to predict N concentration using an Artificial Neural Network (ANN) and a stepwise multiple linear regression (SMLR) model. Although the SMLR model was robust with low p-values (all < 0.001), the testing results indicated that the predictions from the ANN were consistently better than those from the SMLR on the basis of r2 values. Correlation coefficients between measured and predicted N concentration using ANN were generally higher than 0.82. Consequently, the results presented here suggest the efficacy of such an ANN approach in constructing a predictive model of nitrogen concentration based on leaf reflectance, as indicated by good agreement (coefficient of determination values) between observed N concentration and that predicted by the ANN model. However, as ANNs are highly nonlinear and therefore may be susceptible to unpredictable behaviour in the presence of outlier input, it must be emphasized that they do not replace standard statistical and biochemical approaches, but should be used in a complementary fashion to enhance the quality of information concerning mangrove condition.
It is recommended that future work include an analysis of network weights to determine N concentration for other mangrove species as well as the potential influence of other nutrient concentrations (e.g., P and K) upon mangrove growth and spectral response. In addition, it is suggested that further exploration of more advanced ANN paradigms (e.g., different methods of training, intra-training validation, a more rigorous approach to determining the number of hidden units and layers, etc.), as well as research into hybrid statistical-computational intelligence techniques be considered to improve predictive power. Finally, it is suggested that further experiments be conducted using satellite-borne or air-borne hyperspectral data in conjunction with field N concentration data to test the capability of ANN in mapping mangrove N concentration.
Acknowledgments
This research was supported by grants awarded to John M. Kovacs from the Natural Sciences and Engineering Research Council of Canada (grant #249496) and to Mark P. Wachowiak from the Natural Sciences and Engineering Research Council of Canada (grant #386586-2011). M. P. Wachowiak also acknowledges support from SHARCNET. Special thanks are given to Francisco Flores-de-Santiago for his assistance in the field data collection.
References
- Pan, Y.; Hom, J.; Kenkins, J.; Birdsey, R. Importance of foliar nitrogen concentration to predict forest productivity in the mid-Atlantic region. Forest Sci 2004, 50, 279–289. [Google Scholar]
- Grossman, Y.L.; Ustin, S.L.; Jacquemoud, S.; Sanderson, E.W.; Schmuck, G.; Verdebout, J. Critique of stepwise multiple linear regression for the extraction of leaf biochemistry information from leaf reflectance data. Remote Sens. Environ 1996, 56, 182–193. [Google Scholar]
- Johnson, L.F.; Billow, C.R. Spectrometric estimation of total nitrogen concentration in Douglas fir foliage. Int. J. Remote Sens 1996, 17, 489–500. [Google Scholar]
- Kokaly, R.F.; Clark, R.N. Spectroscopic determination of leaf biochemistry using band-depth analysis of absorption features and stepwise multiple linear regression. Remote Sens. Environ 1999, 67, 267–287. [Google Scholar]
- Dury, S.J.; Turner, B.J. Nutrient Estimation of Eucalypt Foliage Derived from Hyperspectral Data. Proceeding of 2001 IEEE International Geoscience and Remote Sensing Symposium (IGARSS '01), Sydney, NSW, Australia, 9– 13 July 2001; 2, pp. 774–776.
- Huang, Z.; Turner, B.J.; Dury, S.J.; Wallis, I.R.; Foley, W.J. Estimating foliage nitrogen concentration from HYMAP data using continuum removal analysis. Remote Sens. Environ 2004, 93, 18–29. [Google Scholar]
- Wang, Y.; Huang, J.F.; Wang, X.Z.; Wang, F.M.; Liu, Z.Y. Validation of artificial neural network techniques for the rape nitrogen concentration estimation using canopy hyperspectral reflectance data. Int. J. Remote Sens 2009, 30, 4493–4505. [Google Scholar]
- Martin, M.E.; Aber, J.D. High spectral resolution remote sensing of forest canopy lignin, and ecosystem process. Ecol. Appl 1997, 7, 431–443. [Google Scholar]
- Walters, B.B.; Ronnback, P.; Kovacs, J.M.; Crona, B.; Hussain, S.A.; Badola, R.; Primavera, J.H.; Barbier, E.; Dahdouh-Guebas, F. Ethnobiology, socio-economics and management of mangrove forests: A review. Aquat. Bot 2008, 89, 220–236. [Google Scholar]
- Feller, I.C.; McKee, K.L.; Whigham, D.F.; O’Neill, D.F. Nitrogen vs. phosphorus limitation across an ecotonal gradient in a mangrove forest. Biogeochemistry 2002, 62, 145–175. [Google Scholar]
- Davis, S.E.; Childers, D.L.; Day, J.W.; Rudnick, D.T.; Sklar, F.H. Factors affecting the concentration and flux of materials in two southern Everglades mangrove wetlands. Marine Ecol. Prog. Ser 2003, 253, 85–96. [Google Scholar]
- Naidoo, G. Factors contributing to dwarfing in the mangrove Avicennia marina. Ann. Bot 2006, 97, 1095–1101. [Google Scholar]
- Lin, Y.; Sternberg, L.S.L. Nitrogen and phosphorus dynamics and nutrient resorption of Rhizophora Mangle leaves in South Florida, USA. Bull. Mar. Sci 2007, 80, 159–169. [Google Scholar]
- Lugo, A.E.; Medina, E.; Cuevas, E.; Cintron, G.; Nieves, E.N.L.; Novelli, Y.S. Ecophysiology of a mangrove forest in Jobos Bay, Puerto Rico. Caribb. J. Sci 2007, 43, 200–219. [Google Scholar]
- Zhang, C.; Liu, Y.; Kovacs, J.M.; Flores-Verdugo, F.; Flores-Santiago, F.; Chen, K. Spectral response to varying levels of leaf pigments collected from a degraded mangrove forest. J. Appl. Remote Sens 2012, 6, 1–14. [Google Scholar]
- Axelsson, C.; Skidmore, A.K.; Schlerf, M.; Fauzi, A.; Verhoef, W. Hyperspectral analysis of mangrove foliar chemistry using PLSR and support vector regression. Int. J. Remote Sens 2013, 34, 1724–1743. [Google Scholar]
- Fauzi, A.; Schlerf, M.; Skidmore, A.; van Gils, H.; Heitkonig, I.M. Hyperspectral Indices for Retrieval of Chlorophyll and Nitrogen in Mangroves Using SLC and HYMAP. Proceedings of American Geophysical Union, Fall Meeting 2011, San Francisco, CA, USA, 5–9 December 2011.
- Xue, L.; Cao, W.; Luo, W.; Dai, T.; Zhu, Y. Monitoring leaf nitrogen status in rice with canopy spectral reflectance. Agron. J 2004, 96, 135–142. [Google Scholar]
- Perry, E.M.; Roberts, D.A. Sensitivity of narrow-band and broad-band indices for assessing nitrogen availability and water stress in an annual crop. Agron. J 2008, 100, 1211–1219. [Google Scholar]
- Luther, J.E.; Carroll, A.L. Development of an index of balsam fir vigor by foliar spectral reflectance—A measure of tree vigor. Remote Sens. Environ 1999, 69, 241–252. [Google Scholar]
- Curran, P.J.; Dungan, J.L.; Peterson, D.L. Estimating the foliar biochemical concentration of leaves with reflectance spectrometry. Remote Sens. Environ 2001, 76, 349–359. [Google Scholar]
- Zhao, D.; Reddy, K.R.; Kakani, V.G.; Read, J.J.; Carter, G.A. Corn (Zea mays L.) growth, leaf pigment concentration, photosynthesis and leaf hyperspectral reflectance properties as affected by nitrogen supply. Plant Soil 2005, 257, 205–217. [Google Scholar]
- Kokaly, R.F. Investigating a physical basis for spectroscopic estimates of leaf nitrogen concentration. Remote Sens. Environ 2001, 75, 153–161. [Google Scholar]
- Mutanga, O.; Skidmore, A.K. Integrating imaging spectroscopy and neural networks to map grass quality in the Kruger National Park, South Africa. Remote Sens. Environ 2004, 90, 104–115. [Google Scholar]
- Hansen, P.M.; Schjoerring, J.K. Reflectance measurement of canopy biomass and nitrogen status in wheat crops using normalized difference vegetation indices and partial least squares regression. Remote Sens. Environ 2003, 86, 542–553. [Google Scholar]
- Nguyen, H.T.; Lee, B. Assessment of rice leaf growth and nitrogen status by hyperspectral canopy reflectance and partial least square regression. Eur. J. Agron 2006, 24, 349–356. [Google Scholar]
- Boyd, D.S.; Foody, G.M.; Ripple, W.J. Evaluation of approaches for forest cover estimation in the Pacific Northwest, USA, using remote sensing. Appl. Geogr 2002, 22, 375–392. [Google Scholar]
- Kovacs, J.M.; Zhang, C.; Flores-Verdugo, F. Mapping the condition of mangroves of the Mexican Pacific using C-band ENVISAT ASAR and Landsat optical data. Cienc. Mar 2006, 34, 407–418. [Google Scholar]
- Vaiphasa, C.; Ongsomwang, C.; Vaiphasa, T.; Skidmore, A.K. Tropical mangrove species discrimination using hyperspectral data: A laboratory study. Estuar. Coast. Shelf Sci 2005, 65, 371–379. [Google Scholar]
- Nelson, D.W.; Sommers, L.E. A simple digestion procedure for estimation of total nitrogen in soil and sediments. J. Environ. Qual 1972, 1, 423–425. [Google Scholar]
- Mutanga, O.; Skidmore, A.K.; Wieren, S. Discriminating tropical grass (Cenchrus ciliaris) canopies grown under different nitrogen treatments using spectroradiometry. ISPRS J. Photogramm 2003, 57, 263–272. [Google Scholar]
- Murray, J.; Williams, P.C. Chemical Principles of Near-Infrared Technology. In Near Infrared Technology: In the Agricultural and Food Industries, 2nd ed.; Williams, P.C., Norris, K., Eds.; American Association of Cereal Chemists, Inc.: St. Paul, MN, USA, 1987; pp. 17–37. [Google Scholar]
- Curran, P.J. Remote sensing of foliar chemistry. Remote Sens. Environ 1989, 30, 271–278. [Google Scholar]
- Hiralal, O.; Naidoo, G.; Naidoo, Y. Hypersalinity induces ultrastructural damage in leaves of Avicennia marina. Microsc. Soc. South. Af. Proc 2003, 33, 66. [Google Scholar]
- Troxler, T.G. Patterns of phosphorus, nitrogen and δ15N along a peat development gradient in a coastal mire, Panama. J. Trop. Ecol 2007, 23, 683–691. [Google Scholar]
- Suàrez, N. Leaf construction cost in Avicennia germinans as affected by salinity under field conditions. Biol. Plantarum 2005, 49, 111–116. [Google Scholar]
- McMillan, C.; Sherrod, C.L. The chilling tolerance of black mangrove, Avicennia germainans, from the Gulf of Mexico Coast of Texas, Louisiana and Florida. Mar. Sci 1986, 29, 9–16. [Google Scholar]
- Duke, N.C. Mangrove Floristics and Biogeography. In Tropical Mangrove Ecosystems; Robertson, A.I., Alongi, D.M., Eds.; American Geophysical Union: Washington, DC, USA, 1992; pp. 63–100. [Google Scholar]
- Lovelock, C.E.; Feller, I.C.; Ball, M.C.; Engelbrecht, B.M.J.; Ewe, J.L. Differences in Plant Function in Phosphorus- and Nitrogen-Limited Mangrove Ecosystems. New Phytol 2006, 172, 514–522. [Google Scholar]
- McKee, K.L.; Feller, I.C.; Popp, M.; Wanek, W. Mangrove isotopic ((δ 15N and δ 13C) fractition across a nitrogen vs. phosphorus limitation gradient. Ecology 2002, 84, 1065–1075. [Google Scholar]
- Naidoo, G. Differential effects of nitrogen and phosphorus enrichment on growth of dwarf Avicennia marina mangroves. Aqua. Bot 2009, 90, 184–190. [Google Scholar]
- Horler, D.N.H.; Dockray, M.; Barber, J. The red edge of plant leaf reflectance. Int. J. Remote Sens 1983, 4, 273–288. [Google Scholar]
- Mutanga, O.; Skidmore, A.K. Red edge shift and biochemical content in grass canopies. ISPRS J. Photogramm 2007, 62, 34–42. [Google Scholar]
- Horler, D.N.H.; Barber, J.; Barringer, A.R. Effects of heavy metals on the absorbance and reflectance spectra of plants. Int. J. Remote Sens 1980, 1, 121–136. [Google Scholar]
- Lamb, D.W.; Steyn-Ross, M.; Schaare, P.; Hanna, M.M.; Silvester, W.; Steyn-Ross, A. Estimating leaf nitrogen concentration in ryegrass (Lolium spp.) pasture using the chlorophyll red-edge: Theoretical modeling and experimental observations. Int. J. Remote Sens 2002, 23, 3619–3648. [Google Scholar]
- Garson, G.D. Interpreting neural-network connection weights. AI Expert 1991, 6, 46–51. [Google Scholar]
- Kavzoglu, T.; Mather, P.M. The role of feature section in artificial neural network applications. Int. J. Remote. Sens 2002, 23, 2919–2937. [Google Scholar]


| N (%) | Leaf Area | Leaf Length | Average Width | ||||||
|---|---|---|---|---|---|---|---|---|---|
| Species | Sample Size | Mean ± Standard Error | Range | Mean ± Standard Error | Range | Mean ± Standard Error | Range | Mean ± Standard Error | Range |
| Rhizophora mangle | 60 | 0.82 ± 0.04 | 1.51 | 35.17 ± 1.7 | 51.43 | 13.60 ± 0.29 | 9.74 | 2.42 ± 0.07 | 2.32 |
| Healthy | 30 | 0.96 ± 0.06 | 1.27 | 46.50 ± 1.51 | 35.81 | 15.5 ± 0.24 | 6.23 | 2.9 ± 0.07 | 1.59 |
| Poor condition | 30 | 0.69 ± 0.05 | 0.82 | 23.85 ± 0.79 | 23.14 | 11.71 ± 0.20 | 5.47 | 1.94 ± 0.04 | 1.00 |
| Avicennia germinans | 90 | 1.15 ± 0.04 | 2.20 | 16.93 ± 0.67 | 29.53 | 10.57 ± 0.2 | 9.43 | 1.52 ± 0.05 | 1.93 |
| Healthy | 30 | 0.86 ± 0.01 | 0.19 | 24.42 ± 0.85 | 19.59 | 11.91 ± 0.44 | 9.43 | 2.03 ± 0.07 | 1.32 |
| Dwarf | 30 | 1.00 ± 0.01 | 0.23 | 11.74 ± 0.30 | 6.45 | 9.56 ± 0.19 | 3.59 | 1.17 ± 0.02 | 0.53 |
| Poor condition | 30 | 1.59 ± 0.07 | 1.85 | 14.38 ± 0.42 | 10.16 | 10.19 ± 0.14 | 2.88 | 1.34 ± 0.03 | 0.62 |
| Species | Treatments | SMLR | ANN | |||
|---|---|---|---|---|---|---|
| r2 | p | # wavebands | r2 (Test) | r2 (Validation) | ||
| Avicennia germinans | C | 0.355 | <0.001 | 1 | 0.861 | 0.113 |
| log(1/C) | 0.331 | <0.001 | 1 | 0.715 | 0.483 | |
| BNC | 0.750 | <0.001 | 10 | 0.907 | 0.416 | |
| log(1/BNC) | 0.757 | <0.001 | 10 | 0.830 | 0.455 | |
| Rhizophora mangle | C | 0.453 | <0.001 | 4 | 0.443 | 0.414 |
| log(1/C) | 0.322 | <0.001 | 4 | 0.822 | 0.453 | |
| BNC | 0.733 | <0.001 | 7 | 0.870 | 0.444 | |
| log(1/BNC) | 0.709 | <0.001 | 6 | 0.773 | 0.628 | |
Share and Cite
Zhang, C.; Kovacs, J.M.; Wachowiak, M.P.; Flores-Verdugo, F. Relationship between Hyperspectral Measurements and Mangrove Leaf Nitrogen Concentrations. Remote Sens. 2013, 5, 891-908. https://doi.org/10.3390/rs5020891
Zhang C, Kovacs JM, Wachowiak MP, Flores-Verdugo F. Relationship between Hyperspectral Measurements and Mangrove Leaf Nitrogen Concentrations. Remote Sensing. 2013; 5(2):891-908. https://doi.org/10.3390/rs5020891
Chicago/Turabian StyleZhang, Chunhua, John M. Kovacs, Mark P. Wachowiak, and Francisco Flores-Verdugo. 2013. "Relationship between Hyperspectral Measurements and Mangrove Leaf Nitrogen Concentrations" Remote Sensing 5, no. 2: 891-908. https://doi.org/10.3390/rs5020891