Article

Earth Observation Based Assessment of the Water Production and Water Consumption of Nile Basin Agro-Ecosystems

1
International Water Management Institute (IWMI), Colombo, Sri Lanka and Vientiane, Laos
2
UNESCO-IHE, 2611 AX Delft, The Netherlands
3
Delft University of Technology, 2628 CN Delft, The Netherlands
4
Earth Resources Observation and Science (EROS) Center, U.S. Geological Survey, Sioux Falls, SD 57198, USA
*
Author to whom correspondence should be addressed.
Remote Sens. 2014, 6(11), 10306-10334; https://doi.org/10.3390/rs61110306
Submission received: 16 April 2014 / Revised: 17 September 2014 / Accepted: 18 October 2014 / Published: 24 October 2014
(This article belongs to the Special Issue Earth Observation for Water Resource Management in Africa)

Abstract

:
The increasing competition for water resources requires a better understanding of flows, fluxes, stocks, and the services and benefits related to water consumption. This paper explains how public domain Earth Observation data based on Moderate Resolution Imaging Spectroradiometer (MODIS), Second Generation Meteosat (MSG), Tropical Rainfall Measurement Mission (TRMM) and various altimeter measurements can be used to estimate net water production (rainfall (P) > evapotranspiration (ET)) and net water consumption (ET > P) of Nile Basin agro-ecosystems. Rainfall data from TRMM and the Famine Early Warning System Network (FEWS-NET) RainFall Estimates (RFE) products were used in conjunction with actual evapotranspiration from the Operational Simplified Surface Energy Balance (SSEBop) and ETLook models. Water flows laterally between net water production and net water consumption areas as a result of runoff and withdrawals. This lateral flow between the 15 sub-basins of the Nile was estimated, and partitioned into stream flow and non-stream flow using the discharge data. A series of essential water metrics necessary for successful integrated water management are explained and computed. Net water withdrawal estimates (natural and humanly instigated) were assumed to be the difference between net rainfall (Pnet) and actual evapotranspiration (ET) and some first estimates of withdrawals—without flow meters—are provided. Groundwater-dependent ecosystems withdraw large volumes of groundwater, which exceed water withdrawals for the irrigation sector. There is a strong need for the development of more open-access Earth Observation databases, especially for information related to actual ET. The fluxes, flows and storage changes presented form the basis for a global framework to describe monthly and annual water accounts in ungauged river basins.

Graphical Abstract

1. Introduction

Water is becoming an increasingly scarce resource worldwide as a result of economic and demographic development pressures. While agriculture is generally assumed to be the largest consumer of water in Africa and Asia, future increases in food production will be critical to ensure human wellbeing in both these regions and globally. Projections indicate that producing enough food to meet the demands of a global population of 9.1 billion people by 2050 require levels of food production in 2007 to be increased by approximately 60%, and doubled in sub-Saharan Africa and parts of South and East Asia ([1,2]). In order to achieve this level of increase on a sustainable basis, it is critical that new strategies and approaches are employed to increase agricultural productivity, while sustaining ecological systems and the services they provide.
Water scarcity, defined as of the threat to people’s livelihoods due to lack of access to safe and affordable water for drinking, sanitation, and food production (Rijsberman, [3]), is increasing in many regions along with salinization and pollution of rivers and water bodies and degradation of water-related ecosystems (FAO, [4]). Mobilizing the necessary water resources to increase food production will require informed decisions within the water sector and in related sectors (Thenkabail et al., [5]; Rebelo et al., [6]). It is estimated that annual agricultural water use will need to increase from approximately 7,100 km3 globally to between 8,500 and 11,000 km3 in order to meet projected food requirements in 2050 (de Fraiture et al., [7]). Projections suggest that over the next several decades the population of people whose livelihoods will be affected by water scarcity will rise to two-thirds of the world population ([8,9,10,11,12]).
In order to effectively manage resources, decision makers require information on how much water is available and how much is being used and consumed for various purposes, as well as an understanding of how water availability will change under future scenarios (e.g., Droogers et al., [13]). Increases in water scarcity are obvious from fast declining groundwater reservoirs, degraded wetlands and terrestrial lands and associated ecosystem services, and increased vulnerability to hazards such as droughts and floods. Most water is consumed through natural evaporative processes, but a portion is also consumed through anthropogenic influences (e.g., actual evapotranspiration from reservoirs, irrigation, aquaculture, domestic use, plantations, greenhouses, etc.). Closed basins occur where the total actual evapotranspiration (ET) has exceeded the gross inflow from rainfall and interbasin transfers. Flows in streams and aquifers could be enhanced by appropriate reductions in ET (e.g., [14]) to meet reserved flows for environmental purposes (e.g., Smakhtin et al., [15]), navigation needs, or reserved flows for downstream commitments. A reduction in consumption means that less water is evaporated or exported in products or flows to sinks. This reduction is also known as a real water saving (Seckler, [16]) because water resources will remain physically in the basin for a longer period of time. Upstream versus downstream water availability is an extremely sensitive issue in trans-boundary river basins such as the Nile River. A reduction in withdrawals leaves more water in rivers, lakes, reservoirs and aquifers, which is beneficial if most of the available water is utilized downstream. If most of the available water is utilizable, then a reduced withdrawal is a lost opportunity to boost local agronomies, industries and environments, provided environmental flow commitments are met (which is basically included in the definition of utilizable flows). Access to data that underpins information for decision making is largely erratic in vast basins such as the Nile. The availability of hydrological data and information related to water management is limited to local agencies. While many attempts are made through, for example, the Nile Basin Initiative (NBI) and the Food and Agricultural Organization of the United Nations FAO-Nile agricultural water management program, it remains a challenge to describe the key hydrological and catchment-scale processes in a geographically and spatially distributed manner. Water management information such as withdrawals, stocks, waste water return flows and groundwater well yields are kept by the individual water use sectors. Most of the classical hydrological research (e.g., Shahin, [17], Sutcliffe and Parks, [18]) is based on rainfall gauges and streamflow measurements, and quantification of the ET process is not given much attention. Actual ET has however a major impact on streamflow, and is paramount for quantifying ecosystem services. A recent overview of several open-access rainfall products was published by Serrat-Capdevilla et al. ([19]).
The objectives of this paper are to demonstrate (i) how Earth observation data from multi-platform satellites can contribute to the generation of an open-access data set that provides insights into the major water flows and fluxes of the Nile River basin and (ii) the need for a sound system of water metrics and the use of a consistent, comprehensive framework, in order to enhance the understanding of river basins by stakeholders who make decisions on the retention, allocation and release of scarce water resources. The volume of renewable water produced by various agro-ecosystems is quantified, and it is demonstrated where, and how much water of the Nile is consumed, all on the basis of Earth observations.

2. Materials and Methods

The River Nile is fed by two main river systems: the White Nile, with its sources in the Equatorial Lake Plateau (Burundi, Rwanda, Tanzania, Kenya, Democratic Republic Congo and Uganda), and the Blue Nile, with its sources in the Ethiopian highlands. The sources are located in humid regions, with an average rainfall of over 1000 mm per year. The arid region starts in Sudan and extends into northern Ethiopia and Egypt. The Nile basin comprises 15 sub-basins (see Figure 1). The network of hydro-meteorological gauging stations in the Nile basin is meager. In situ data are generally not easily accessible. Earth observation measurements have the potential to complement the lack of available and accessible in situ measurements. Earth observation data are available on-line; they are based on true measurements made at particular moments (t) and for a specific geographic location (x,y). By sequencing repetitive measurements, a time series can be created. Flags can be used in the data sets to indicate or identify the quality of data. Data set methods to interpret and convert raw satellite measurements into hydrological variables are described in downloadable manuals, conference proceedings (e.g., Neale and Cosh, [20]) and journal special issues (e.g., Batelaan et al., [21]). Following (Nagesh Kumar and Reshmidevi, [22]; Karimi et al., [23]), it is argued that the remote sensing science has progressed sufficiently to ensure certain levels of accuracy. Many products now claim to have an accuracy better than 90–95 percent.
Figure 1. Location of sub-basins of the Nile River system delineated by the Nile Basin Initiative.
Remotesensing 06 10306 g001
The most important Earth observation data set for hydrology and water management is rainfall. In this case study, the open-access rainfall product from the Tropical Rainfall Measurement Mission (TRMM) version 7-product 3B43 is explored. The Famine Early Warning System Network FEWS-NET Satellite Rainfall Estimate [24], processed and archived by the Famine Early Warning System Network, has been utilized as well. The period of consideration lapses from 2005 to 2010. Only monthly rainfall data sets have been created in this study. The two selected rainfall products were both subjected to first-level calibrations, using rain gauges, by the provisional agencies. The official rain gauges of the Nile basin registered with the World Meteorological Organization (WMO) have been verified, and it seems that most of them have substantial data gaps. These gaps make an independent verification of TRMM and RFE cumbersome, and in the absence of independent verification, it was decided to use the data products as they are. The average values of the two products were computed.
The second largest hydrological flow path is actual ET. While open-access data sets for rainfall have a long heritage and are rapidly increasing, the generation of similar data sets for actual ET is in its infancy. Several leading institutes have started to develop global-scale ET maps; however, they are currently in the process of verifying the maps before opening new ET data portals. Open-access actual ET data sets are currently provided by a few institutes only, and include the Land Satellite Application Facility (LandSAF) under aegis of Eumetsat using the Tiled ECMWF Surface Scheme for Exchange over Land (TESSEL) algorithm (Van den Hurk et al., [25]; Belsamo et al., [26]). The ET data are computed with the Second Generation Meteosat (MSG) data having a spatial resolution of 3 km at the equator and extending to 5 km for European cover. The Global Evaporation Monitoring Amsterdam Model (GLEAM) is published by Mirales et al. ([27]) at a spatial resolution of 17 km, and while these data are not available online, the data were acquired for this study from the authors on request. The standard MODIS 16 ET product (Mu et al., [28]) has an open-access status at 1 km spatial resolution, although the University of Montana requires a form of registration for use of the product. Several ET comparison studies have concluded that MOD16 is not favorable (e.g., Kim et al., [29]; Trambauer et al., [30]). Guerschman et al. [31] from the Commonwealth Scientific and Industrial Research Organisation (CSIRO) and the National University of Australia have developed the global coverage CRMSET model. Anderson et al. [32] have applied their Alexi energy balance model to the global scale. These two latter data sets are expected to become open-access within the next year. Bastiaanssen et al. [33] developed the two-layer ETLook energy balance algorithm and computed ET for the Nile basin for the years 2007 (complete basin), and 2005 and 2010 (equatorial Nile only). The best ETLook pixel dimension currently is 250 m. Because the ETLook model output is not routinely available, the retrieval of multiple year ET data for the current study was based on the Operational Simplified Surface Energy Balance (SSEBop) model, recently developed and tested by U.S. Geological Survey Earth Resources Observation and Science (EROS) Center (Senay et al., [34]). SSEBop has a pixel dimension of 1 km and computes the surface energy balance on the basis of thermal infrared measurements by the MODIS satellite. It is an example of a model in the category of potential ET-soil moisture reduction methods. The SSEBop model output has a high operational potential and the data will be compared with the ETLook model, which was used successfully in earlier studies in the Nile basin and provides a good reference (Karimi et al., [35]). SSEBop and ETLook both utilize climatic data from weather stations and or atmospheric models. A complicating factor with most ET algorithms is that they utilize satellite images during clear sky days only. Thermal images are taken during cloud-free days when wet surfaces are unlikely to occur. During rainfall events, leaves, soil and paved surfaces get wet for a short period, and this interception process is not properly considered by most remote sensing-based surface energy balance models. The water film on the surface induces a temporary extra net radiation value, that contributes to a quicker drying of the wet surface; this is also known as the positive drying feedback effect (Dickinson, [36]). This enhanced drying process is a result of lower albedo (Δα~0.05) and lower surface temperatures (ΔT~2K). Except for GLEAM, none of the other ET algorithms includes this process of temporary enhanced interception energy and ET. This aspect needs to be considered when compiling the water balance for each land use class, as it can be expected that existing remote sensing algorithms have a systematic underestimation of actual ET during wet events.
Africover is a land cover data set that was compiled for East Africa, with data available for all African countries, except Ethiopia (e.g., Di Gregorio and Jansen, [37]). The purpose of Africover is to produce the geographic information required for decision making, planning and natural resources management in African countries. The original Africover data set contains more than 500 land use classes. The land use classification system developed for Water Accounting (WA) by Karimi et al. [38] was used in this paper and the Africover classes have been converted into 60 individual WA+ classes that can be regrouped again into four categories that are relevant for water management: (i) protected land use (PLU), (ii) utilized land use (ULU), (iii) modified land use (MLU) and (iv) managed water use (MWU). While PLU is legally protected, ULU has a light utilization and several features of natural ecosystems. MLU and especially MWU are controlled by the human desire to boost capital growth and improve the quality of living.
Access to monthly and annual values of rainfall and ET by land use class, opens an innovative pathway to start describing rainfall excess, and hence lateral water flows in an ungauged river basin system. Land use that fulfills P > ET will generate surface runoff, interflow, drainage, groundwater recharge, seepage and base flow. Besides P-ET being the main driver for flows in streams and rivers, P-ET also impacts the conditions affecting aquifer recharge. Agro-ecosystems where P > ET are referred to as net producers of water and are typically present in the forested upstream end of river basins. Such excess water moves downgradient in a given tributary to be used by other agro-ecosystems. Land use classes fulfilling ET > P are net water consumers. Agro-ecosystems that are net water consumers have an incremental ET that cannot be attributed to rainfall only, but also to other water sources with a natural origin, such as groundwater seepage, shallow water tables, interflow or inundations during annual wet seasons with high river flow levels. The incremental ET can also be caused by anthropogenic factors such as withdrawals for irrigation, drinking water supply, sanitation, industries, water retention by reservoirs, etc. Ahmad et al. ([39]) and van Eekelen et al. ([40]) for instance demonstrated that incremental ET (ETincrem) can be inferred from net precipitation (ETPrecip) and the total ET:
ETtotal = ETPrecip + ETincrem
Net precipitation (ETPrecip) can be determined from gross precipitation (Pgross) using a certain efficiency factor ω (e.g., Schreiber, [41]; Budyko et al., [42]; Gerrits et al., [43]):
ETPrecip = ω Pgross
Estimates of ETincrem represent the net withdrawal and it is a first step in the estimation of actual gross withdrawals. ETincrem is referred to as a net value because substantial portions of the gross withdrawals return to the system. Information on both gross and net withdrawals is difficult to obtain from the national departments within the Nile Basin, and is the source of political concern. The next section shows some first estimates of the net withdrawals that can be made on the basis of using Earth observation data without flow meter data. This is new information related to Nile basin abstractions that has not yet been published.
Information on the annual changes in storage (ΔS) is needed to link P and ET to flows. The total annual storage changes include (i) soil moisture, (ii) surface water and (iii) groundwater. Surface water changes were determined from altimeter observations over six major lakes and reservoirs (Lake Victoria, Lake Kyoga, Lake Kwania, Lake Tana, Lake Roseires and Lake Nasser). The altimeters used are Topex/Poseidon for rivers, and ERS-1 & 2, Envisat, Jason-1 and Geosat Follow-On (GFO) data for lakes. The Hydrology from Space website (http://www.legos.obs-mip.fr/soa/hydrologie/hydroweb/) was consulted (Cretaux et al., [44]). Duan and Bastiaanssen [45] undertook a comparative analysis of several Earth observation-based altimeter products and concluded that space-borne altimeters provide water level fluctuations in 4.6–13.1% of in situ measurements. Space-borne altimeters are essential for the estimation of storage changes in large open water bodies of trans-boundary river systems. The changes in soil moisture were taken from the Global Land Data Assimilation System (GLDAS) database (Syed et al., [46]), and they are derived from simulated soil moisture profiles in the vadose zone using a numerical land surface model. The changes in groundwater were measured on the basis of Gravity Recovery And Climate Experiment (GRACE) data, after corrections of soil moisture and surface water changes. GRACE estimates the total change of terrasphere storage from modifications of the gravitational forces. These three individual data sets (GRACE, GLDAS and altimeters) together will give an estimate of the total ΔS and the breakdown in each component. It is beyond the scope of this paper to discuss all scientific aspects of storage changes and gravity, and we refer to the GRACE studies for storage changes provided by Syed et al. [46], Klees et al. [47] and Rodell et al. [48].

3. Results

3.1. Rainfall

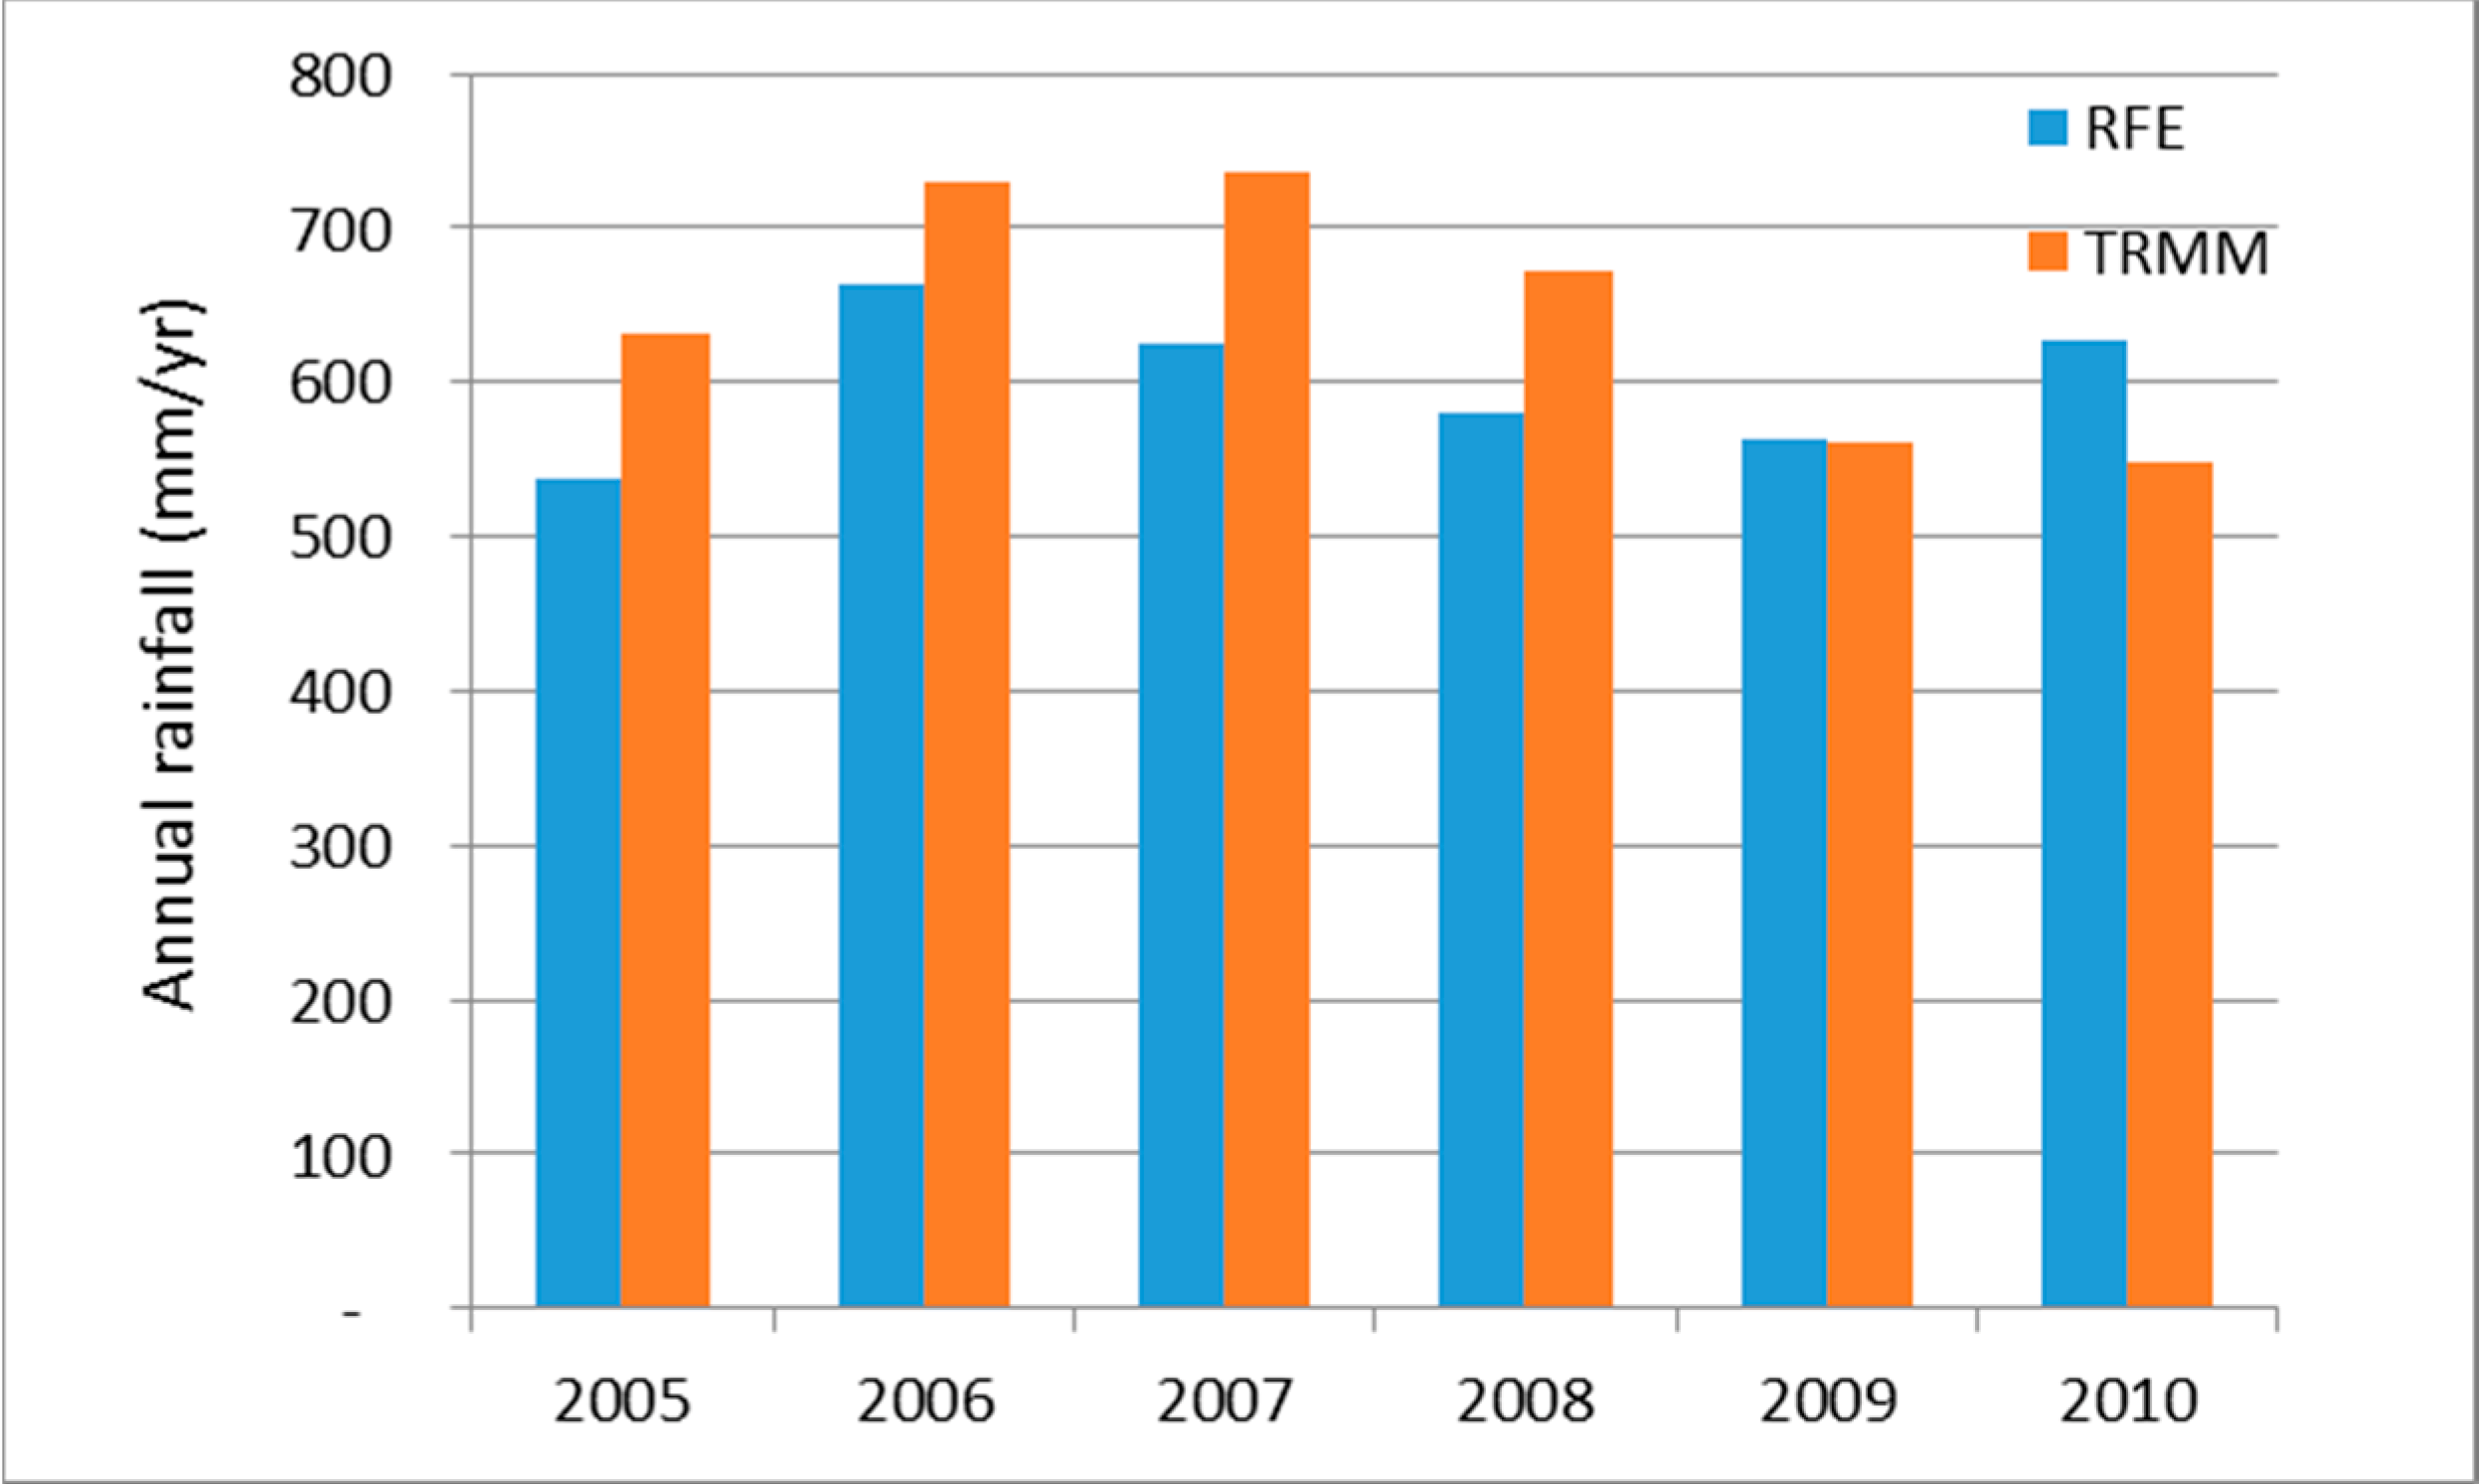
The difference in annual rainfall from TRMM and RFE is presented in Figure 2. The bar chart demonstrates that TRMM gives for most years a slightly higher rainfall over the Nile basin than RFE. The average value for the period 2006–2010 is 647 mm for TRMM and 600 mm for RFE. This is a difference of 47 mm or 8%. While this difference seems reasonable, the consequence of 8% difference at an average rainfall volume of 2013 km3 is a potential error of 161 km3/yr, which is two times the historic Nile flow at Dongola. This example demonstrates the need for a high accuracy in rainfall products. Because the official WMO rain gauge network is limited in number, and both TRMM and RFE have advantages and disadvantages, it is difficult to favor one of the rainfall products without in-depth research. For pragmatic reasons, the pixel values of the two rainfall products were linearly averaged. Ensemble rainfall products based on Earth observation data will likely lead the way forward to obtain reliable rainfall data layers. The new Climate Hazard Group IR Precipitation Station (CHIRPS) rainfall product is an example of an ensemble product based on various interpolation schemes to create spatially continuous grids from raw point data based on climatology, satellite measurements and ground precipitation observations from a variety of sources (Funk et al., [49]).
The average rainfall of the two products for the period 2005–2010 is 624 mm/yr (2013 km3/yr for a basin area of 3,229,038 km2). The FAO-Nile report (Hilhorst et al., [4]) gives an average rainfall volume of 2008 km3/yr for a basin area of 3,170,418 km2, which computes to 633 mm/yr, and which is close to the value used here (deviation is +1.4%). The FAO irrigation potential study mentions a rainfall of 615 mm/yr (deviation is −1.4%) for an area of 3,112,369 km2 or 1914 km3/yr (FAO, 1997). Kirby et al. estimated the Nile basin rainfall volume to be 2,043 km3/yr (627 mm/yr; deviation is 0.5%) using data from the Climate Research Unit at the University of East Anglia (CRU TS 2.10) covering the period 1901–2002. Karimi et al. [50] summarized the water balance of the Nile, and estimated the total rainfall for the wet year 2007 as 2045 km3/yr, which is plausible for an above-average rainfall volume. Hence, the estimates appear to correspond closely.
Figure 2. Annual rainfall of the Nile as estimated by the Tropical Rainfall Measurement Mission (TRMM) and RainFall Estimates (RFE) open-access rainfall products.
Remotesensing 06 10306 g002
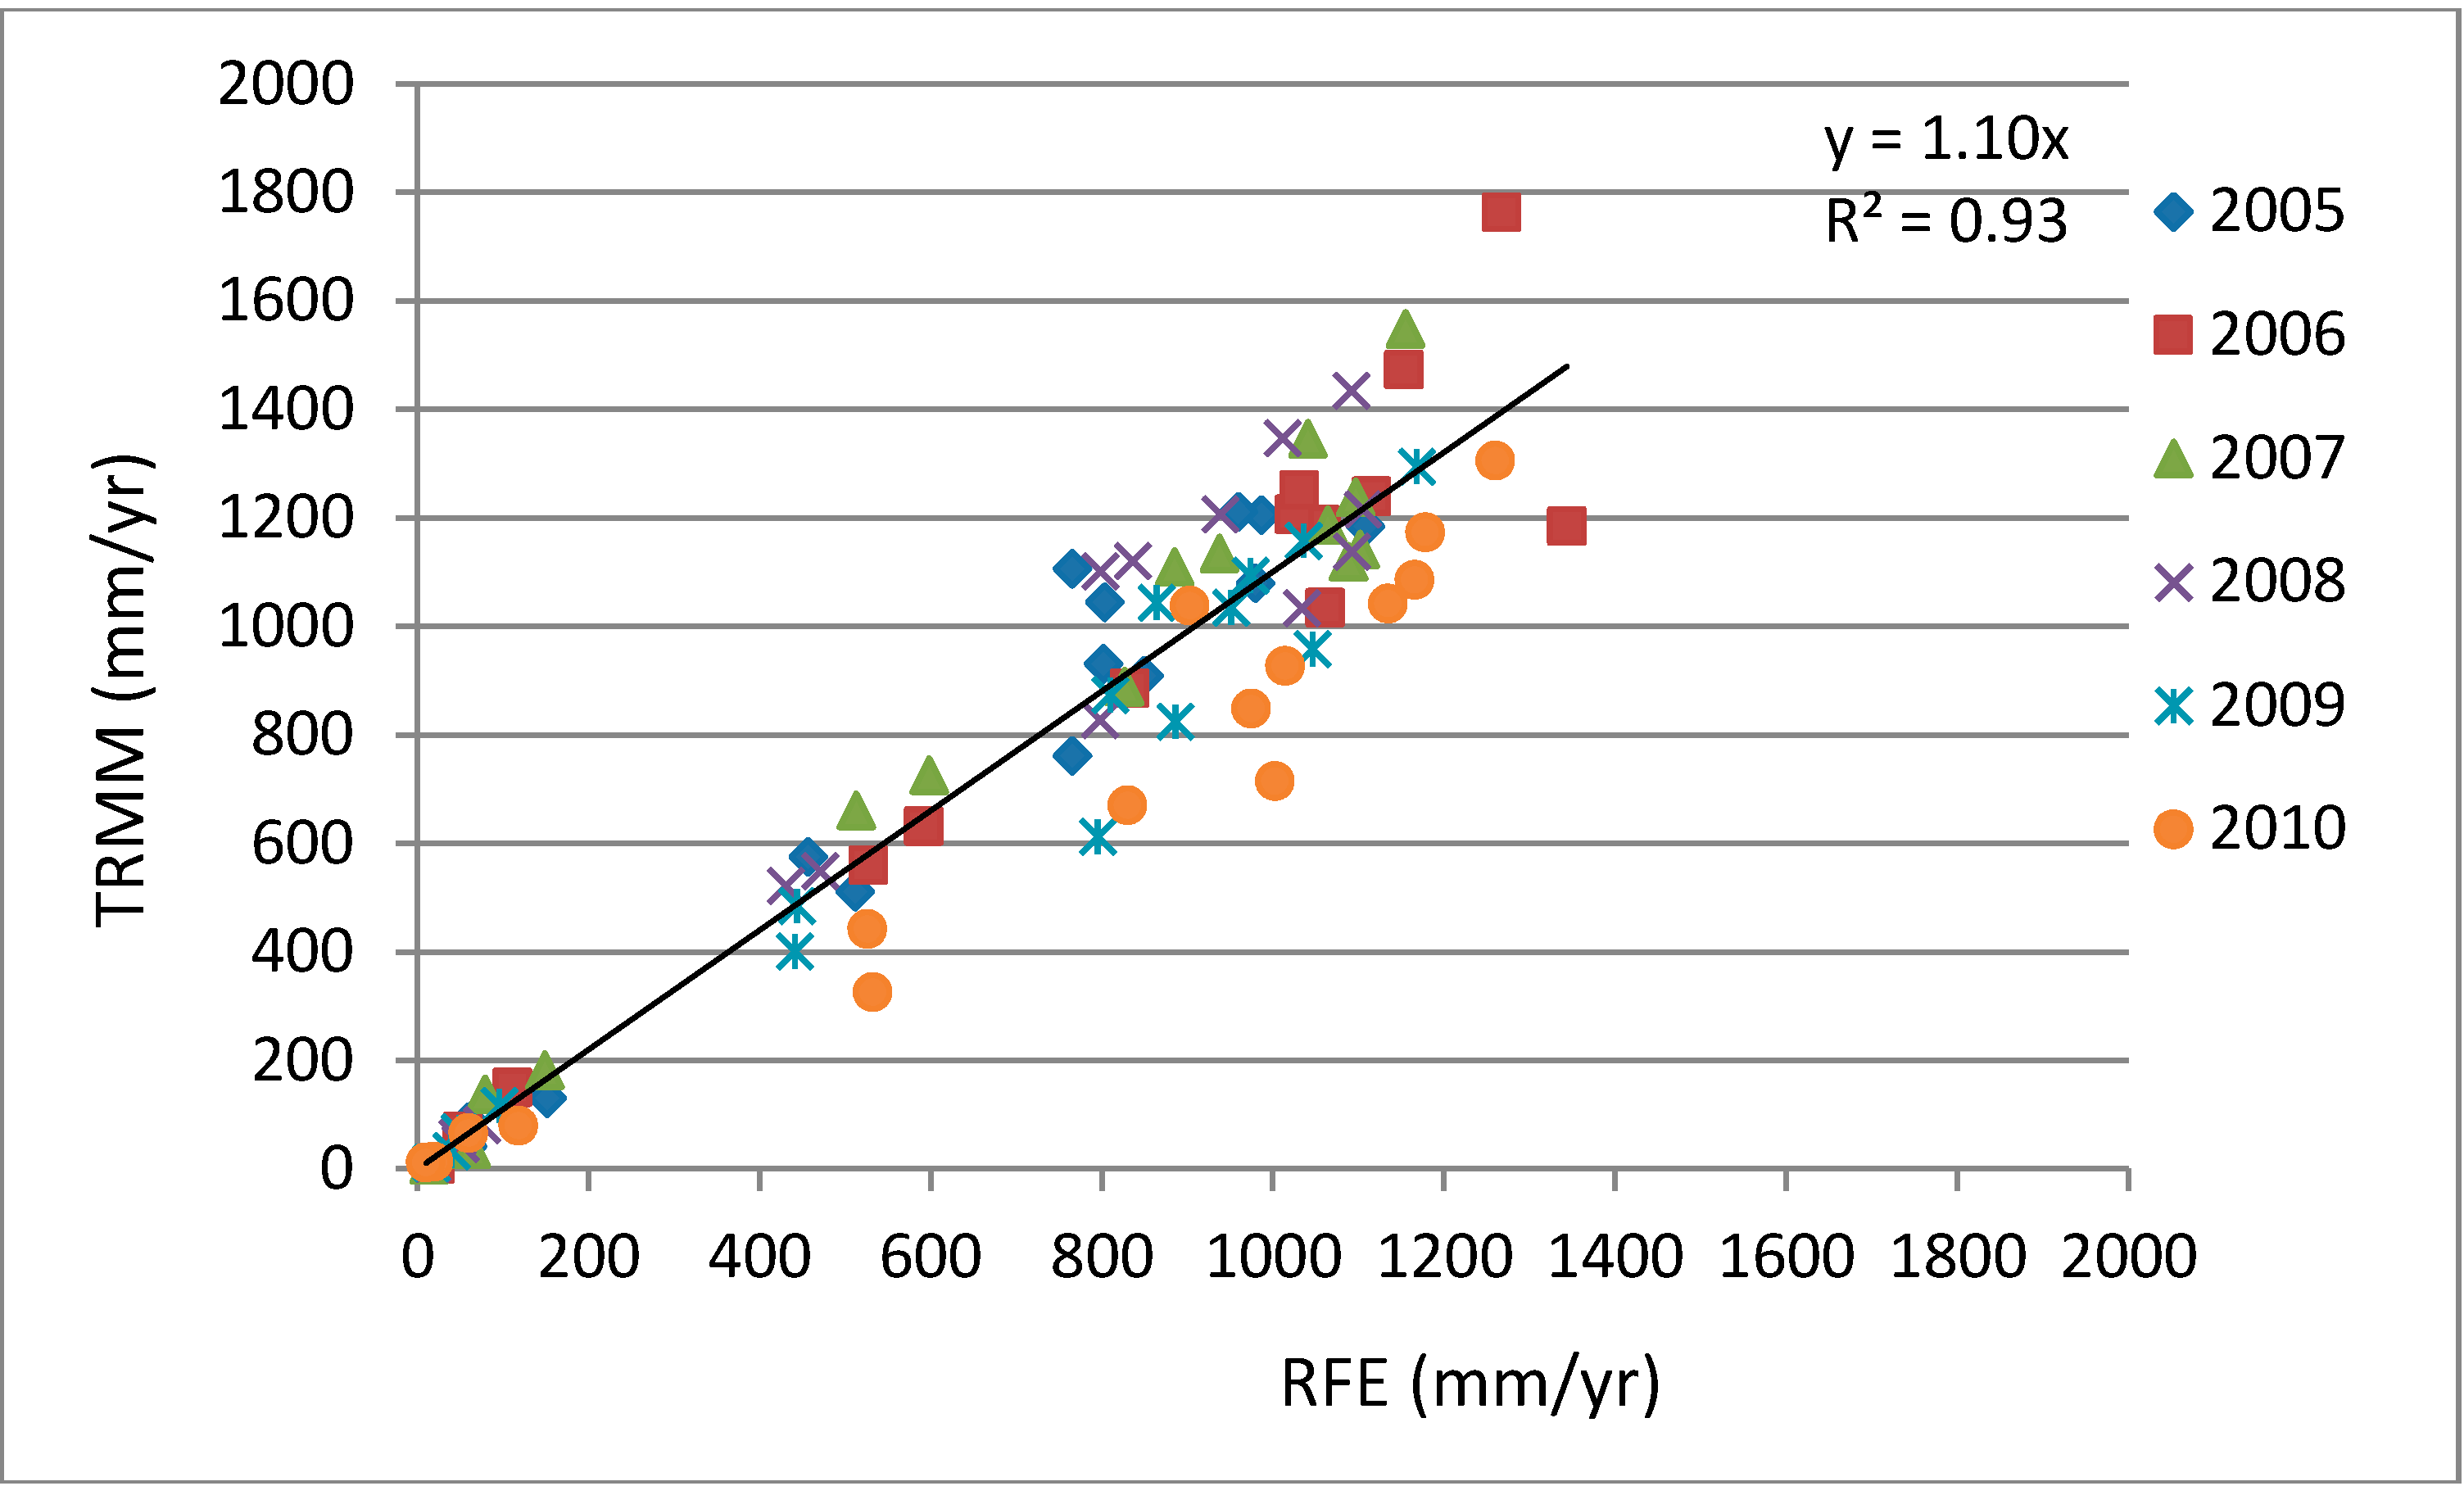
The consistency between the TRMM and RFE rainfall products for all 15 sub-basins is shown in Figure 3. The scatterplot demonstrates that the overall agreement is acceptable, but that large differences in local rainfall occur (RMSE is 153 mm/yr). The largest differences in absolute rainfall amounts occur over the equatorial Nile zone. The rainfall rates over Lake Victoria and the Victoria Nile sub-basins are frequently more than 250 mm/yr different: the difference of 250 mm/yr is unlikely. Rainfall estimates of the Blue Nile sub-basin also seem to have unreasonable differences. It is therefore concluded that more research is needed to validate local rainfall products from Earth observation data. The success of calibration will increase if the data are exposed to a downscaling procedure first. Examples of calibrating downscaled rainfall products are provided in Duan and Bastiaanssen ([51]) and Hunink et al. ([52]).
Figure 3. Annual rainfall data from TRMM 3B43 and FEWS-NET RFE presented by sub-basin (n = 15) for the period 2005–2010 (n = 6).
Remotesensing 06 10306 g003
The rainfall regimes differ significantly across the different sub-basins, and rainfall evaluation should actually focus on the sub-basins only (see Table 1). The humid tropical Kagera, Lake Victoria, Semiliki and Lake Albert and Victoria Nile basins all show substantial amounts of rainfall throughout the year, with their peaks occurring during March and April (P > 100 mm/month). The central part of the Nile basin receives rainfall during June, July and August and is relatively dry during the period November to March. The area downstream of the Blue Nile sub-basin receives substantially lower rainfall amounts. Their access to water resources depends entirely on the rainfall surplus (P-ET) from the upstream basins.
Table 1. Monthly rainfall from the combined TRMM and RFE products averaged for the period 2005–2010 by sub-basin.
Sub-BasinArea (km2)JanFebMarAprMayJunJulAugSepOctNovDecTotal (mm)
Main Nile 139.896910542000032640
Main Nile 2199.56422222000001213
Main Nile 3743.9131001232131810070
Tekezze-Atbara231.492329203158150155741932524
Main Nile 435.338000275315119400121
Blue Nile307.26261122368713823122514063146978
Lower White Nile237.429111133168131129835440517
Bahr el Ghazal549.7144619477810714917612470143795
Sudd167.3548123276118135148160137103327968
Baro-Akobo-Sobat230.3682322509413011914014013411162271051
Albert Nile-Bahr al Jabal80.4321841791261439811913214011475361121
Victoria Nile86.1923965111142134689210513112398581166
Semliki-L.Albert70.646559012110999505493122120118641095
Lake Victoria191.317104105163167136534558881011401251285
Kagera58.1159813314212886191426577412289986

3.2. Actual Evapotranspiration

The application of the SSEBop model to the African continent is relatively new. Since 2012, ET anomaly products have been operationally served for various regions of the world at http://earlywarning.usgs.gov/fews/. While the U.S. Geological Survey (USGS) Earth Resources Observation and Science (EROS) Center is in the process of preparing an operational ET service (absolute magnitudes in addition to the already served anomalies) for Africa in line with the RFE rainfall products, the ET data have not been formally released, and are available only for special ET validation and water balance studies, such as presented in this paper, in Alemu et al. ([53]) and Senay et al. ([54]). SSEBop has been validated for locations in the US using flux towers (Senay et al., [34]; Velpuri et al., [55], Singh et al., [56]), water balances (Senay et al., [57]; Velpuri et al., [55]) and lysimetric observations in the semi-arid Texas High Plains (Gowda et al., [58]; Senay et al., [59]). In addition, Senay et al. ([57]) described the comparison of ET layers between the earlier version of the algorithm (SSEB) and the more detailed output data computed with the Mapping EvapoTranspiration at high Resolution and Internalized Calibration (METRIC) model (Allen et al., [60]). METRIC is the American version of the Surface Energy Balance Algorithm for Land (SEBAL) model (Bastiaanssen et al., [61]). The METRIC comparisons for the State of Idaho, US, revealed a strong correlation (r2 = 0.90) for elevations less than 2000 m. The thermodynamic modelling of the land surface fluxes in METRIC is known to be substantially more advanced compared to SSEBop. The SSEBop algorithm is an improved version of the SSEB, which is capable of handling a range of elevations (Velpuri et al., [55]). Furthermore, the simplification of the parameterization of the surface energy balance in SSEBop is justifiable and required in order to cover the African continent in an operational mode. Comparison studies for Africa will provide more insights into the absolute differences and agreements, and this paper contributes to that.
Karimi et al. ([35,50]) report results of the ETLook model developed by Bastiaanssen et al. ([33]) for water balance and water accounts of the Nile basin during 2007. The total ET was estimated to be 2014 km3/yr during the 2007 above-average rainfall year. The availability of the 1 km × 1 km ETLook data set for 2007, as well as of the equatorial Nile for the years 2005 and 2010 (Immerzeel et al., [62]), provided a great opportunity for comparison with SSEBop output data. A bias correction factor of 1.12 appears to be required. This bias can be related to hot and cold pixel computations with SSEBop that have been strongly simplified as compared to the original work of Bastiaanssen et al. [63] related to the selection of surface temperature end members. There is a single overall calibration coefficient in SSEBop that represents elements of the crop coefficient approach of FAO and the maximum values of evaporative fraction that are not necessarily 1.0 due to certain small values of sensible heat flux (H) over wet surfaces. This coefficient is ideal for bias corrections. The overall scatter in the spatial data of ET is higher (R2 = 0.65) than observed for the open-access rainfall products (R2 = 0.93). The larger scatter implies that the spatial variability of ET patterns in ETLook and SSEB are larger than for rainfall. This difference can partially be ascribed to the higher spatial resolution (1 km × 1 km) of the ET product that generates more spatial contrast. Ground truth data are necessary to independently validate the ET products from Earth observations. This validation can best be done with the help of flux towers at a few locations, and with accurate water balances of paired catchments.
After this bias correction of 1.12, the longer term average actual ET for the period 2005–2010 was computed with SSEBop as 1863 km3/yr. This is the actual ET rate that occurs due to radiative and advective energy. The additional energy due to net radiation increment of wet leaves is not included. After inclusion of the additional “interception energy”, the longer term total actual ET value totaled 1987 km3/yr, which is 6.7% more than the ET under dry surface conditions. The term “total ET” is used to express the inclusion of this extra interception energy. The lowest total ET of 1851 km3/yr occurred during the year 2010, while 2007 had the highest total ET volume (2142 km3/yr). The coefficient of variation of the 6 years analyzed is 6.2% only, and this indicates a temporary stable situation of actual ET for the whole Nile basin. The temporal stability can be ascribed to the large area of desert with negligible ET values.
Table 2. Monthly actual evapotranspiration (including interception) from the calibrated SSEBop model (mm/month). The update is based on a bias factor and a correction term for “interception energy” during periods when the land surface contains a water film and net radiation is temporarily enhanced
Sub-BasinArea (km2)JanFebMarAprMayJunJulAugSepOctNovDecTotal (mm)
Main Nile 139,896132136494660767545241511472
Main Nile 2199,5643468891010743274
Main Nile 3743,913111131028301153197
Tekezze-Atbara231,492191515162353797970442318453
Main Nile 435,3382233718516125511180
Blue Nile307,262453837395272898790835747737
Lower White Nile237,4293529252234629510080643834617
Bahr el Ghazal549,714514853506881939588806253823
Sudd167,354978786791021051041031091191141031,209
Baro-Akobo-Sobat230,36887706570828286829210699911,012
Albert Nile-Bahr al Jabal80,432857288871051009493105114113881,144
Victoria Nile86,19293779089918582849010199861,067
Semliki-L.Albert70,6469282908686837878848890871,023
Lake Victoria191,31796901029589828079838688851,056
Kagera58,115776782838273686968717971891
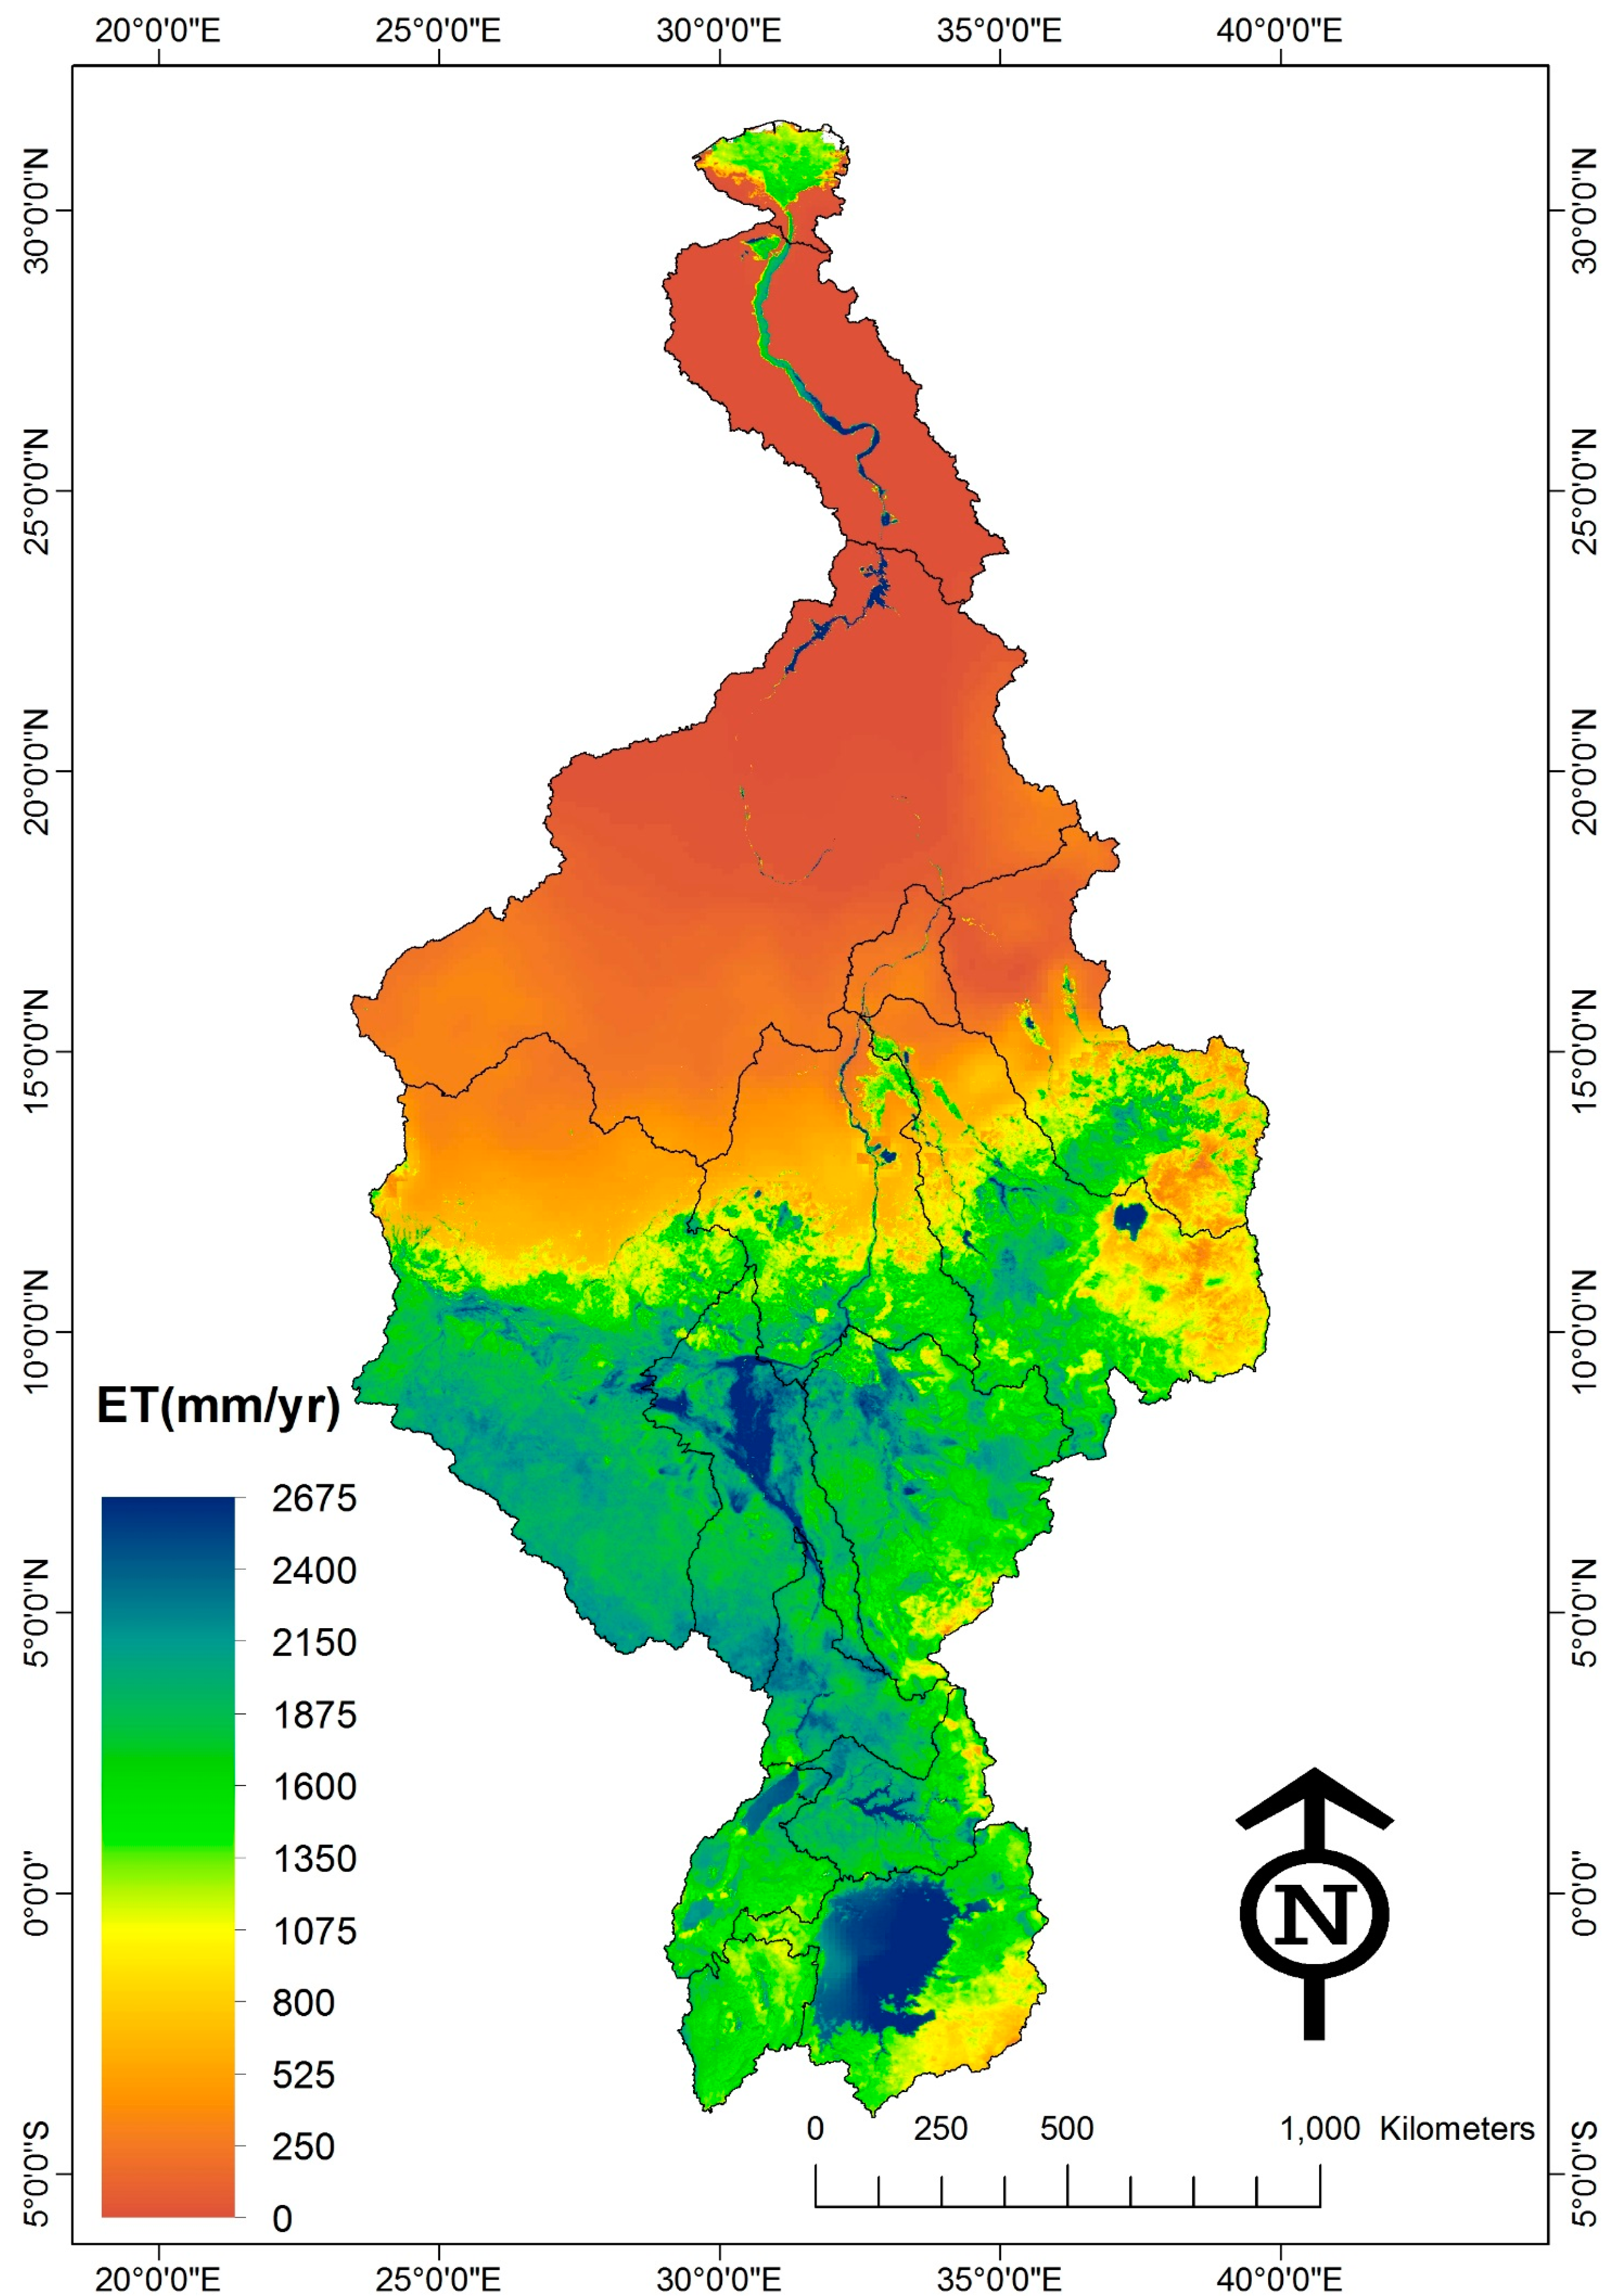
The monthly ET layer for each sub-basin is presented in Table 2. These values represent a mix of agro-ecosystems. The sub-basin with the highest ET per unit of land is the Sudd (1209 mm/yr) followed by the Albert Nile—Bahr Al Jabal (1144 mm/yr). Both sub-basins host extensive wetlands and tropical forests, and have a rich biodiversity. Mohamed et al. ([64]) estimated the ET rates of a 38,600-km
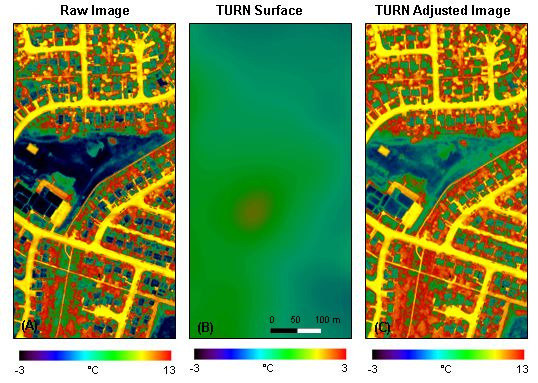
2-wide Sudd area to be 1636 mm/yr. The areas prone to floods were included in their analysis. The central part of the Sudd (shown in Figure 4) displays actual ET rates between 1500 and 2000 mm/yr, similar to the ET values reported by Mohamed et al. ([64]). The spatial coverage of the entire Sudd sub-basin is 167,354 km2, which is substantially larger than the area used by Mohamed et al. ([64]), and includes the pastures surrounding the wetlands. This difference in area provides a logical explanation for the lower ET value shown in Table 2 (1209 mm/yr). The lowest ET by sub-basin occurs in northern Sudan and upper Egypt where the majority of the agro-ecosystem is desert (74 mm/yr). The impact of irrigation on the sub-basin averaged ET is clear when considering the sub-basin average ET value for the Main Nile 1 sub-basin (472 mm/yr). This value is roughly an average value for a landscape consisting of double cropping systems in the Nile delta (ET of 1000–1500 mm/yr) and desert land (ET of 10–100 mm/yr).
Figure 4. Distribution of the annually accumulated actual evapotranspiration across the Nile basin averaged for the period 2005–2010. The pixel size is 1 km. The data are based on SSEBop being calibrated against ETLook and adjusted for interception energy.
Remotesensing 06 10306 g004
Hence, the average total ET for the Nile basin for the period 2005–2010 is 1987 km3/yr. The FAO-Nile program estimated the total ET to be 1991 km3/yr (Hilhorst et al., [4]), being a difference of less than 0.2%. Their methodology is based on a classical water balance calculation for sub-basins. Actual ET over rainfed areas is assumed to be equal to the reference ET0 when there is enough water stored in the soil to allow actual ET fluxes to be equal to ET0. During dry periods, a soil moisture reduction term is used. The land use map for irrigated areas was derived from AQUASTAT, and it was assumed that actual ET equaled ET0 after correction with a crop coefficient that reflects pristine growing conditions, without any moisture or salinity stress, following Allen et al. ([65]). Open water and wetland evaporation was estimated from reference evapotranspiration and calibrated through closure of the water balance. Unfortunately, the boundaries of the sub-basins reported by Hilhorst et al. ([4]) are not identical to the official boundaries of the sub-basins outlined by the Nile Basin Initiative and used in this paper. It is therefore more useful to compare ET expressed as a rate per unit of land, and not by volume. Except for Bahr el Ghazal and Sudd, the differences are within 15% (see Table 3) and the RMSE is 295 mm/yr. The overall correlation of R2 = 0.92 between the FAO-Nile ET by basin and the aggregated ET value on the basis of 1 km × 1 km pixels is encouraging, despite the differences between the geographical coverage.
Kirby et al. ([66]) estimated the ET (referred to as “water use”) to be 1828 km3/yr, with the majority of the water being evapotranspired by grassland (937 km3/yr), followed by woodland and other (563 km3/yr), rainfed agriculture (264 km3/yr), and irrigated agriculture (65 km3/yr). Remarkably, they did not report on the evaporation from open water bodies, and that is one of the reasons that their total value of 1828 km3/yr is lower than the 1987 km3/yr found in this study. The Kirby et al. model calculates actual ET based on potential ET and water availability. Potential ET acts as an upper boundary for actual ET. Storage of water in soil and on the surface is calculated using a soil moisture bookkeeping procedure and water balance equation. Sub-basins identified as Main Nile 1 and 2 are the irrigated areas in Egypt. The average ET of these sub-basins for the period 2005–2010 is 35 km3/yr, and this number compares well with the 35 km3/yr of ET in agriculture mentioned in the National Water Resources Plan for Egypt (MWI, [67]). In addition, there is ET from surface evaporation (2.5 km3/yr), fallow land 0.9 km3/yr, fish ponds (0.2 km3/yr), and municipal and industrial use (2.5 km3/yr). Some of these national-scale non-agricultural ET values occur, however, outside the Nile basin. So, this ET number officially endorsed by the Egyptian authorities agrees well with the Earth observation estimates.
Table 3. Comparison of longer term ET volumes (km3/yr) and fluxes (mm/yr) estimated by FAO-Nile (1960–1990) and the adjusted USGS EROS SSEBop model (2005–2010). The deviation is based on the ET flux values.
FAO-NileAdjusted SSEBop Model
DescriptionArea ET ET DescriptionArea ET ET Dev
(km2)(km3/yr)(mm/yr)(km2)(km3/yr)(mm/yr)(%)
Main Nile d/s Atbara877,866108.8124Main Nile 1,2,398,3375105.710713.3
Atbara237,04494.1397Tekezze-Atbara231,492104.8453−14.0
Main Nile d/s Khartoum34,5237.3211Main Nile 435,3386.418014.7
Blue Nile308,198266.0863Blue Nile307,262226.473714.6
White Nile260,943144.5554Lower White Nile237,429146.4617−11.4
Bahr el Ghazal & el Arab606,428454.1749Bahr el Ghazal - Sudd717,069654.7913−21.9
Pibor-Akabo-Sobat246,779223.8907Baro-Akobo-Sobat230,369233.21012−11.6
Bahr el Jebel136,400163.11,196Albert Nile-Bahr - al Jabal80,43392.011444.3
Kyoga-Albert197,253221.61,124Victoria Nile Semliki - L.Albert156,839164.21047 6.8
Lake Victoria basin264,985307.51,160Lake VictoriaKagera249,433253.8101812.3
Total and average3,170,4191990.8628 3,229,0391987.6616

3.3. Water Balance

The long-term average flows in the River Nile are measured and published in several sources. Based on data from Sutcliffe and Parks [18] and others, river flows at various points in the Nile basin were compiled before by Dai and Trenberth [68], Awulachew et al. [69], El-Shabraway [70] and Johnston [71]. The water balance for every sub-basin can also be computed from the Earth observation-based P, ET and ΔS data. It is a unique situation to have spatially distributed ET data. In combination with flow data, the ET data will facilitate the understanding of the water balance of the Nile.
Congruency between P, ET and ΔS values can be obtained from the mass balance. The inflow and outflow across sub-basins can be determined by accounting for P, ET and ΔS. Stream discharge gauges were used to measure flows in the main river courses. Outflow of sub-basins does not follow the main river course only. Inter-basin transfer also occurs through floods, smaller ungauged streams, groundwater flow and irrigation canals. The large flood plain in southern Sudan, stretching from the west (Bahr al Ghazal), across the center (Sudd) to the east (Baro Akabo Sobat), transfers large amounts of water between sub-basins when the area is submerged. Ungauged streams traverse the hilly topography and undulating terrain of the Bahr al Ghazal and Victoria Nile. The Gezira irrigation system in Sudan is located in the lower White Nile sub-basin, and receives water released by the Roseires reservoir in the Blue Nile sub-basin. Irrigation is thus an essential inter-basin transfer process. Groundwater flow occurs in areas with strong groundwater recharge. A map with annual recharge rates of 100–400 mm/yr in the Nile basin was provided by MacAllister et al. [72] based on earlier work of Bonsor et al. [73]. The greatest recharge occurs in the Blue Nile, Sudd and Bahr al Ghazal. These areas are conspicuous in 
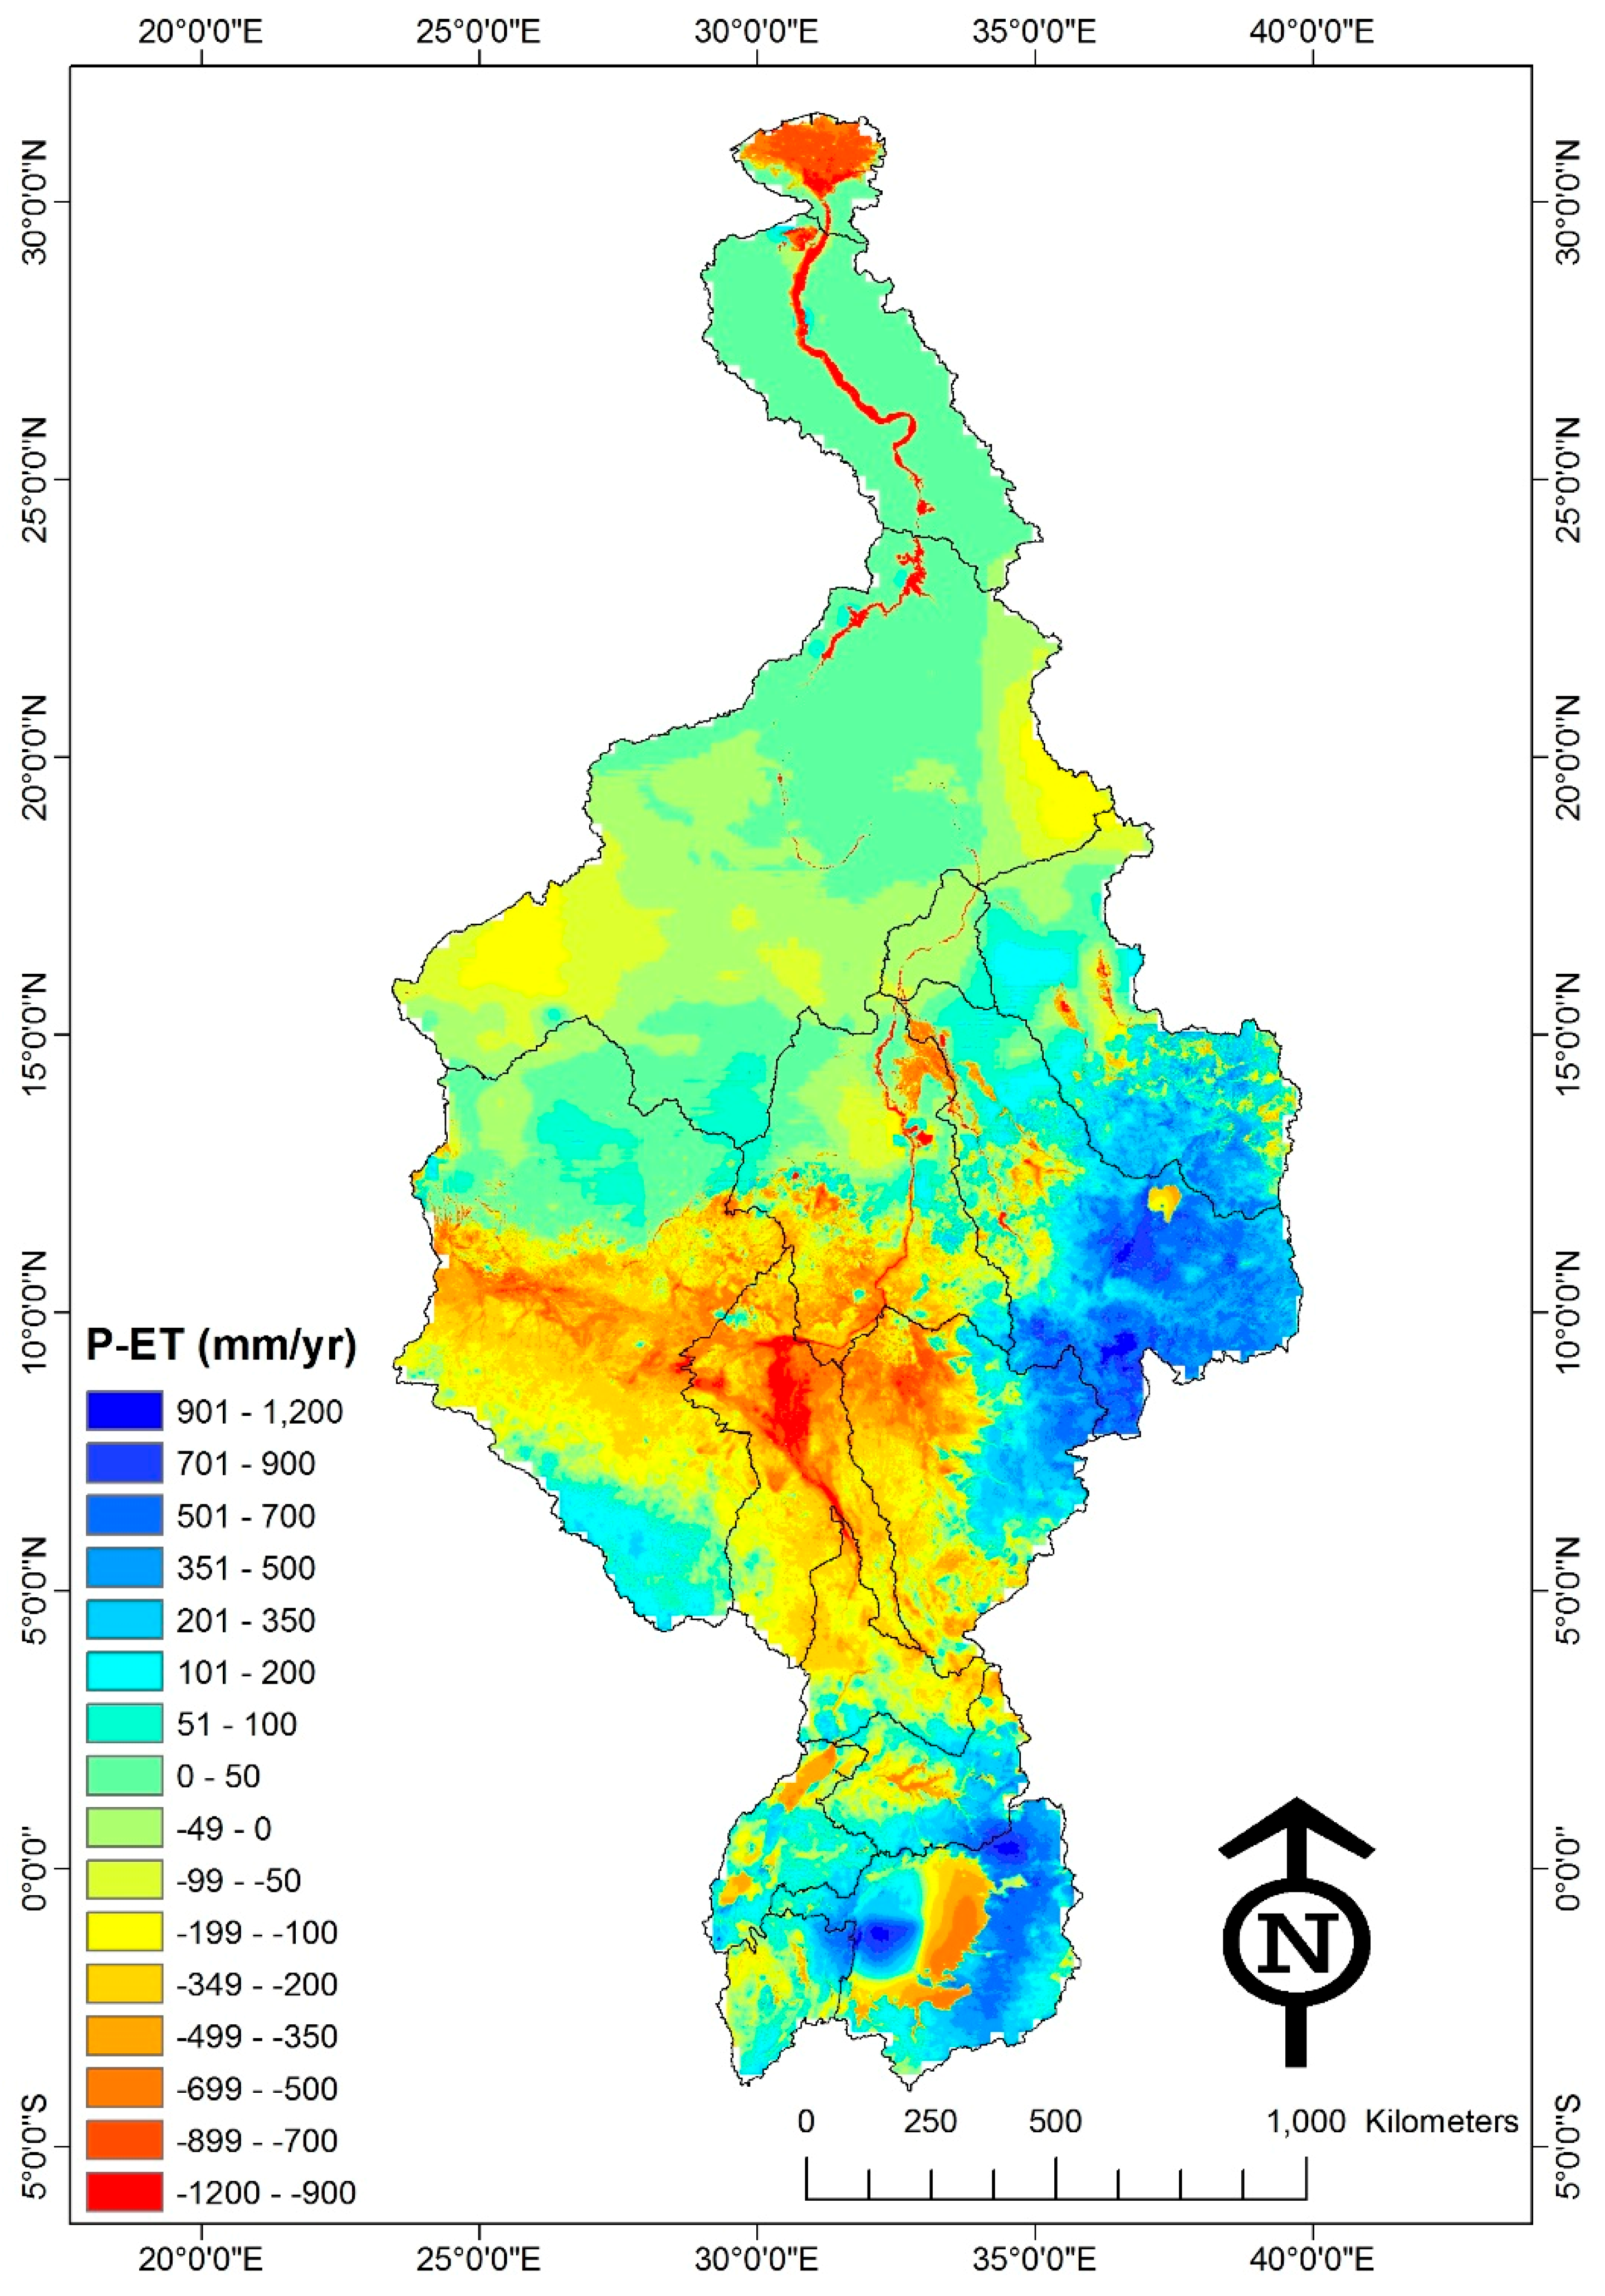
Figure 5. Areas with P-ET > 700 mm/yr occur in the Blue Nile sub-basin at the highlands of Ethiopia and Kenya. Values of P-ET also seem to be systematically higher in the southwestern part of Lake Victoria than at the eastern side of the lake. All the blue areas with P > ET in Figure 5 are net water producing areas. Besides the typical water towers at higher elevations, there are also vast areas in north Sudan that produce a thin layer of water (P-ET > 50–100 mm/yr), which volume-wise, contributes substantially to groundwater recharge and river flow (commonly via the groundwater flow system and baseflow).
Excess water from the production areas are conveyed via streams and aquifers to the lower parts of the basin. The largest water consumers (i.e., most negative P-ET pixel values) are (i) lakes and reservoirs, (ii) wetlands and (iii) irrigated areas. The flooded area of the Sudd appears dominantly in Figure 5 due to a high percentage of permanent open water bodies and swamps. The wetland areas in the Bahr al Ghazal and Sobat also appear to be vast, although flood duration might be shorter than in the Sudd; due to shorter flood seasons, the ET rates in Figure 4 do not exceed 1400 mm/yr. The irrigation systems in Sudan are clearly visible, but P-ET is higher in absolute terms than for Egypt where the role of rainfall is basically excluded. The Kenana irrigation system located at the right bank of the White Nile near the town of Rabak is an exception, with rates of P-ET < 1000 mm/yr due to commercial monoculture sugarcane plantations. Egypt and the Sudd wetlands have large areas where the ET exceeds P by more than 1000 mm/yr, hence a substantial net withdrawal must occur.
Figure 5. Water production areas (P > ET) and net water consumption areas (ET > P) for the Nile basin over the period 2005–2010. Lateral transport of water occurs from positive to negative areas, also non-conventionally via floods and groundwater flow
Remotesensing 06 10306 g005
Congruency of P, ET and ΔS was verified by comparing accumulated P-ET values from upstream to downstream with outflow measured at discharge gauges. The accumulation of P-ET is zero at the water divide and increases when going downstream along the river course trajectory. The accumulation of P-ET reverses after passing flood plains and other points of substantial withdrawals. The closure errors between the measured flow at discharge gauges and P-ET for each sub-basin are ascribed to ungauged inter-basin transfer processes discussed before. Maps of groundwater recharge were used to estimate whether the inter-basin-transfer is of surface or groundwater origin. The results are provided in Table 4. It is estimated that the lower White Nile is a net receiver of surface and groundwater from floods and groundwater seepage in the southern part of the sub-basin. Bahr al Ghazal and the Sudd receive inter-basin transfer during the flood season. Lake Victoria and the Victoria Nile discharge excess water through ungauged streams and by means of deep percolation towards the flood plain areas in southern Sudan. Inter-basin transfer in Egypt happens by leakage towards the Nubian Sandstone and Mohra aquifers, among others (Shahin, [17]; Elsawwaf et al., [74]). Surface water resources are withdrawn and transferred to newly reclaimed desert areas outside the Nile basin such as in Sinai, North Coast, Toshka and Oweinat. The net result of all these exchanges is that 5 km3/yr of groundwater leaves the Nile basin by inter-basin transfer in addition to a surface water amount of 2 km3/yr. The average outflow to the Mediterranean Sea through the Nile branches and drainage canals of the Nile delta is estimated to be 14 km3/yr. The Egyptian National Water Resources Plan reports 12 km3/yr (drainage: 11.7 km3/yr; rivers 0.2 km3/yr). Faures et al. [75] estimated that 12.5 km3/yr drains to the sea and lakes, 1.2 km3/yr directly via the rivers. The agreement between the estimated outflow in the main river course of each sub-basin and the flow measurements is presented in Figure 6. The RMSE is 3 km3/yr without any bias for the 15 discharge stations and the correlation is excellent (R2 = 0.98).
Table 4. Annual water balance by sub-basin, averaged for the period 2005–2010. Inter-basin transfer is estimated from closure of the water balance of each sub-basin.
SB NameInflowPET+INet GW interbasinNet SW interbasinΔSOutflow
(km3/yr)(km3/yr)(km3/yr)(km3/yr)(km3/yr)(km3/yr)(km3/yr)
Main Nile 13621941−0.0914
Main Nile 25531641−0.2236
Main Nile 3795171410.1055
Tekezze-Atbara0121105121.1912
Main Nile 4874642−0.0779
Blue Nile0299237561.5450
Lower White Nile25122141−11−7−0.2525
Bahr el Ghazal0435446−3−101.001
Sudd35162201−9−6−1.2512
Baro-Akobo-Sobat0242232−10−1.1713
Albert Nile-Bahr al Jabal339091−2−1−0.0835
Victoria Nile281009335−0.5628
Semliki-L.Albert07872000.435
Lake Victoria5246208682.0028
Kagera05752000.785
NILE 2005 to 2010 2013198752314
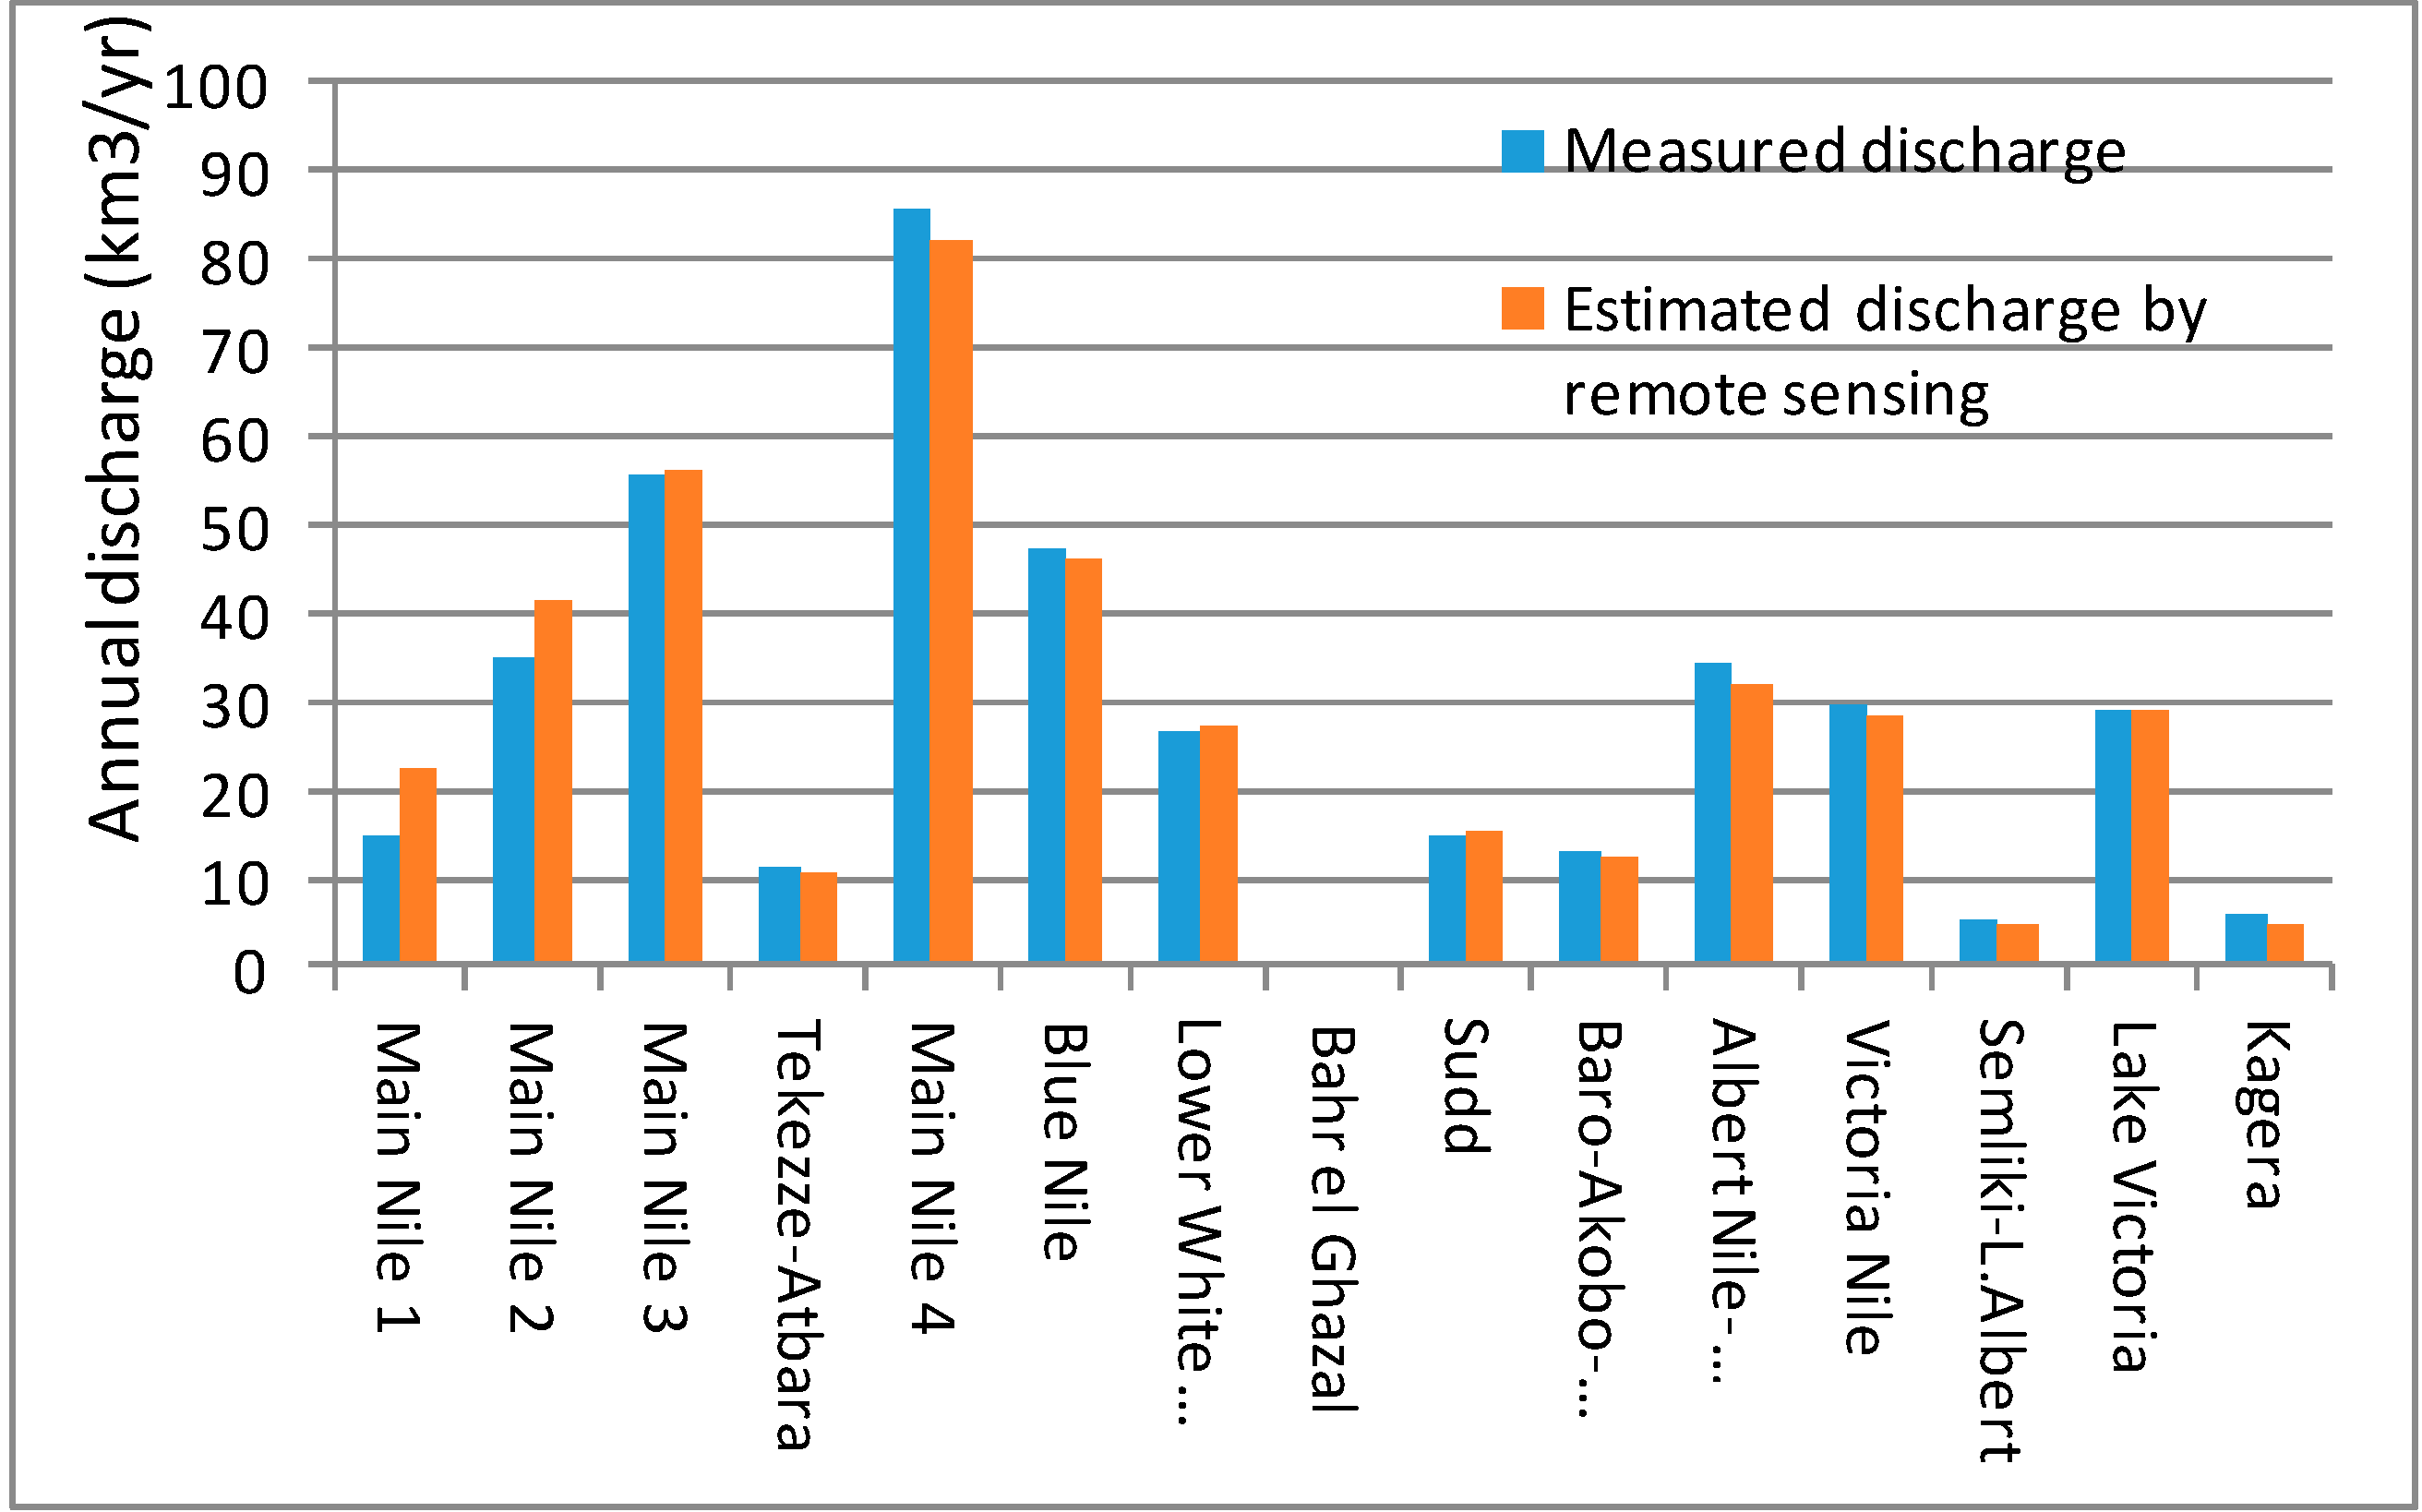
The water balance check shows that P, ET and ΔS spatial data from different types of satellites are consistent with the classical hydrological observations. The minor differences can be ascribed to ungauged lateral transfer of water outside the main river courses, apart from the fact that the reporting period of the discharge stations and the satellite data are not identical. Discharge measurement stations are not always located at the boundary between adjoining basins. For instance, the peak flow in Dongola is generally known to be 84 km3/yr, but Dongola is located in the central part of the Main Nile 3 sub-basin. The peak flow computed from P-ET is 87 km3/yr and occurs upstream of the Merowe dam.
Figure 6. Relationship between estimated outflow through the main outlet of each sub-basin for the period 2005–2010 and the longer term averaged measured river discharge.
Remotesensing 06 10306 g006
Considering this good agreement with flows and the plausibility of non-conventional inter-basin transfers, which cannot be neglected, it can be concluded that the P-ET values are highly realistic. Figure 5 is, to the authors’ knowledge, the first map of water producing and water consuming areas published for the Nile basin, and due to the acceptable values for inter-basin border flow, this information can be used for water accounting. Some examples of estimated drainage and withdrawals by agro-ecosystems are discussed in the next section.

3.4. Net Water Producers and Consumers

The FAO-Africover Land Use-Land Cover (LULC) product was used as a basis for identifying the agro-ecosystems with net production and net consumption of water. The results of the LULC map and the link to rainfall and ET are provided in Table 5. The complete data set for 43 LULC classes is provided in Appendix 1. The net water production comprises all non-consumed and non-utilized water resources and is defined simply as P-ET. It is the total drainage of all non-consumed water, assuming zero changes in storage. In cases where ET > P prevails, an effective rainfall coefficient of 70% (ω = 0.7) has been used arbitrarily, hence the surface runoff and drainage production is 30% of P. In reality, the ω-factor is climate, soil and land use dependent (e.g., Dastane, [76]), and more research is required to improve the estimation of ω across heterogeneous landscapes. The remaining ET that cannot be met from P is referred to as the incremental ET due to surface water or groundwater withdrawals. This extra water consumption is feasible due to lateral transfer of water in the basin and can happen by manmade infrastructure or through natural groundwater flows.
This analysis reveals that plantations are, in a relative sense, the major sources of exploited water in the River Nile (P-ET: 300 mm/yr). Rainfed crops follow with a water layer of P-ET being 181 mm/yr. Plantations and rainfed crops are both Modified Land Use. It is a positive signal that these forms of land use generated by humans are the source of lateral flow. Because the rainfed crop area is five times larger than for forest plantations, crop plantations generate 68.7 km3/yr excess water (runoff, drainage, recharge), in addition to providing staple food. This is an excellent example of contributing simultaneous to food security and ecosystem services (Rebelo and McCartney, 2012 [77]). The majority of these plantations can be found in the equatorial Nile region.
Table 5. Water production and consumption by land use-land cover class in the entire Nile basin for the period 2005–2010. Production was computed as P-ET when P > ET. For cases with ET > P, production was computed as 0.3 P. Net withdrawal was computed as ET-0.7 P.
WA+ CodeLULCAreaETETPPP-ETProductionNet Withdrawals
(km2)(mm/yr)(km3/yr)(mm/yr)(km3/yr)(mm/yr)(km3/yr)(km3/yr)
MLU2Rainfed crops380,180749284.6929353.318168.70
MLU1Plantations74,80685063.6115086.030022.40
ULU4Savannah892,666846755.3870776.22320.90
ULU8Pastures441,240423186.9442194.9188.10
MWU17Wetlands10,057104010.5109211.0520.50
MWU11Urban areas587690.08150.0460.00
ULU19Sinks9872970.31460.1−1500.0−0,2
MLU12Urban areas47404732.21420.7−3300.2−1,8
PLU4Bare land196,0179117.96412.6−273.8−9,1
MWU6Reservoirs631015669.9480.3−15180.1−9,7
ULU11Bare land679,8356242.15235.4−1010.6−17,3
MWU1Irrigated crops54,73381244.528215.5−5304.6−33,6
ULU16Rivers and natural lakes89,4891445129.31335119.4−11035.8−45,7
ULU10Wetlands112,6481206135.9960108.1−24732.4−60,2
ULU1Forests285,2711067304.41053300.5−1490.2−94,1
Total 3,229,039 1987.3 2014.1 298−272
A layer of 1581 and 530 mm/yr, respectively, is evaporated in excess of rainfall with respect to reservoirs and irrigated crops. As pointed out before, the source of this incremental ET is not only surface water, but can also be groundwater that seeps out in flood plain areas and in shallow water table areas. The largest volumetric water consumer is forest. In addition to rainfall, forests consume 94 km3/yr extra, most likely due to deep rooting and use of groundwater interflows. Forests in the Nile must be distinct groundwater-dependent ecosystems. The total forest ET is 304.4 km3/yr, indicating that forest in the Nile basin are substantial water consumers (304/1987 × 100%=15%). The gross rainfall is 300.5 km3/yr, and all this rainfall water is certainly not available for forest ET, especially during heavy storms when surface runoff from forested mountains is large. There is no runoff from forests during the dry season, and the fact that ET remains high during the dry season implies that groundwater must be tapped into. The ω = 0.7 correction factor is used for forests also. More research is needed on local forest hydrology processes to estimate which part of the rainfall is stored in the root zone and subsequently available for root uptake during dry years, and which part of the rainfall runs off. Van Eekelen et al. ([40]) found for the Incomati basin that the net withdrawals by forests were also substantially higher than irrigated crops, which supports the findings for the Nile basin. Wetlands in the Nile basin have a net withdrawal of −60.2 km3/yr, which reduces the flow of water to downstream areas. The incremental ET from open water bodies (i.e., rivers and natural lakes; see Appendix 1) totals 45.7 km3/yr (Table 5). This total ET value for natural bodies of water should not be confused with the reservoirs that have an incremental ET of 9.7 km3/yr. Hence, the natural lakes and rivers consume more water than the manmade lakes.
The irrigated area of 54,733 km2 is in agreement with earlier estimates of 55,360 km2 and 49,010 km2 made by Awulachew et al. [78] and Bastiaanssen and Perry [79], respectively. FAO [80] estimated the total irrigation-equipped area in the basin at 50,790 km2. Hence, there are some acceptable differences that can be attributed to the type of data survey, the period under consideration, and definitions of irrigated areas. Table 5 indicates that the net withdrawal by the irrigation sector is 33.6 km3/yr. Bastiaanssen and Perry [79] estimated the total net withdrawal to be 31.2 km3/yr for the year 2007; their value is remarkably similar to the value derived in this study, given that different data sources were used, and 2007 was a wet year with lower irrigation water requirements.
Awulachew et al. [78] estimated the current annual irrigation requirement—or gross withdrawal—to be 65.9 km3/yr, which implies an average irrigation efficiency of 50% at a net withdrawal of 33.6 km3/yr, which is a reasonable number for the current flood irrigation practices in the Nile basin. Hilhorst et al. [4] report a basin-wide average irrigation efficiency of 49%. The FAO estimates of gross withdrawal were 67.7 km3/yr in 1997 and are thus close to Awulachew et al. [78].

4. Discussion

The growing water scarcity in developed and developing countries prompts water professionals to deal more accurately with the management of water resources. Hydro-meteorological stations of rainfall, weather and stream discharge provide point measurements. The data are not publicly accessible, and many stations are dysfunctional. Actual ET is a key component of the water balance, but cannot be measured easily using in situ devices. There are only three flux towers in the Nile basin that measure ET flux. Access to spatially distributed P, ET and ΔS data from Earth observations has a number of advantages including: (i) providing actual ET data that cannot be measured in situ, (ii) providing information on all agro-ecosystems in Prediction of Ungauged Basins PUBs, (iii) the data are open-access, (iv) the data are scientifically verified by the providing agencies who have strict data protocols, (v) the source of the measurements is provided and can be inspected and verified in case of disputes, and (vi) the data are archived indefinitely. The contribution of Earth observation data for improved management of water resources in Africa will increase substantially if, in addition to rainfall products, competing ET products are made freely accessible. The SSEBop and Alexi data sets would be a valuable addition to the existing open-access MOD16 and LandSAF products for Africa. The provision of 30 m EEFlux data in the near future will be another important contribution (Allen et al., [81]; Morton et al., [82]). The new version of the Alexi model developed by Anderson et al. ([32]) has a spatial resolution of 1 km, and is also based on thermal infrared radiation. Alexi has been applied to the Nile basin in some recent National Aeronautics and Space Administration (NASA) studies (http://svs.gsfc.nasa.gov/vis/a000000/a004000/a004044/).
This paper has demonstrated that P-ET information is of strategic importance for describing the redistribution of water resources in basins without flow meters. Agro-ecosystems that produce water will need to be managed carefully, to ensure that they continue to provide this ecosystem service, and that they sustain rainfall (van der Ent et al., [83]). Spatially discretized information on net water withdrawals or incremental ET is also fundamental for discussions on redistribution of water among competing user groups. While classical statements concerning withdrawals are typically limited to irrigated crops, this study demonstrates that groundwater-dependent ecosystems extract twice as much by utilizing groundwater. In situations of droughts or dry years, it is especially relevant to prioritize water allocations in terms of the most urgent and important user needs.
Although not discussed in detail, it was found that satellite information on storage changes is fundamental, but not yet reliable. The GRACE data are only applicable for areas with minimum dimensions of 300 km in the x and y direction. Changes in sub-soil moisture are not really measureable with multi-spectral radiometers from space. While claims are made that sub-surface moisture is a reflection of top-soil moisture processes (e.g., De Lange et al., [84]), this supposition cannot be supported in soil physical terms because complex 3-dimensional interactions between moisture in the soil and the vertical and horizontal water fluxes are at play. Better Earth observations systems are needed to compute sub-surface storage changes, especially for monthly-scale applications.
Every remote sensing algorithm has its own uncertainty and limitations. The accuracy is expressed by the deviation between two values pertaining to a certain space and time domain, which is often referred to as an error. The uncertainty is expressed by the range of likely values and the RMSE is a good proxy for describing that range. The rainfall product from TRMM and RFE is validated by the provisional agencies, and is estimated to have an error of 0.5 to 1.4 % at the basin scale when comparing with independent sources. The RMSE values at sub-basin scale is 153 mm/yr (R2 = 0.93), hence locally there is more uncertainty of rainfall. The actual ET product deviates 0.2% at basin scale from the only reliable alternative data source based on earlier FAO work. At the spatial scale of a sub-basin, the RMSE is 295 mm/yr (R2 = 0.92). This implies that local values of actual ET are more uncertain than for rainfall. The congruency between rainfall and actual ET is excellent because the estimated river flows at 15 discharge stations have a RMSE of 3,0 km3/yr only, and the mean discharge is 100% accurate. We therefore believe that the water balance presented at the annual time scale for all sub-basin level is highly accurate. Locally, the uncertainty will be substantially larger, especially when dealing with monthly time steps. This is natural to any water balance analysis.
Bastiaanssen ([85]) and Karimi et al. ([38]) recommended a water accounting system based on Earth observation data (see also www.wateraccounting.org). This paper confirms that some fundamental processes can indeed be derived from satellite measurements, even for vast basins with many ungauged catchments such as the Nile. Water accounting with the use of public domain Earth observation data is feasible if such data can be coupled to a local hydrological model that recognizes essential processes such as drainage, irrigation, recharge, baseflow and lateral groundwater flow. This is an attractive possibility next to the more complex accounting systems proposed by System of Environmental-Economic Accounting for Water SEEAW (United Nations, [86]), Australia (Australian Bureau Statistics, [87]) and Europe (Crouzet et al., [88]).

5. Conclusions

This paper is the first to describe the water balances of the Nile Basin and its 15 major sub-basins, based on Earth Observation data. Excess water flows from the water towers in the mountains and forests in the equatorial Nile belt and the Ethiopian Highlands are quantified. The lateral transport of water throughout the ungauged basin as a result of floods, groundwater movement, small ungauged streams, and withdrawals—planned for irrigation and unplanned for groundwater-dependent ecosystems—are quantified.
Open-access data portals for rainfall and ET are fundamental in making water resources assessment reporting feasible. While there are more than 15 operational rainfall products available, open-access ET layers are currently provided only by the LandSAF product (i.e., TESSEL) and MOD16. ET data layers from GLEAM, SSEBop, Alexi, CRMSET and EEFlux will likely become available within the next year. New high frequency and high resolution spatial data measured by Proba-V, Sentinel and Landsat-8 series satellites will enrich the current satellite data archives and enable refinement of ET and land use products. While sufficient materials have been used to demonstrate the overall accuracy of the results (the RMSE’s and R2 are acceptable, the discharge is congruent with P and ET, the irrigation withdrawals match), further independent scientific ground verification of ET fluxes and rainfall is required in these type of vast and transboundary river basins. Ideally, this should be done for small and instrumented catchments, through the inclusion of more eddy covariance towers and rainfall measurements using recent advances in technologies such as acoustic disdrometers (van de Giesen et al., [89]) or the attenuation of microwave signals between telecommunication towers (e.g., Overeem et al., [90]).
The fluxes, flows and stocks presented in the paper can be used to determine monthly and annual water accounts. The analysis of the Nile basin indicates that most water is produced in rainfed crop areas (69 km3/yr) followed by areas of forest plantations (22 km3/yr). The four agro-ecosystems with the highest net withdrawals are forests (94 km3/yr), wetlands (60 km3/yr), open water areas (46 km3/yr) and irrigated crops (34 km3/yr). Because the net withdrawal by irrigated crops could be validated against third sources, and the total water balance for every sub-basin is closed, all class averaged net withdrawals are believed to be accurate.

Acknowledgement

The authors acknowledge the help and data received from the U.S. Geological Survey Earth Resources Observation and Science Center (SSEBop model) and eLEAF Competence Center (ETLook model). This work has been undertaken as part of the CGIAR Research Program on Water, Land and Ecosystems.

Author Contributions

All authors contributed extensively to this manuscript.

Conflicts of Interest

The authors declare no conflict of interest.

Appendix

Table A1. Comprehensive list of rainfall and ET by land use-land cover class. The classes are coded by the standard defined by Water Accounting Plus (WA+).
WA+ CodeDescription LULCArea ETET PPP-ET P-ET
(km2)(mm/yr)(km3/yr)(mm/yr)(km3/yr)(mm)(km3/yr)
PLU4Sand dunesBare land19601791.417.964.112.6−27.3−5.3
ULU1Closed trees with closed to open shrubsForests98021182.211.61290.312.6108.11.1
ULU2Closed multilayered trees (broadleaved evergreen)Forests71091154.68.21286.49.1131.70.9
ULU3Open trees with open shrubsForests2683601060.7284.71038.7278.7−22.1−5.9
ULU4Closed shrubsSavannah1164801068.7124.51096.5127.727.83.2
ULU5Open general shrubs with closed to open herbaceousSavannah342789845.0289.7866.8297.121.87.5
ULU6Closed shrubs with sparse treesSavannah312953693.8217.1738.6231.144.814.0
ULU7Closed low trees with closed to open shrubsSavannah1204451030.2124.1998.2120.2−32.0−3.9
ULU8Sparse herbaceousPastures419102405.8170.1415.6174.29.84.1
ULU9Closed to very open grasslandPastures22138758.016.8936.420.7178.44.0
ULU10River bankWetlands535751.80.4193.10.1−558.8−0.3
ULU11Bare soil stony (deep soil)Bare land11721333.13.930.73.6−2.3−0.3
ULU12Bare soil stony under reclamationBare land23530386.99.1384.29.0−2.7−0.1
ULU14Bare rock with a thin sand layerBare land39676751.920.639.615.7−12.2−4.9
ULU16RiverOpen water4423967.74.3409.81.8−557.9−2.5
ULU17Natural lakesOpen water850661469.3125.01382.9117.6−86.4−7.4
ULU18Post Flooding Herbaceous Crop, Medium FieldsWetlands250931111.327.9938.423.5−172.9−4.3
ULU19Salt fieldsSinks987297.00.3146.50.1−150.5−0.1
ULU20Closed medium herbaceous on permanently flooded land - brackish waterWetlands112787.40.174.60.0−712.8−0.1
ULU21Bare soilBare land14232559.88.549.57.0−10.3−1.5
ULU24Open general woody with closed to open herbaceous on temporarily flooded landWetlands777431231.095.7980.576.2−250.5−19.5
ULU25Closed trees on permanently flooded land - fresh waterWetlands91661286.611.8894.68.2−392.0−3.6
MLU1Forest PlantationPlantations74806850.063.61150.086.0300.022.4
MLU2Rainfed Tree CropRainfed crops189204869.4164.51142.8216.2273.551.7
MLU4Rainfed Herbaceous CropRainfed crops8952752.46.7350.73.1−401.8−3.6
MLU5Rainfed Herbaceous CropRainfed crops107661541.458.3618.166.576.78.3
MLU6Rainfed Shrub Crop/orchardRainfed crops2634904.12.41103.22.9199.10.5
MLU7Rainfed Herbaceous CropRainfed crops70564732.251.7895.963.2163.711.6
MLU8Rainfed Shrub CropRainfed crops1165866.11.01077.71.3211.60.2
MLU12Dumps / depositsUrban areas3177.70.0147.70.0−30.10.0
MLU14AirportUrban areas94401.90.0360.50.0−41.40.0
MLU16Urban areasUrban areas3490503.31.860.30.2−443.0−1.5
MLU17Rural settlementsUrban areas1153386.00.4372.40.4−13.60.0
MWU1Irrigated Herbaceous Crop Irrigated crops12983744.39.7287.83.7−456.5−5.9
MWU2Irrigated Herbaceous − CerealIrrigated crops9275835.57.7351.23.3−484.3−4.5
MWU2Irrigated Herbaceous Crop (1 add. Crop) Large to Medium Fields – Maize, CloverIrrigated crops5621839.24.741.70.2−797.5−4.5
MWU3Irrigated Orchard, Small Fields - Citrus spp.Irrigated crops17698822.314.6428.37.6−394.0−7.0
MWU4Irrigated Herbaceous Crop (1 add. Crop) Small FieldsIrrigated crops6449921.05.968.80.4−852.2−5.5
MWU5Irrigated Forest Plantation - EucalyptusIrrigated crops2707682.21.875.70.2−606.5−1.6
MWU6Artificial Lakes or ReservoirsOpen water121156.30.0461.90.0−694.40.0
MWU8SnowOpen water59181642.69.746.10.3−1596.5−9.4
MWU10Fish PondOpen water381391.30.166.20.0−325.1−0.1
MWU11Refugee campUrban areas33765.70.0821.90.056.20.0
MWU15Urban Areas VegetatedUrban areas25772.80.0806.50.033.70.0
MWU17Open trees with closed to open herbaceous on temporarily flooded landWetlands5443984.45.41101.46.0117.00.6
MWU18Very open trees with closed to open shrubs on temporarily flooded land - fresh waterWetlands46141105.25.11080.45.0−24.7−0.1
Total 3229039 1987.3 2014.1 26.8

References

  1. Rockstrom, J.; Steffen, W.; Noone, K.; Persson, A.; Chapin, F.S.; Lambin, E.F.; Lenton, T.M.; Scheffer, M.; Folke, C.; Schellnhuber, H.J.; et al. A safe operating space for humanity. Nature 2009, 461, 472–475. [Google Scholar] [CrossRef]
  2. Alexandratos, N.; Bruinsma, J. World Agriculture towards 2030/2050: The 2012 Revision; FAO: Rome, Italy, 2012. [Google Scholar]
  3. Rijsberman, F.R. Water scarcity: Fact or fiction? Agric. Water Manage. 2006, 80, 5–22. [Google Scholar] [CrossRef]
  4. Hilhorst, B.; Burke, J.; Hoogeveen, J.; Fremken, K.; Faures, J.-M.; Gross, D. Information Products for Nile Basin Water Resources Management; FAO: Rome, Italy, 2011; p. 130. [Google Scholar]
  5. Thenkabail, P.S.; Knox, J.W.; Ozdogan, M.; Gumma, M.K.; Congalton, R.G.; Wu, Z.; Milesi, C.; Finkral, A.; Marshall, M.; Mariotto, I.; et al. Assessing future risks to agricultural productivity, water resources and food security—How can remote sensing help? Photogramm. Eng. Remote Sens. 2012, 78, 773–782. [Google Scholar]
  6. Rebelo, L.-M.; Johnston, R.; Karimi, P.; McCornick, P.G. Determining the dynamics of agricultural water use: Cases from Asia and Africa. J. Contemporary Water Res. Education 2014, 153, 79–90. [Google Scholar] [CrossRef]
  7. De Fraiture, C.; Molden, D.; Wichelns, D. Investing in water for food, ecosystems, and livelihoods: An overview of the comprehensive assessment of water management in agriculture. Agric. Water Manage. 2010, 97, 495–501. [Google Scholar] [CrossRef]
  8. Alcamo, J.; Döll, P.; Kaspar, F.; Siebert, S. Global Change and Global Scenarios of Water Use and Availability: An Application of Watergap1.0; Center for Environmental Systems Research (CESR), University of Kassel: Kassel, Germany, 1997. [Google Scholar]
  9. Seckler, D.; Amarasinghe, U.; Molden, D.; Silva, R.d.; Barker, R. World Water Demand and Supply, 1990 to 2025: Scenarios and Issues; International Water Management Institute: Colombo, Sri Lanka, 1998. [Google Scholar]
  10. Shiklomanov, I.A. Appraisal and assessment of world water resources. Water Int. 2000, 25, 11–32. [Google Scholar] [CrossRef]
  11. Wallace, J.S. Increasing agricultural water use efficiency to meet future food production. Agric. Ecosyst. Environ. 2000, 82, 105–119. [Google Scholar] [CrossRef]
  12. Vörösmarty, C.J.; Green, P.; Salisbury, J.; Lammers, R.B. Global water resources: Vulnerability from climate change and population growth. Science 2000, 289, 284–288. [Google Scholar] [CrossRef] [PubMed]
  13. Droogers, P.; Immerzeel, W.W.; Terink, W.; Hoogeveen, J.; Bierkens, M.F.P.; van Beek, L.P.H.; Debele, B. Water resources trends in middle east and north africa towards 2050. Hydrol. Earth Syst. Sci. Discuss. 2012, 16, 3101–3114. [Google Scholar] [CrossRef]
  14. Bosch, J.M.; Hewlett, J.D. A review of catchment experiments to determine the effect of vegetation changes on water yield and evapotranspiration. J. Hydrol. 1982, 55, 3–23. [Google Scholar] [CrossRef]
  15. Smakhtin, V.; Revenga, C.; Döll, P. Taking into Account Environmental Water Requirements in Global-Scale Water Resources Assessments; Comprehensive Assessment Secretariat: Colombo, Sri Lanka, 2004. [Google Scholar]
  16. Seckler, D. The New Era of Water Resources Management: From “Dry” to “Wet” Water Savings; International Irrigation Management Institute: Colombo, Sri Lanka, 1996. [Google Scholar]
  17. Shahin, M. Assessment of Groundwater Resources in Egypt; UNESCO-IHE: Delft, The Netherlands, 1991. [Google Scholar]
  18. Sutcliffe, J.V.; Parks, Y.P. The Hydrology of the Nile; IAHS Press, Institute of Hydrology: Wallingford, UK, 1999; p. 179. [Google Scholar]
  19. Serrat-Capdevila, A.; Valdes, J.B.; Stakhiv, E.Z. Water management applications for satellite precipitation products: Synthesis and recommendations. JAWRA J. Am. Water Resour. Assoc. 2014, 50, 509–525. [Google Scholar] [CrossRef]
  20. Neal, C.M.U.; Cosh, M.H. Remote Sensing and Hydrology; IAHS: Wallingford, UK, 2012. [Google Scholar]
  21. Batelaan, O. Special Issue: Hydrological Remote Sensing. https://www.mdpi.com/journal/remotesensing/special_issues/hydrological (accessed on 15 April 2014).
  22. Nagesh Kumar, D.; Reshmidevi, T.V. Remote sensing applications in water resources. J. Indian Inst. Sci. 2013, 93, 163–187. [Google Scholar]
  23. Karimi, P.; Bastiaanssen, W.G.M. Spatial evapotranspiration, rainfall and land use data in water accounting—Part 1: Review of the accuracy of the remote sensing. Hydrol. Earth Syst. Sci. Discuss. 2014, 11, 1073–1123. [Google Scholar] [CrossRef]
  24. Xie, P.; Arkin, P.A. Global precipitation: A 17-year monthly analysis based on gauge observations, satellite estimates, and numerical model outputs. Bull. Amer. Meteor. Soc. 1997, 78, 2539–2558. [Google Scholar] [CrossRef]
  25. Van den Hurk, B.J.J.M.; Viterbo, P.; Beljaars, A.C.M.; Betts, A.K. Offline Validation of the Era40 Surface Scheme; ECMWF: Reading, UK, 2000; p. 43. [Google Scholar]
  26. Balsamo, G.; Beljaars, A.; Scipal, K.; Viterbo, P.; van den Hurk, B.; Hirschi, M.; Betts, A.K. A revised hydrology for the ecmwf model: Verification from field site to terrestrial water storage and impact in the integrated forecast system. J. Hydrometeorol. 2009, 10, 623–643. [Google Scholar] [CrossRef]
  27. Miralles, D.G.; Holmes, T.R.H.; De Jeu, R.A.M.; Gash, J.H.; Meesters, A.G.C.A.; Dolman, A.J. Global land-surface evaporation estimated from satellite-based observations. Hydrol. Earth Syst. Sci. 2011, 15, 453–469. [Google Scholar] [CrossRef]
  28. Mu, Q.; Heinsch, F.A.; Zhao, M.; Running, S.W. Development of a global evapotranspiration algorithm based on modis and global meteorology data. Remote Sens. Environ. 2007, 111, 519–536. [Google Scholar] [CrossRef]
  29. Kim, H.W.; Hwang, K.; Mu, Q.; Lee, S.O.; Choi, M. Validation of modis 16 global terrestrial evapotranspiration products in various climates and land cover types in Asia. KSCE J. Civ. Eng. 2012, 16, 229–238. [Google Scholar] [CrossRef]
  30. Trambauer, P.; Dutra, E.; Maskey, S.; Werner, M.; Pappenberger, F.; van Beek, L.P.H.; Uhlenbrook, S. Comparison of different evaporation estimates over the african continent. Hydrol. Earth Syst. Sci. 2014, 18, 193–212. [Google Scholar] [CrossRef] [Green Version]
  31. Guerschman, J.P.; Van Dijk, A.I.J.M.; Mattersdorf, G.; Beringer, J.; Hutley, L.B.; Leuning, R.; Pipunic, R.C.; Sherman, B.S. Scaling of potential evapotranspiration with modis data reproduces flux observations and catchment water balance observations across australia. J. Hydrol. 2009, 369, 107–119. [Google Scholar] [CrossRef]
  32. Anderson, M.C.; Kustas, W.P.; Norman, J.M.; Hain, C.R.; Mecikalski, J.R.; Schultz, L.; González-Dugo, M.P.; Cammalleri, C.; d'Urso, G.; Pimstein, A.; et al. Mapping daily evapotranspiration at field to continental scales using geostationary and polar orbiting satellite imagery. Hydrol. Earth Syst. Sci. 2011, 15, 223–239. [Google Scholar] [CrossRef] [Green Version]
  33. Bastiaanssen, W.G.M.; Cheema, M.J.M.; Immerzeel, W.W.; Miltenburg, I.J.; Pelgrum, H. Surface energy balance and actual evapotranspiration of the transboundary indus basin estimated from satellite measurements and the etlook model. Water Resour. Res. 2012, 48, W11512. [Google Scholar] [CrossRef]
  34. Senay, G.B.; Bohms, S.; Singh, R.K.; Gowda, P.H.; Velpuri, N.M.; Alemu, H.; Verdin, J.P. Operational evapotranspiration mapping using remote sensing and weather datasets: A new parameterization for the sseb approach. JAWRA J. Am. Water Resour. Assoc. 2013, 49, 577–591. [Google Scholar] [CrossRef]
  35. Karimi, P.; Molden, D.; Bastiaanssen, W.G.M.; Cai, X. Water accounting to assess use and productivity of water—Evolution of the concept and new frontiers. In Water Accounting: International Approaches to Policy and Decision-Making; Chalmers, K., Godfrey, J., Eds.; Edgar Elger: Cheltenham, UK, 2012; pp. 76–88. [Google Scholar]
  36. Dickinson, R.E. Land surface processes and climate surface albedos and energy-balance. In Advances in Geophysics; Academic Press, Inc.: New York, NY, USA, 1983; Vol. 25; pp. 305–353. [Google Scholar]
  37. Di Gregorio, A.; Jansen, L.J.M. Land Cover Classification System (LCCS), Classification Concepts and User Manual; FAO: Rome, Italy, 2000; pp. 80–99. [Google Scholar]
  38. Karimi, P.; Bastiaanssen, W.G.M.; Molden, D. Water accounting plus (WA+)—A water accounting procedure for complex river basins based on satellite measurements. Hydrol. Earth Syst. Sci. 2013, 17, 2459–2472. [Google Scholar] [CrossRef]
  39. Ahmad, M.-U.-D.; Bastiaanssen, W.G.M.; Feddes, R.A. A new technique to estimate net groundwater use across large irrigated areas by combining remote sensing and water balance approaches, Rechna Doab, Pakistan. Hydrogeol. J. 2005, 13, 653–664. [Google Scholar] [CrossRef]
  40. Van Eekelen, M.; Bastiaanssen, W.G.M.; Jarmain, C.; Jackson, B.; Ferreira, F.; Zaag, P.v.d.; Okello, A.S.; Bosch, J.H.; Dye, P.; Bastidas-Obando, E.; et al. A novel approach to estimate direct and indirect water withdrawals from satellite measurements: A case study from the incomati basin. Agric. Ecosyst. Environ. 2014. submitted. [Google Scholar]
  41. Schreiber, P. Uber die beziehungen zwischen dem niederschlag und der wasserfuhrung der flube in mitteleuropa. Z. Meteorol. 1904, 21, 441–452. [Google Scholar]
  42. Budyko, M.I. Climate and Life; Academic: Orlando, FL, USA, 1974. [Google Scholar]
  43. Gerrits, A.M.J.; Savenije, H.H.G.; Veling, E.J.M.; Pfister, L. Analytical derivation of the budyko curve based on rainfall characteristics and a simple evaporation model. Water Resour. Res. 2009, 45, W04403. [Google Scholar] [CrossRef]
  44. Crétaux, J.F.; Jelinski, W.; Calmant, S.; Kouraev, A.; Vuglinski, V.; Bergé-Nguyen, M.; Gennero, M.C.; Nino, F.; Abarca Del Rio, R.; Cazenave, A.; et al. Sols: A lake database to monitor in the near real time water level and storage variations from remote sensing data. Adv. Space Res. 2011, 47, 1497–1507. [Google Scholar] [CrossRef]
  45. Duan, Z.; Bastiaanssen, W.G.M. Estimating water volume variations in lakes and reservoirs from four operational satellite altimetry databases and satellite imagery data. Remote Sens. Environ. 2013, 134, 403–416. [Google Scholar] [CrossRef]
  46. Syed, T.H.; Famiglietti, J.S.; Rodell, M.; Chen, J.; Wilson, C.R. Analysis of terrestrial water storage changes from GRACE and GLDAS. Water Resour. Res. 2008, 44, W02433. [Google Scholar] [CrossRef]
  47. Klees, R.; Liu, X.; Wittwer, T.; Gunter, B.C.; Revtova, E.A.; Tenzer, R.; Ditmar, P.; Winsemius, H.C.; Savenije, H.H.G. A comparison of global and regional grace models for land hydrology. Sur. Geophys. 2008, 29, 335–359. [Google Scholar] [CrossRef]
  48. Rodell, M.; Velicogna, I.; Famiglietti, J.S. Satellite-based estimates of groundwater depletion in India. Nature 2009, 460, 999–1002. [Google Scholar] [CrossRef] [PubMed]
  49. Funk, C.C.; Peterson, P.J.; Landsfeld, M.F.; Pedreros, D.H.; Verdin, J.P.; Rowland, J.D.; Romero, B.E.; Husak, G.J.; Michaelsen, J.C.; Verdin, A.P. A Quasi-Global Precipitation Time Series for Drought Monitoring; U.S. Geological Survey Data Series 832 ed. 2014.
  50. Karimi, P.; Molden, D.; Notenbaert, A.; Peden, D. Nile basin farming systems and productivity. In The Nile River Basin, Water, Agriculture, Governance and Livelihoods; Chalmers, K., Godfrey, J., Eds.; Edgar Elger: Cheltenham, UK, 2012; pp. 133–153. [Google Scholar]
  51. Duan, Z.; Bastiaanssen, W.G.M. First results from version 7 TRMM 3b43 precipitation product in combination with a new downscaling–calibration procedure. Remote Sens. Environ. 2013, 131, 1–13. [Google Scholar] [CrossRef]
  52. Hunink, J.E.; Immerzeel, W.W.; Droogers, P. A high-resolution precipitation 2-step mapping procedure (hip2p): Development and application to a tropical mountainous area. Remote Sens. Environ. 2014, 140, 179–188. [Google Scholar] [CrossRef]
  53. Alemu, H.; Senay, G.B.; Kaptue, A.T.; Kovalskyy, V. Evapotranspiration variability and its association with vegetation dynamics in the Nile Basin, 2002–2011. Remote Sens. 2014, 6, 5885–5908. [Google Scholar] [CrossRef]
  54. Senay, G.B.; Gowda, P.H.; Bohms, S.; Howell, T.A.; Friedrichs, M.; Marek, T.H.; Verdin, J.P. Evaluating the ssebop approach for evapotranspiration mapping with landsat data using lysimetric observations in the semi-arid texas high plains. Hydrol. Earth Syst. Sci. Discuss. 2014, 11, 723–756. [Google Scholar] [CrossRef]
  55. Velpuri, N.M.; Senay, G.B.; Singh, R.K.; Bohms, S.; Verdin, J.P. A comprehensive evaluation of two MODIS evapotranspiration products over the conterminous united states: Using point and gridded fluxnet and water balance ET. Remote Sens. Environ. 2013, 139, 35–49. [Google Scholar] [CrossRef]
  56. Singh, R.; Senay, G.; Velpuri, N.; Bohms, S.; Scott, R.; Verdin, J. Actual evapotranspiration (water use) assessment of the colorado river basin at the landsat resolution using the operational simplified surface energy balance model. Remote Sens. 2014, 6, 233–256. [Google Scholar] [CrossRef]
  57. Senay, G.B.; Budde, M.E.; Verdin, J.P. Enhancing the simplified surface energy balance (SSEB) approach for estimating landscape ET: Validation with the METRIC model. Agric. Water Manage. 2011, 98, 606–618. [Google Scholar] [CrossRef]
  58. Gowda, P.H.; Senay, G.B.; Colaizzi, P.D.; Howell, T.A. Lysimeter validation of the simplified surface energy balance (SSEB) approach for estimating actual ET. Trans. ASABE 2009, 25, 665–669. [Google Scholar]
  59. Senay, G.B.; Velpuri, M.N.; Bohms, S.; Demissie, Y.; Gebremichael, M. Understanding the hydrologic sources and sinks in the Nile Basin using multi-source climate and remote sensing data sets. Water Resour. Res. 2014. submitted. [Google Scholar]
  60. Allen, R.; Tasumi, M.; Trezza, R. Satellite-based energy balance for mapping evapotranspiration with internalized calibration (METRIC)—model. J. Irrig. . Drain. Eng. 2007, 133, 380–394. [Google Scholar] [CrossRef]
  61. Bastiaanssen, W.G.M.; Menenti, M.; Feddes, R.A.; Holtslag, A.A.M. A remote sensing surface energy balance algorithm for land (SEBAL). 1. Formulation. J. Hydrol. 1998, 212–213, 198–212. [Google Scholar] [CrossRef]
  62. Immerzeel, W.W.; Droogers, P.; Terink, W.; Hoogeveen, J.; Hellegers, P.J.J.G.; Bierkens, M.F.P.; Beek, L.P.H.v. Middle-East and Northern Africa, Water Outlook; FutureWater: Wageningen, The Netherlands, 2011; p. 136. [Google Scholar]
  63. Bastiaanssen, W.G.M.; Hoekman, D.H.; Roebeling, R.A. A Methodology for the Assessment of Surface Resistance and Soil Water Storage Variability at Mesoscale Based on Remote Sensing Measurements: A Case Study with Hapex-Efeda Data; International Association of Hydrological Sciences: Wallingford, UK, 1994. [Google Scholar]
  64. Mohamed, Y.A.; Bastiaanssen, W.G.M.; Savenije, H.H.G. Spatial variability of evaporation and moisture storage in the swamps of the upper nile studied by remote sensing techniques. J. Hydrol. 2004, 289, 145–164. [Google Scholar] [CrossRef]
  65. Allen, R.G.; Pereira, L.S.; Raes, D.; Smith, M. Crop Evapotranspiration—Guidelines for Computing Crop Water Requirements; FAO: Rome, Italy, 1998. [Google Scholar]
  66. Kirby, M.; Eastham, J.; Mainuddin, M. Water-Use Accounts in CPWF Basins: Simple Water-Use Accounting of the Nile Basin; The CGIAR Challenge Program on Water and Food: Colombo, Sri Lanka, 2010. [Google Scholar]
  67. NWRP Project. National Water Resources Plan 2017; Arab Republic of Egypt, Ministry of Water Resources and Irrigation: Cairo, Egypt, 2005. [Google Scholar]
  68. Dai, A.; Trenberth, K.E. New estimates of continental discharge and oceanic freshwater transport. In Proceedings of JP1.11 AMS Symposium on Observing and Understanding the Variability of Water in Weather and Climate, Long Beach, CA, USA, 9–13 February 2003.
  69. Awulachew, S.R.; Lisa-Maria; Molden, David. The nile basin: Tapping the unmet agricultural potential of nile waters. Water Int. 2010, 35, 623–654. [Google Scholar] [CrossRef]
  70. El-Shabrawy, G.M. Lake Nasser-Nubia. In The Nile: Origin, Environments, Limnology and Human Use; Dumont, H.J., Ed.; Springer: Dordrecht, The Netherlands, 2009; pp. 125–156. [Google Scholar]
  71. Johnston, R. Availability of water for agriculture in the nile basin. In The Nile River Basin, Water, Agriculture, Governance and Livelihoods; Awulachew, S.B., Smakhtin, V., Molden, D., Peden, D., Eds.; Routledge - Earthscan: Abingdon, UK, 2012; pp. 61–83. [Google Scholar]
  72. MacAlister, C.; Pavelic, P.; Tindimugaya, C.; Ayenew, T.; Ibrahim, M.E.; Meguid, M.A. Overview of groundwater in the nile river basin. In The Nile River Basin, Water, Agriculture, Governance and Livelihoods; Awulachew, S.B., Smakhtin, V., Molden, D., Peden, D., Eds.; Routledge - Earthscan: Abingdon, UK, 2012; pp. 186–211. [Google Scholar]
  73. Bonsor, H.C.; Mansour, M.M.; MacDonald, A.M.; Hughes, A.G.; Hipkin, R.G.; Bedada, T. Interpretation of grace data of the nile basin using a groundwater recharge model. Hydrol. Earth Syst. Sci. Discuss. 2010, 7, 4501–4533. [Google Scholar] [CrossRef] [Green Version]
  74. Elsawwaf, M.; Feyen, J.; Batelaan, O.; Bakr, M. Groundwater–surface water interaction in lake Nasser, Southern Egypt. Hydrol. Processes 2014, 28, 414–430. [Google Scholar] [CrossRef]
  75. Faures, J.-M.; Svendsen, M.; Turral, H. Reinventing irrigation. In Water for Food, Water for Life, a Comprehensive Assessment of Water in Agriculture; Molden, D.J., Ed.; IWMI and Earthscan: London, UK, 2007; pp. 353–394. [Google Scholar]
  76. Dastane, N.G. Effective Rainfall in Irrigated Agriculture; FAO: Rome, Italy, 1974. [Google Scholar]
  77. Rebelo, L.-M.; McCartney, M. Wetlands of the Nile Basin, distributions, functions and contribution to livelihoods. In The Nile River Basin: Water, Agriculture, Governance and Livelihoods; Awulachew, S.B., Smakhtin, V., Molden, D., Peden, D., Eds.; Routledge - Earthscan: Abingdon, UK, 2012; pp. 212–228. [Google Scholar]
  78. Awulachew, S.B.; Demissie, S.S.; Hagos, F.; Erkossa, T.; Peden, D. Water management intervention analysis in the nile basin. In The Nile River Basin: Water, Agriculture, Governance and Livelihoods; Awulachew, S.B., Smakhtin, V., Molden, D., Peden, D., Eds.; Routledge - Earthscan: Abingdon, UK, 2012; pp. 292–316. [Google Scholar]
  79. Bastiaanssen, W.; Perry, C. Agricultural Water Use and Water Productivity in the Large Scale Irrigation (LSI) Schemes of the Nile Basin; Nile Basin Initiative (NBI): Entebbe, Uganda, 2009. [Google Scholar]
  80. FAO. Assessment of the Irrigation Potential of the Nile Basin; Land and Water Division, FAO: Rome, Italy, 1997; p. 41. [Google Scholar]
  81. Allen, R.G.; Burnett, B.; Kramber, W.; Huntington, J.; Kjaersgaard, J.; Kilic, A.; Kelly, C.; Trezza, R. Automated calibration of the metric-landsat evapotranspiration process. JAWRA J. Am. Water Resour. Assoc. 2013, 49, 563–576. [Google Scholar] [CrossRef]
  82. Morton, C.G.; Huntington, J.L.; Pohll, G.M.; Allen, R.G.; McGwire, K.C.; Bassett, S.D. Assessing calibration uncertainty and automation for estimating evapotranspiration from agricultural areas using metric. JAWRA J. Am. Water Resour. Assoc. 2013, 49, 549–562. [Google Scholar] [CrossRef]
  83. Van der Ent, R.J.; Savenije, H.H.G.; Schaefli, B.; Steele-Dunne, S.C. Origin and fate of atmospheric moisture over continents. Water Resour. Res. 2010, 46, W09525. [Google Scholar]
  84. De Lange, R.; Beck, R.; van de Giesen, N.; Friesen, J.; de Wit, A.; Wagner, W. Scatterometer-derived soil moisture calibrated for soil texture with a one-dimensional water-flow model. IEEE Trans. Geosci. Remote Sens. 2008, 46, 4041–4049. [Google Scholar] [CrossRef]
  85. Bastiaanssen, W.G.M. Water Accountants: De Nieuwe Generatie Waterbeheercontroleurs, Intreerede; Delft University of Technology: Delft, The Netherlands, 2009. [Google Scholar]
  86. UN. System of Environmental Economic Accounting for Water; United Nations: Geneva, Switzerland, 2007. [Google Scholar]
  87. ABS. Water Account Australia 2000-01; Australian Bureau of Statistics: Canberra, ACT, Australia, 2004.
  88. Crouzet, P.; Gall, G.L.; Campling, P.; Basso, M.; Weber, J.L.; Gomez, O.; Kurnik, B. Results and Lessons from Implementing the Water Assets Accounts in the Eea Area, from Concept to Production; European Environmental Agency (EEA): Copenhagen, Denmark, 2013. [Google Scholar]
  89. Van de Giesen, N.; Hut, R.; Selker, J. The Trans-African Hydro-Meteorological Observatory (TAHMO). Wiley Interdisciplinary Reviews: Water 2014, 1, 341–348. [Google Scholar]
  90. Overeem, A.; Leijnse, H.; Uijlenhoet, R. Country-wide rainfall maps from cellular communication networks. Proc. Natl. Acad. Sci. USA 2013, 110, 2741–2745. [Google Scholar] [CrossRef] [PubMed]

