1. Introduction
In this paper, the authors present a recent integrated survey carried out on an archaeological urban site, widely free from buildings, except some provisional structures related to the excavated parts.
Geophysical and non-invasive prospecting techniques over archaeological sites are becoming the main protocol for intervention and excavation planning. Reliable and commonly applied methods include electric resistivity tomography or imaging (ERT/ERI), which allows high resolutions and a good depth of investigation [
1,
2,
3]. For faster surveys, the electrical methods can be used in a moving electrode array configuration, obtaining only one apparent resistivity value at a fixed depth at multiple locations over the site for each acquisition setting [
2,
4], or in continuous land streaming configuration (which can even be done with a towing vehicle), providing tomographic results over extensive areas [
5]. Magnetic mapping (MM) and frequency domain electromagnetic methods (FDEM) are often useful for mapping soil properties and archaeological artifacts at various depths (depending on the coil configuration), but are generally heavily influenced by anthropic noise in urban contexts [
6,
7,
8,
9]. Time domain electromagnetic (TDEM) and very low frequency (VLF) methods have occasionally been used to detect archaeological features, but they have not enough resolution for an expeditious survey and may also be influenced by urban electromagnetic noise [
3].
The best geophysical method for archaeological survey is georadar or ground penetrating radar (GPR) technology, which ensures very good spatial resolution, the possibility to operate in irregular areas, high speed working and is rarely influenced by anthropic noise [
10,
11,
12,
13,
14,
15,
16,
17,
18,
19,
20,
21,
22].
Recently, remote sensing technologies have been used in combination with ground-based geophysical methods to identify areas more fruitful for detailed terrestrial surveys [
23]. Early remote sensing surveys utilized aerial photography [
24], and subsequently, the multispectral sensors have been widely used to detect buried structures [
25,
26,
27,
28]. More recently, airborne laser imaging detection and ranging (LiDAR) [
26,
29,
30] and satellite radar [
31,
32,
33] technologies have also been able to identify archaeological features. Thermal studies have been proposed for using satellite sensors [
34] and, recently, low altitude sensors [
35,
36].
Thermal measurements are generally made for detecting anomalies in the thermal behavior of buildings and monuments [
37] using terrestrial cameras. As shown by Piga [
38] and previously by Dabas and Tabbagh [
39], the time domain measurements are better at giving information for the thermal characteristics of deeper objects. In fact, the depth of the investigation of the method depends in part on the duration and intensity of the flux variation; as well as the volume of the structures and on the thermal-inertia contrast with their surrounding medium. Even with a continuous energization of 10 W/m
2 lasting for seven days, the depth reached was on the order of 1 m or a little more [
39]. The buried walls display as being cold.
In the present study, a survey has been carried out in a passive energization process, using the natural diurnal succession of heating and cooling.
The low altitude thermal method was chosen in order to verify its capabilities on a site already covered by a reliable geophysical survey. By this integration, we can evaluate for the case study the depth of the influence of possible archaeological targets, such as buried tombs or walls belonging to the previous newer buildings.
2. Materials, Methods and Results
2.1. Archaeological Framework (by Elisa Pompianu)
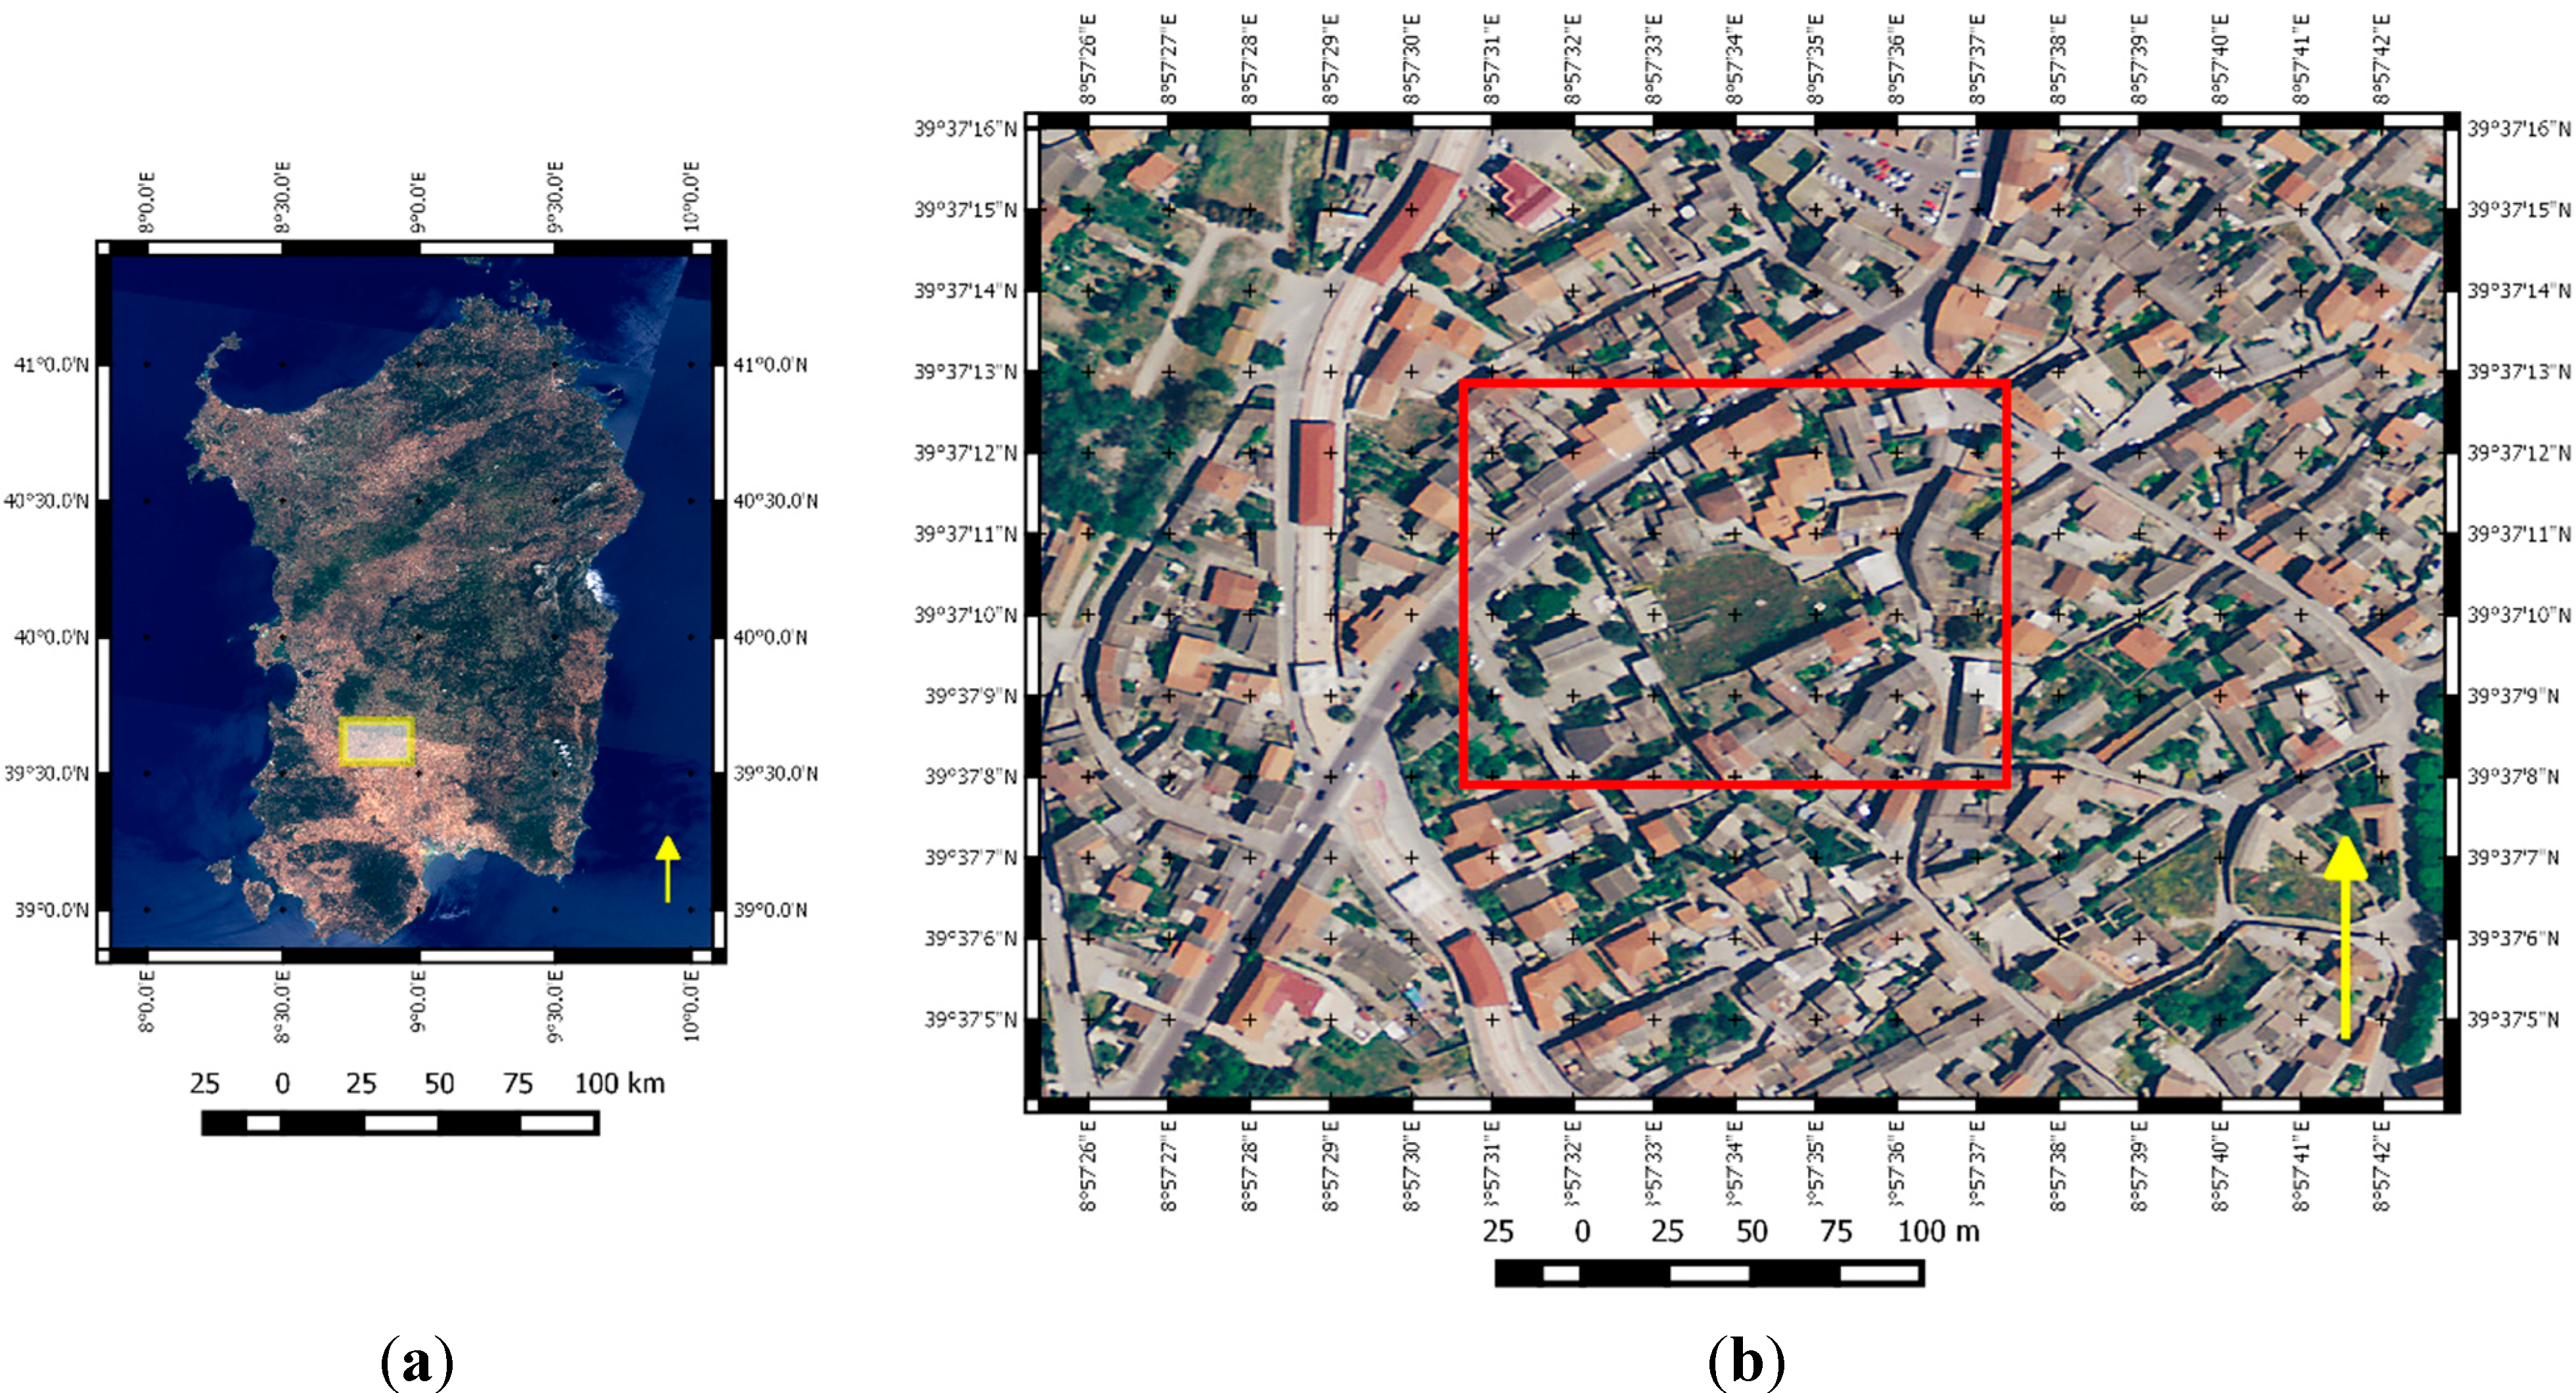
Archaeological research has been carried out in the old town of Villamar, located about 50 km from Cagliari, the capital city of Sardinia (Italy), where Punic period tombs have been found in the courtyards of old residences (
Figure 1a). Publications and research on this test site date back to 1984 and 1991–1992 and were made by the Soprintendenza Archeologica per le Province di Cagliari e Oristano directed by Giovanni Ugas [
40]. The systematic investigations were directed by Piero Bartoloni and by Elisa Pompianu thanks to the involvement of the Municipality of Villamar, in collaboration with the University of Sassari. After the demolition of some of these residences, an area of about 2500 m
2 was reserved as an archaeological park (
Figure 1b).
Figure 1.
(a) Localization of Villamar town in Sardinia; (b) localization of the test site.
Figure 1.
(a) Localization of Villamar town in Sardinia; (b) localization of the test site.
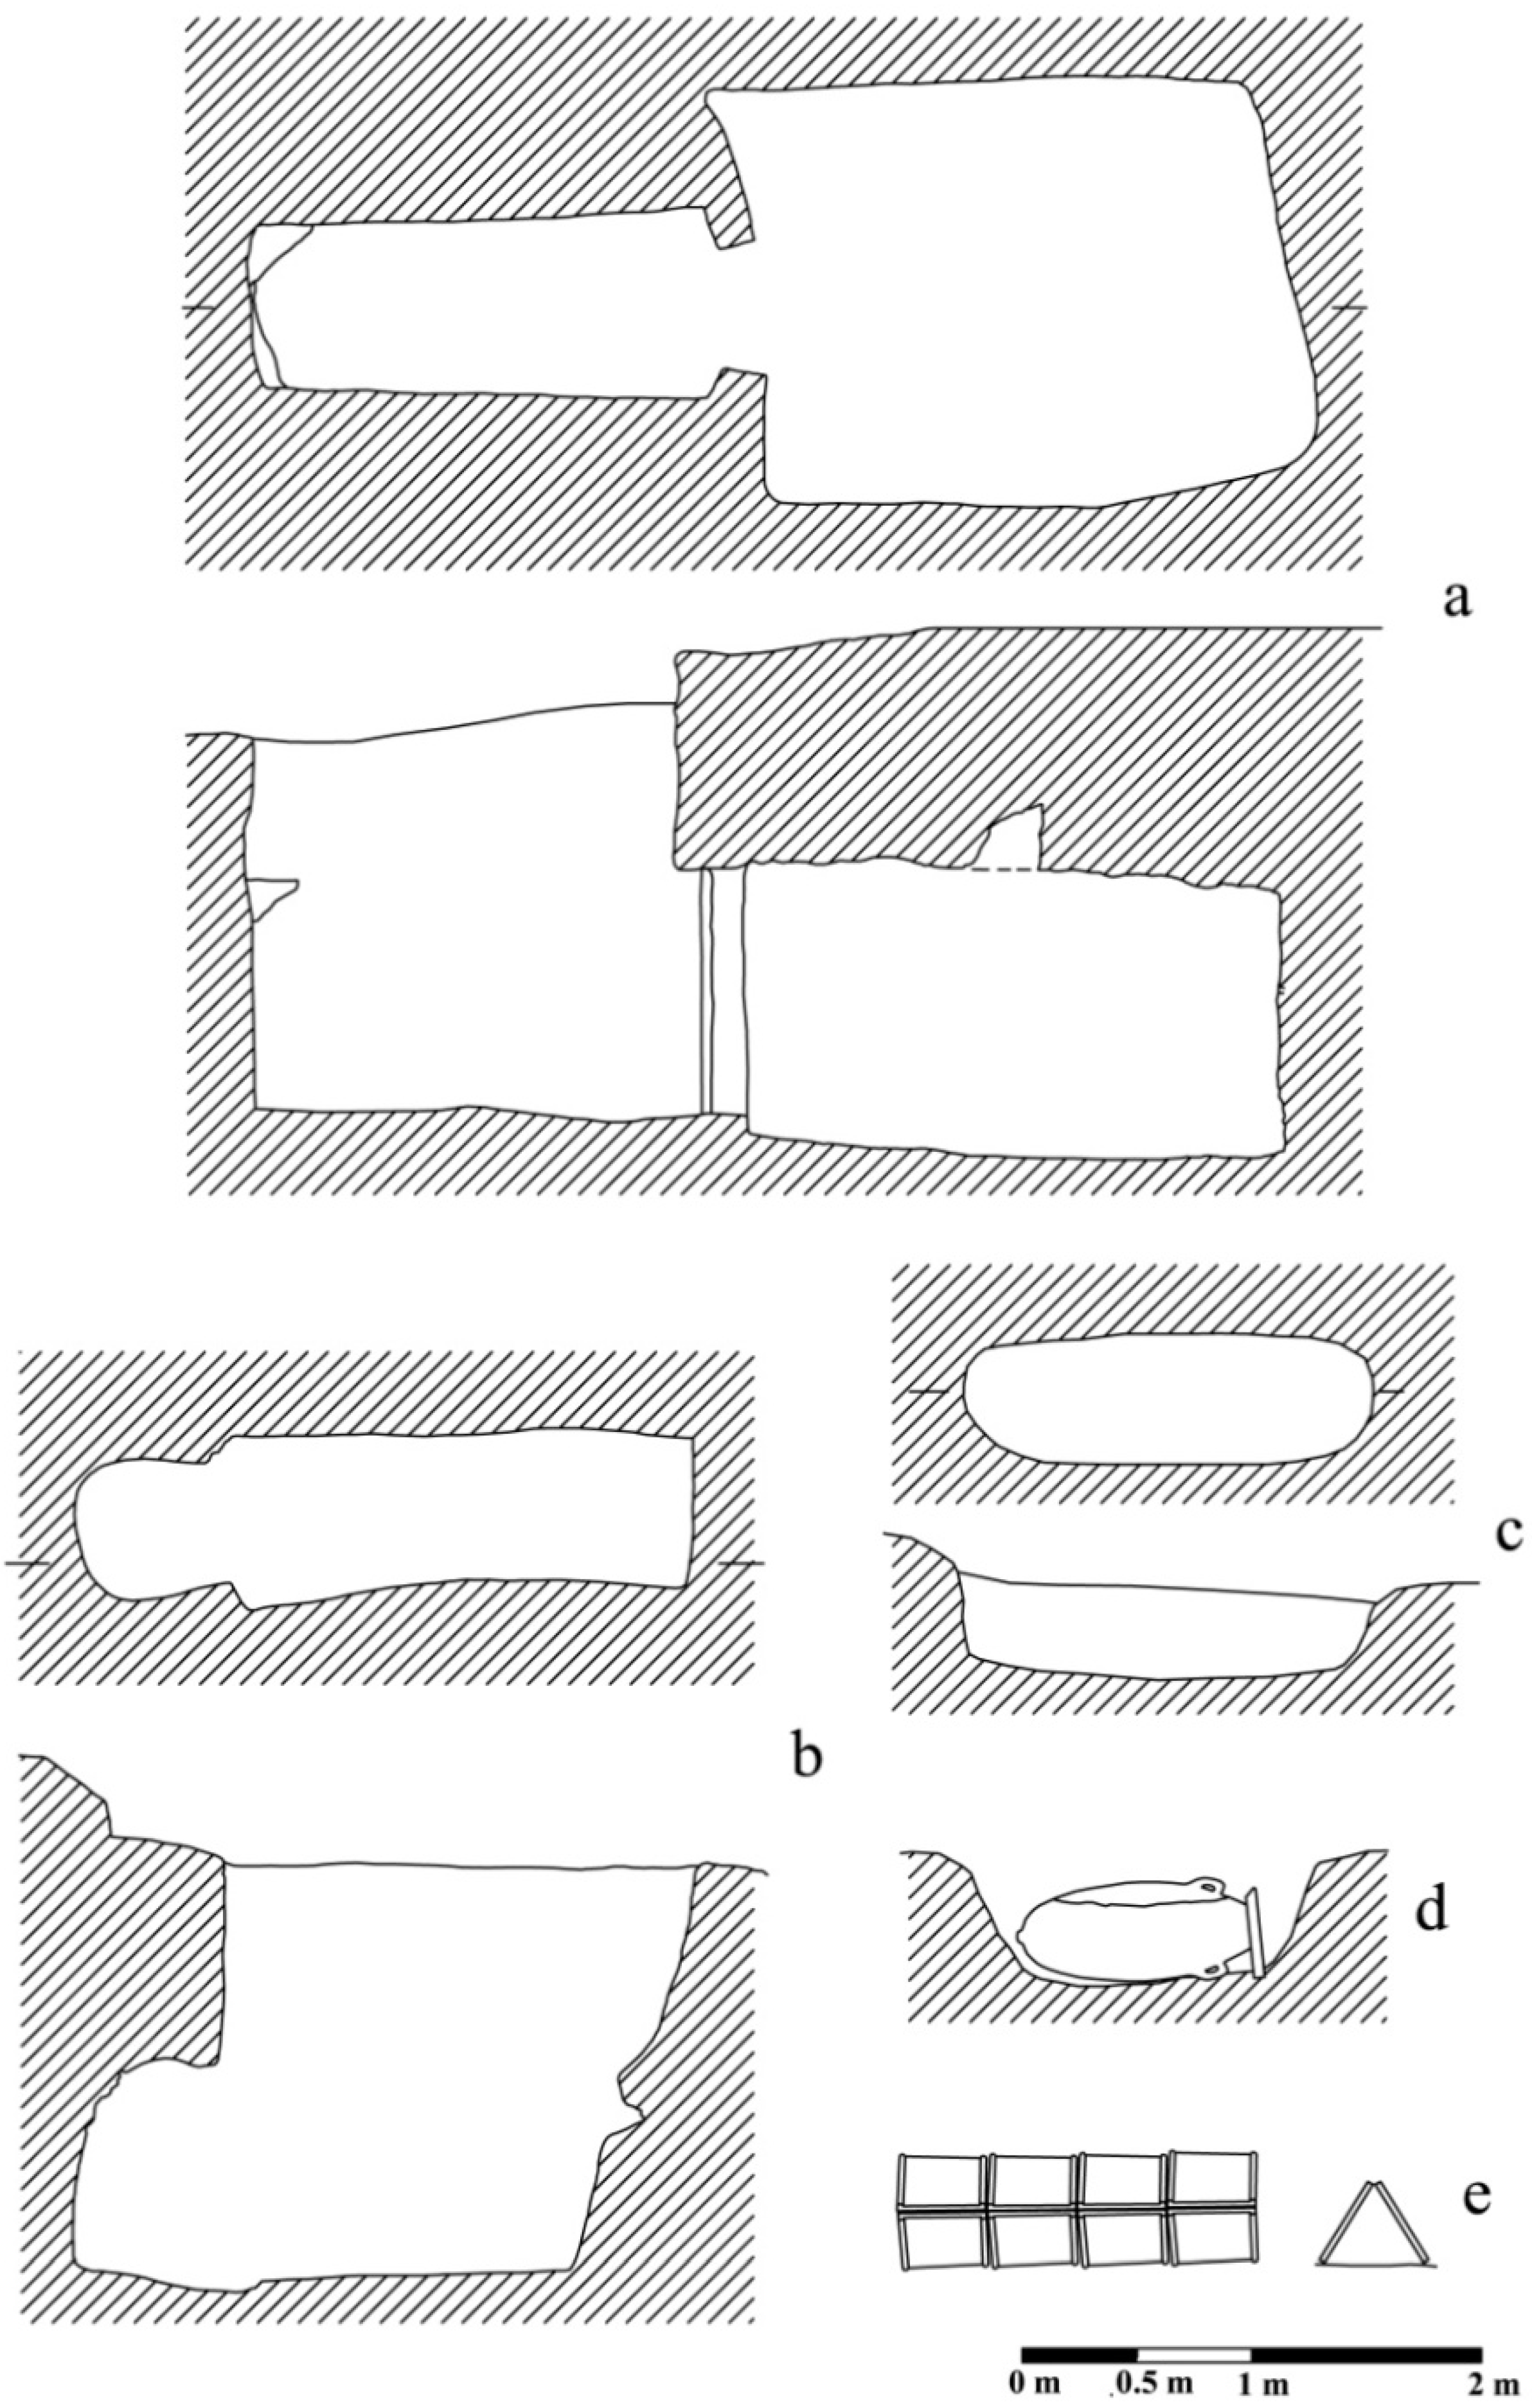
Until today, the investigations have allowed for defining a Punic funerary installation in use between the 4th and the 2nd century BC, with different typologies of graves, mainly oriented in the direction north-east/south-west. The attested types of tombs are a hypogeum chamber, a pit (excavated in the ground or in the bank of sandstone), an
enchytrismós, a stone cist and at the “capuchin” (
Figure 2).
Figure 2.
(a) Tomb with a hypogeum chamber, with the plan and cross-section; (b) tomb in a stone cist, with the plan and cross-section; (c) tomb in a pit, with the plan and cross-section; (d) tomb in an enchytrismós, with the cross-section; (e) tomb at the “capuchin”, with the plan and cross-section.
The model of the hypogeum tombs (
Figure 2a,b), despite limited investigations, show recurrent characteristics: Generally, the access presents at least 2 m deep vertical with walls and no staircases for the descent, but sometimes, there is a natural rung in the rock near an angle of the bore. On the surface, two offsets are often derived on the long sides of the bore, which are functional for the positioning of the covering slabs [
40].
Since we do not know the archaeological record of the past investigations [
40], it could be that the access wells to the burial chamber, of a quadrangular shape, were generally filled with sediments comparatively recently, while in ancient times, the well would have been partially empty. This could facilitate the reuse of the chamber to accommodate subsequent burials, which sometimes were often placed in the same well [
40]. Furthermore, the chamber has an almost quadrangular shape, so that a single bore would give access to two opposite chambers.
Sometimes, a niche of an ellipsoidal form (
Figure 2b) was used to receive the incinerated remains of the dead inside ceramic urns and occluded behind ceramic tiles [
40], as seen at Monte Luna of Senorbì [
41]. Generally, the burial chamber has a small filling of soil, mostly due to the reopening of the door or from infiltration through the same entry.
Alternatively, the dead were deposed in simple pits dug in the sandstone bedrock or in the soil (
Figure 2c). In this case, they were placed inside a wall of stone slabs arranged vertically, of the coffer grave type, on which were placed the covering slabs, like others widely recorded in the Punic period [
42], such as Nora and San Sperate [
43,
44,
45]. The
enchytrismoi housed the infant burials, consisting of an amphora cut along its length or at its neck, horizontally placed in small pit very close together (
Figure 2d). In the capuchin tomb, the dead were laid on the bare ground or on the floor covered with tiles, and then, above, there was a pitched roof of tiles (
Figure 2e), according to the tradition of Greek origin that is widespread in Sardinia, especially in the Roman imperial age.
The materials documented in the grave goods of Villamar conform to the Hellenistic Sardinian style, with particular similarity with the funerary contexts of Tuvixeddu of Cagliari and its hinterland [
46]. Other affinities, especially architectural, unite the necropolis of Villamar to those of Senorbì [
41], Tuvixeddu [
47,
48,
49] and Nora [
43].
The scientific contribution of the necropolis of Villamar of Punic Sardinia is very important, both for the burials, which in recent years have had a significant increase of data [
50,
51,
52,
53], and for the knowledge of the political organization of the territories under the Carthaginian domination. In fact, in the global evidence of rural Punic Sardinia, in the 4th century BC, there can be seen a consolidation of social and economic structures, due to the efficient organization of the exploitation of the local resources, such as agriculture [
54]. The importance of the population of these territories also helps us to better understand this Punic ethnic identity and then allows the integration process, which may have involved immigrant groups with the indigenous population that already lived in the territories.
2.2. Georadar Survey
The GPR survey was carried out in October 2008, along parallel lines orientated SE-NW and SW-NE with a 50-cm line spacing. Several encumbrances to survey existed (earth mounds, waste and shrubs), and so, the area under investigation was divided into sub-areas.
The investigated area is delineated by the scheme shown in
Figure 3. The “white” parts are occupied by the excavations, or waste, or piles of brushwood. It was not physically possible to perform exploration in them.
The radar system equipment was based on an antenna DAD K2 TR 200 by Ingegneria Dei Sistemi (IDS), whose central frequency is 200 MHz. The system has been used in monostatic single reflection mode, with acquisition controlled by a survey wheel with spatial sampling of 2.4 cm. On the radar system, an integrated differential global positioning system (DGPS) with spatial EGNOS (European Geostationary Navigation Overlay System) differential corrections was integrated, making it possible to have manual metric relative positioning for the orthogonal distances (X-Y) and automatic absolute positioning (latitude-longitude).
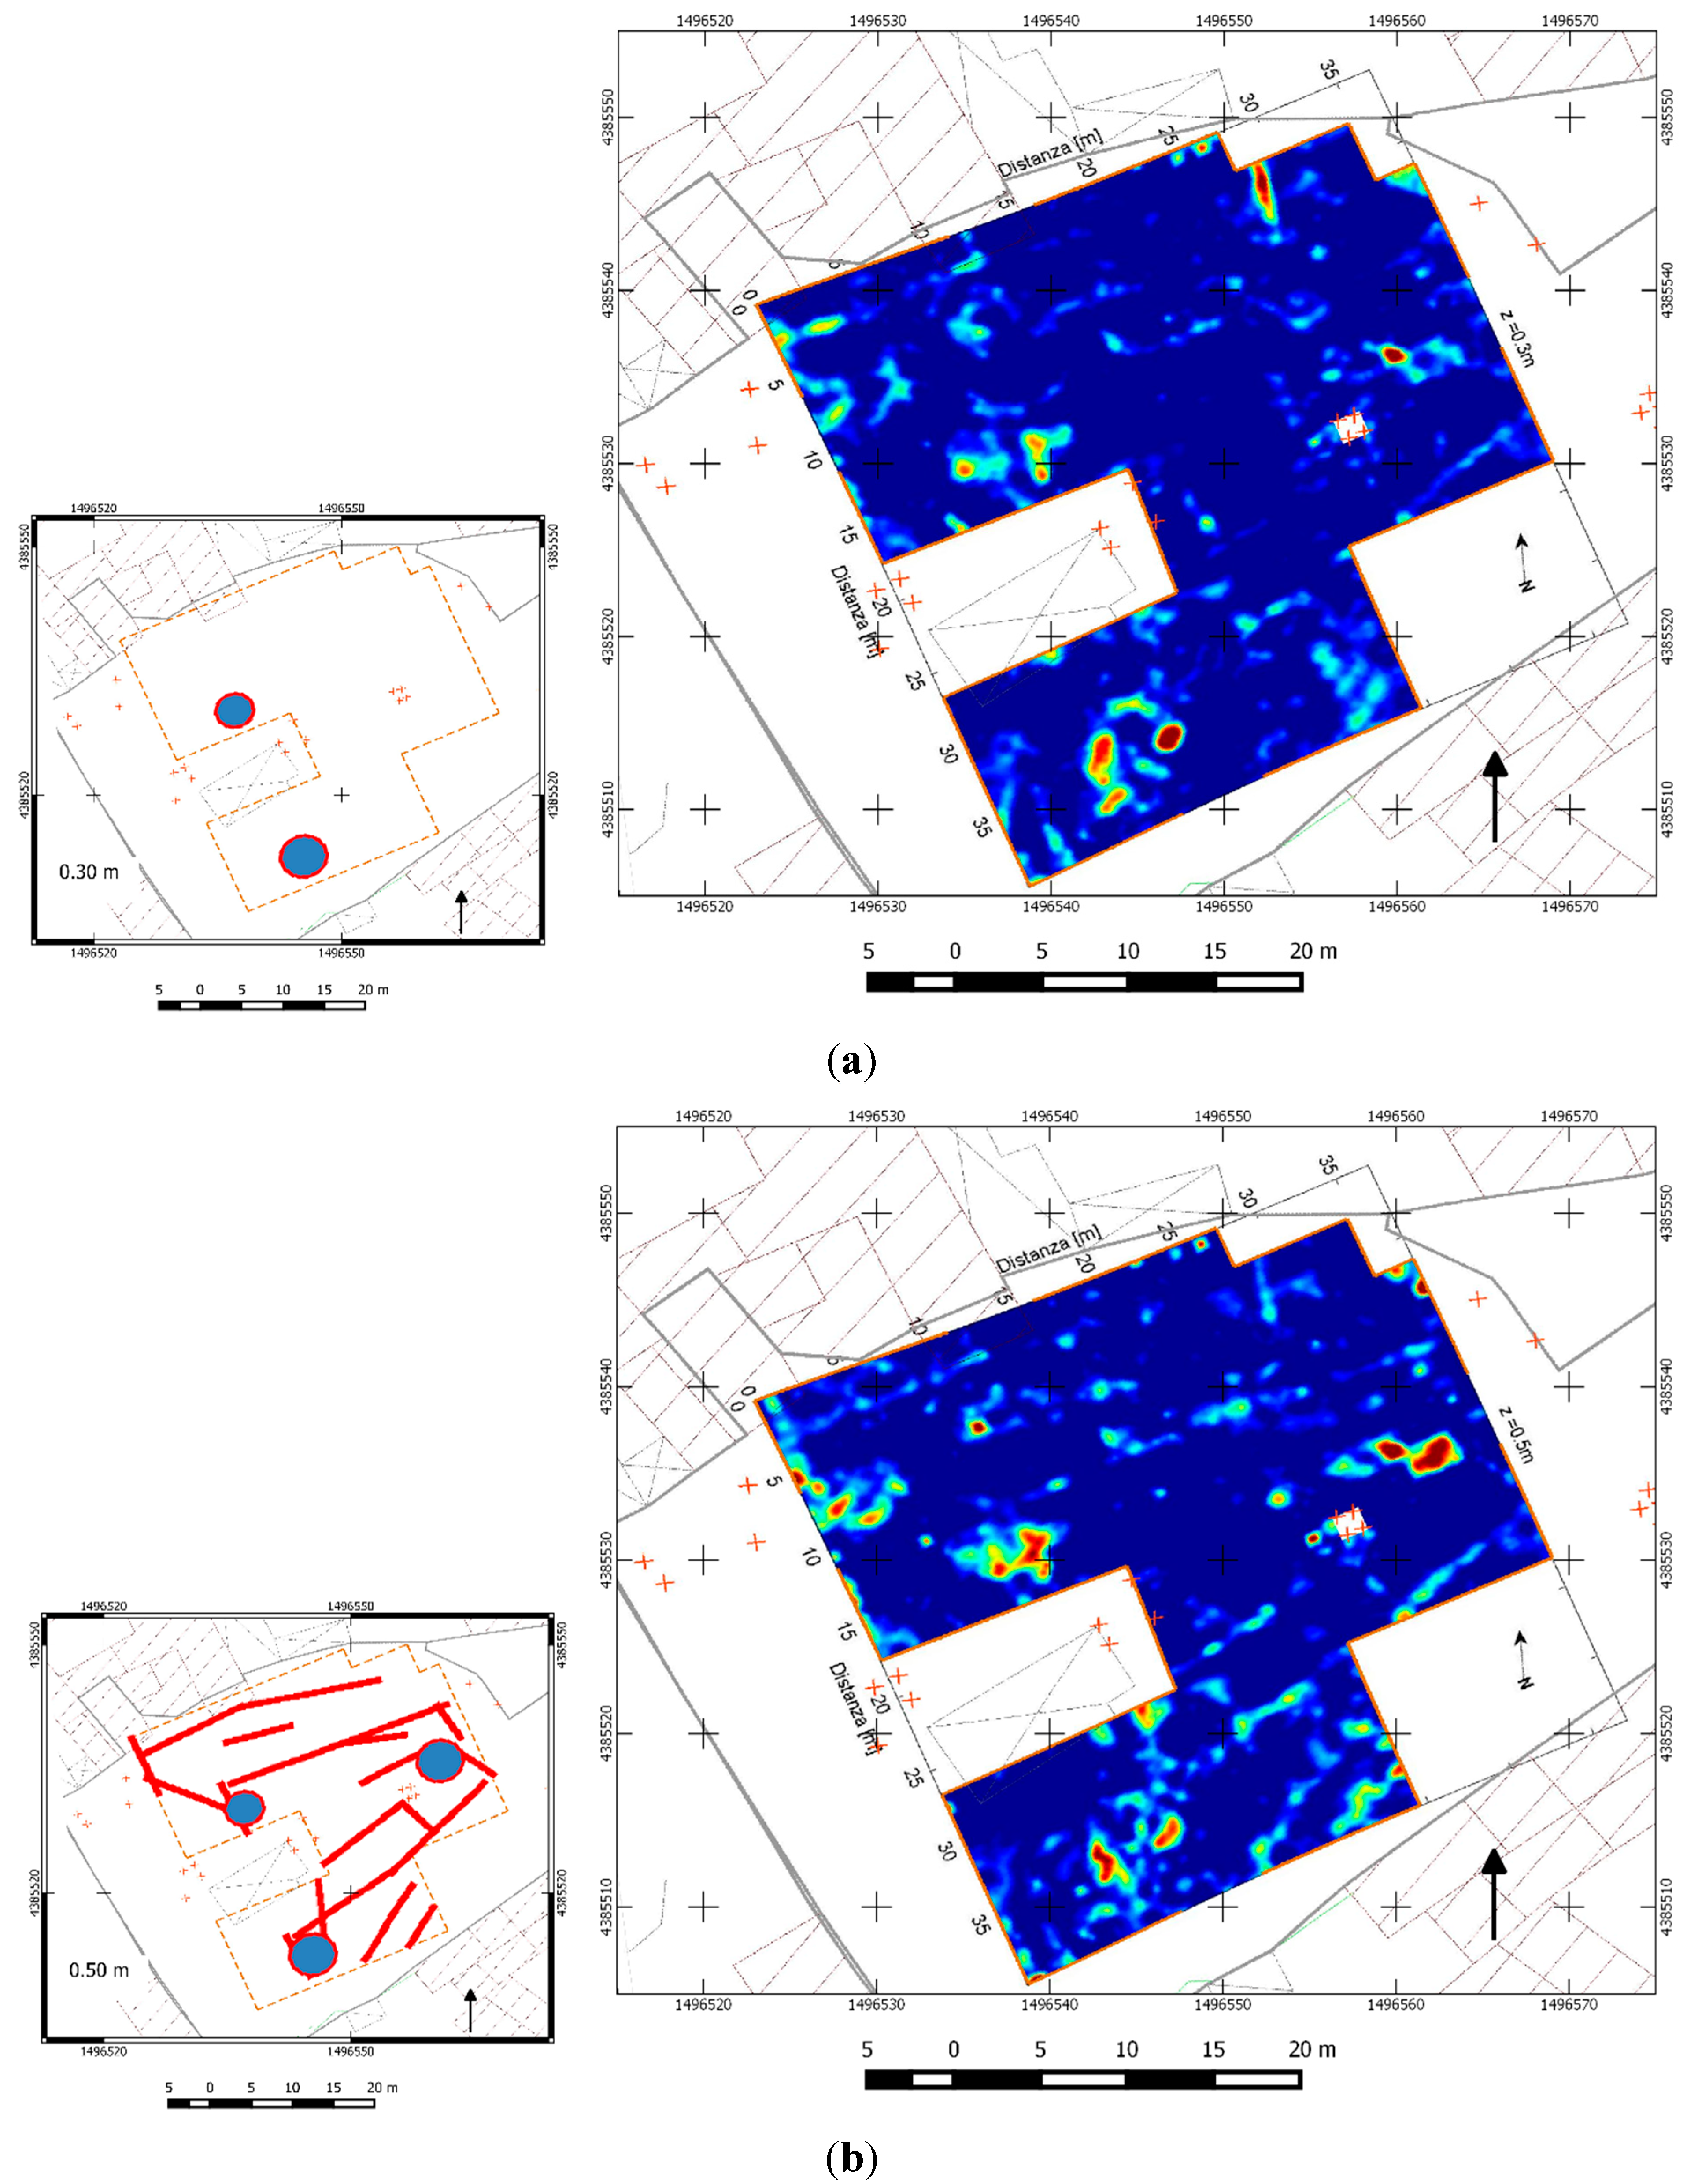
Figure 3.
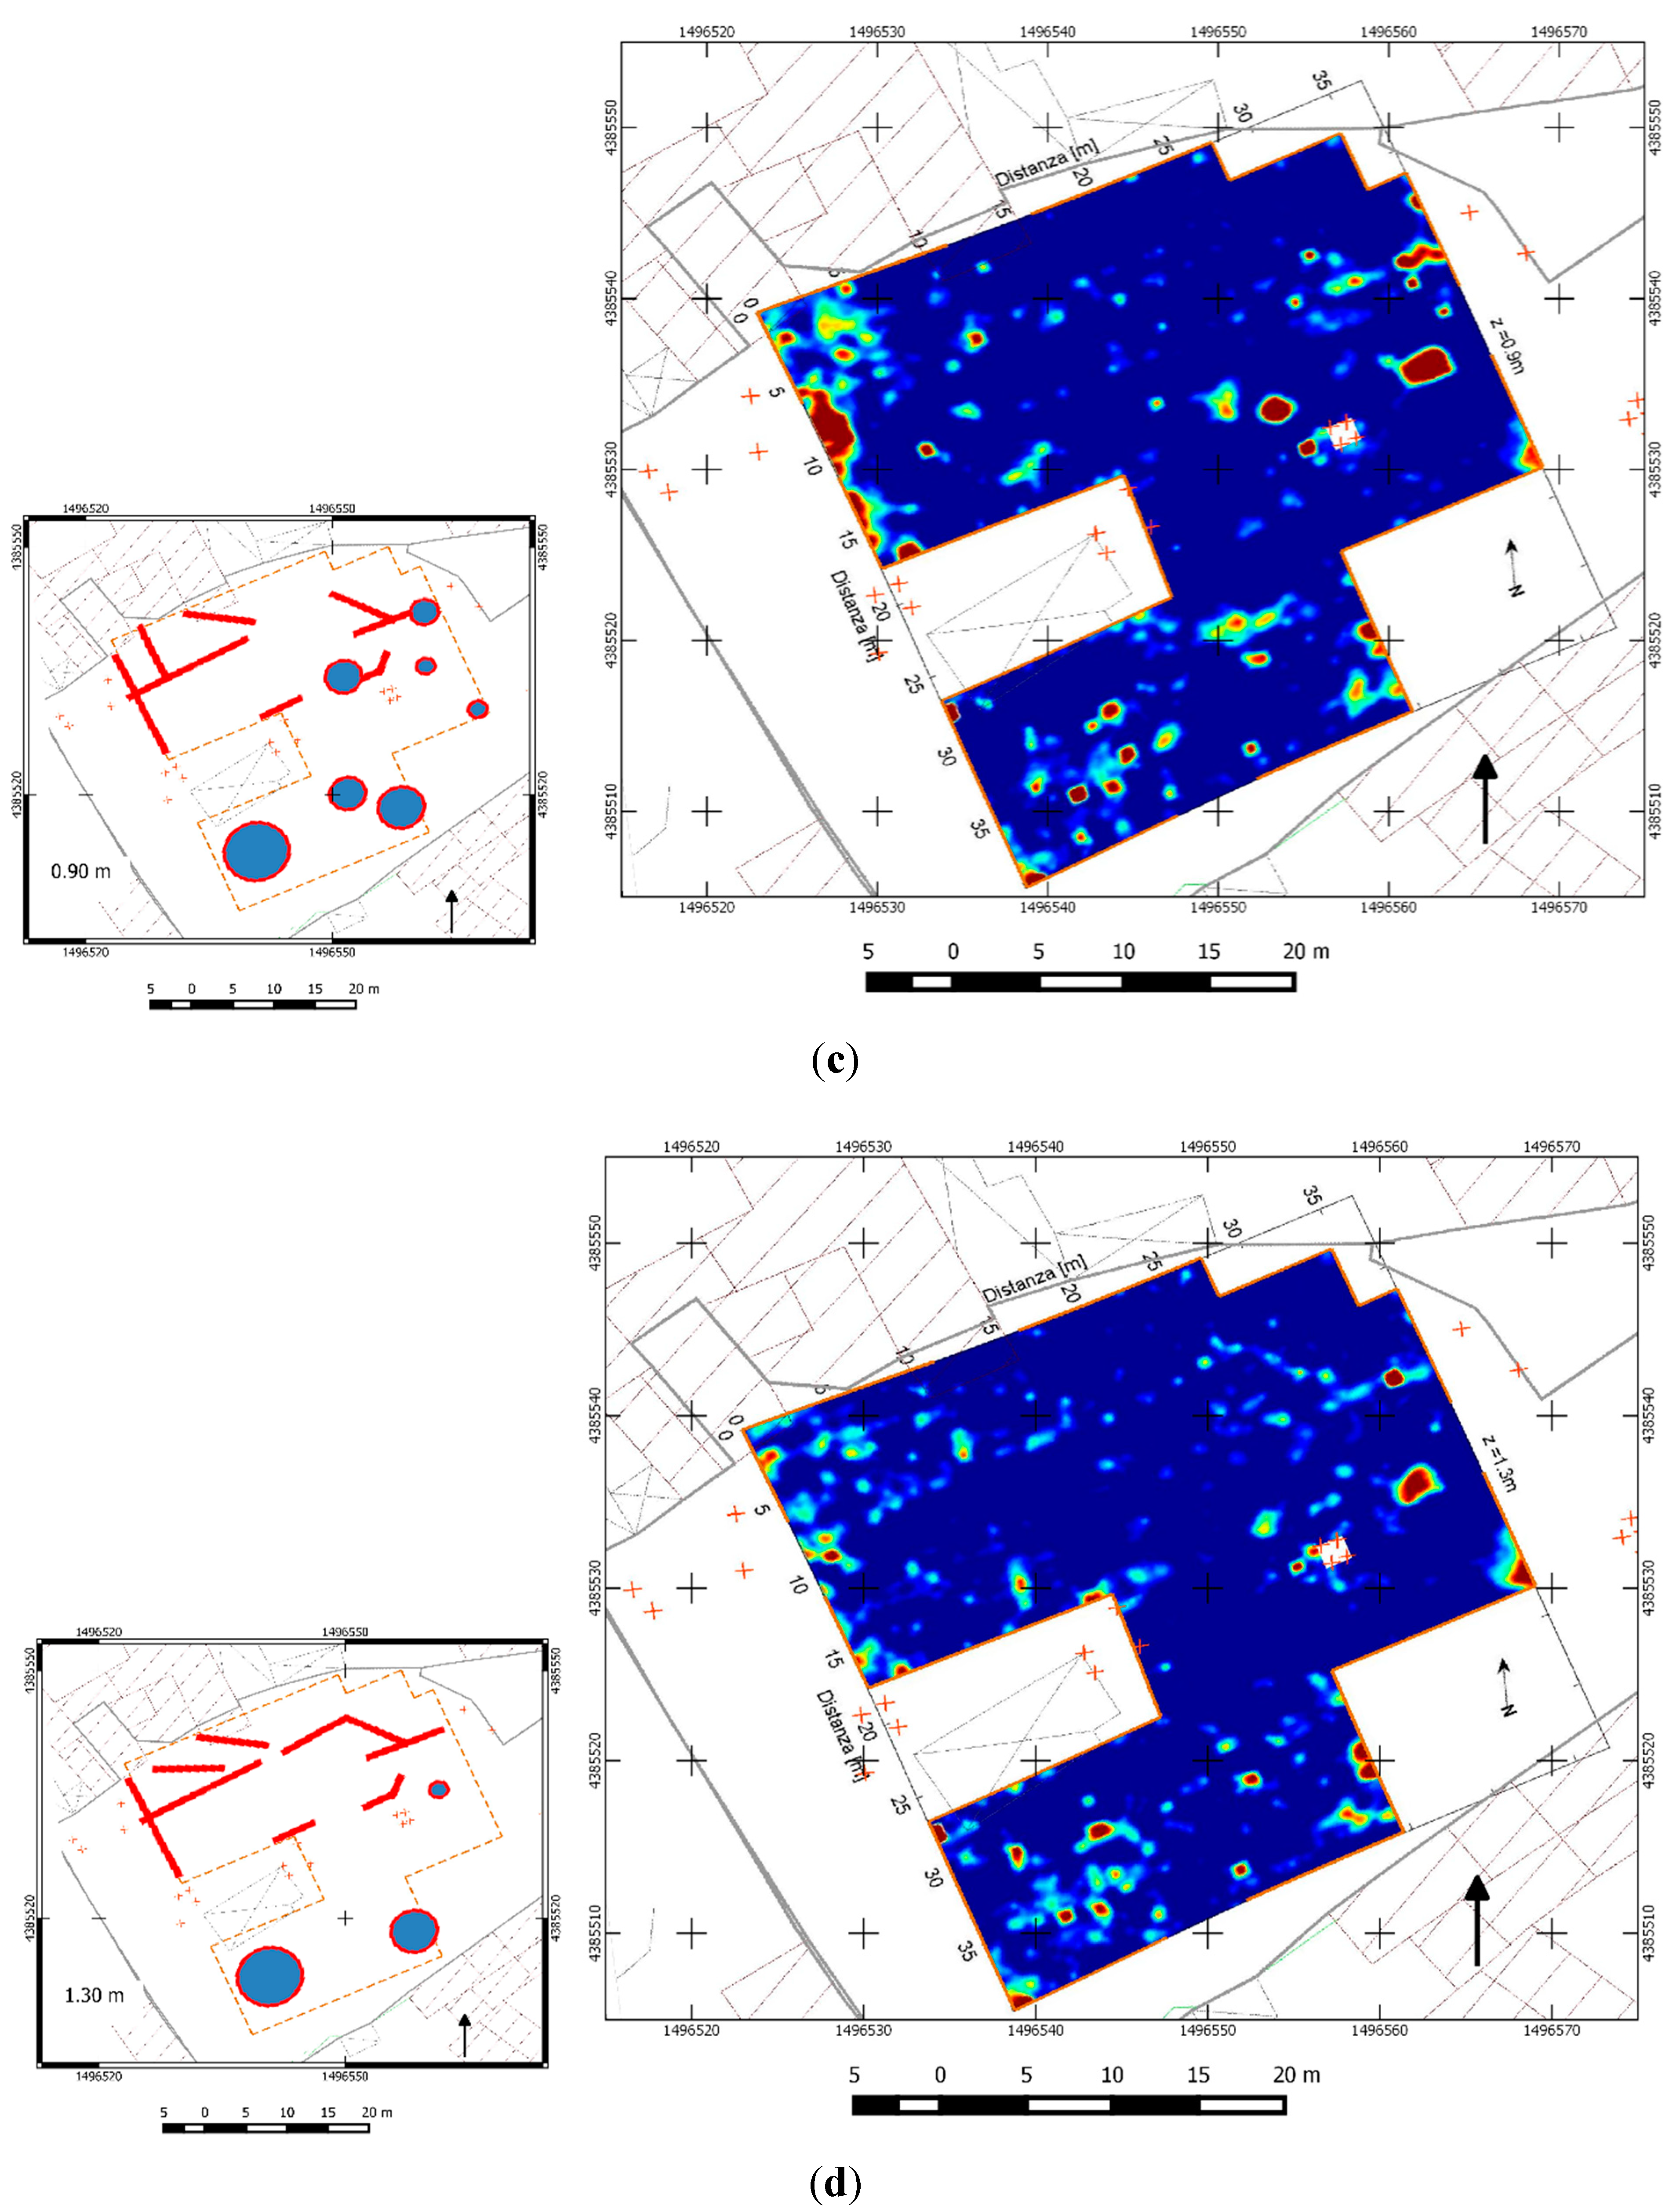
GPR maps and interpretation of the anomalies (on the left of every GPR map, an interpretative scheme is drawn reporting linear and concentrated anomalies) at various depths: (a) 0.30 m; (b) 0.50 m; (c) 0.90 m; (d) 1.30 m.
Figure 3.
GPR maps and interpretation of the anomalies (on the left of every GPR map, an interpretative scheme is drawn reporting linear and concentrated anomalies) at various depths: (a) 0.30 m; (b) 0.50 m; (c) 0.90 m; (d) 1.30 m.
The GPR acquisition window was 256 ns with 1024 samples per scan. The acquisition profile was equally spaced 0.50 m in two orthogonal directions for a total length of 4.045 km.
GPR data were processed with REFLEXW software to generate time slices at different depths. The processing of the data, applied to each time section, can be summarized in the following points:
Moving the start time of each track based on the main-bang antenna to move the time origin from the antenna source to the soil interface;
Subtraction of the mean value (dewow) on a time window of 5 ns (corresponding to the main period of the used antenna) for the removal of the lower frequency part of the signals;
Subtraction of the average of 50 tracks to filter the noise of the background consistently along the horizontal direction;
Application of gain: divergence compensation to compensate for the geometrical divergence losses and energy decay to emphasize the low amplitude ranges against the ranges with high amplitudes;
Application of a 2D median filter over the radargram, in order to suppress trace and time-dependent noise and spike events; this acts as a low-pass filter, both in the x- and y- (time) direction;
Spatial resampling 0.05 m in the direction of the profile.
The radargrams thus processed were used to generate the time-slice using a linear interpolation on a grid of 0.05 × 0.25 m.
Adopting a value of a relative permittivity average of 18, obtained from some diffraction hyperbolas highlighted in the radargrams, we have obtained the horizontal sections (depth slice) of the reflected signal every 10 cm, the most significant of which are illustrated in Paragraph 3.
From the processing workflow, the migration operation was excluded due to the observed permittivity variability and to consequently avoid local artifacts. In fact, too high or too low of a velocity compensation can generate apparent signals, which are a distortion of the correct configuration and can lead to worse interpretations than the ones based on non-migrated data.
The depth-slices were then georeferenced in GIS using GPS data logged during measurements.
The georadar maps reveal various anomalies, sometimes in a quasi linear shape, sometimes in more concentrated reflections.
The first proposed map, of 30-cm depth (
Figure 3a), mainly show some gathered reflections, in particular in the north-western and south-western areas of the map, near the already known necropolis remains. In the left of every GPR map, a scheme is drawn reporting linear and concentrated anomalies.
At 50 cm (
Figure 3b), we continue observing concentrated reflections, with more evidence of one of them in the eastern part of the map not far from one of the two water wells. Furthermore, many alignments are now clearly visible.
Looking at deeper targets, at a 90-cm depth (
Figure 3c), we can note a much greater number of single and intense reflections and a completely new alignments orientated totally different from the one of the 50-cm map.
The map at 130 cm (
Figure 3d) partially confirms the one of 90 cm with similar alignment settings and only a few single reflecting targets corresponding to some of the 90-cm map. The signal is globally less than in previous maps, due to depth dispersion and absorption.
2.3. Thermal Infrared Aerial Survey
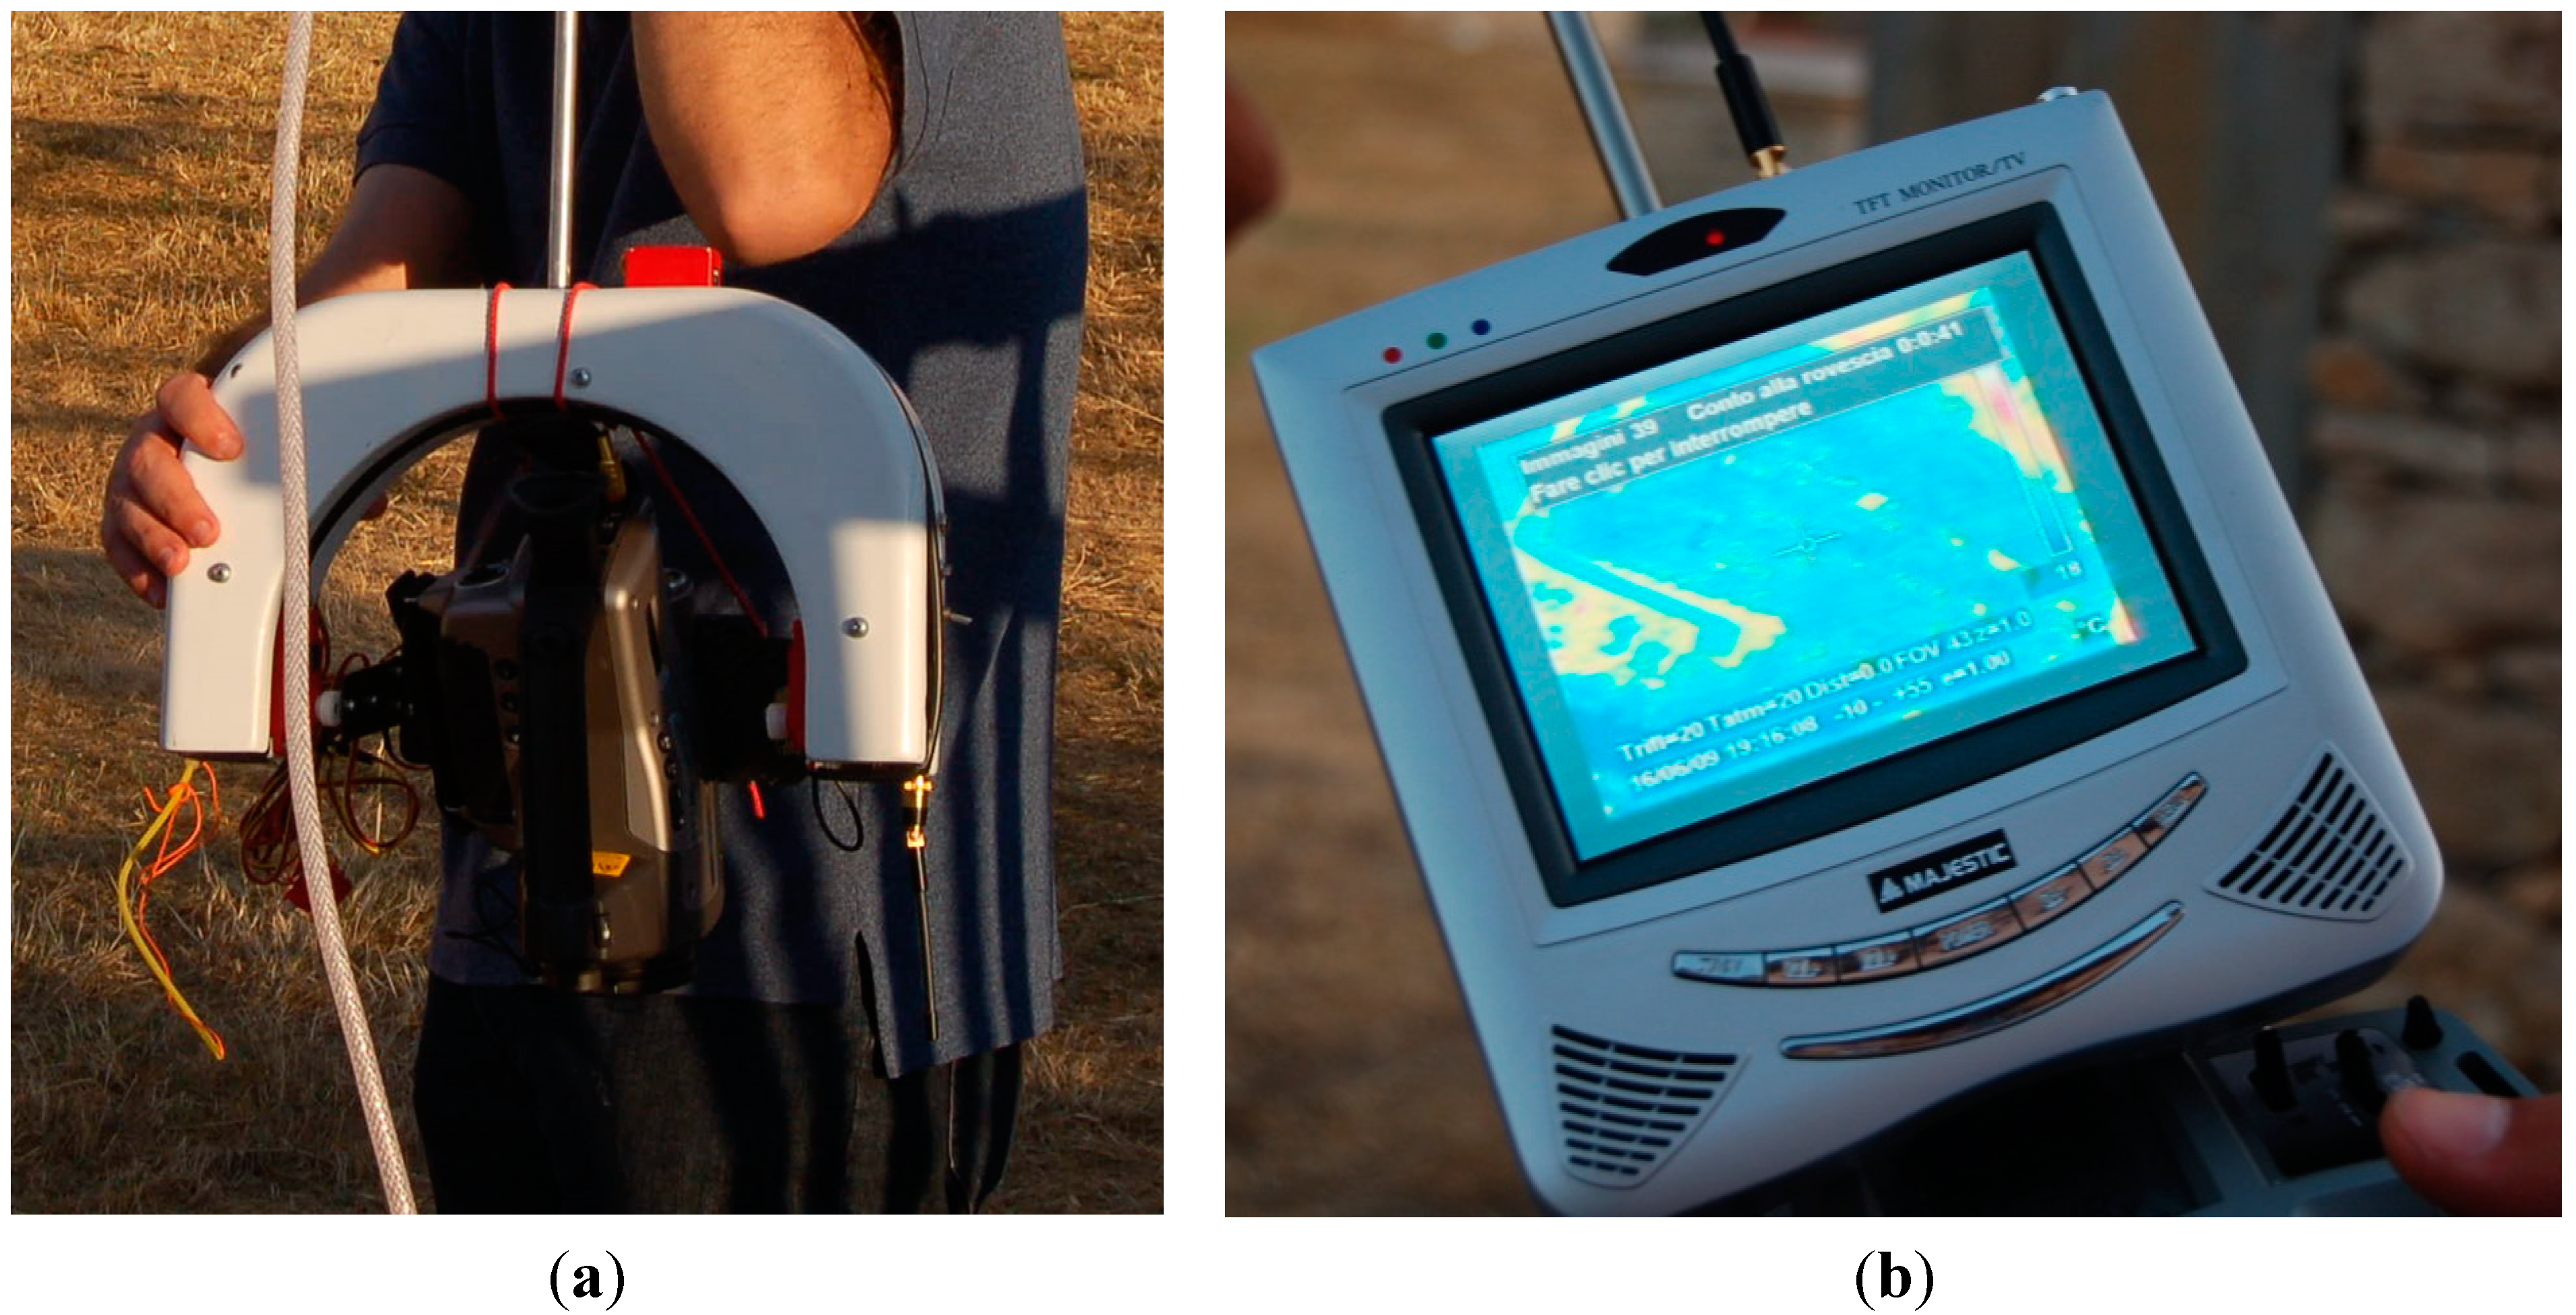
The thermal infrared (IR) survey was carried out in June 2009, with an automated acquisition system in the thermal infrared band by means of a micro-bolometric IR thermal camera (FLIR System AB model P30 PAL) and with a parallel manual acquisition system in the visible band by means of a photo camera (NIKON E8400). The two recording cameras were fixed to a rocker element with a motor for guidance and controllable in flight from the ground with a radio connection (
Figure 4a). The same commander is also equipped with a monitor able to verify in real time the data acquired by the two surveying devices, to pass from one to another and to monitor the parameters of the acquisition of the same (
Figure 4b).
Figure 4.
(a) The thermocamera and the camera mounted on the rocker element in the acquisition layout; (b) the monitor for the real-time control of acquisitions.
Figure 4.
(a) The thermocamera and the camera mounted on the rocker element in the acquisition layout; (b) the monitor for the real-time control of acquisitions.
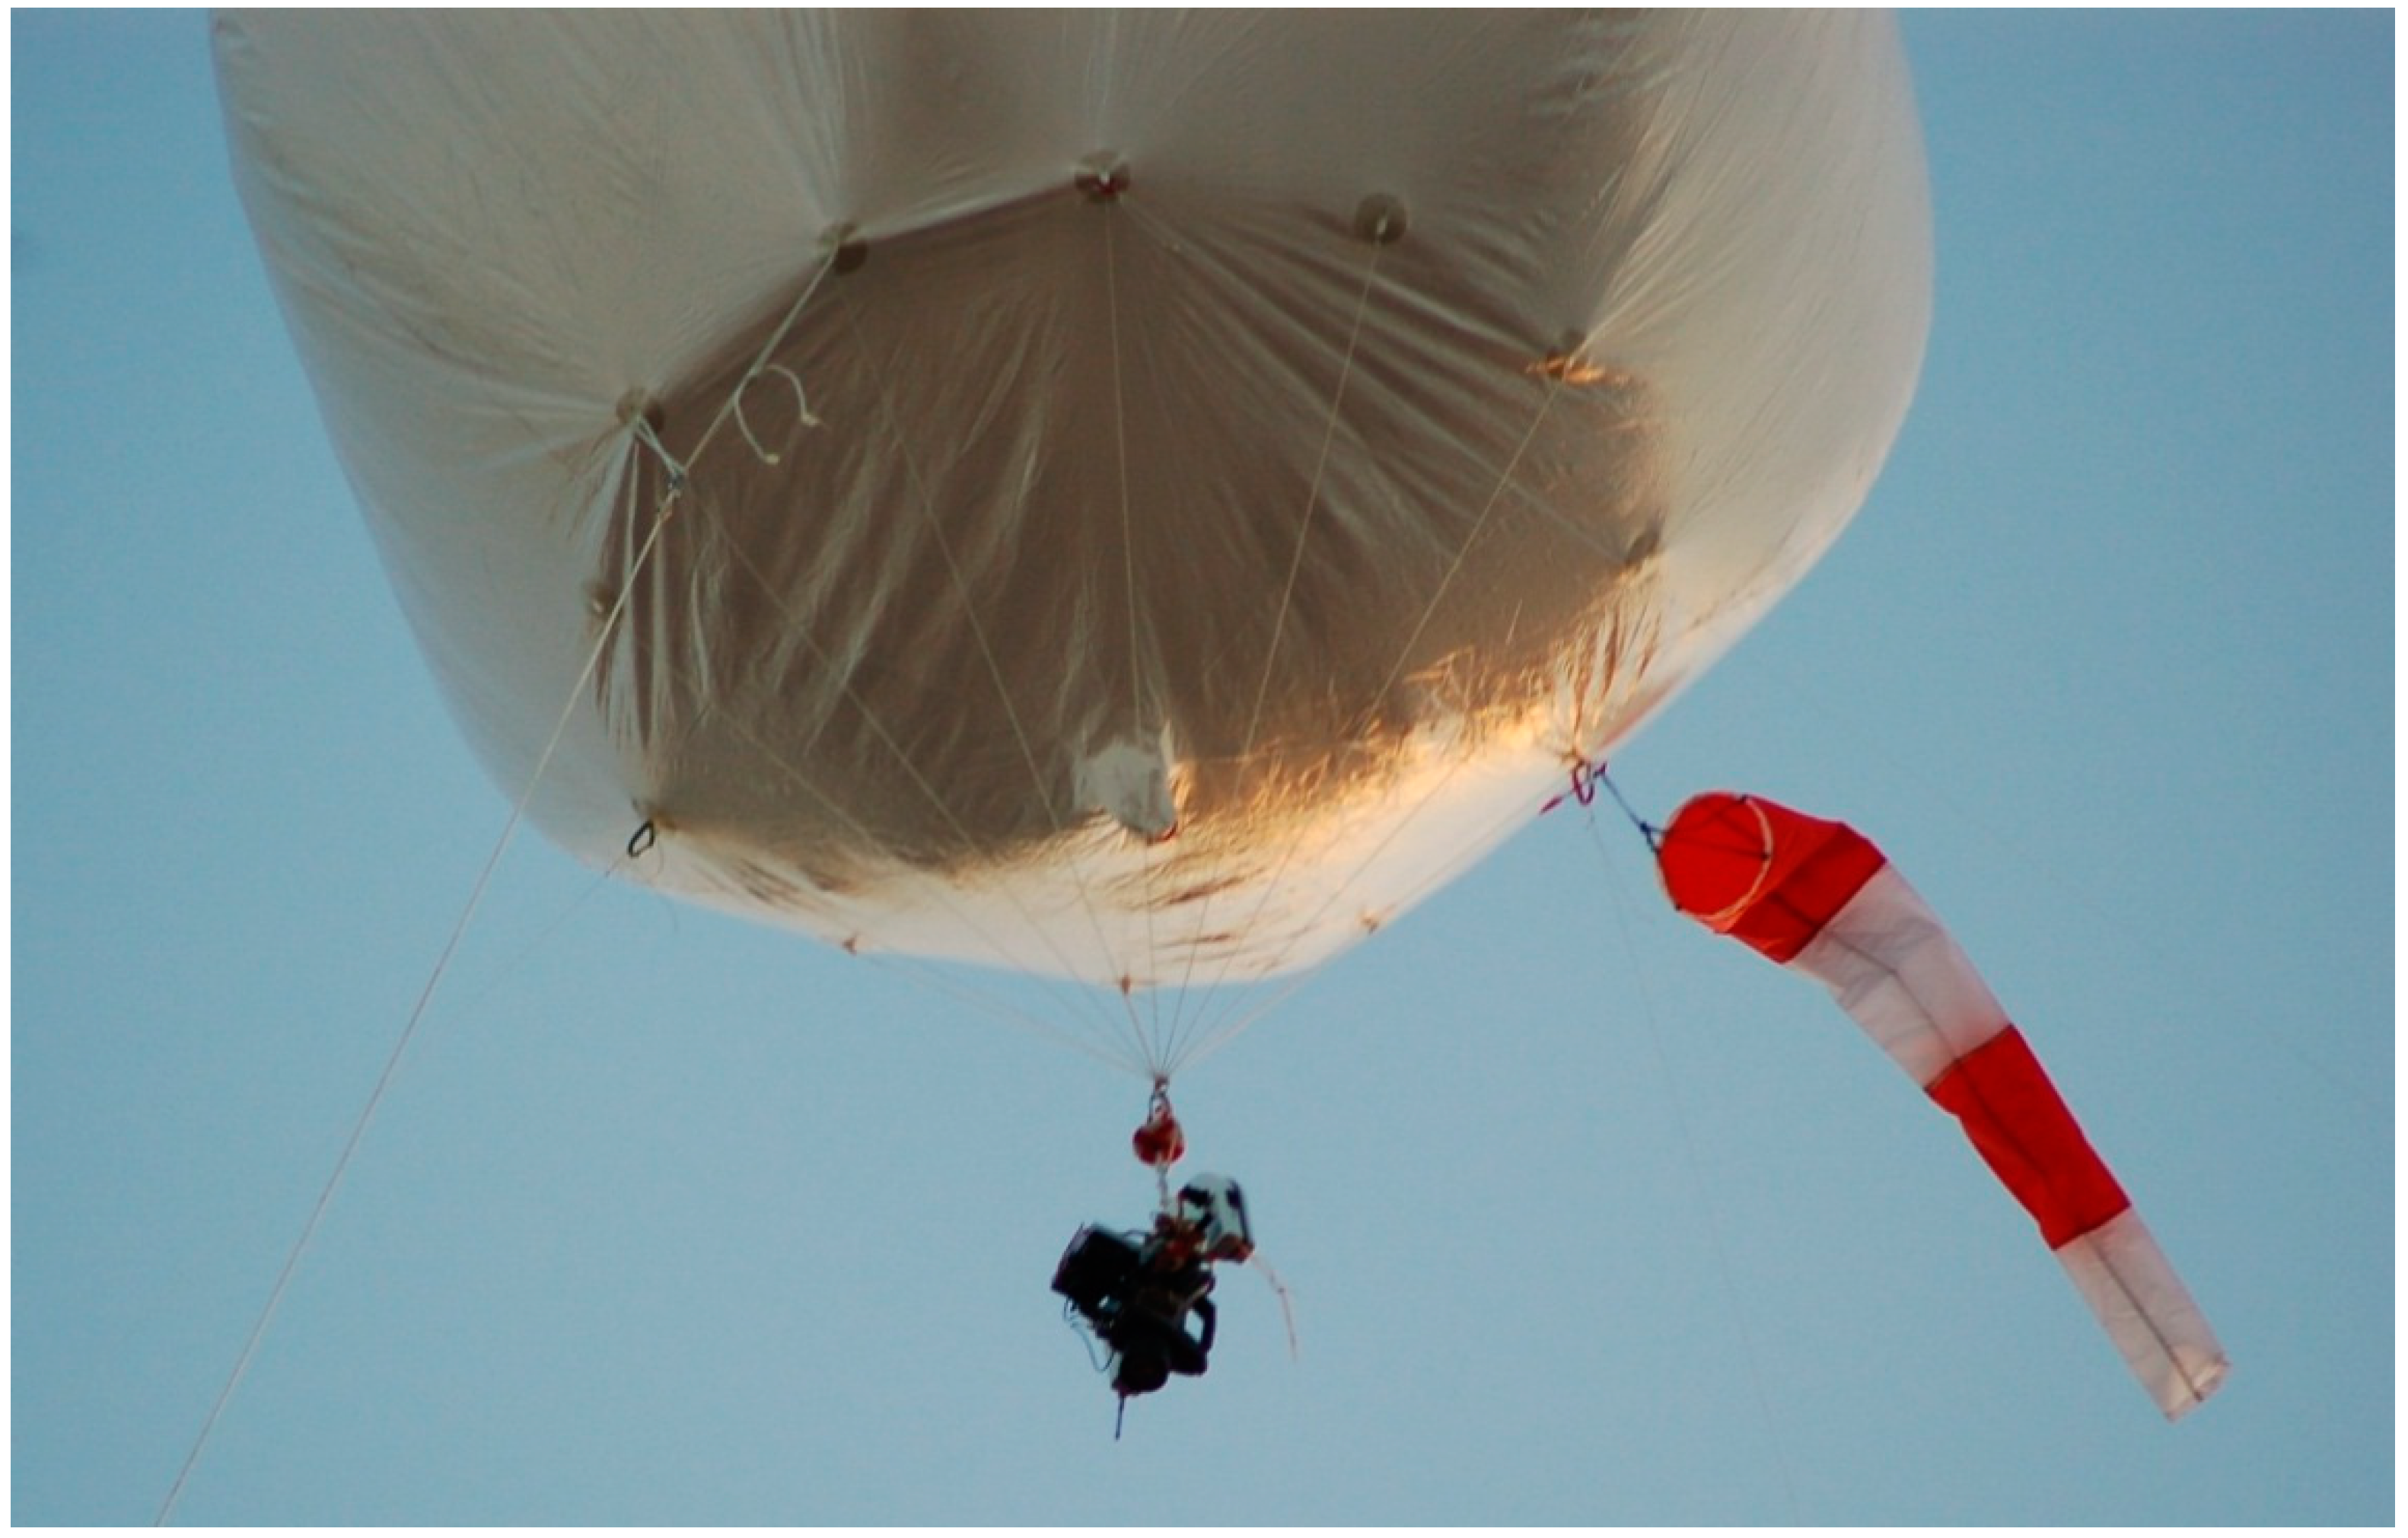
The acquisition instrumentation was hung by means of the fastening system mentioned above to a balloon, inflated with about 15 cubic meters of helium, anchored to the ground on a three-ballast fixture and with an additional fourth security cable that was slack (
Figure 5). The height of the camera was about 50 m, and it was located to ensure the coverage of the northern area, the range of the driveway, the first of two wells and part of the excavated necropolis.
The buildings surrounding the area of investigation have a development between two and four above-ground floors.
The time window of data acquisition was more than two and a half hours, from 20:10 to 22:50, local summertime. However, the usable thermal data were only 109 thermograms corresponding to 1 h and 49 min with a sampling frequency of 1 acquisition per minute. This was mostly because the starting times were excluded to have only complete night conditions and in smaller part because of too much blurring of later thermograms due to the balloon movements because of wind.
The radiometric infrared data were georeferenced with each other to compensate for the balloon movements during acquisition. As result, a georeferenced 3D matrix of IR ground emission in the time domain was assembled in a MATLAB processing environment.
Each layer of the described 3D matrix is referenced to a time instant, so for each ground point/image pixel, we know the thermal time history.
Thermal properties of the ground interact with the changing air temperature during sundown, modifying the thermal behavior of the observed pixel in accordance with the soil thermal inertia.
Figure 5.
The monitoring conditions.
Figure 5.
The monitoring conditions.
The presence of natural or anthropic voids, variations in water content, the rock composition of the ground and the modified soil compaction caused by excavation generated an image pattern recognizable also in raw data. However, specific data analysis algorithms derived from seismological research allowed us to summarize hundreds of thermograms to show two significant images of the main thermal behavior.
The thermal processing method is based on the modification of an algorithm developed for geostationary satellite thermal data in environmental monitoring in order to evaluate the short-term seismic hazard based on a case study from the L’Aquila earthquake of 6 April 2009 [
55,
56,
57].
The modification is undertaken due to the passage from 4D thermal values matrix to a 3D matrix, as the survey is undertaken only during one night: these samples have been analyzed in the time domain with a least squares linear interpolation procedure, which has been subjected to bisquare weight robustness constraints [
58].
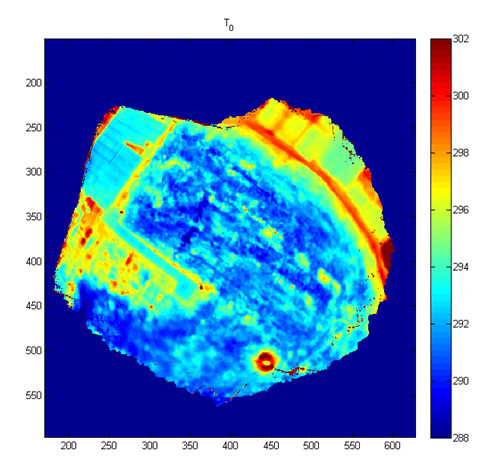
The resulting parameters of this interpolation are intercept temperature (T
0,
Figure 6) and the slope of the regression line, namely night thermal gradient (NTG or dT/dt,
Figure 7). Doing the interpolation for all pixels, we have two relative maps, which were computed with the only constraint being the presence of only 10 valid samples for each pixel time series.
The resulting maps have good coverage, due to the thermal camera oscillations, and have a less smoothed aspect in the areas just under the balloon, where greater time series continuity exists. The main characteristics of the T0 map is that it provides a thermogram at the same initial time as the whole area, and so, we can observe all of the pixels in the same virtual condition. In contrast, the NTG map takes into account the dynamic behavior of the pixels during time in the cooling condition and is indicative of the apparent thermal inertia of the monitored surfaces.
Figure 6.
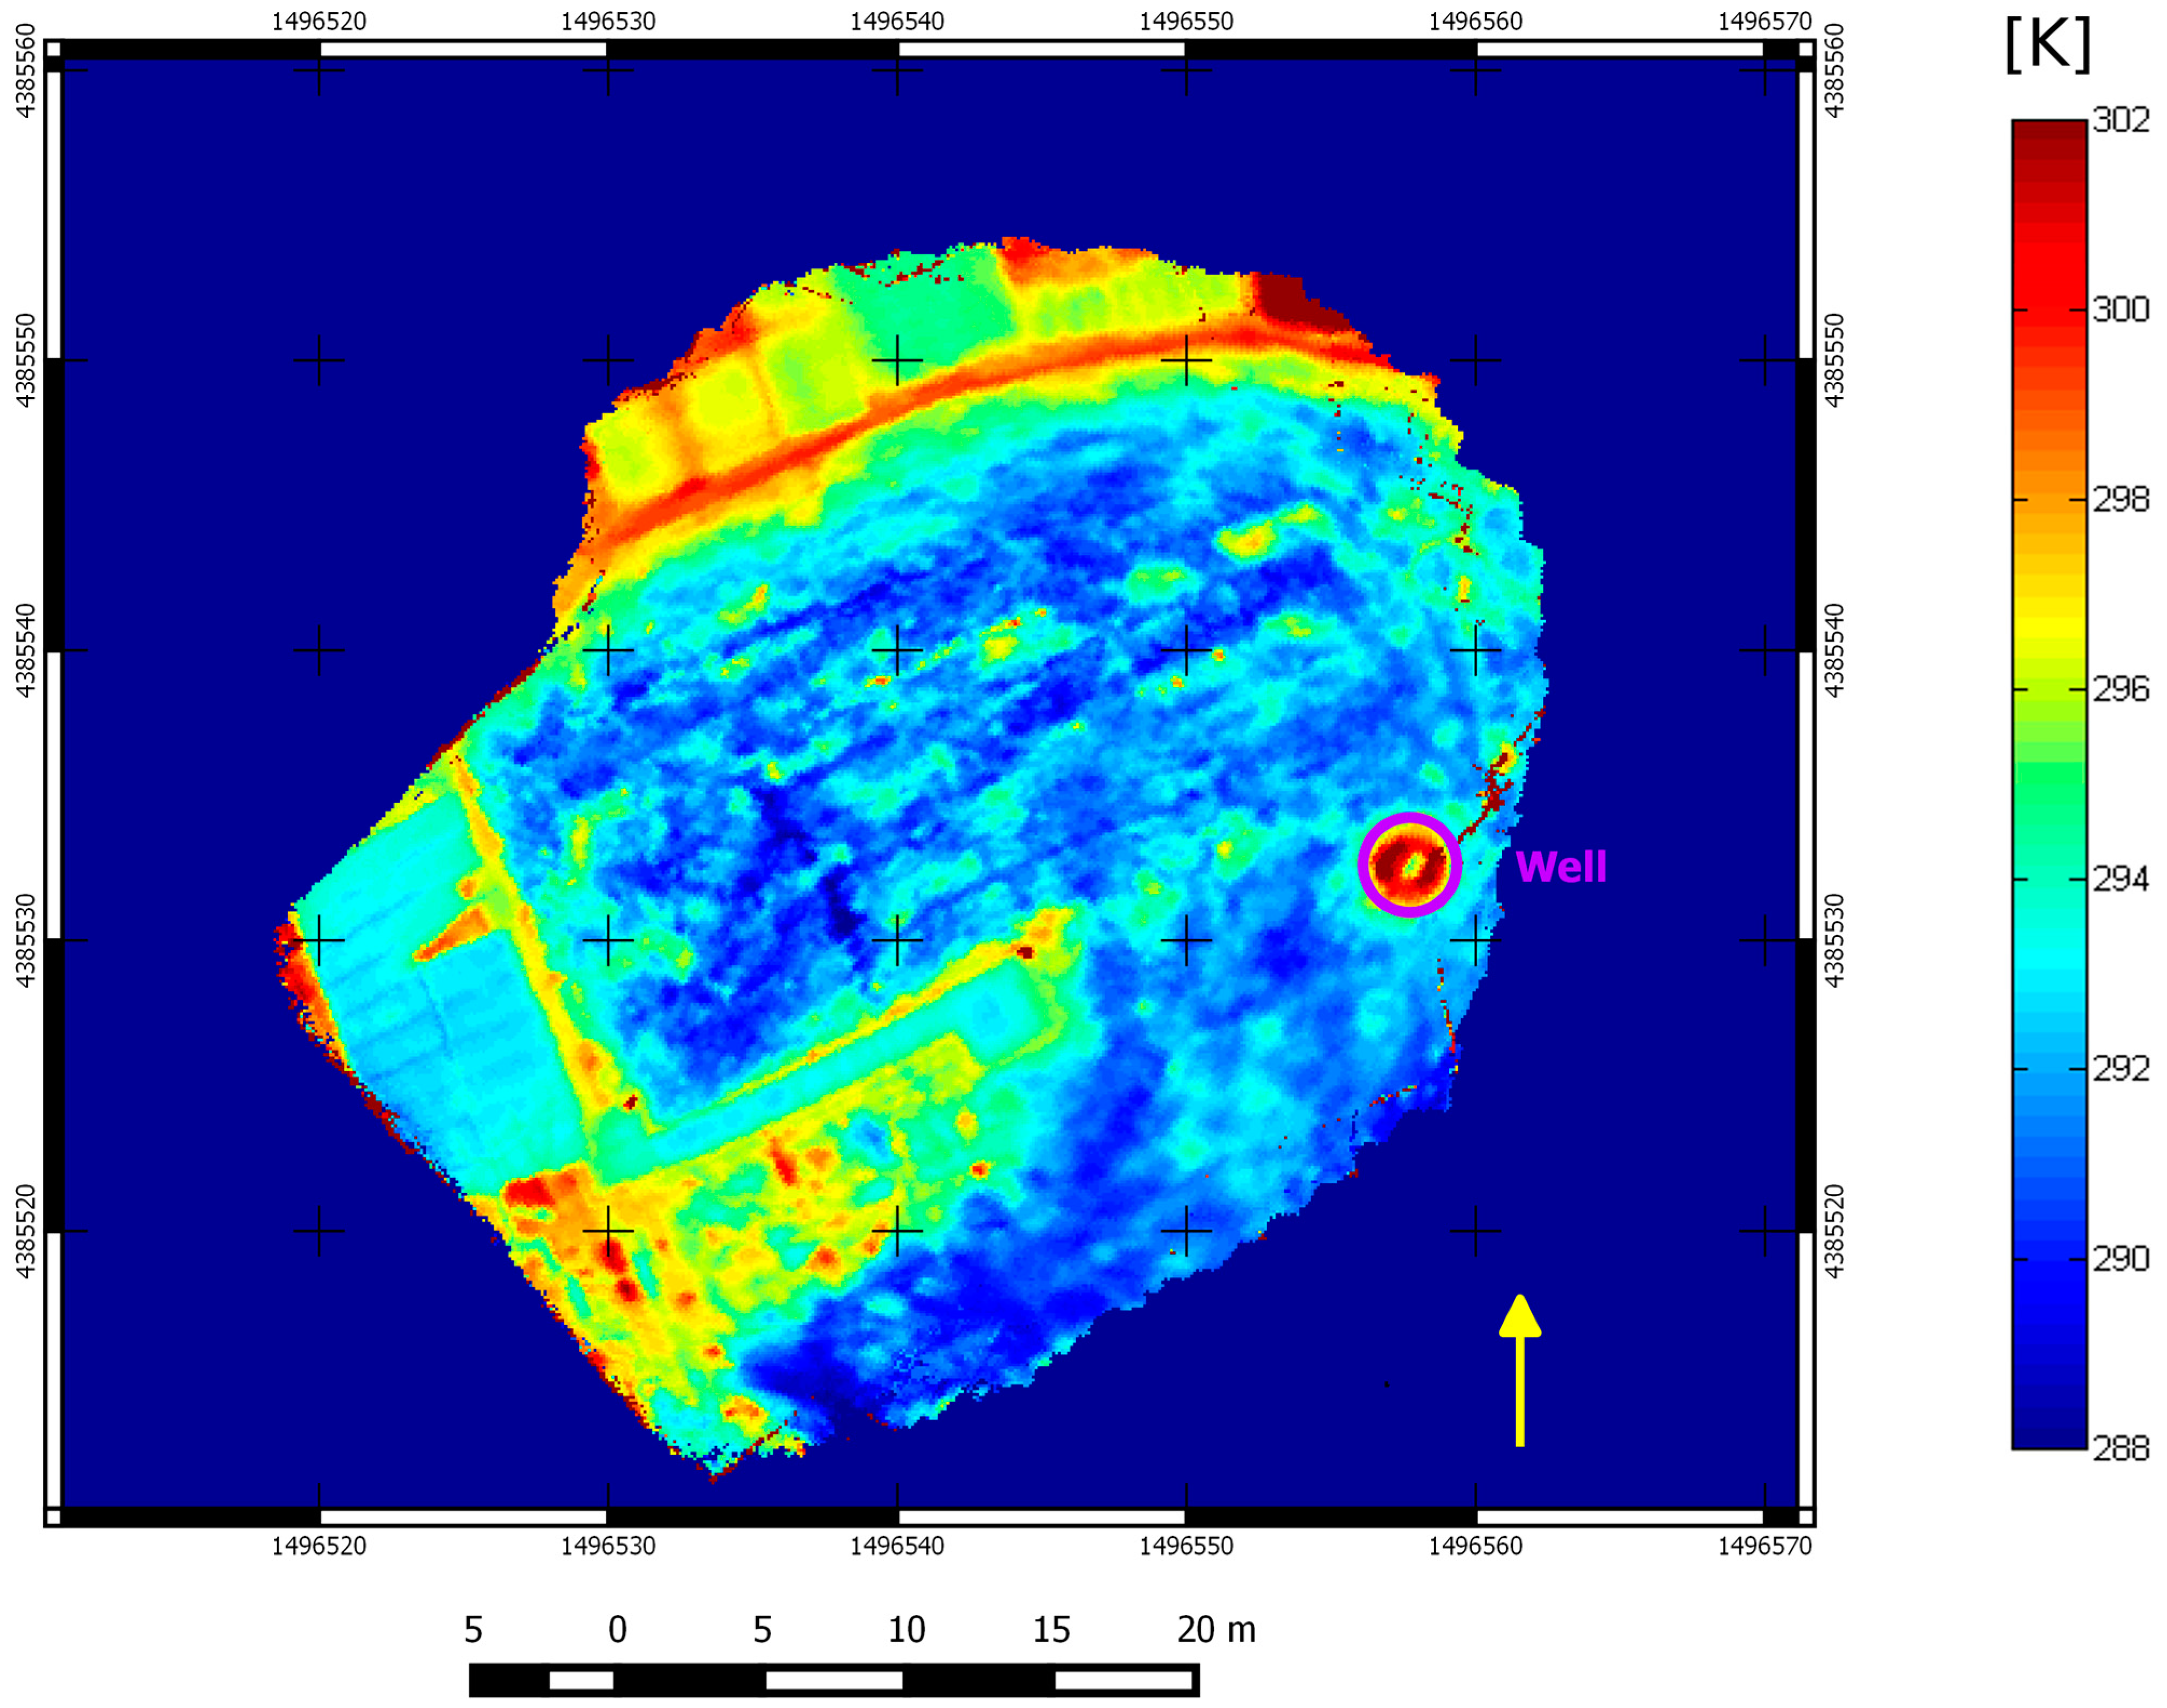
The thermal map of apparent intercept temperature (in Kelvin degrees), resulting from the merging of many thermograms and processing temperature over time.
Figure 6.
The thermal map of apparent intercept temperature (in Kelvin degrees), resulting from the merging of many thermograms and processing temperature over time.
2.4. Aerial Photography
A parallel aerial photographic survey has been carried out using a series of historical pictures (
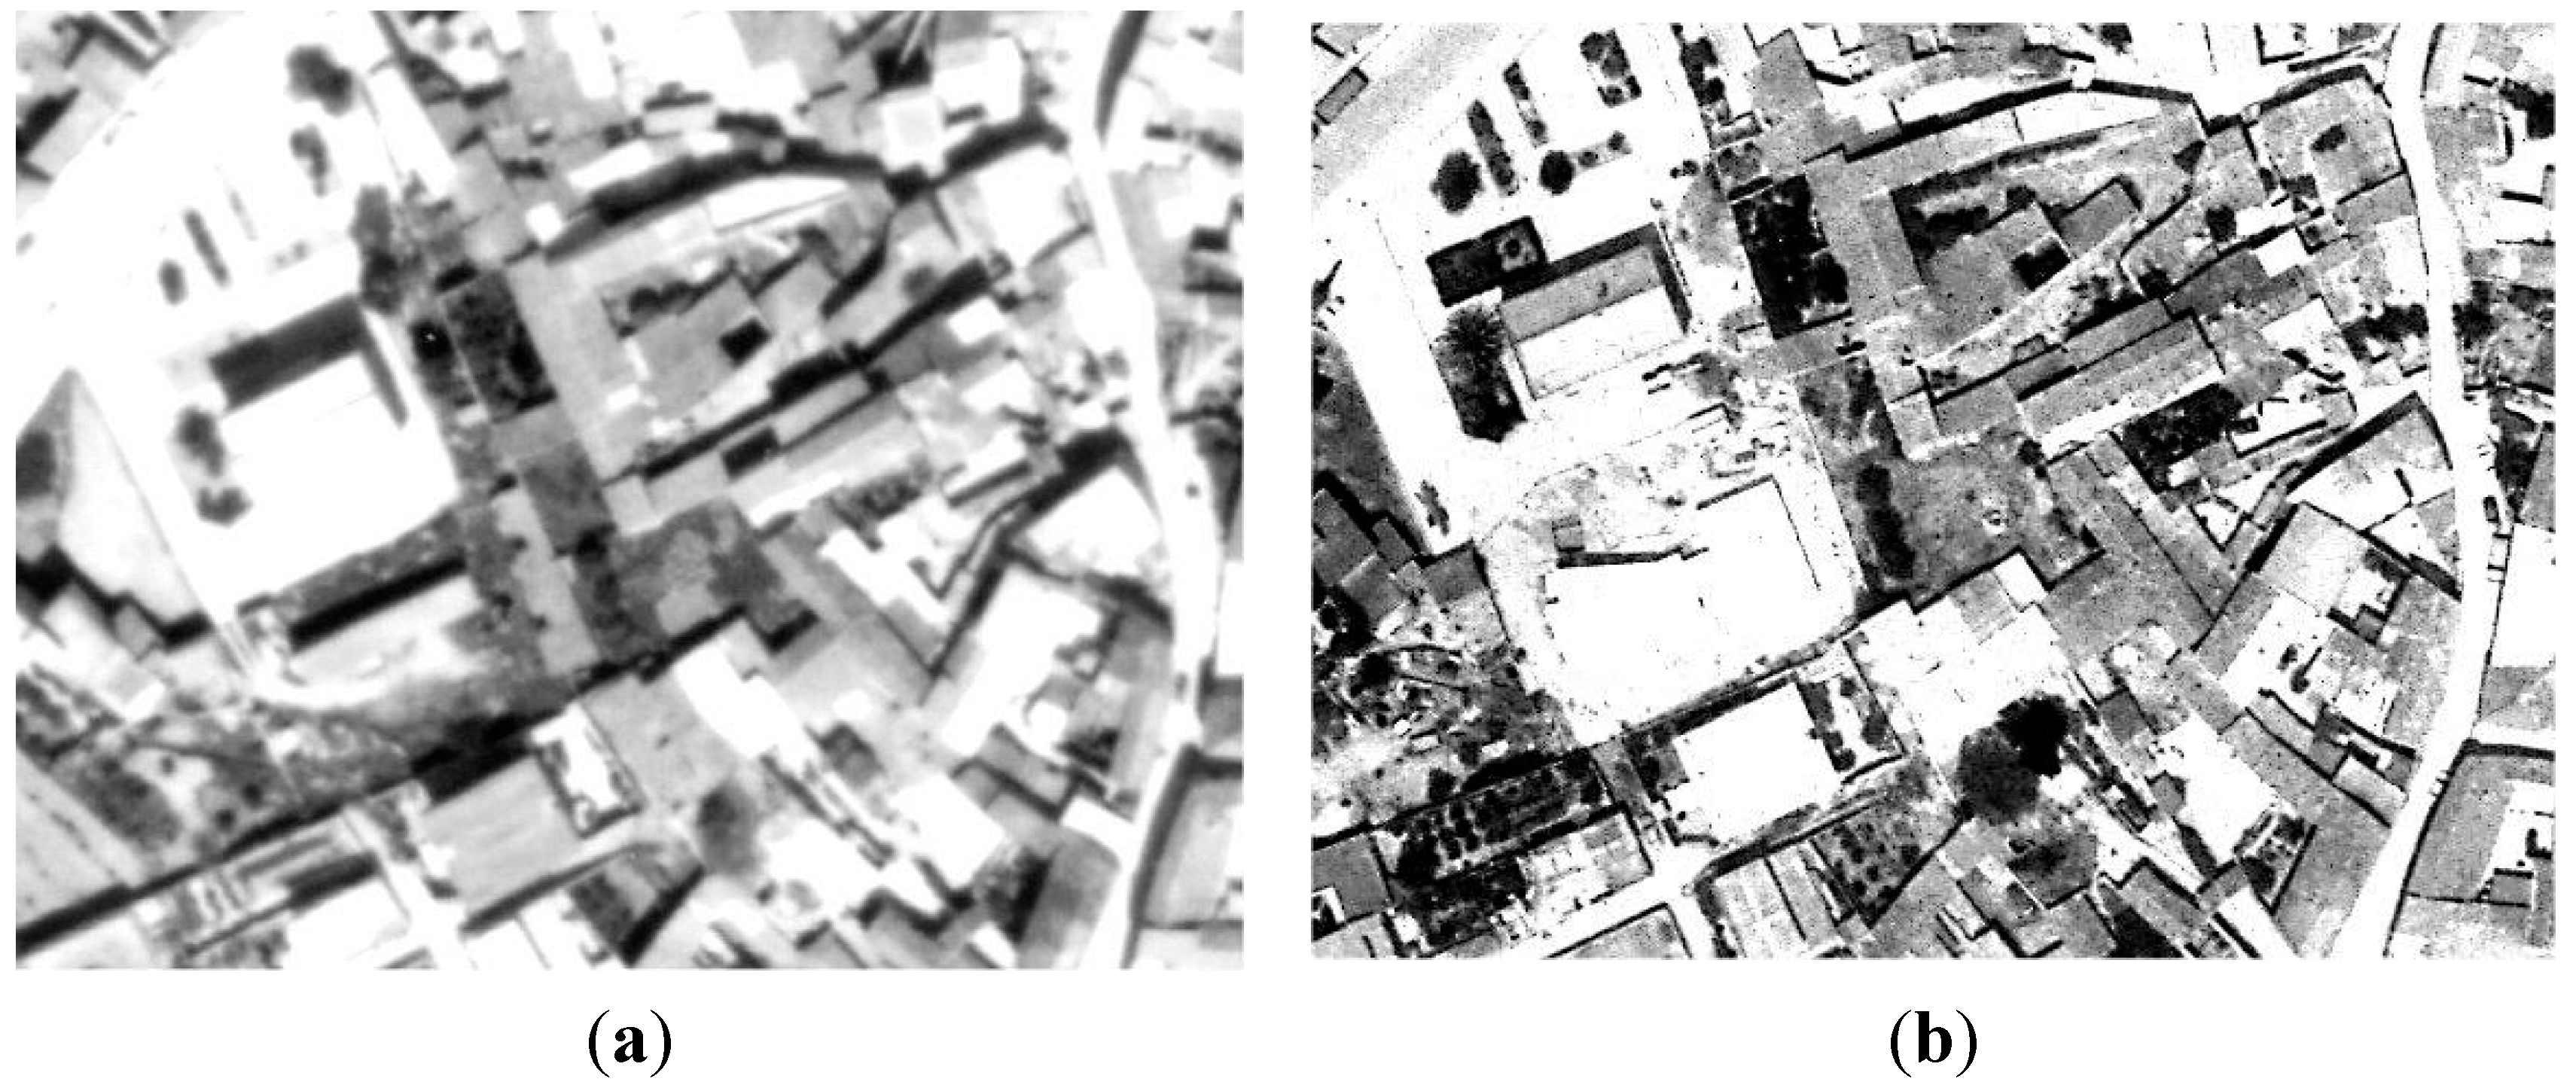
Figure 8). These pictures were acquired and printed in 1977, 1981, 1987 and 1996. Through them, the chronology of modern building activity in the area can be studied. In particular, it is possible to evaluate the progressive destruction of typical vernacular buildings, which were present on the site and were built above the archaeological features with the typology of a courtyard house. Their layouts were strongly irregular, because of the progressive historical division of bigger courtyards into more residential units and the construction inside the free spaces without a specific plan.
The historical photographic survey (pictures in grayscale values) specifically shows some rectangular dark areas in the western courtyards, possibly shadows of open tomb chambers or the same excavated chambers filled with vegetation and gardens. Images were filtered to increase the legibility of different features in the areas. Modern and ancient walls and the archaeological remains can be more easily distinguished. In fact, we can note a strong correspondence with the positions and dimensions of the chambers, even under archaeological investigation.
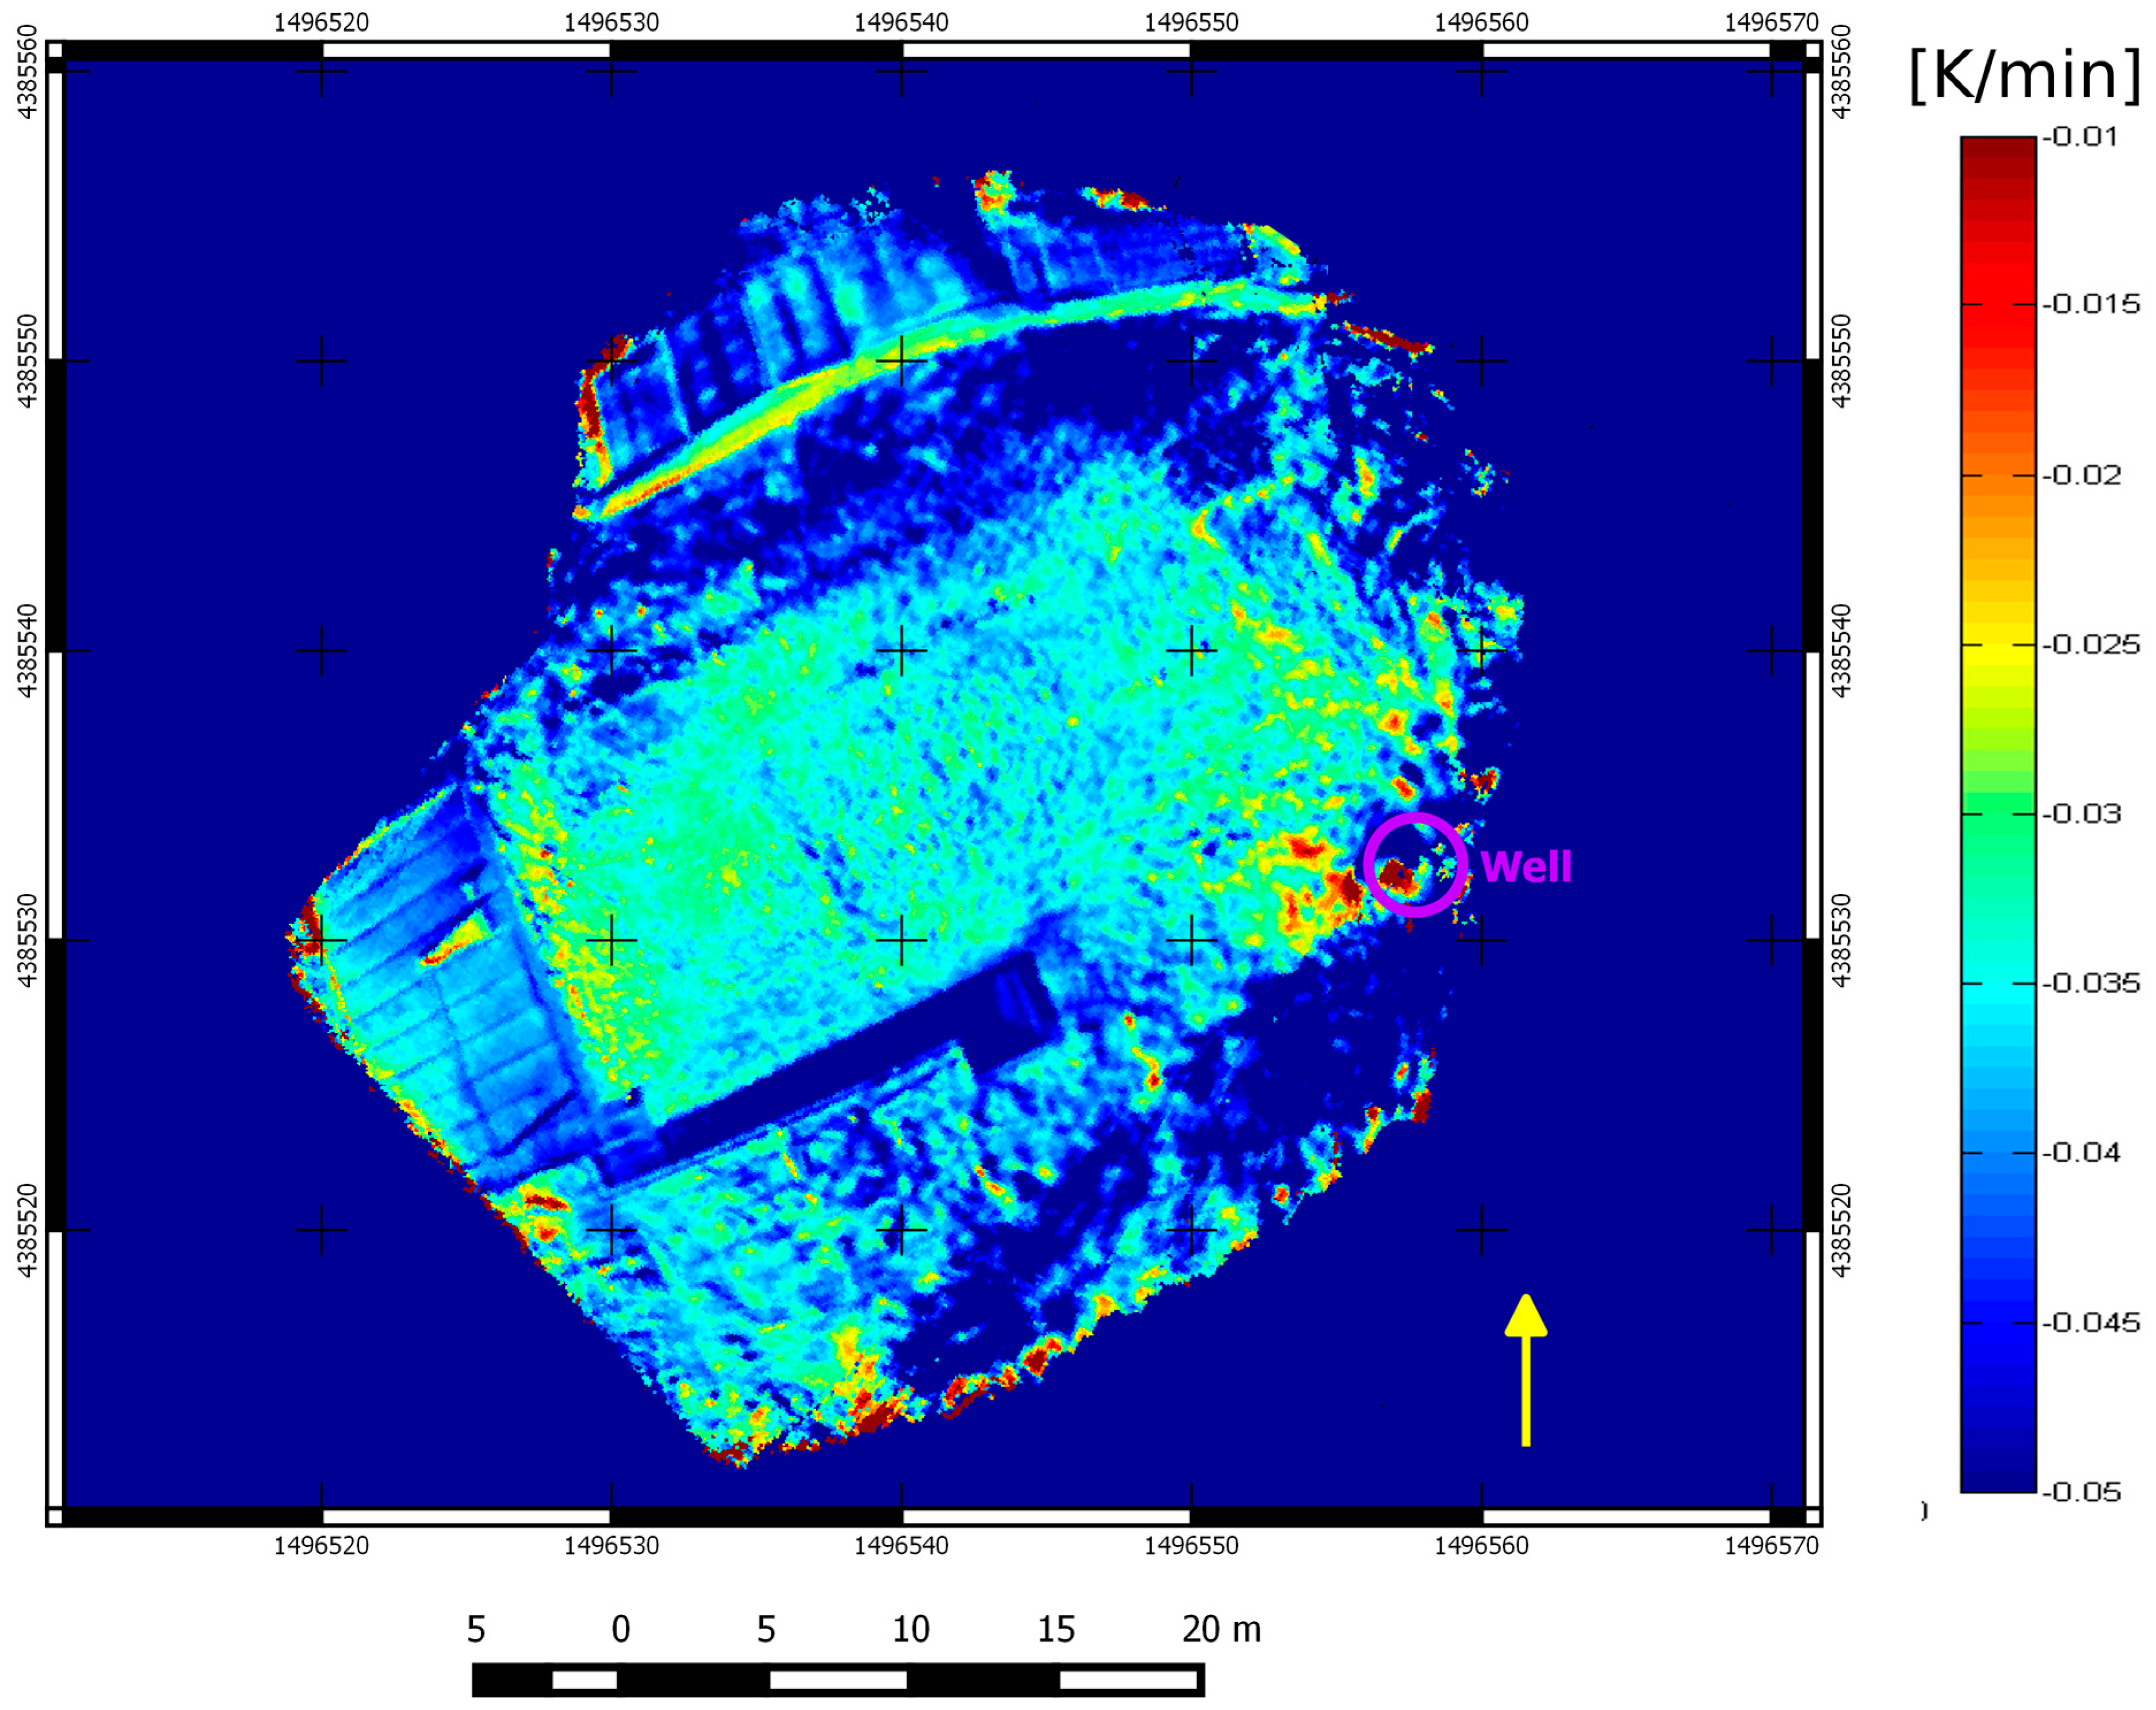
Figure 7.
The thermal map of the night thermal gradient (NTG) index (in Kelvin/minute, negative values), resulting from the merging of many thermograms and processing temperature over time.
Figure 7.
The thermal map of the night thermal gradient (NTG) index (in Kelvin/minute, negative values), resulting from the merging of many thermograms and processing temperature over time.
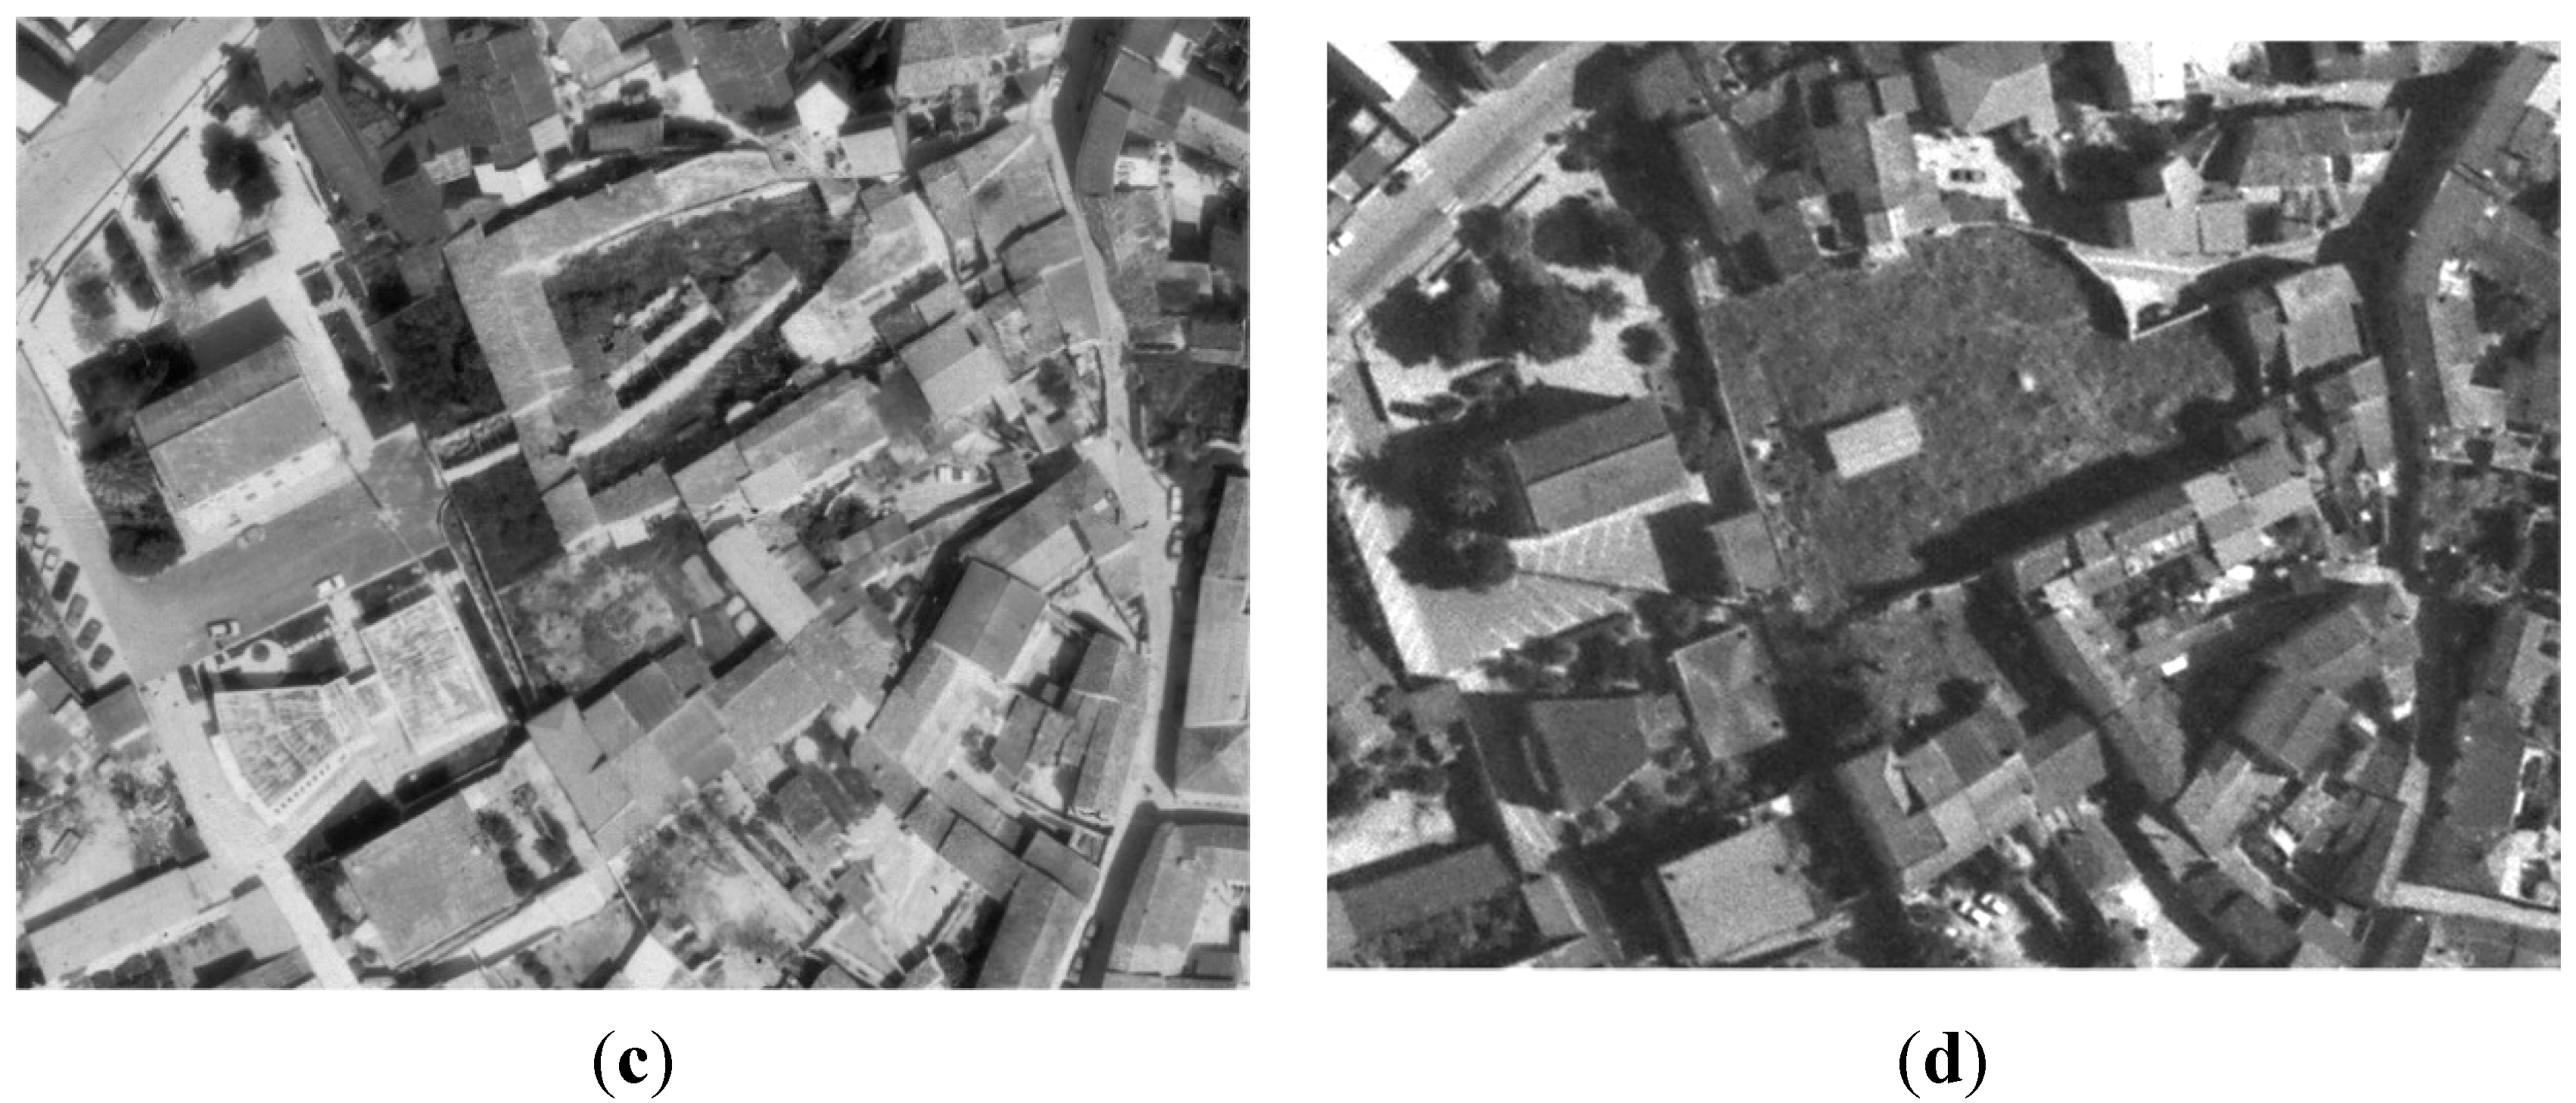
Figure 8.
The historical aerial pictures of the test site. (a) 1977; (b) 1981; (c) 1987; (d) 1996.
Figure 8.
The historical aerial pictures of the test site. (a) 1977; (b) 1981; (c) 1987; (d) 1996.
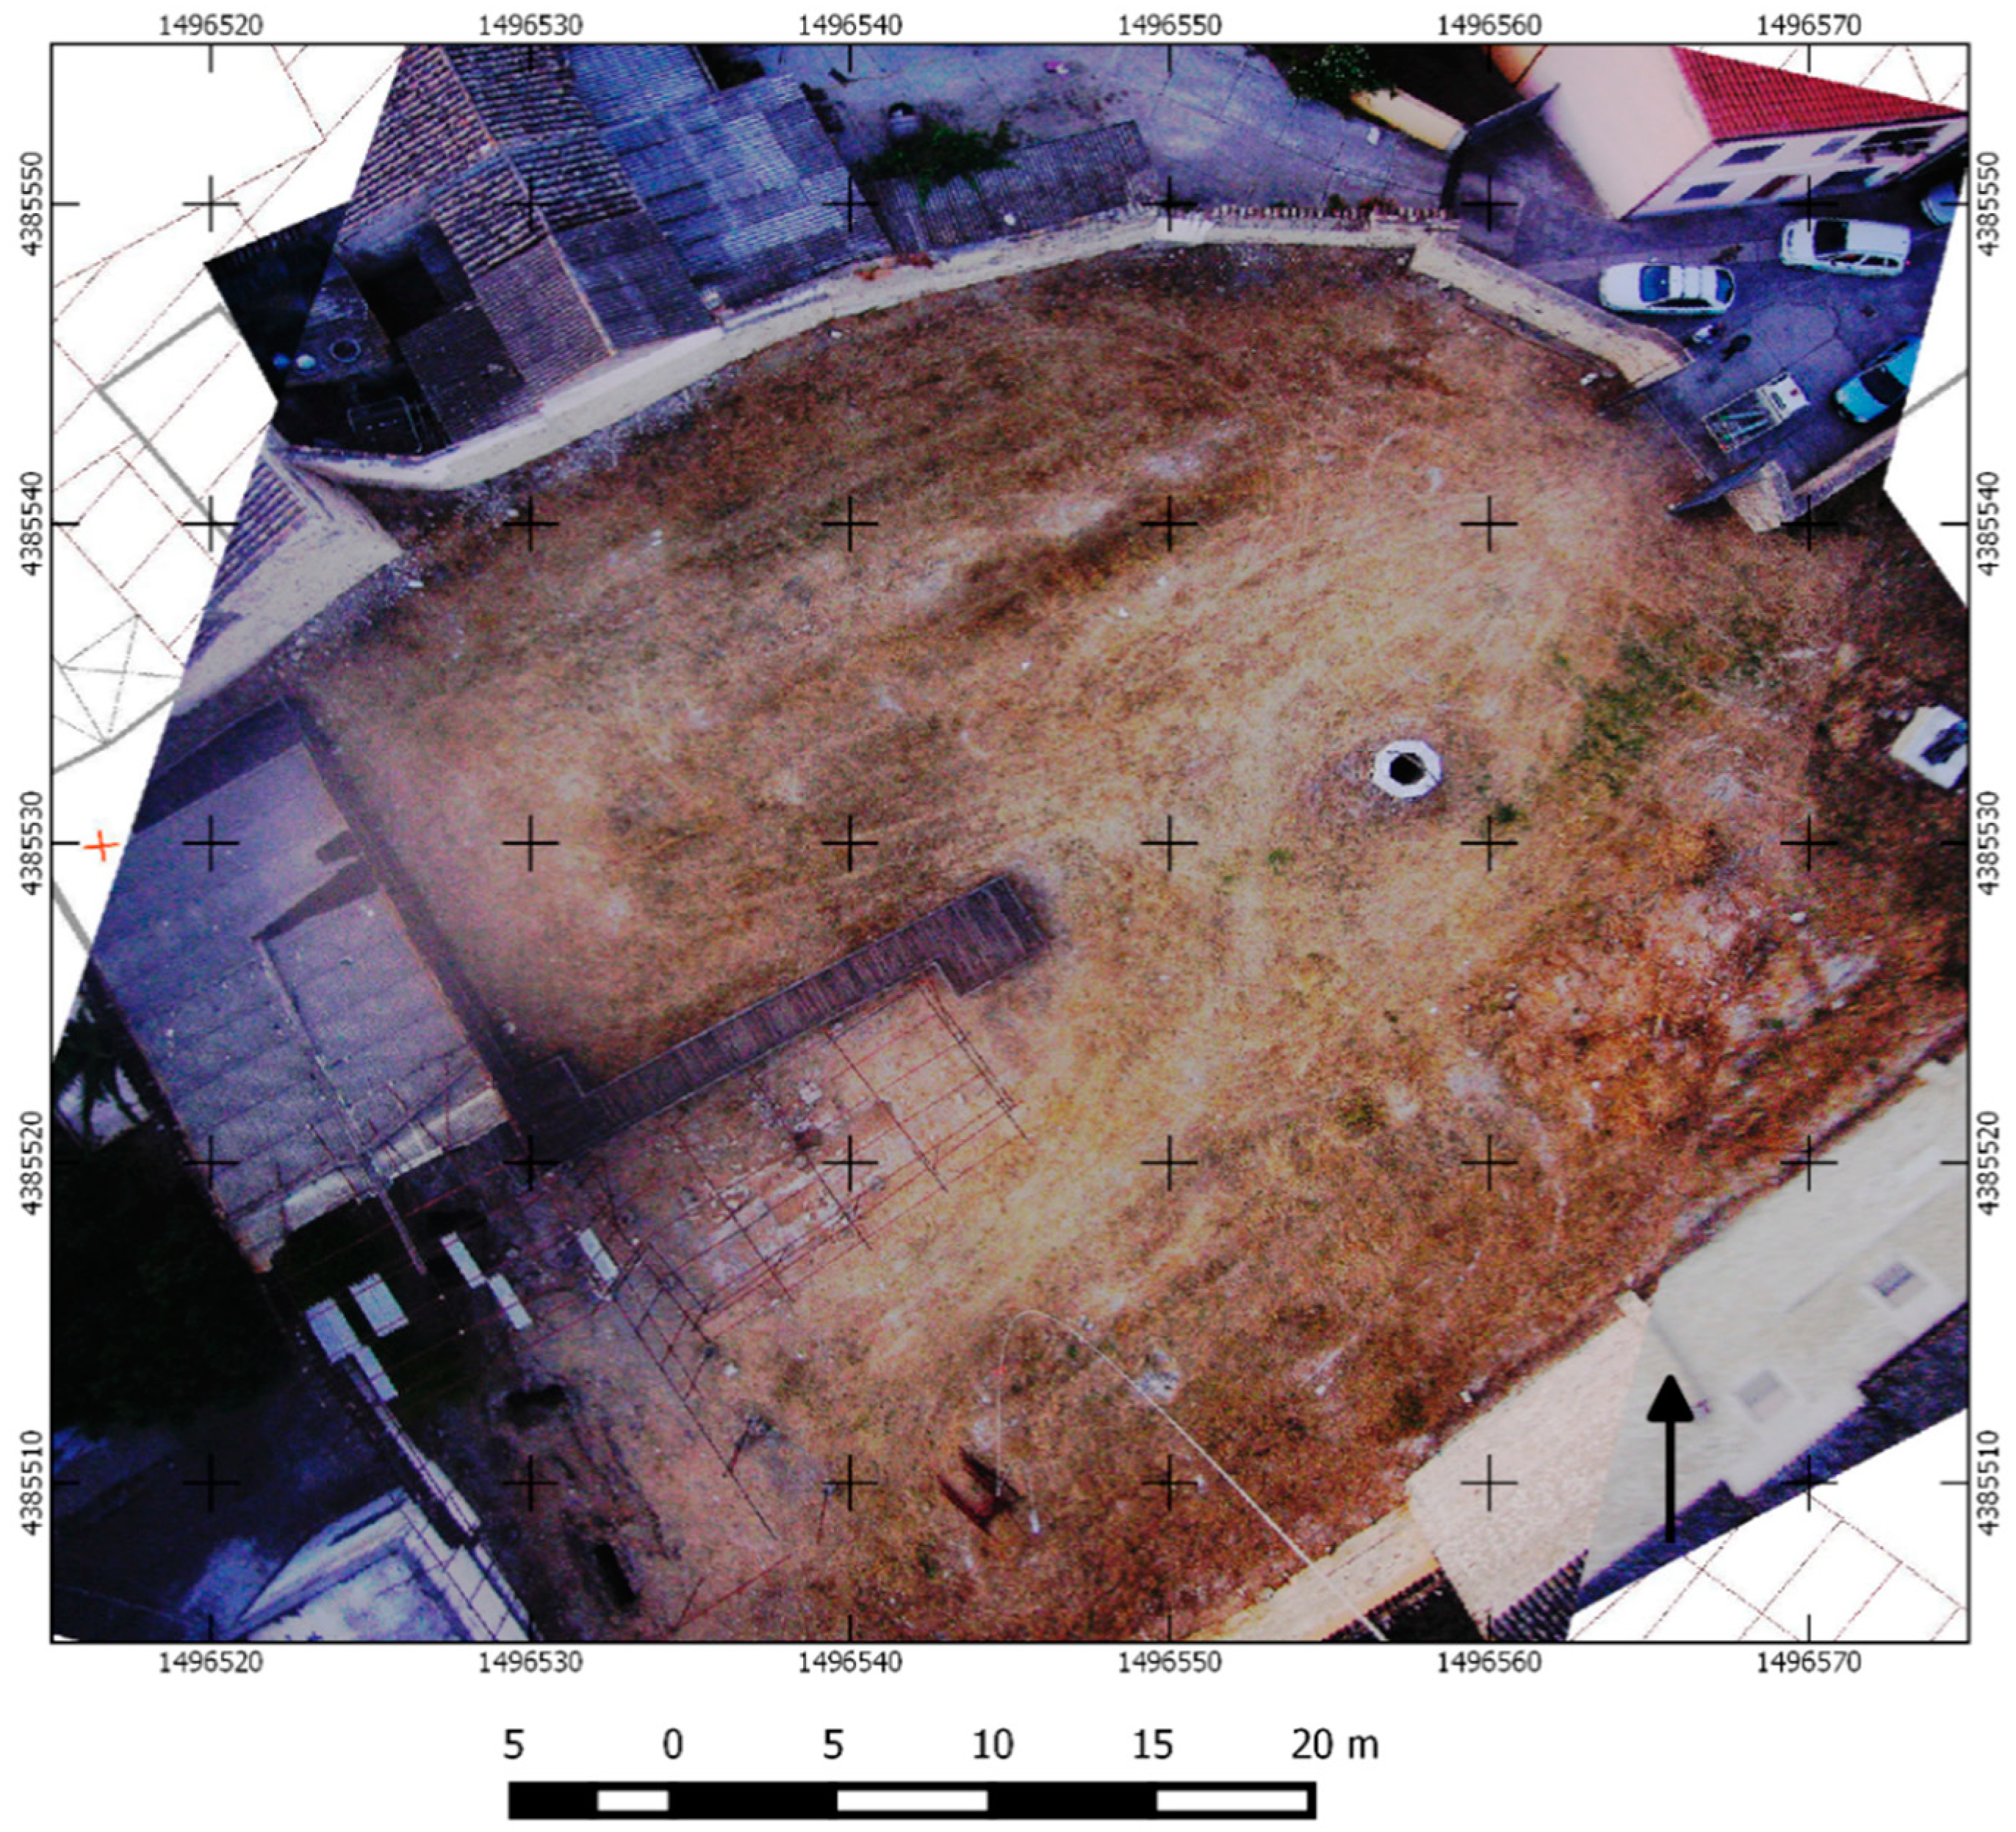
A high resolution aerial photographic survey was also carried out during the thermal aerial survey with a digital camera mounted on the balloon (
Figure 9). As a result, we have a detailed, complete vision of the thermally-monitored surfaces and, so, can eventually evaluate the different cover types and, consequently, the possibly different albedo (for energy storage) and emissivity at the wavelengths of acquisition of the thermal camera (for energy release).
Figure 9.
The aerial pictures of the test site acquired by the camera hanging from the balloon.
Figure 9.
The aerial pictures of the test site acquired by the camera hanging from the balloon.
In the areas free from grass, in the center of the area of study, it is possible to observe the superimposition of building wall remains with archaeological features. Recent diggings have confirmed the presence of foundation walls and tombs, in agreement with the filtered photographs (
Figure 10).
Figure 10.
The filtered zoom of the picture in
Figure 9 (central part, near the gangway).
Figure 10.
The filtered zoom of the picture in
Figure 9 (central part, near the gangway).
3. Discussion
The combined radar, thermal and photo survey allowed us to detect anomalies possibly related to known and unknown archaeological targets.
Figure 11.
(a) The aerial photograph of 1977 with the tracking of some alignments of some of the main walls in yellow; (b) the GPR map at a 0.50-m depth with tracking of alignments in gray.
Figure 11.
(a) The aerial photograph of 1977 with the tracking of some alignments of some of the main walls in yellow; (b) the GPR map at a 0.50-m depth with tracking of alignments in gray.
Overlaying the GPR maps with the historical aerial photographs, the alignments of the map at a 50-cm depth clearly correspond with some walls of the old destroyed houses, so that only the deeper linear features must be considered as potential archaeological remains (
Figure 11a,b).
Shallow concentrated anomalies could be due both to very shallow tombs (in similar configurations to the existing ones) or to piles of rubble from the destroyed houses (
Figure 3a,b). Regarding deeper, isolated GPR anomalies, we can have the same two different origins.
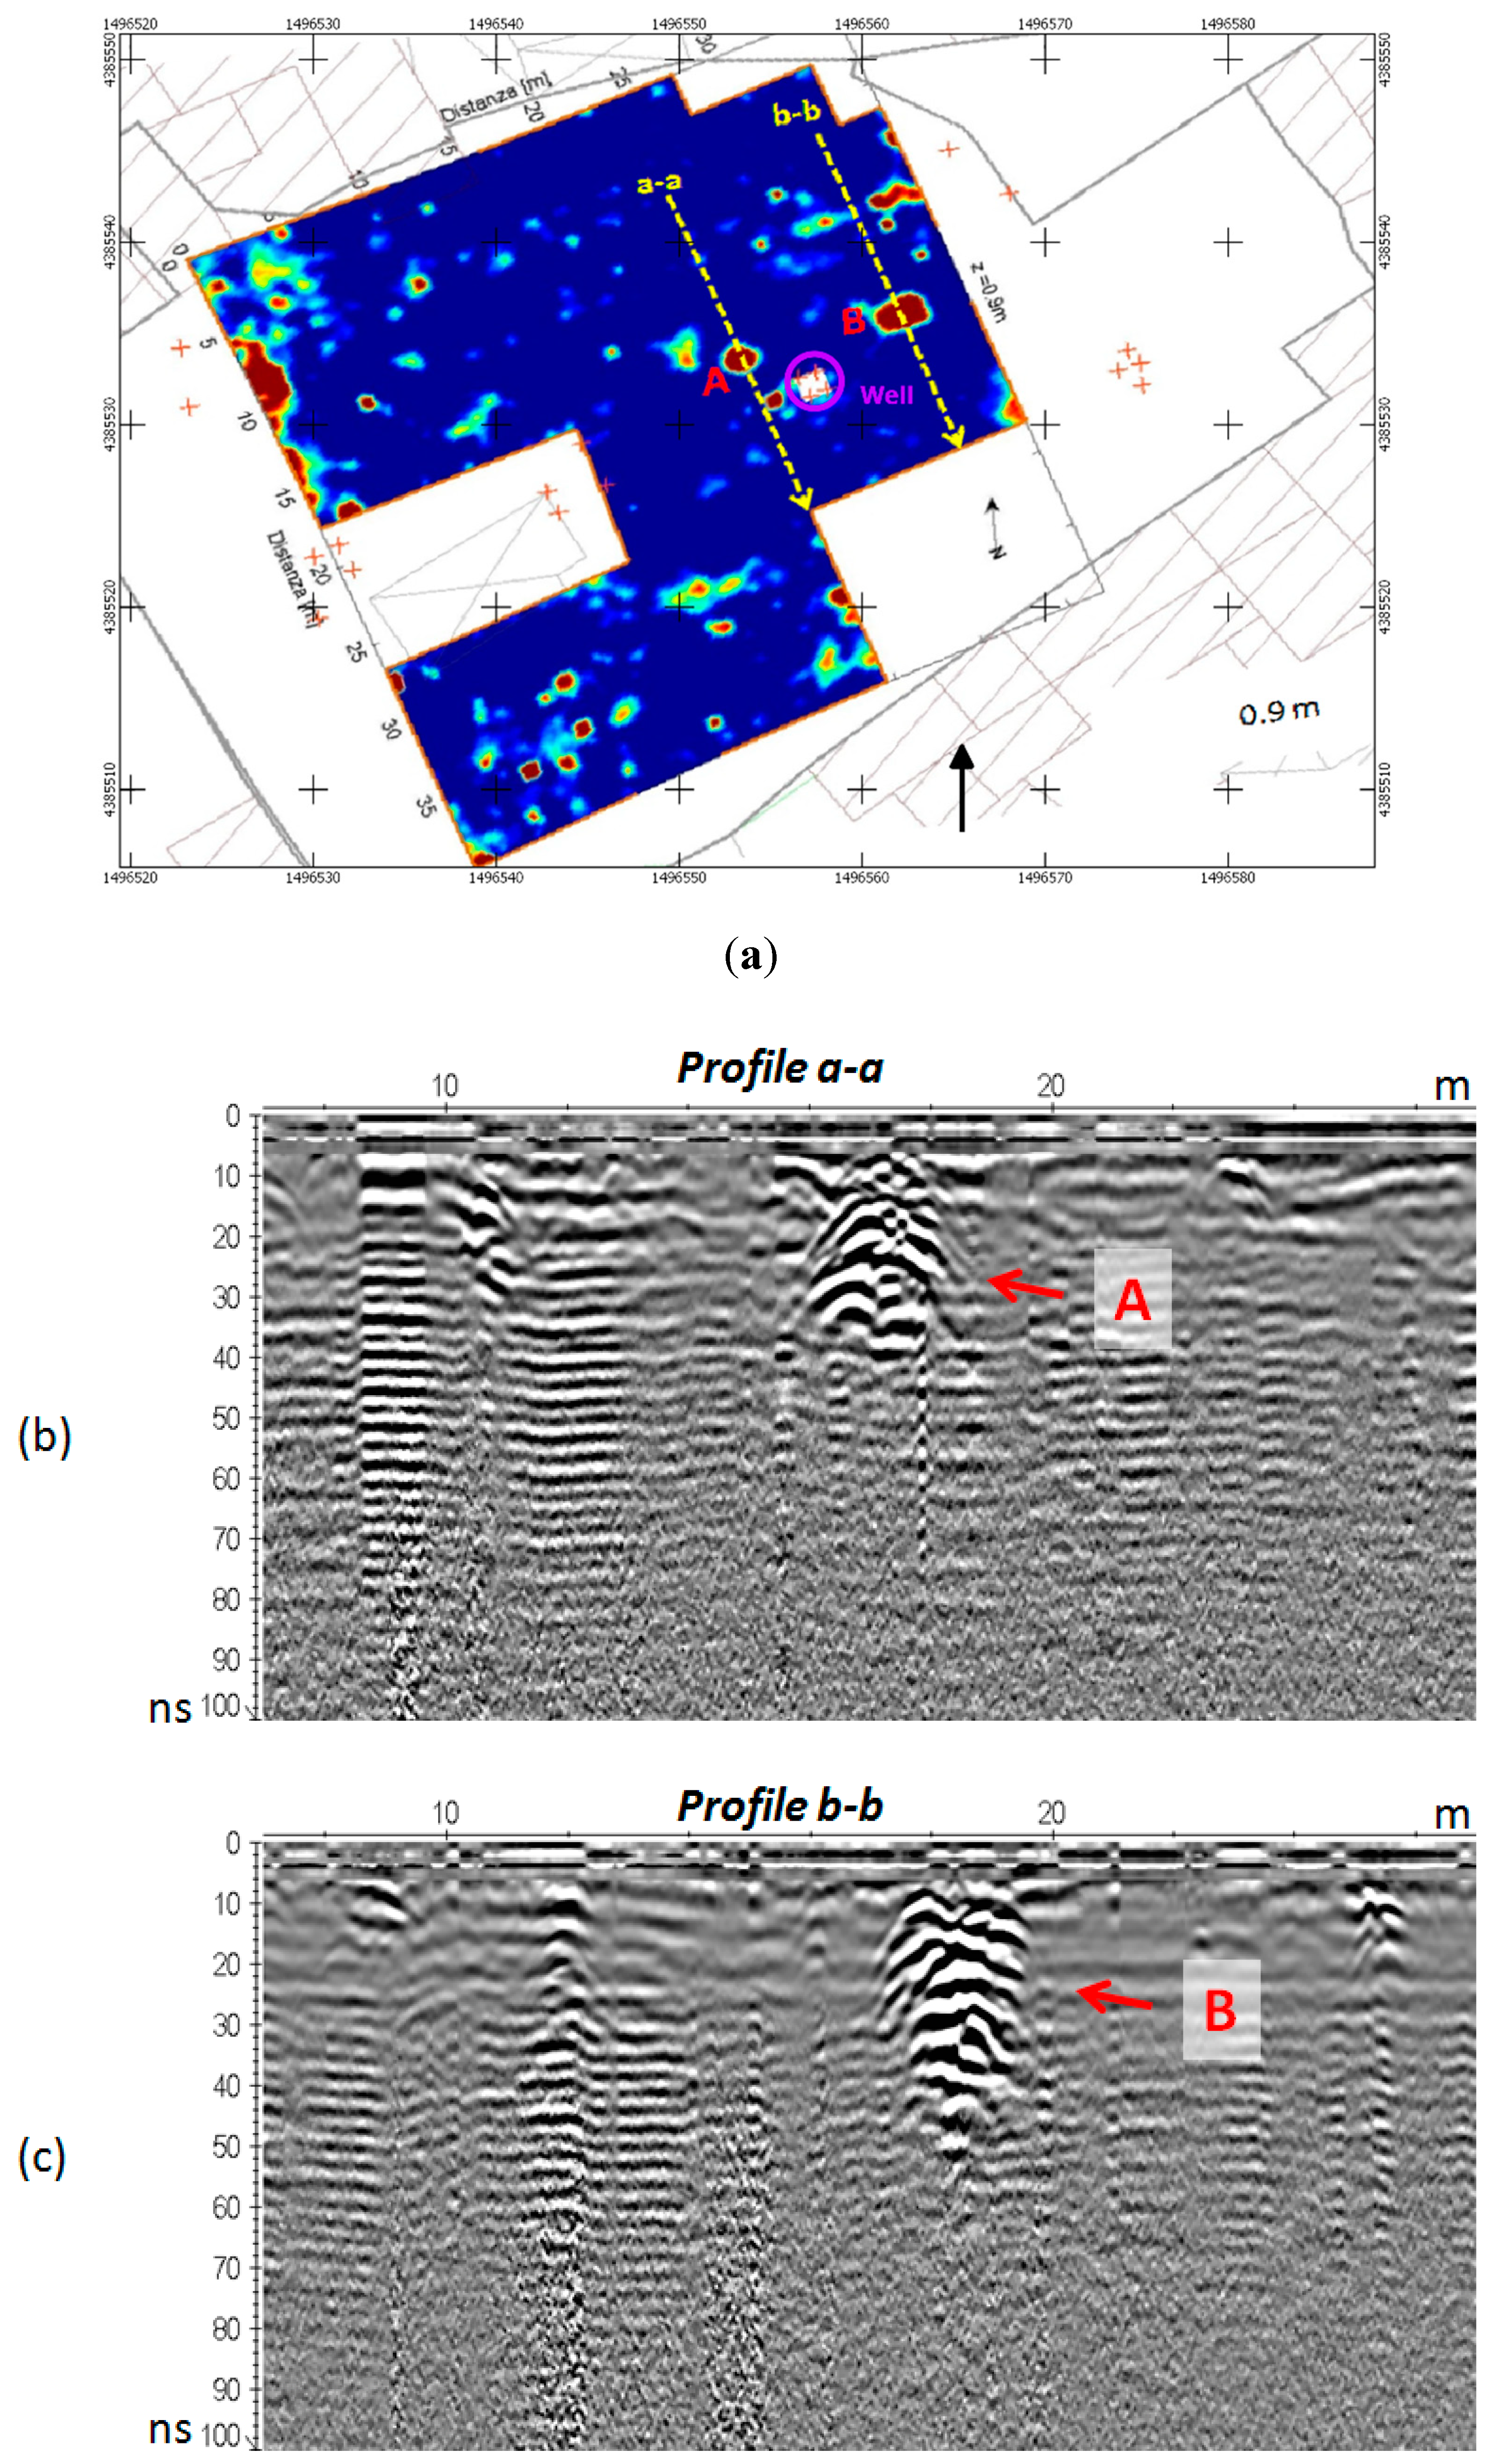
Looking at
Figure 12, we can observe the radar profiles crossing the two bigger anomalies present at a 90-cm depth. Radargrams have clear hyperbola sectors, in correspondence with the anomalies, A and B, which start from shallower layers. The observed radar signal is compatible with the presence of pit tombs because of the dimension, depth and regularity of the hyperbola, while they should have been more irregular and chaotic in the presence of rubble or more extended in correspondence with chamber tombs (which are also expected to be deeper).
A small GPR anomaly located near the well, which is indicated with a violet circle, and the radargram a-a of
Figure 12 may be due to shaft or capuchin tombs, because from the thermal survey of
Figure 7 (thermal gradient unenhanced map), we detect thermal features similar to ones present in exposed tombs in the western area (red patterns in
Figure 7). Without digging for direct archaeological proof, they can be also artifacts due to the lack of data in the border survey area.
The alignments of GPR maps at 90 and 130 cm (
Figure 3c,d) are the ones most indicated to reveal possible archaeological structures, but because of their linear shape, they seem unrelated to the tombs and could be due to the possible presence in the past of religious or civil buildings and infrastructure in the necropolis area.
The possible chamber tombs were excluded by GPR survey: they must have dimensions and depths different from what was found in the data and radargrams and must show linear anomalies in correspondence with the roof and diffraction hyperbola at the borders.
The thermal survey reveals anomalies not detected by the radar or aerial photos of the areas, in particular with a thermal gradient close to zero, which could be traced to the presence of graves near the water well based on the similar behavior of exposed chamber graves in the western part of the site.
Although enhanced by wide angle lens aberration, the area to the north shows greater thermal gradient values that are related to greater nocturnal cooling. This could be a sign of less compact and lower thermal inertia ground.
The thermal anomalies around the well may be due to shaft or capuchin tombs only partially detected by the GPR survey (
Figure 12), maybe due to the low contrast of electrical properties in this kind of tomb and to their small dimension related to the distance of the radar profiles, because similar thermal features are present in exposed tombs in the western area (
Figure 7). Without direct digging for archaeological proof, they can be also an artifact due to the lack of data in the border survey area.
Although intermediate thermal products (intercept temperature and night thermal gradient) have been produced in real physical scales, archaeological interpretation has been conducted on enhanced maps with an approach more oriented toward recognition of geometrical patterns than toward reconstructing the real physical properties of the buried bodies. In intercept temperature and night thermal gradient maps, the variation range in apparent thermal properties was respectively about 14 K and 0.04 K/min, while the highest detected local contrast was in the order of 5 K and 0.01 K/min, respectively.
Figure 12.
Radargrams crossing the two big anomalies of the GPR map at a 90-cm depth: (a) The GPR map; (b) Profile a-a; (c) Profile b-b.
Figure 12.
Radargrams crossing the two big anomalies of the GPR map at a 90-cm depth: (a) The GPR map; (b) Profile a-a; (c) Profile b-b.
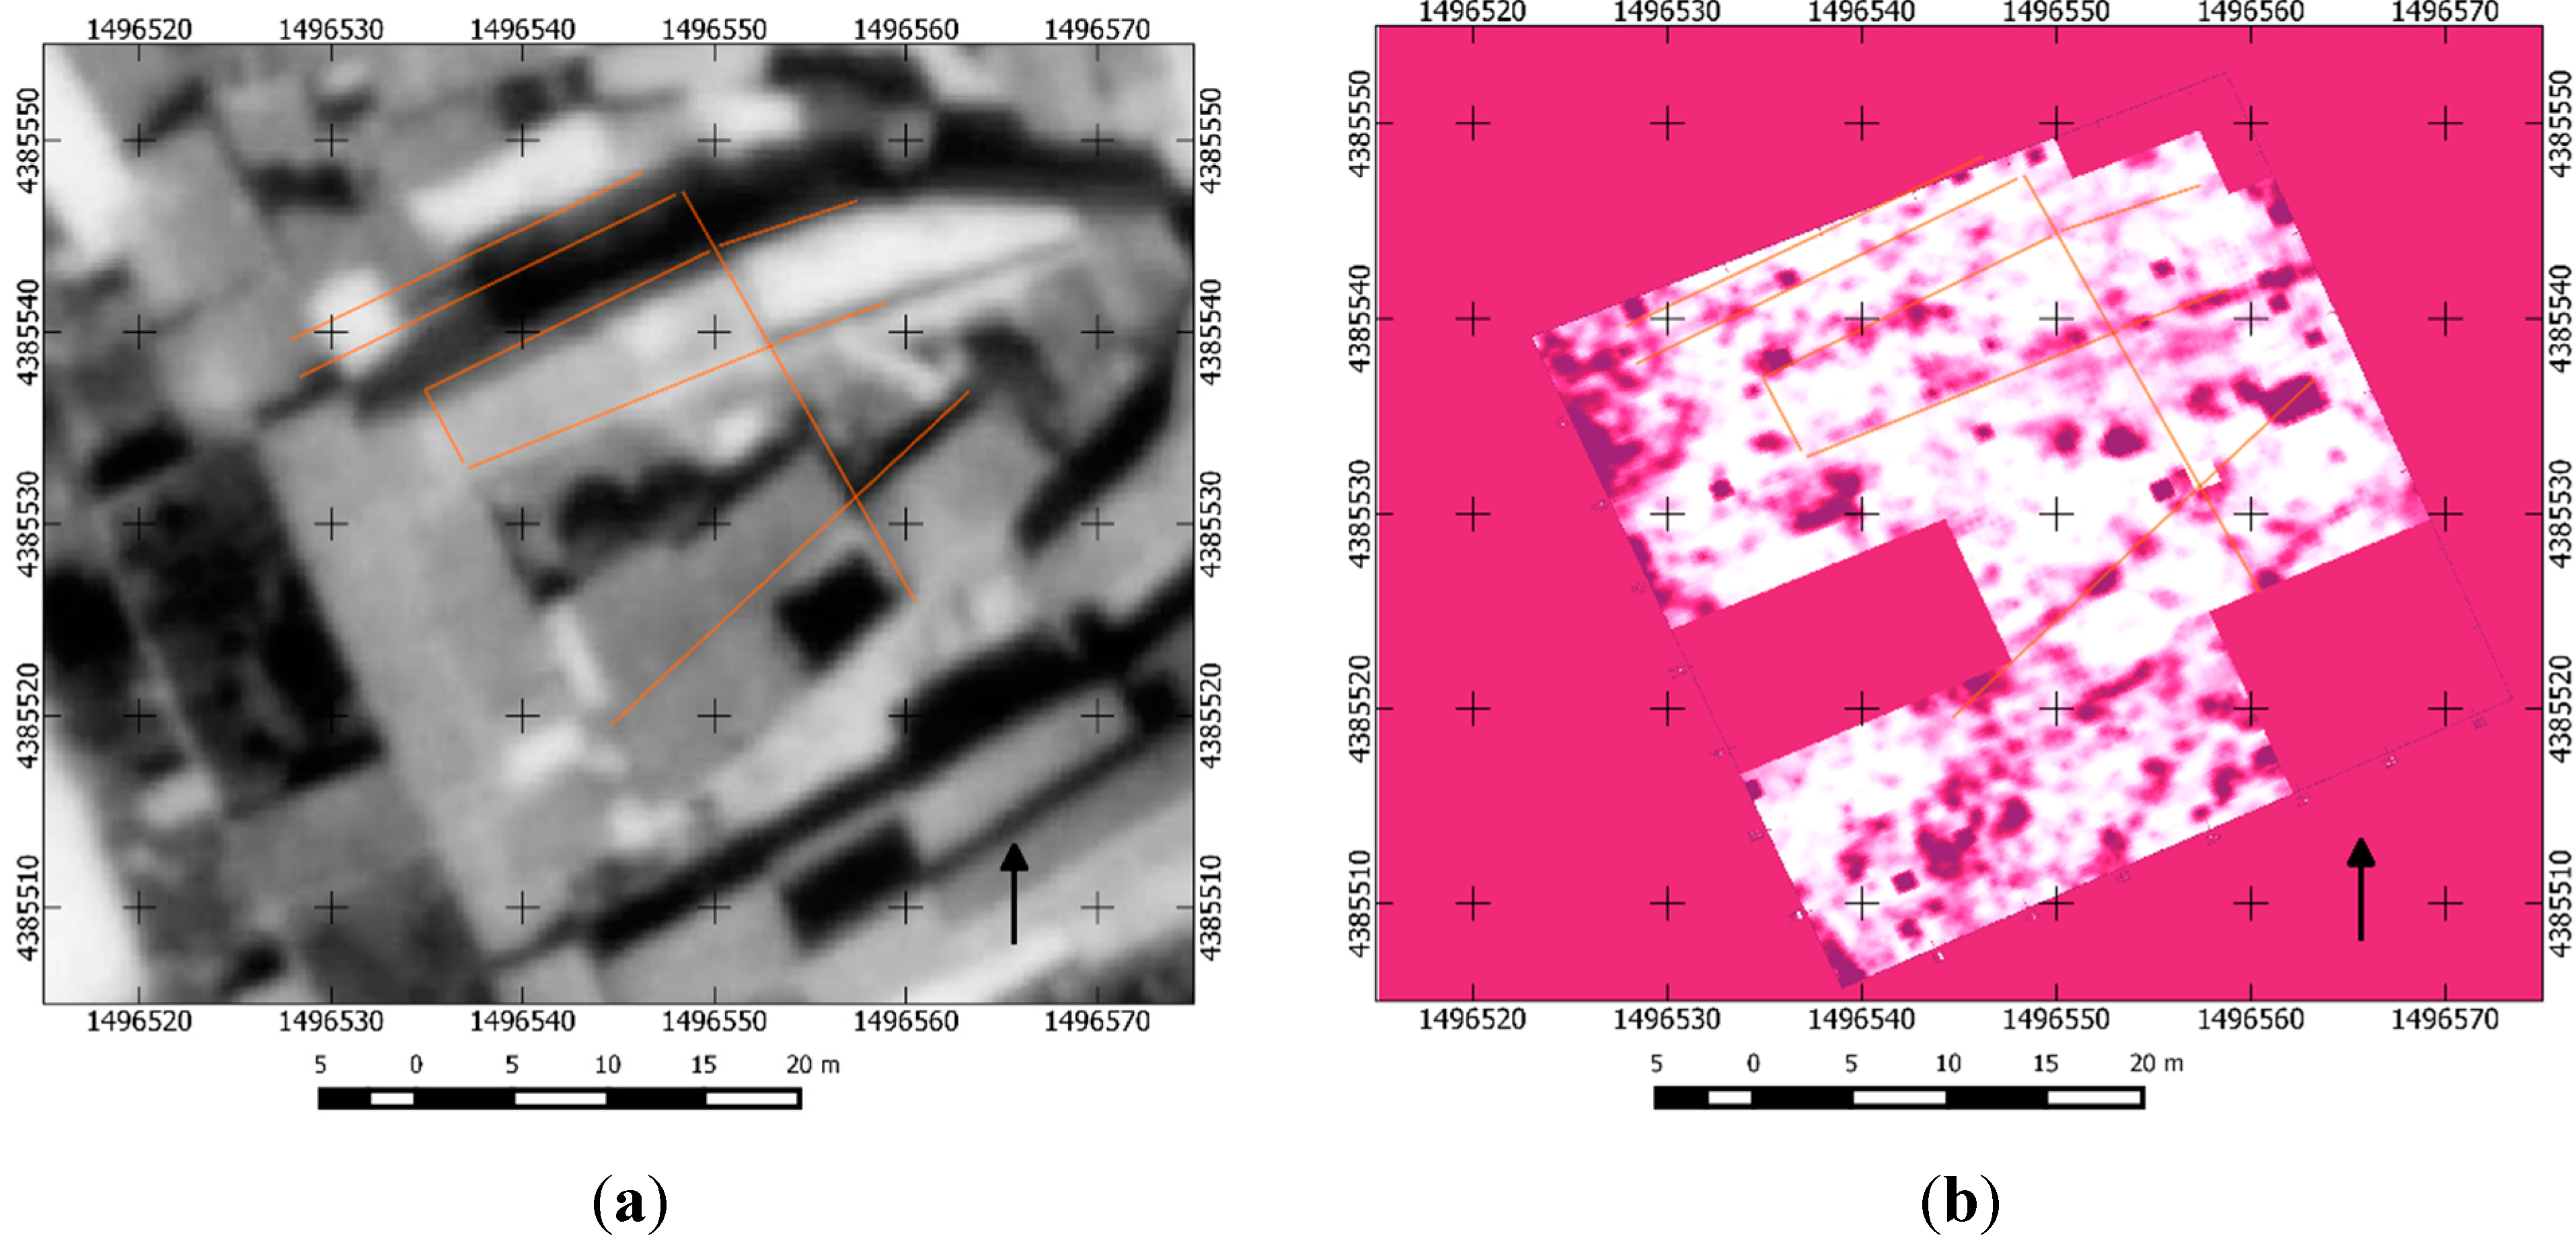
Overlaying the alignments of the historical photo to the thermal maps, we can note some correspondences of the former house locations with the thermal signatures. The correlation is clearer in the apparent intercept temperature map, where there is a correlation between the location of former buildings and the hotspots in the northern part of the map (
Figure 13). These hotspots in particular partially correspond to areas that currently have lower vegetation coverage and exposed soil.
Figure 13.
The apparent intercept temperature map, in Kelvin, in a stretched grayscale image shows correspondences with previous building alignments (see
Figure 11a) in the northern sector.
Figure 13.
The apparent intercept temperature map, in Kelvin, in a stretched grayscale image shows correspondences with previous building alignments (see
Figure 11a) in the northern sector.
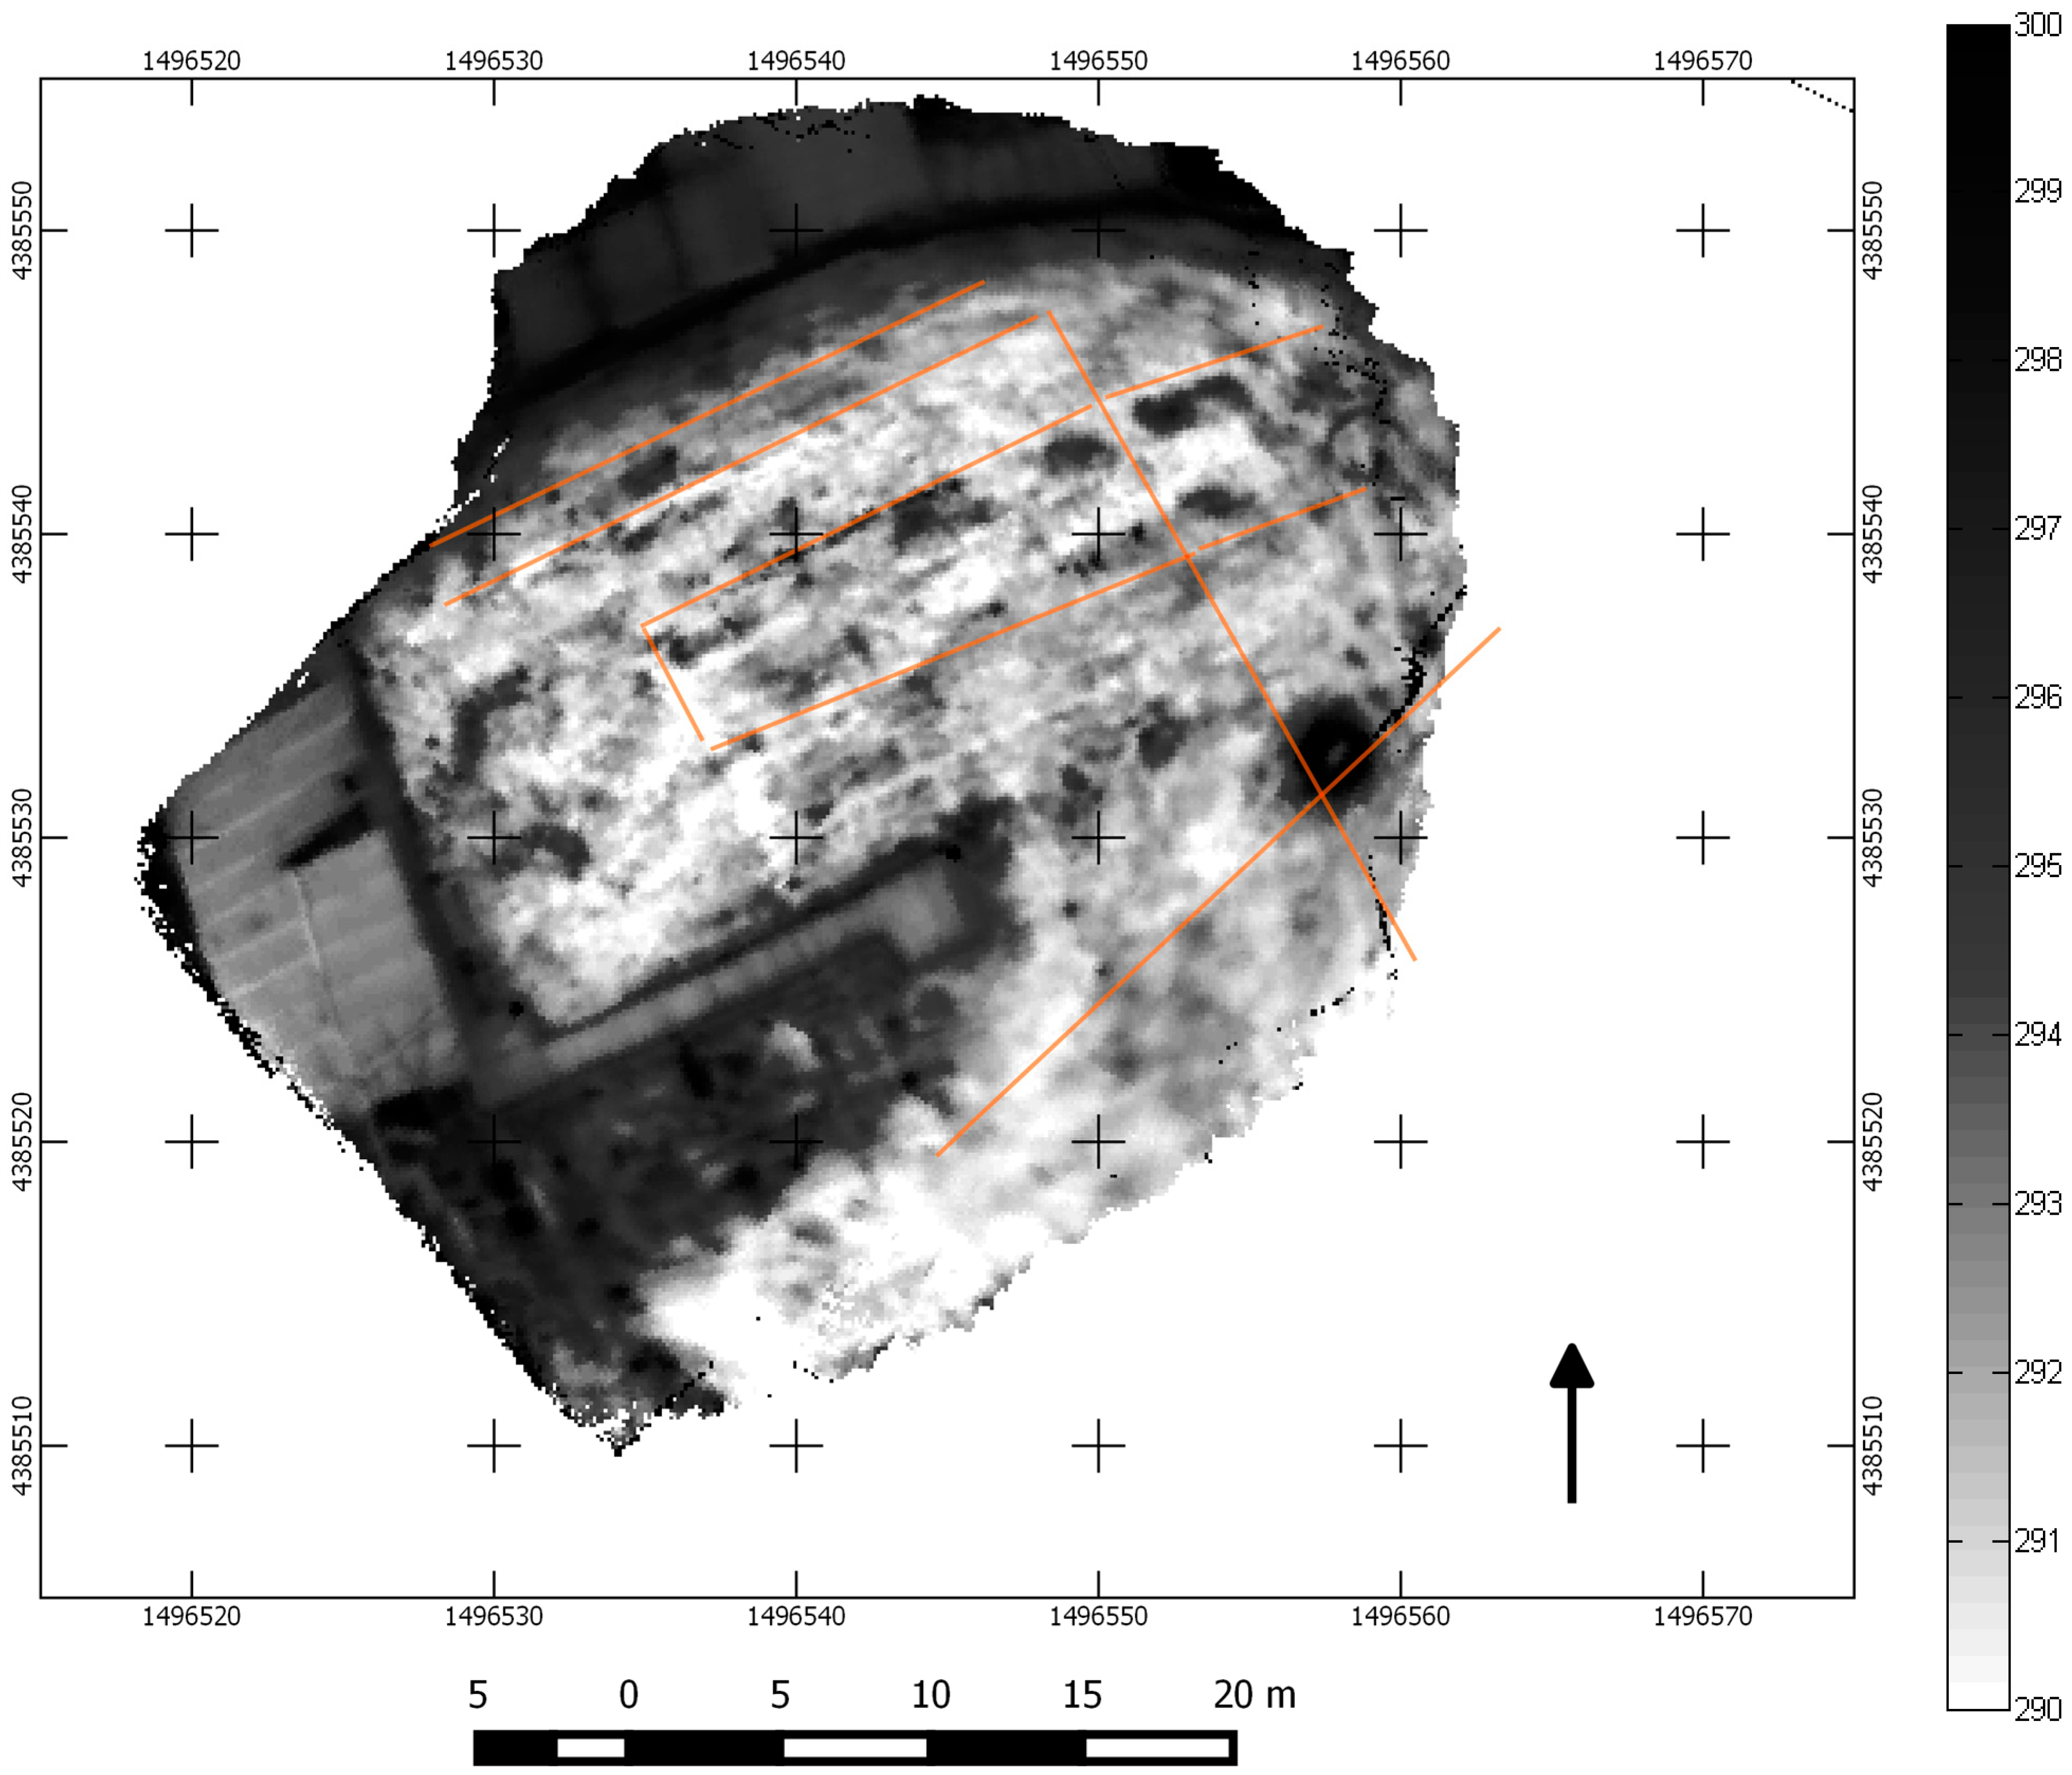
For the analysis of the NTG map of the histogram, enhancing of middle range values was done. After this, we can note weaker values than in the previous map (but still visible), correlating with historical building alignments in the north-central sector (
Figure 14). Darker areas in north and south-east boundary (see
Figure 7 for real physical values) correspond to areas with the highest negative thermal gradients: the northern area correlates with a former courtyard, while the south-eastern area is occupied by ground piles and rubble.
Figure 14.
The NTG map, after histogram enhancing of middle range values, shows weak, but existing correspondences with previous building alignments (see
Figure 11a) in the north-central sector. Other darker regions are shown.
Figure 14.
The NTG map, after histogram enhancing of middle range values, shows weak, but existing correspondences with previous building alignments (see
Figure 11a) in the north-central sector. Other darker regions are shown.
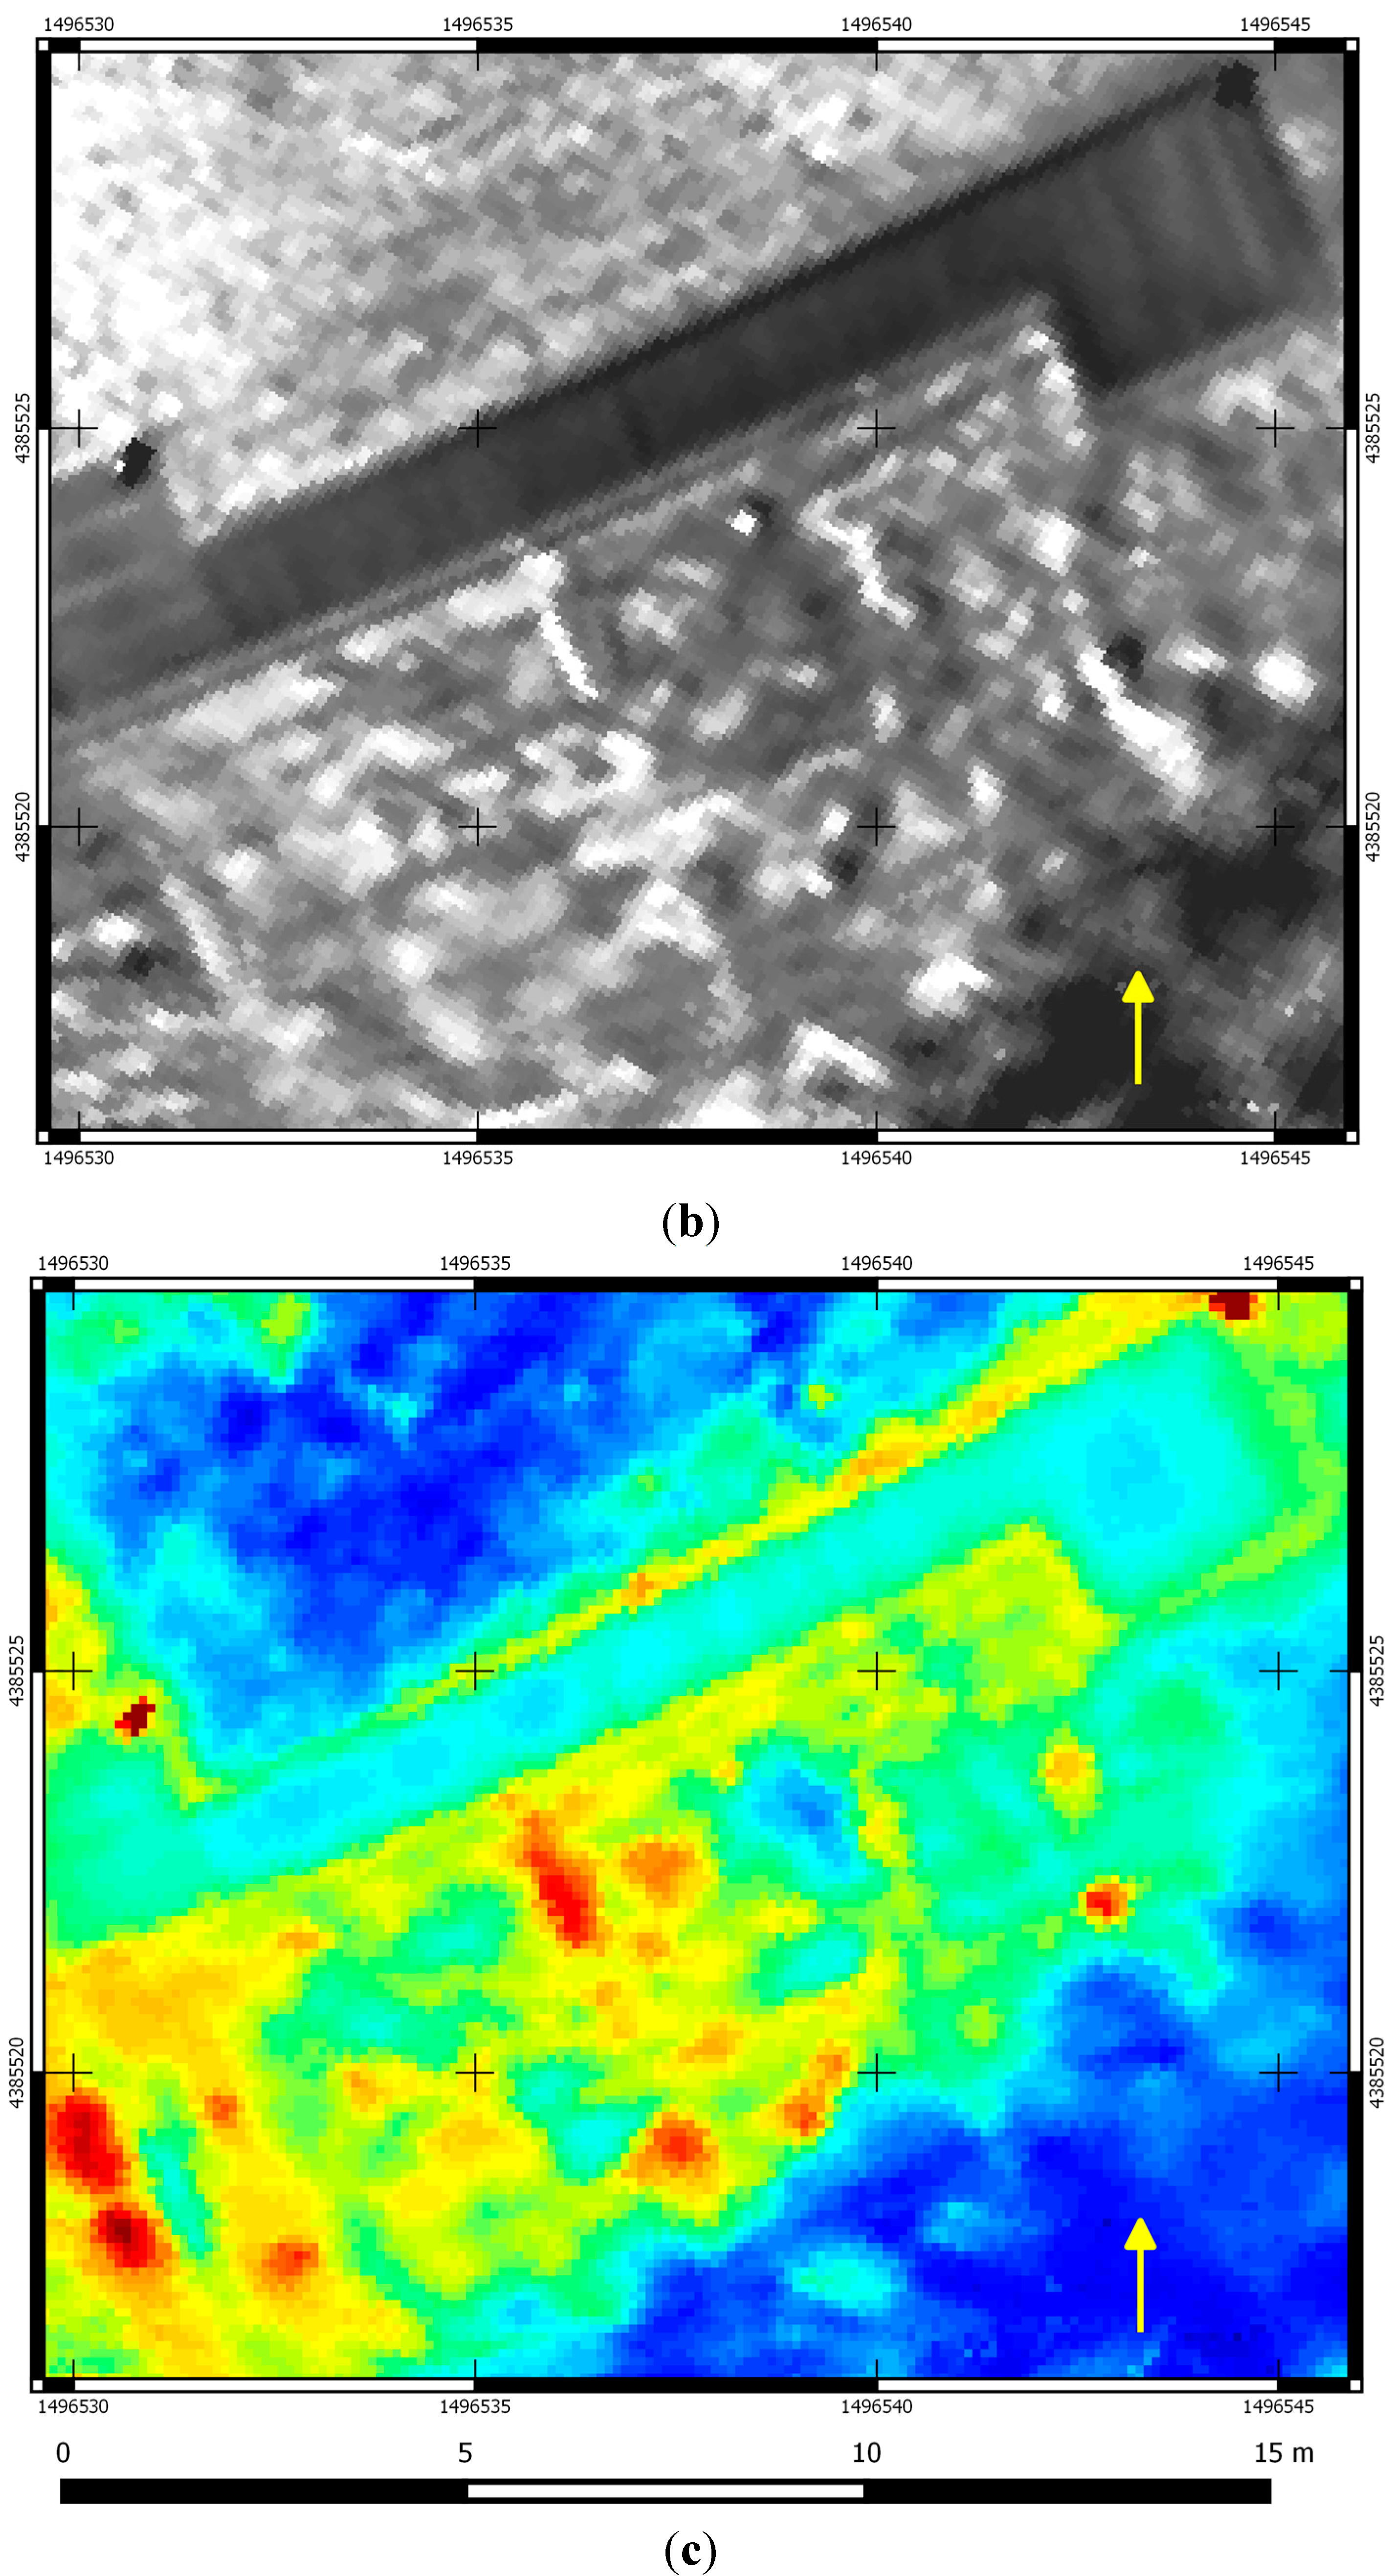
Figure 15.
Thermal and visible maps of the area in
Figure 10. (
a) The visible bands view; (
b) the NTG map; (
c) the intercept temperature map.
Figure 15.
Thermal and visible maps of the area in
Figure 10. (
a) The visible bands view; (
b) the NTG map; (
c) the intercept temperature map.
The detected thermal signal is generally very weak, close to the threshold of environmental noise, for which it has been possible to find reliable correlations only with the extended and linear elements found also in GPR maps. These findings are also corroborated by historical aerial photos, so it can be assumed that the detected linear anomalies are originated from the foundations of the walls of the destroyed old houses.
Figure 16.
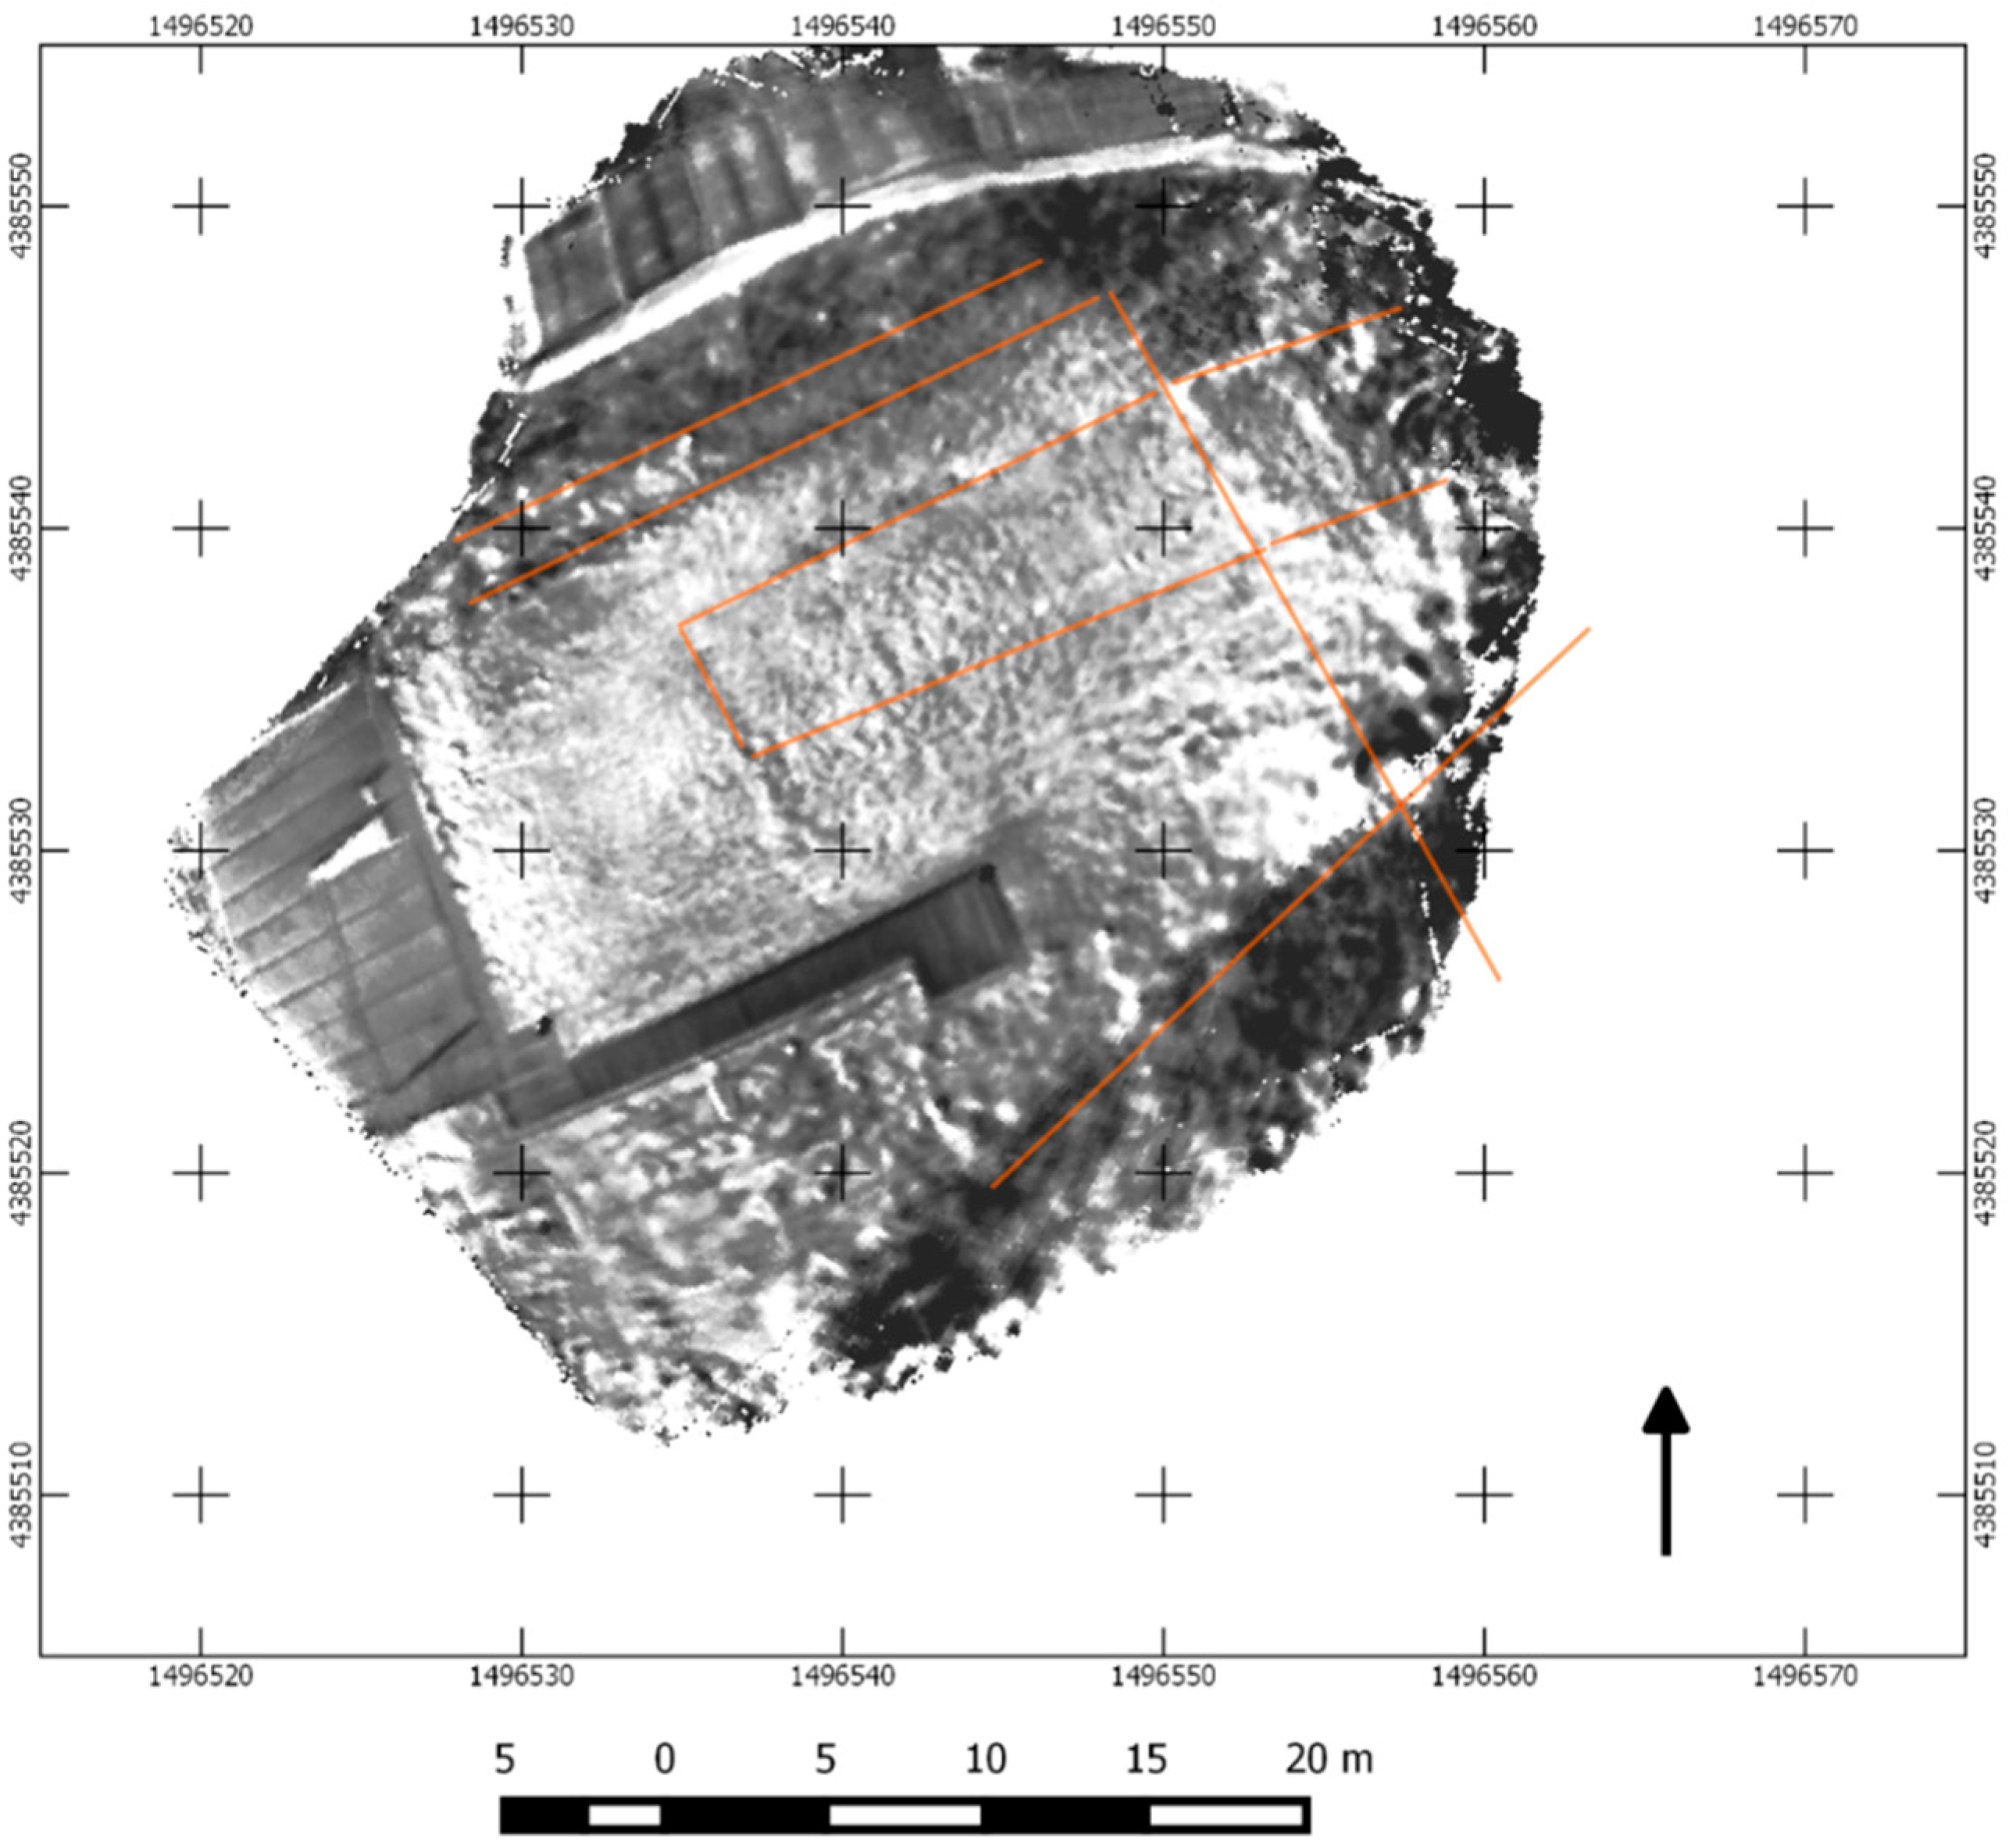
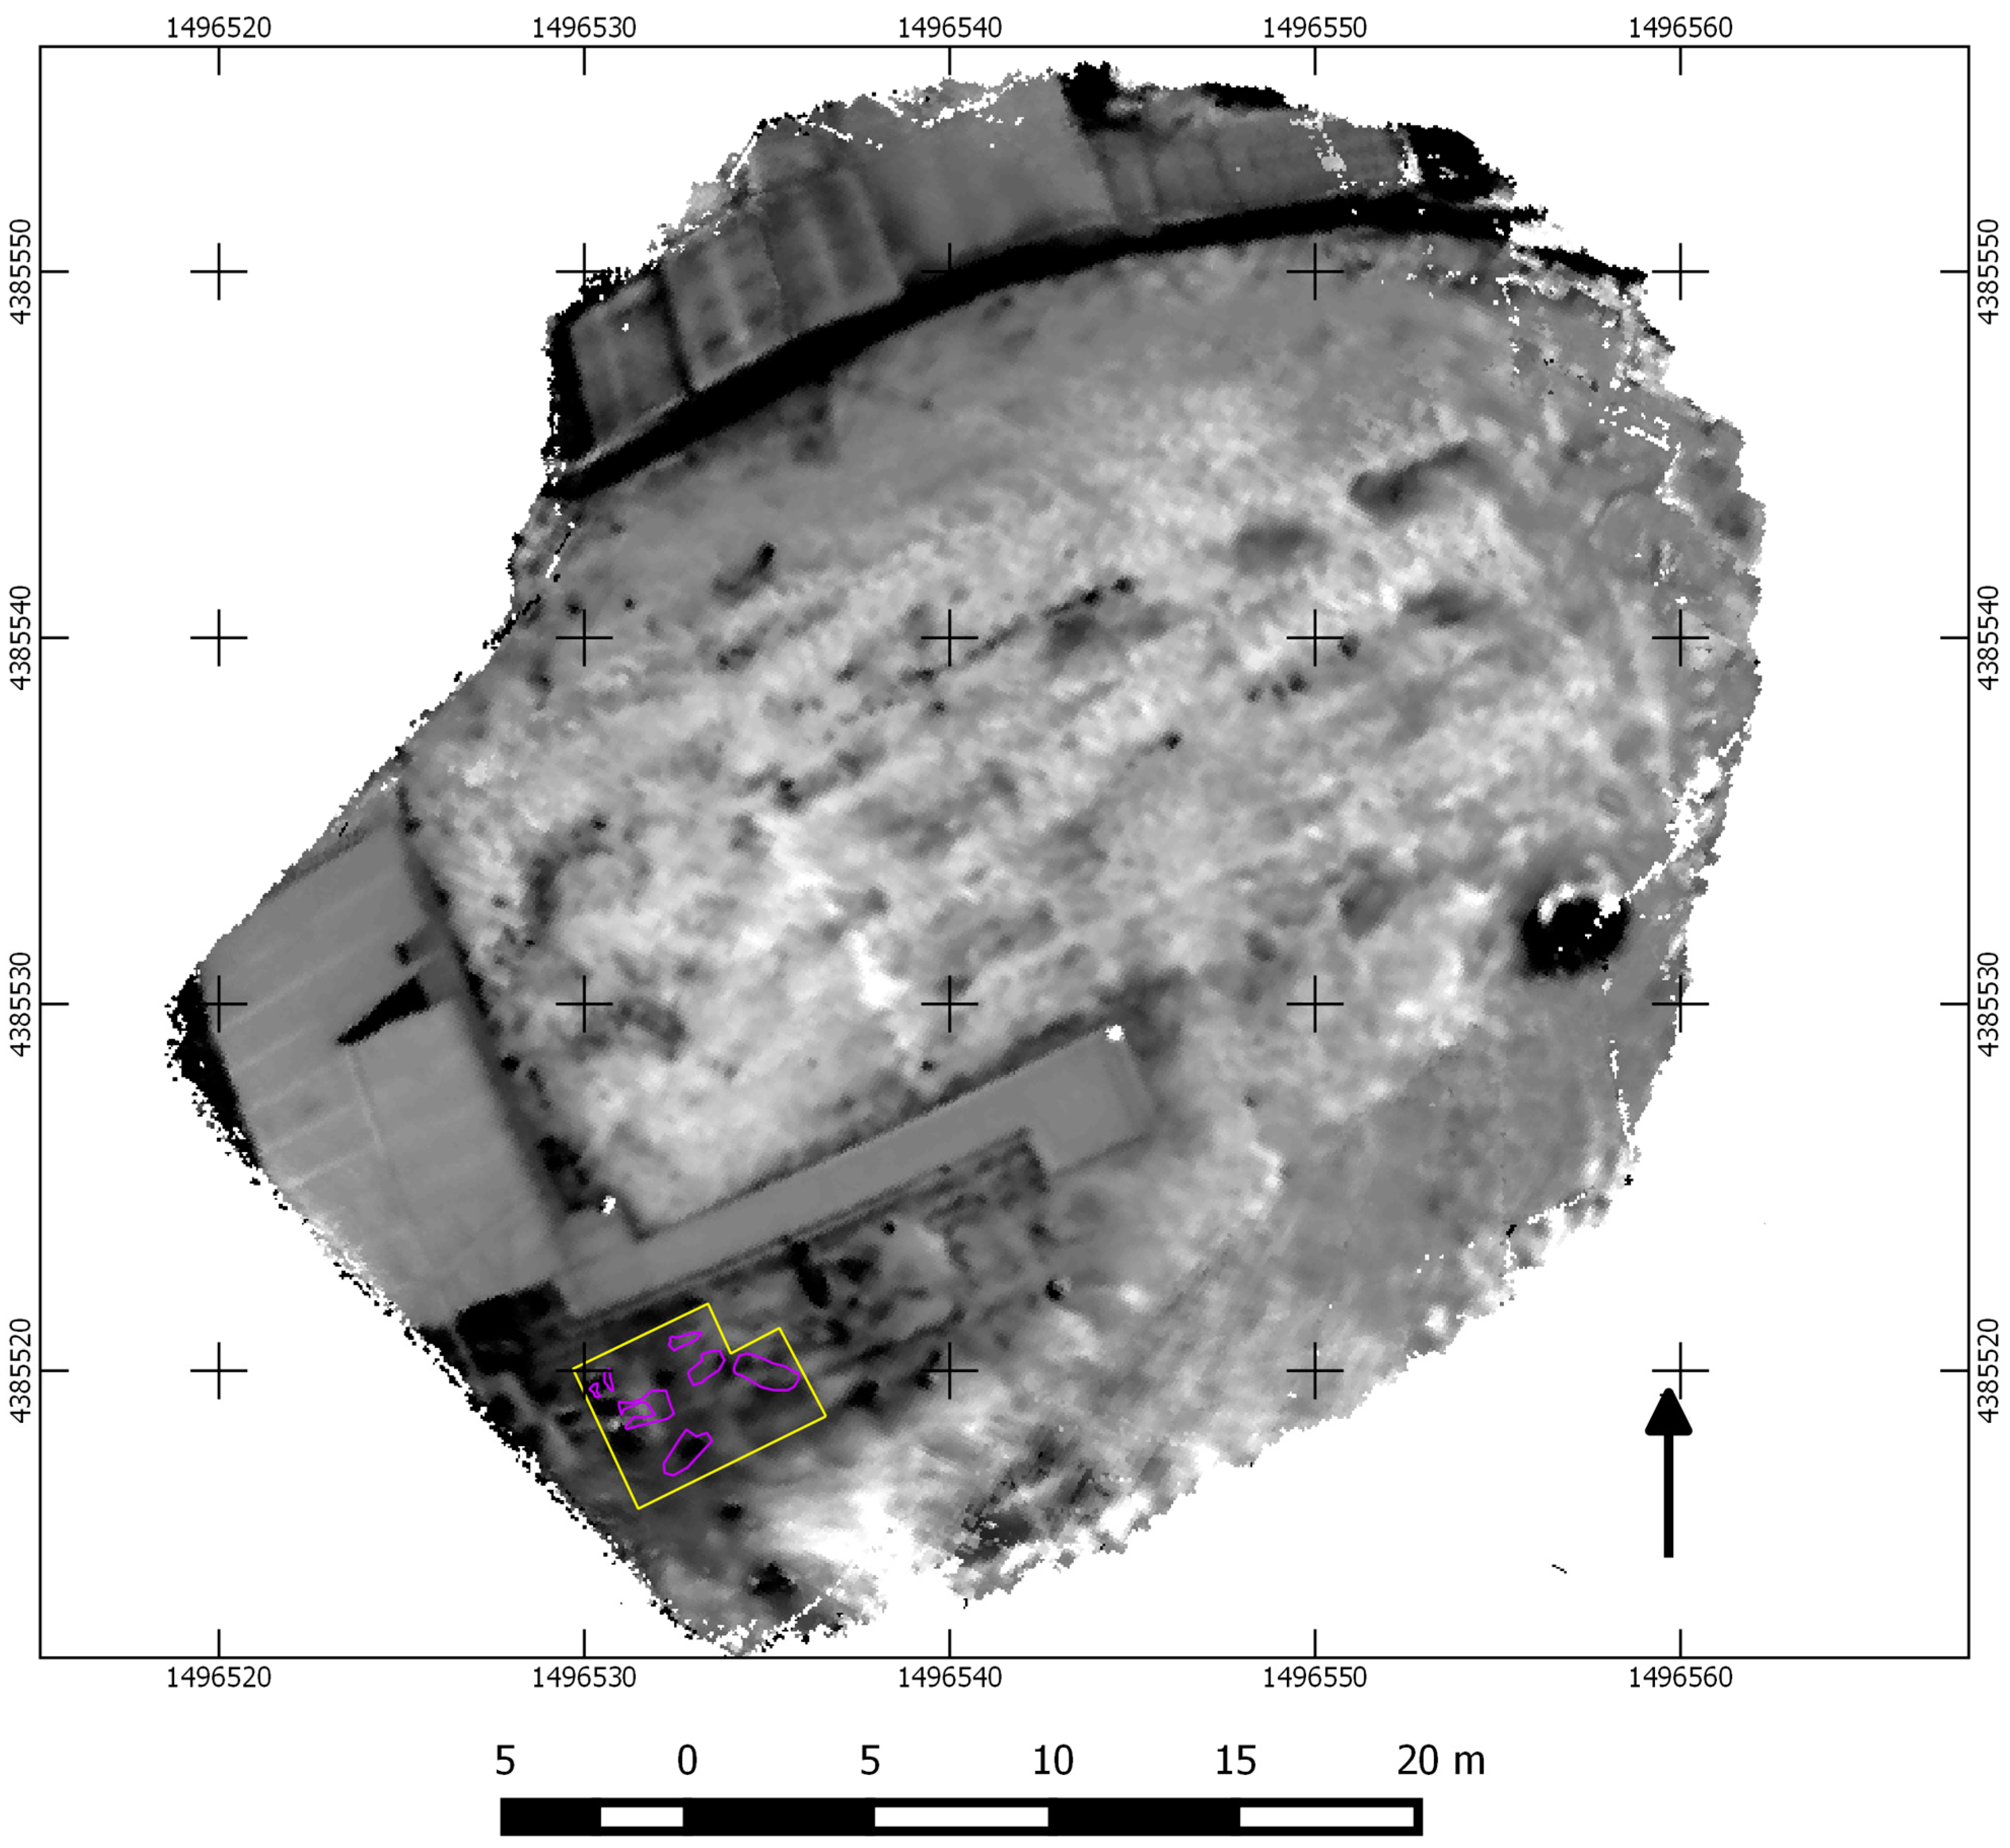
Map obtained by multiplying normalized intercept temperature by normalized NTG maps (both centered on the mean value). Positive values are darker, while negative ones are brighter. In the south-western part of the map, the border of the most recent digging area is indicated in yellow, while dug (after the survey) tombs are in violet.
Figure 16.
Map obtained by multiplying normalized intercept temperature by normalized NTG maps (both centered on the mean value). Positive values are darker, while negative ones are brighter. In the south-western part of the map, the border of the most recent digging area is indicated in yellow, while dug (after the survey) tombs are in violet.
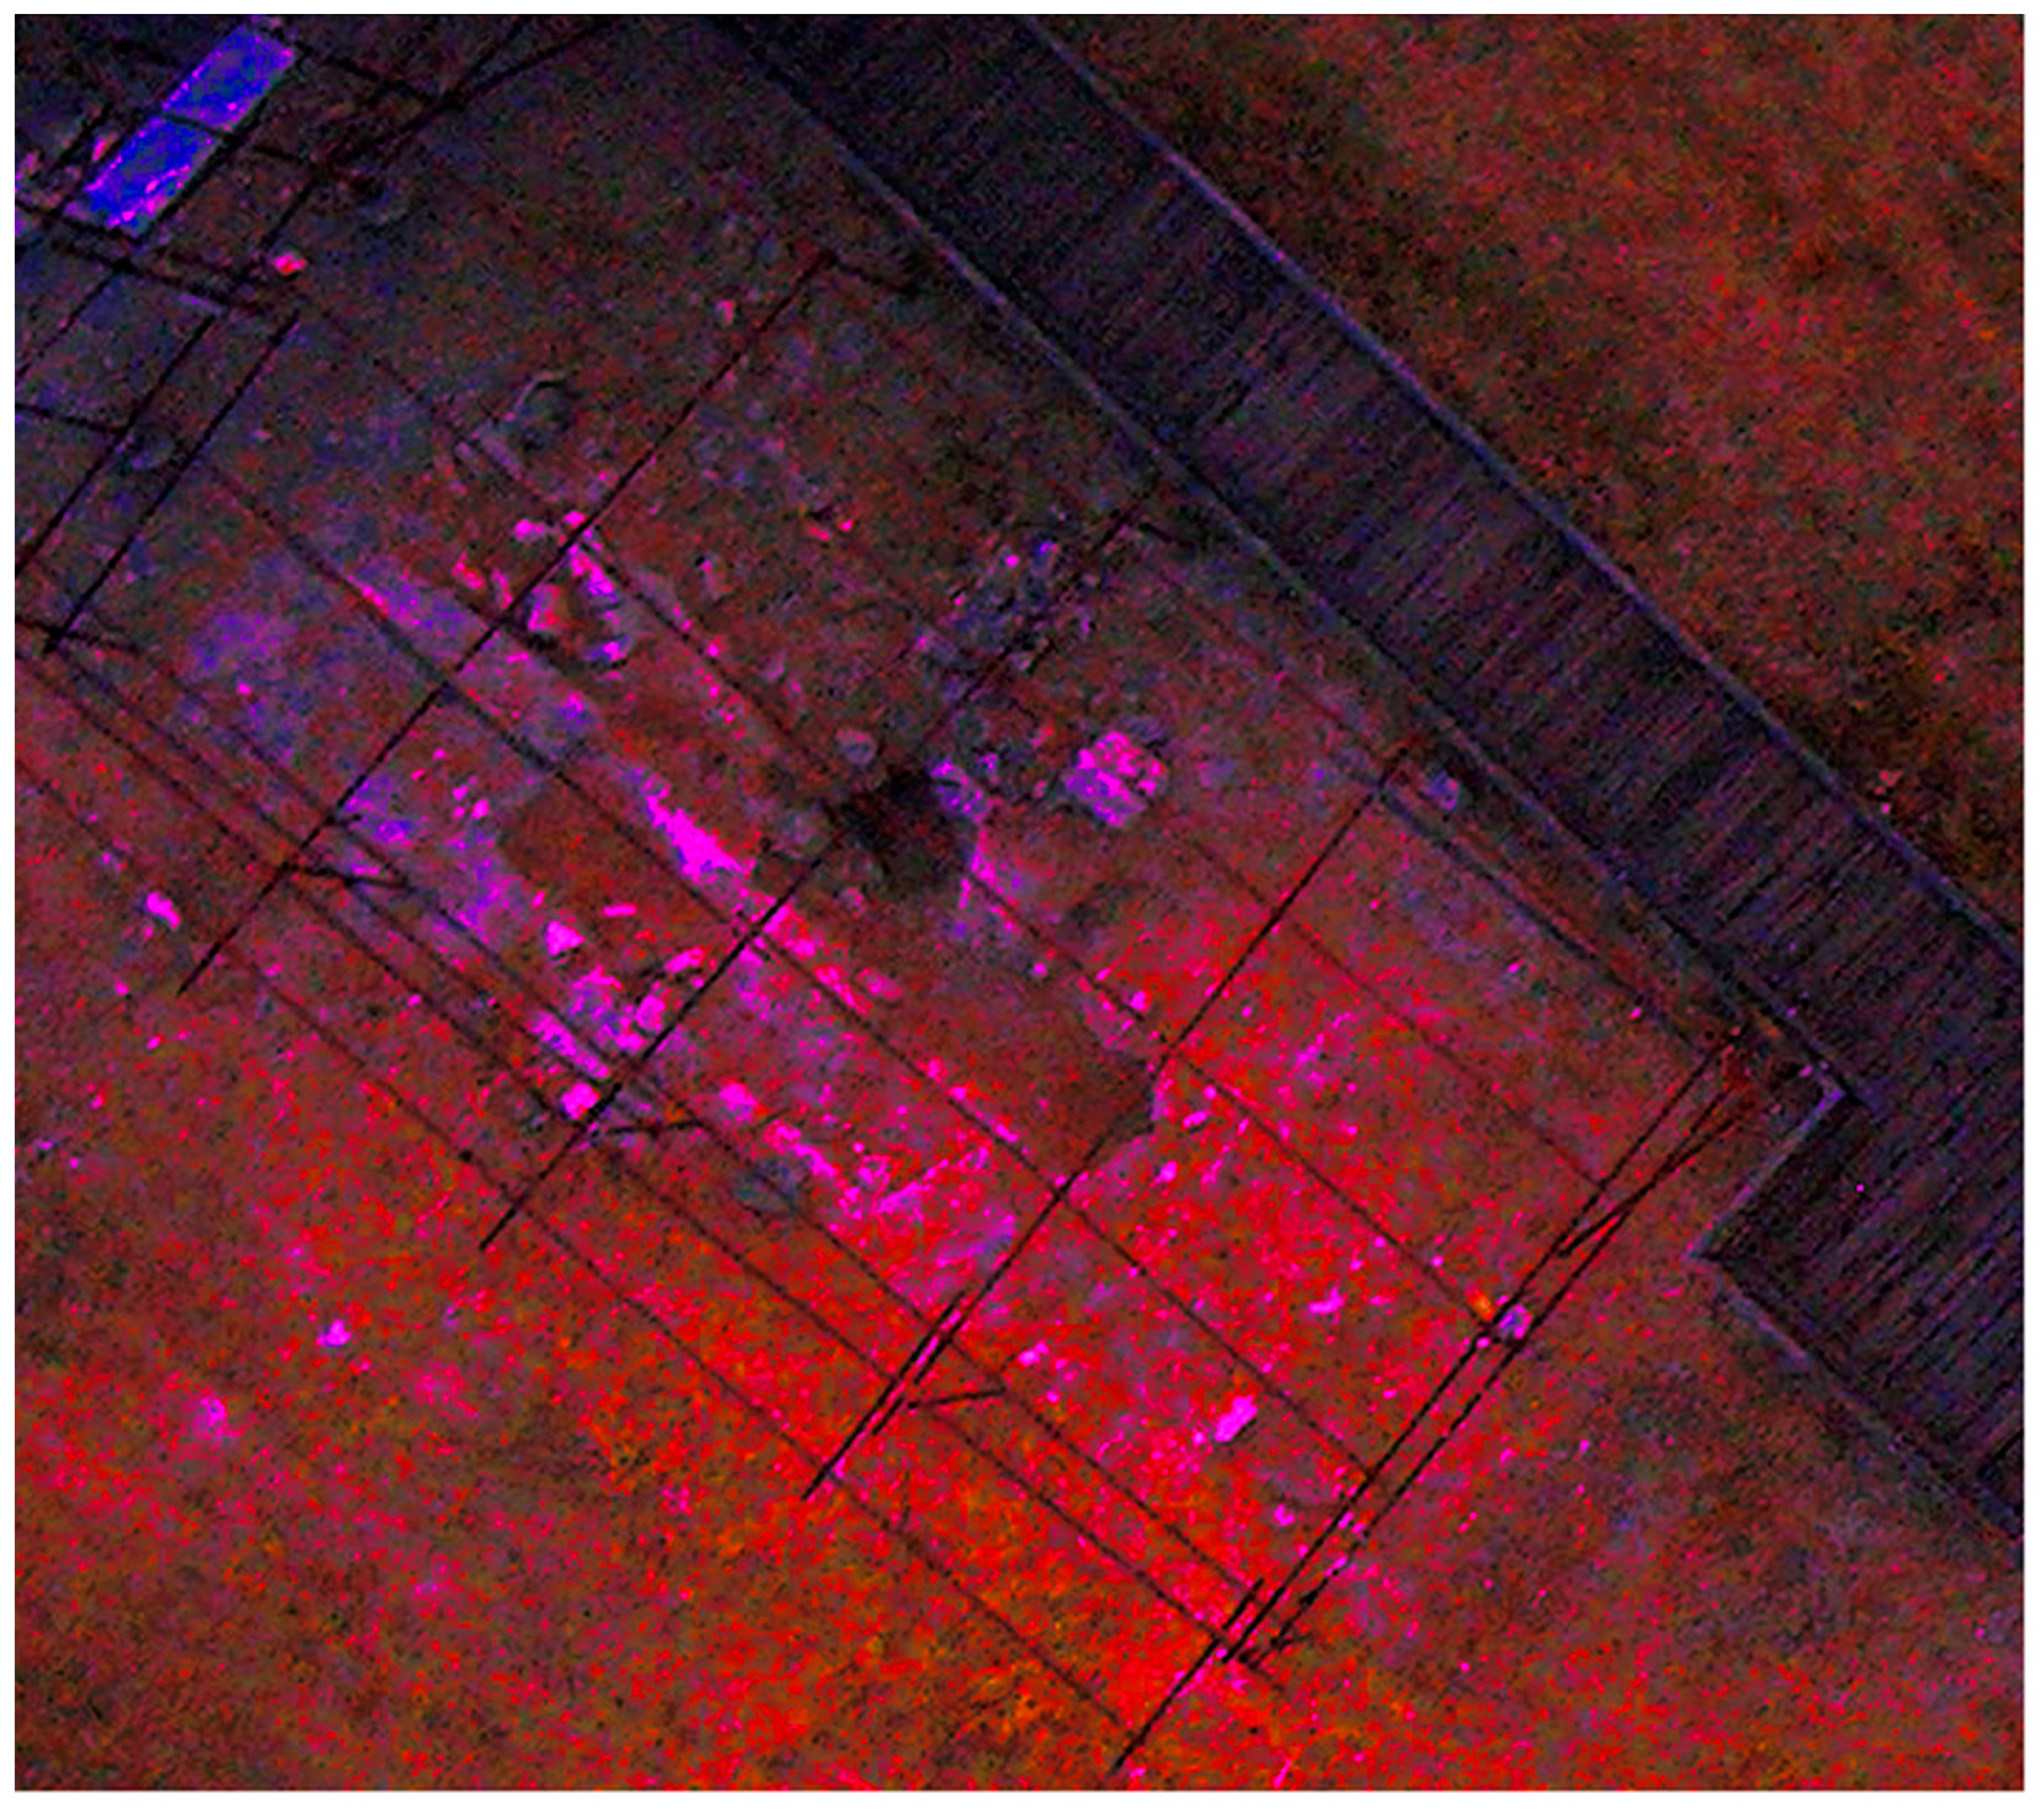
Looking at the same zoomed in area of
Figure 10, both the thermal and visible maps show some features corresponding to the partially bare structures (
Figure 15a–c) already shown in the filtered visible picture (
Figure 10). Iron pipes on the site are also partly thermally recognizable. This area is not covered by the GPR survey due to the inaccessibility of the surface at that time, because of pipes and ruins.
To enhance archaeological features through contemporary analysis of NTG and intercept temperature, a map has been produced by multiplying the two normalized thermal indices (
Figure 16). With this approach, positive values are the result of pixels that exhibit a high NTG (subject to quick cooling) and a high intercept temperature (caused by more intense heating before the survey) or pixels with slow cooling and slow heating; negative values correspond to the opposite behavior of the pixels during the daytime and nighttime and can be due to a temporary energy release from shallow layers under the surface during the early time of night. From this, we expect to distinguish possible voids immediately under the surface related to different kinds of tomb, such as chamber or chest tombs.
With this map, it is possible to distinguish areas with exposed stones (lighter areas in
Figure 16) from areas with soil coverage (darker areas).
In correspondence with the GPR anomaly indicated with A in
Figure 12a,b, singular thermal patterns were found (
Figure 17a, A). The signal is very near the threshold of the background, and the detection has been mainly made possible by the knowledge of the GPR analysis.
For a small region in the southern part of the map (yellow line border in
Figure 17b), it is possible to make a comparison between thermal patterns and archaeological features coming from actual digging works (September 2014). Some kinds of tombs (chest tomb,
Figure 17b, B) correspond to light thermal patterns in the excavated area, while for others (
enchytrismoi and pit tombs,
Figure 17b, C) no correspondence was found, probably due to filling by soil.
Figure 17.
Details of the archaeological analysis of the map from
Figure 16 (obtained by multiplying normalized intercept temperature by normalized NTG maps). (
a) Detail of the thermal map with Thermal Pattern A in correspondence with the GPR anomaly indicated as A in
Figure 12; (
b) detail of thermal patterns superimposed by dug (after the survey) tombs (B and D), and in yellow, the border of the most recent digging area.
4. Conclusions
Joint application of visible and thermal remote sensing with geophysical techniques, more typically applied to urban sites, was applied to a Phoenician necropolis. In particular, aerial thermal prospecting following an innovative approach by the analysis of the time-dependent behavior of shallow soil layers has been used. Instead, a reliable standard geophysical method (GPR) was used as a reference to validate the thermal results. A good agreement was found between the applied methods. A posteriori archaeological feedback was also obtained in order to confirm the interpretation of geophysical data.
For the thermal survey, an algorithm previously developed in different contexts (geostationary satellites) for high temporal resolution thermal data has been used. With this algorithm, modified in order to process only one night of data instead of a long continuous nighttime monitoring, one can obtain two high radiative resolution maps of surfaces, even where they are partially covered by a sensor cone of sight through the whole acquisition time. The algorithm is essentially a linear interpolation in the time domain dimension, and the two resulting products are the indices intercept temperature and night thermal gradient (NTG). Here, the minimum number of temporal samples per pixel to have a real value for each map has been set to 10, while under this value, a numeric value is not assigned. For the specific survey, the acquisition time has been extended for about two hours at the start of the night, but future developments can involve the full night acquisition with the possibility of comparing the early with the intermediate and late temporal behavior of pixels. This can reveal the presence of buried bodies releasing accumulated heat at night with different time shifts, due to the different depths and thermal properties (thermal inertia and diffusivity) of buried bodies and the layers containing them. In this work, a similar approach is proposed by the comparison of an indicative parameter of the whole diurnal excursion (the intercept temperature) with the measured parameter of the thermal excursion through the acquisition time (the night thermal gradient, calculated for early night conditions).
The thermal survey reveals anomalies not detected by the radar or aerial photos of the areas, in particular with a thermal gradient close to zero, which could be traced to the presence of graves near the water well based on the similar behavior of exposed chamber graves in the western part of the site.
The thermal anomalies around the well may be due to shaft or capuchin tombs only partially detected by the GPR survey, maybe due to the low contrast of electrical properties in this kind of tomb and to their small dimension related to the distance of radar profiles, because similar thermal features are present in exposed tombs in the western area. Without direct digging for archaeological proof, they can be also an artifact due to the lack of data in the border survey area.
Although enhanced by wide angle lens aberration (focal length of 18 mm, field of view 43.6°), the area to the north shows greater thermal gradient values that are related to greater nocturnal cooling. This could be a sign of less compact and lower thermal inertia ground.
Although intermediate thermal products (intercept temperature and night thermal gradient) have been produced in real physical scales, archaeological interpretation has been conducted on enhanced maps with an approach more oriented toward the recognition of geometrical patterns than toward reconstructing the real physical properties of buried bodies. In intercept temperature and night thermal gradient maps, the variation range in apparent thermal properties was, respectively, about 14 K and 0.04 K/min, while the highest detected local contrast was in the order of 5 K and 0.01 K/min, respectively.
The archaeological pattern was more recognizable on the merged thermal map, where the values are an adimensional index (normalized intercept temperature multiplied by normalized night thermal gradient), and the analysis has been conducted only in terms of contrast behavior. With this approach, positive values are the result of pixels that exhibit a high night thermal gradient (subject to quick cooling) and high intercept temperature (caused by more intense heating before the survey) or pixels with slow cooling and slow heating; negative values correspond to the opposite behavior of the pixels during the daytime and nighttime and can be due to a temporary energy release from shallow layers under the surface during the early time of the night. According to this, we have found high positive values in correspondence with voids immediately under the surface related to different kinds of tombs, such as chamber or chest tombs.
Explicit indices of the apparent temporal behavior of observed pixels is a new approach to aerial and ground-based thermography applied to archaeology, while typically, considerations are made by single quasi-synchronous thermograms, sometimes repeated in the time-lapse approach.
The proposed approach opens the way toward quantitative analyses applied to time-lapse thermography for archaeological purposes and can lead to future non-invasive and non-destructive numerical evaluation of the thermal properties of shallower layers and buried bodies.
Improved results are expected with the future use of more controlled thermal camera movements and the extension of the survey lifespan to the whole heat release phase during the night. Further improvement could also come from the technology development of thermal sensor resolution, because the instrument used had only 320 × 240 pixels. Further development can also be expected for instrument accuracy, which is actually ±2 K, and thermal sensitivity, actually ±0.08 K.
Although the promising results of the innovative thermal approach, the integration of the methods and the overlap of the results allow a more detailed investigation of sites, especially in complex urban contexts or in wide area extensions. Of course, attention must be given to the acquisition parameters, such as the antennas’ central frequencies, profiles distances, methods, eventual electrode distances, and so on, in relation to the targets’ expected dimensions and the contrast of the properties. Despite this, time-variant remote sensing, and especially, thermography, is mainly indicated for the monitoring of inaccessible and rough surfaces. Researchers must acquire sufficiently long data time series to obtain reliable results from the time-dependent thermal analyses. This can be obtained with two-hour acquisitions and one sample per minute, as shown in this experiment. Furthermore, the altitude of the acquiring station must be carefully chosen in order to have a balance between the spatial resolution (needed in relation to archaeological target dimensions) and the extension of the surveyed area: in this case, for a height of 50 m, we have a spatial sampling of thermal raw data of 12.5 cm.
Particular attention must be put in the reduction of the quick movements of the aerial acquiring station due to winds even if the algorithm used to process the data strongly reduces the blurring effect.


 ,
, 


