1. Introduction
Over the past decades, hyperspectral imaging or imaging spectroscopy has been established as a remote sensing technology that allows quantitative characterization of the earth system [
1]. More specifically, it allows the identification of surface materials, the measurement of (relative) concentrations and the assignment of proportions of surface components within mixed pixels. For example, for applications related to vegetation science, earlier studies have shown that an increased spectral resolution available from hyperspectral systems provide the opportunity to estimate vegetation properties like chlorophyll, nitrogen [
2] and leaf water content [
3] with improved accuracies.
Although hyperspectral imaging is recognized as a promising technique, the number of operational sensors mounted on either manned full size aircrafts or satellites is still rather limited when compared to available multispectral sensor systems. Practical issues (non-regular data acquisition, lack of flexibility and high costs) have so far resulted in limited practical use of hyperspectral remote sensing data in the above-mentioned domains. However, during the last decade the new remote sensing platform of Unmanned Aerial Vehicles (UAVs) has come into wide use, allowing more widespread experimentation and application of hyperspectral imaging [
4]. UAVs are (semi-) autonomously flying aircraft systems, ranging from helicopters of a few centimeters to full-size airplanes [
5]. Depending on the context, UAVs are often referred also as Remotely Piloted Aircraft Systems (RPAS) or Unmanned Aerial Systems (UAS). For remote sensing research use the most interesting class of UAVs consist of those that are large enough to carry camera systems but still small enough to flexibly operate outside official airports. Typical UAVs of this class are multicopters and small airplanes capable of carrying camera payload approximately between 300 g and 10 kg.
Such small UAVs can easily be equipped with consumer cameras and are used to take aerial photos for both research and commercial purposes [
4]. Common processing techniques for these aerial image datasets include the use of ready photogrammetric software packages in generation of orthomosaics [
6], 3D point clouds, and Digital Surface Models (DSM) [
7].
Currently the most lightweight commercially available hyperspectral pushbroom systems weigh more than 3 kg, including all mandatory equipment, such as a data logger, a mounting frame, and batteries. Several research groups [
8,
9,
10,
11] have already successfully mounted and operated hyperspectral pushbroom sensors of that weight class on UAVs. Although the UAVs capable of carrying 3–10 kg payloads are a feasible option in many cases, there are certain benefits in downscaling the technology for even smaller UAVs. The smaller UAVs are generally cheaper, safer, and easier to operate from both a physical and regulatory point of view. Furthermore, even if larger UAVs are used for other reasons, such as increased wind stability, a lower sensor weight allows mounting of larger flight batteries making longer flights possible.
Pushbroom data are commonly georeferenced using a processing method called
direct georeferencing [
12] where the scan lines are projected onto a Digital Surface Model (DSM) or a flat ground based solely on external orientation data (X, Y, Z, Roll, Pitch ,Yaw). This orientation data is acquired with a GPS-Inertial Navigation System (GPS-INS) synchronized to the pushbroom sensor exposures. To achieve operational georeferencing accuracy, the GPS-INS accuracy must at least be in the order of the sensor pixel. This usually requires a RTK-GPS instrument with cm accuracy and a heavy gyroscopic inertial measurement unit. Because of such high requirements, the GPS-INS units are often the heaviest and most expensive components in the current UAV pushbroom systems.
Another requirement for direct georeferencing is the availability of a DSM. For the processing of airplane and satellite pushbroom data, generic elevation models are used but their drawback is that they usually don’t include the elevation of vegetation and man-made objects. Given the typical 1–10 m resolution of airplane data, this is not a critical flaw, but with the potential centimeter resolution that can be achieved with UAV acquired data, the availability of a more detailed DSM is essential. Currently, most pushbroom UAV operators work around the non-availability of a DSM by first projecting their data over a generic elevation model and then by manually rubber-sheeting the data over a previous acquired image of the area.
In this paper, we first present the UAV based Hyperspectral Mapping System (HYMSY) developed at Wageningen University and Research Centre. HYMSY is a lightweight (2.0 kg) hyperspectral pushbroom system developed for small UAVs. HYMSY consists of a custom-made pushbroom spectrometer, a small but inaccurate GPS-INS system, and a consumer camera. HYMSY is capable of producing in one dataset a georeferenced hyperspectral datacube, an aerial image orthomosaic, and a detailed 3D model of the target area. Secondly, we present a novel automated photogrammetric processing chain for accurate georectification of the HYMSY data. The photogrammetric processing chain solves both the lack of high quality GPS-INS data and the need for a detailed DSM. By collecting aerial images simultaneously with the pushbroom data, it is possible to perform accurate and fully automated georeferencing without the need for a high quality GPS-INS system or any external DSM. Finally, we demonstrate a case study dataset collected using HYMSY and briefly evaluate its performance in an agricultural mapping application.
2. Hyperspectral Mapping System (HYMSY)
2.1. System Design
In autumn 2012, our research team decided to acquire an UAV based hyperspectral mapping system. In order to do agricultural research on single plant basis, we needed the system to create hyperspectral reflectance factor maps at a spatial resolution of at least 10 cm resolution and with a georeferencing accuracy of a few pixels. The spectral resolution of 10 nm was estimated well enough for advanced red-edge analysis while still providing enough light for short exposure times. We selected an octocopter as the UAV platform because it allows flexible flight plans suitable for controlled research use. As commercial solutions that could be fitted in a small UAV multicopter with a maximum payload capacity of 2.0 kg were not available, we decided to develop our own design. Ideally the spectrometer should have covered also the SWIR range, but limitations regarding the minimal dimension available for this camera technology forced us to stick with 400–950 nm range available as CMOS sensor.
Our desktop study on commercial pushbroom spectrometers revealed that at that time the commercial solutions available were not really optimized for use on a small UAV but were rather directly downscaled versions of earlier manned airplane size systems. The miniaturization to 2.0 kg threshold was found to be possible by simply selecting the smallest off-the-shelf components. As an innovation to hyperspectral data processing, we decided to include a photogrammetric camera to the system, which would allow automated production of the DSM for the target area and enable photogrammetric orientation of the system.
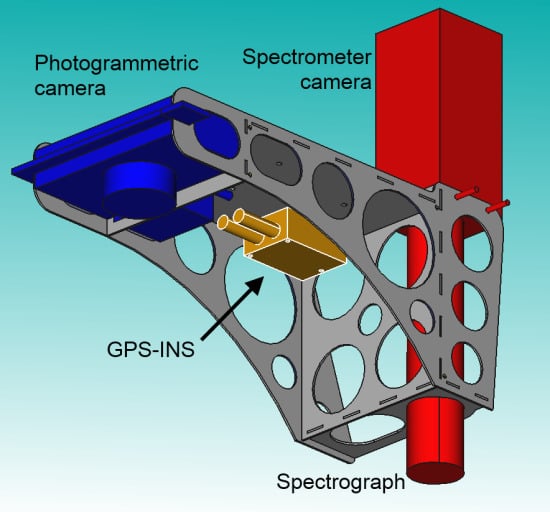
The HYMSY consists of a custom pushbroom spectrometer, a consumer camera, a compact GPS-INS unit, a RaspBerry PI data sink, custom synchronization electronics, and a lithium polymer battery (3S, 500–1000 mA).
Figure 1 and
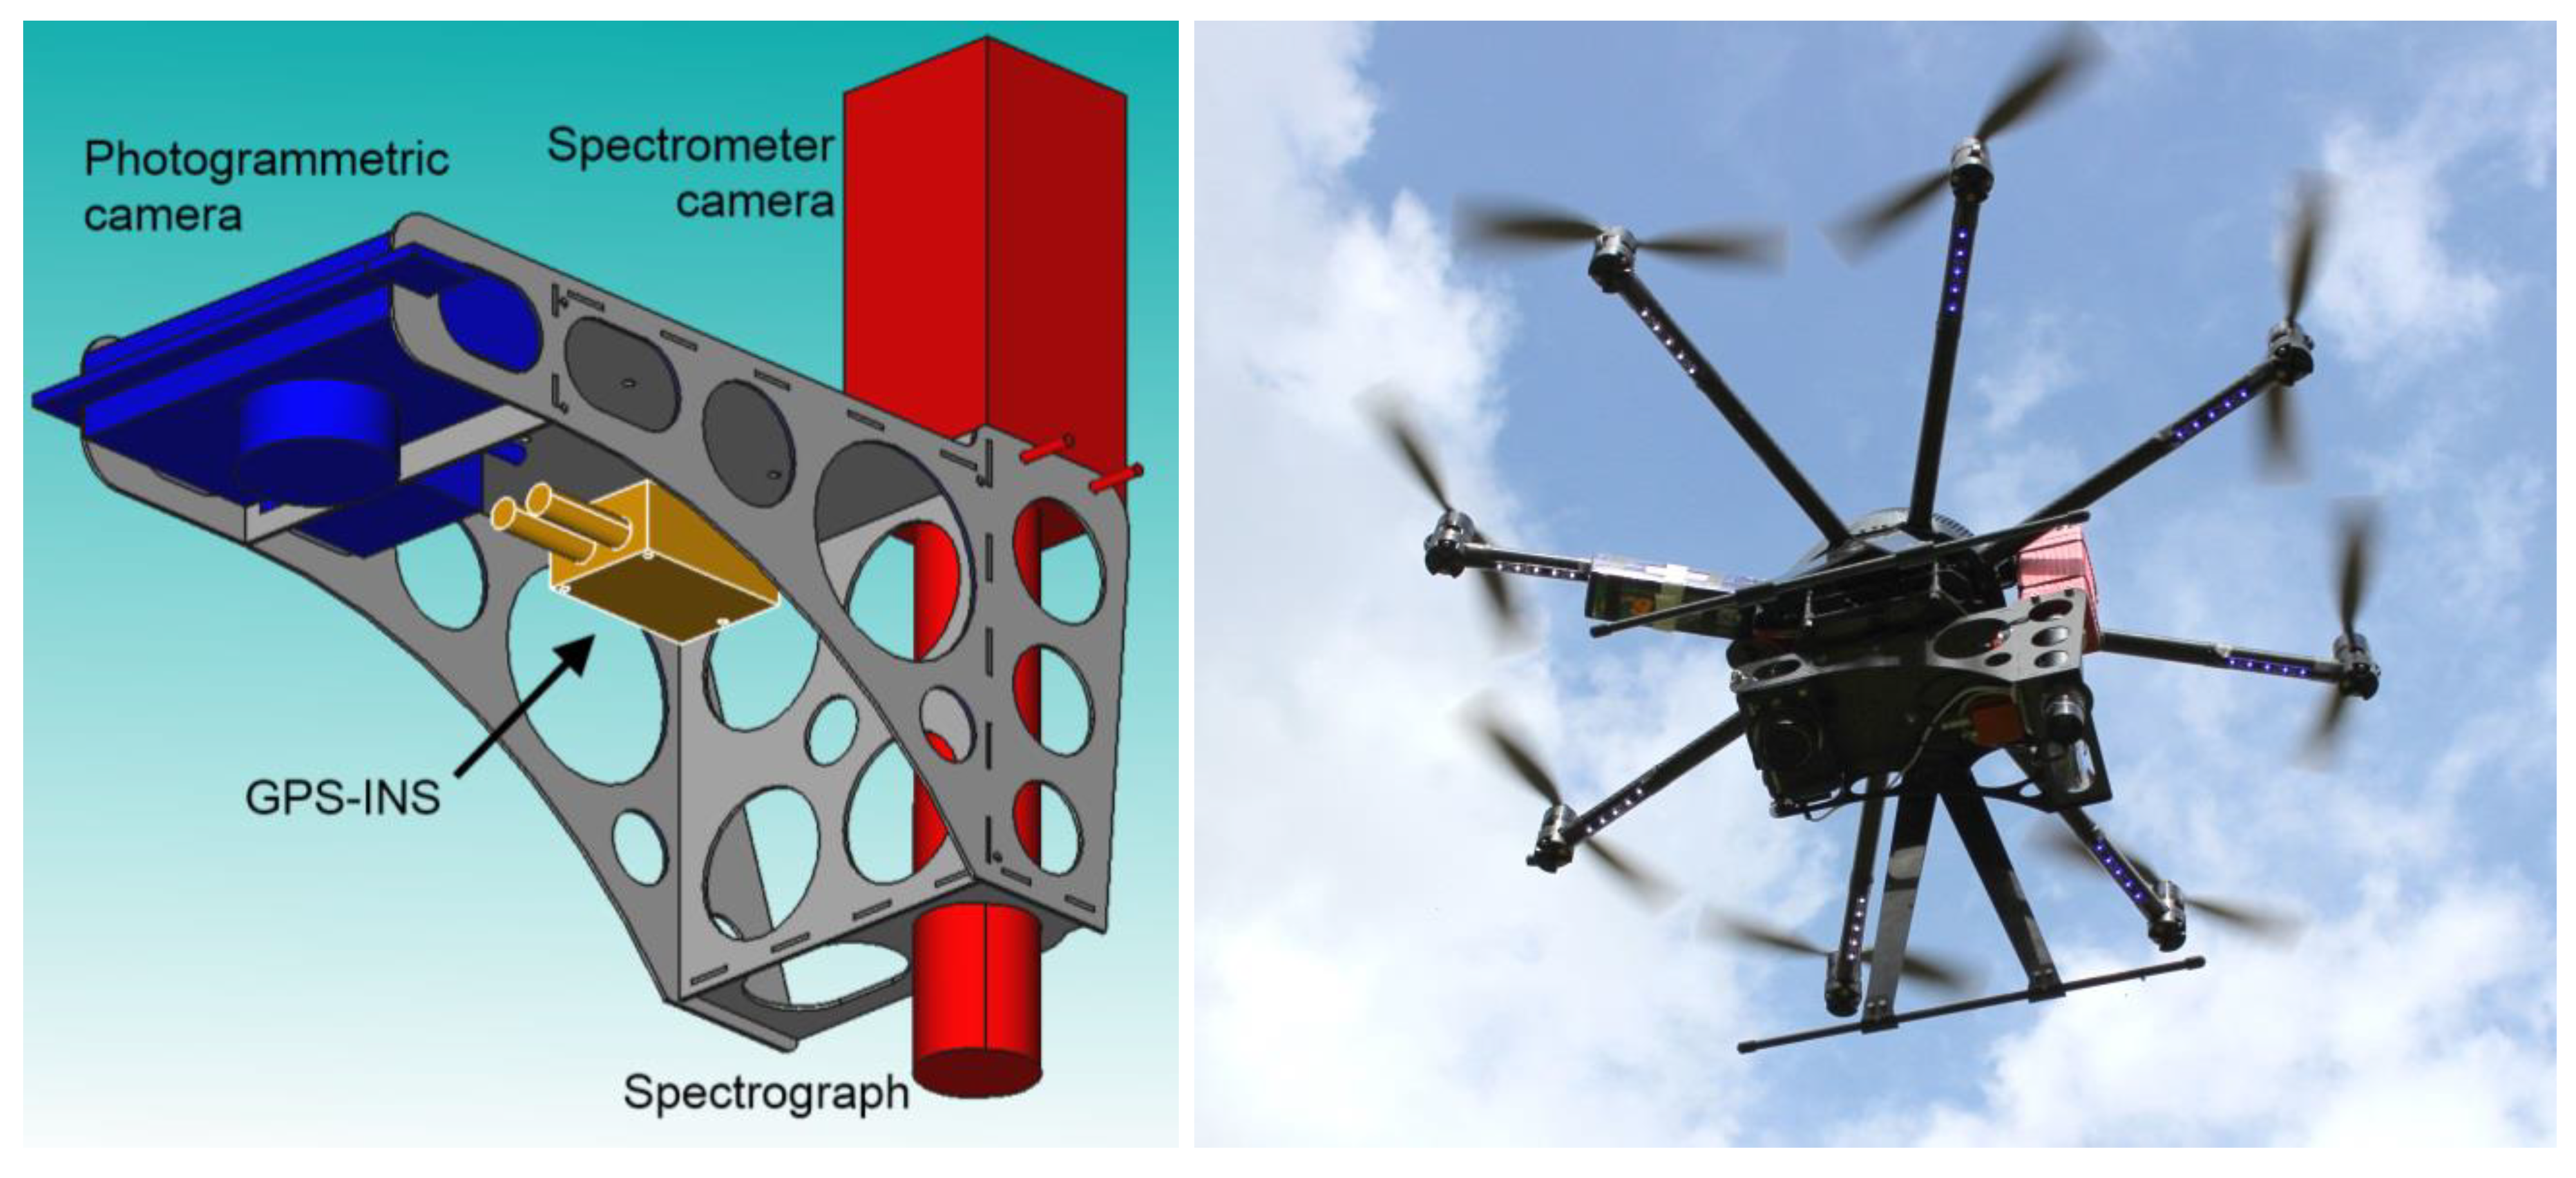
Table 1 present the technical details of the system. We designed the HYMSY to be mounted under an octocopter UAV (Aerialtronics Altura AT8 v1,
Figure 1), but it is a standalone setup that can be installed on any platform able to carry a 2.0 kg payload. The total price of components is approximately 12,000€.
Figure 1.
Schematic figure of the HYMSY frame and main components (Left) Photo of HYMSY mounted on an Aerialtronics Altura AT8 v1 octocopter UAV (Right).
Figure 1.
Schematic figure of the HYMSY frame and main components (Left) Photo of HYMSY mounted on an Aerialtronics Altura AT8 v1 octocopter UAV (Right).
Table 1.
Technical specifications of the lightweight hyperspectral mapping system (HYMSY).
Table 1.
Technical specifications of the lightweight hyperspectral mapping system (HYMSY).
| System |
|---|
| | Components | - -
Custom spectrometer:
- ○
PhotonFocus SM2-D1312, - ○
Specim ImSpector V10 2/3”, - ○
12mm lens
- -
XSens MTi-G-700 GPS-INS + antenna - -
Panasonic GX1 + 14 mm pancake lens - -
Raspberry PI - -
Synchronization electronics - -
Carbon fiber frame - -
Battery
|
| | Total weight (ready-to-fly) | 2.0 kg |
| | Power intake | 10W @ 12 VDC |
| Spectrometer (PhotoFocus SM2-D1328 + Specim ImSpector V10 2/3) |
| | Spectral range | 400–950 nm |
| | Spectral resolution (FWHM) | 9 nm |
| | Cross-track pixels | 328 (1312 unbinned) |
| | Swath width | 0.8 × flight altitude |
| | Scan rate | 25 lines/s |
| | Signal-to-noise ratio | > 518:1 (16-bit pixel at full well) |
| Camera (Panasonic GX1) |
| | Image size | (4608 × 3464) pixels
(1.2 × 0.9) × flight altitude |
| | Max frame rate | > 0.55 Hz @ raw format |
| GPS-INS (XSens MTi-G-700) |
| | Roll & pitch accuracy | 0.3° |
| | Yaw accuracy | Nominal: 1°
Observed: >5° |
| | Spatial accuracy | 4–10 m |
The camera of the spectrometer (PhotonFocus SM2-D1312) contains a Digital Signal Processor (DSP) unit, which acts as the real time controller and synchronizing unit of the HYMSY (
Figure 2). In acquisition mode, the DSP runs the internal spectrometer camera at a rate of 25 Hz. Simultaneously the DSP uses its digital output to trigger the GPS-INS and the consumer camera. The GPS-INS is triggered synchronous to every spectrometer exposure through a digital I/O port (I/O-1 in
Figure 2). Every two seconds the DSP sends a pulse from another I/O port (I/O-2 in
Figure 2) to trigger the consumer camera. The rising edge of this pulse triggers the camera, but due to internal delay the exposure happens only 83 ms later. To make the camera exposure and GPS-INS sampling occur concurrently, the trigger pulse width is set to 83 ms and the falling edge of it is then used to trigger the GPS-INS measurement.
The DSP further acts as the data hub and timing hub of the system. Each spectrometer frame from the internal camera is given a timestamp and binned using a 4 × 4 window to 328 × 256 pixels. The DSP also receives the GPS-INS messages and assigns timestamps to them. The binned spectrometer frames and GPS-INS messages are sent over an Ethernet connection to the RaspBerry PI data sink where they are stored to a USB flash drive.
The consumer camera photos are not extracted from the camera in real time, but are recorded to the SD memory card inside the camera. This produces a challenge to reliable pairing between the trigger pulses and photo files. To do this reliably the camera is started with a special start-up sequence where the first three photos are shot in very quick succession after which a pause of exactly 10 s is held before starting the normal acquisition at 2 s intervals. The Panasonic RW2 raw files contain the photo storage times with 10 ms accuracy, which allows the identification of the start-up sequence images and detection of possible missed frames.
Figure 2.
Schematic figure of the HYMSY synchronization pulses and the data flow. The DSP outputs from I/O-1 a 1-ms pulse on every spectrometer exposure (25 Hz) to trigger the GPS-INS. Every 2 s the DSP triggers the photogrammetric camera (Panasonic GX1) with a 83-ms wide pulse from I/O-2. The time lag of 83 ms is the delay between the trigger rising edge and the camera exposure, allowing use of the falling edge of the trigger pulse to synchronize GPS-INS to the camera exposure.
2.2. Laboratory Calibrations
The spectral calibration was performed by taking spectrometer images of a white panel illuminated with a spectral emission lamp. A few hundred of these images were averaged to a single low noise image. The emission line positions were determined separately for each spatial column of the image and a second order polynomial was fitted to them to form a pixel-wise spectral calibration. This simple calibration method provides only the central wavelength calibration, but does not take in to account more delicate issues, such as thermal effects, spectral resolution, stray light, or instrument line shape.
The pixel-wise dark current calibration of spectrometer was performed by taking a series of spectrometer images with the lens cap on. To increase the SNR the images were averaged together to form a pixel-wise dark current image.
The flat field calibration of the spectrometer was performed by taking a series of images of a large integrating sphere illuminated with a Quartz-Tungsten-Halogen lamp. During the calibration measurements the spectrometer was constantly turned to randomize the view positions of each pixel. The spectrometer images were averaged and the dark current image was extracted from it to form the flat field image. Currently the sensor is assumed to have perfect linearity and thermal stability. If an absolute radiometric calibration was needed, then we also should have measured the radiance of the flat field. Currently, HYMSY is used only for relative reflectance factor measurements and thus flat field radiance was not recorded.
The synchronization timing calibrations include a series of measurements. The clock of the DSP is used as synchronization reference for all timings in the system. The exposure of the spectrometer camera is natively synchronized to the clock with better that 1 ms accuracy. With each spectrometer exposure the GPS-INS is triggered with a timed trigger pulse. Based on the specifications of the GPS-INS this synchronization is done with 2.5 ms accuracy. Although GPS-INS triggering is practically instantaneous, the output message is received with approximately 120 ms delay.
The Panasonic GX1 camera exposures are synchronized to the DSP clock by timing of the trigger pulses. The Panasonic camera has a delay of 83 ms between the rising edge of the trigger pulse and camera exposure. This delay was determined by splitting the trigger signal to a LED and placing it in the field of view of the camera. Then different trigger pulse widths were tested until LED was seen lighted up on half of the photos. As the falling edge of the pulse is used to trigger the GPS-INS, this calibration makes it certain that the Panasonic GX1 and the GPS-INS are synchronized.
The geometric calibration of the photogrammetric camera was performed using the Agisoft Lens (v0.4.1, Agisoft) calibration software. The boresight calibration parameters include the shift and rotation (dX, dY, dZ, rX, rY, rZ) of the spectrometer, the photogrammetric camera, and the GPS-INS relative to the HYMSY frame. In the first stage, the shifts are measured with a ruler from the center point of the frame. For the spectrometer and the camera, the reference point is in the estimated focal point of the optics and for the GPS-INS it is in the GPS antenna. The rotations are determined iteratively. First the rotations are set coarsely allowing georectification of an airborne dataset to be performed adequately. Next the GPS-INS and photogrammetric camera rotations are adjusted so that separation between the photogrammetric alignments from PhotoScan and the GPS-INS data are minimized. Finally, the spectrometer rotations and spectrometer optics opening angle are adjusted so that the georectified spectrometer image overlaps the photogrammetric orthomosaic.
2.3. Field Operation
During an UAV mapping flight the following measurement procedure is performed. First, only the GPS-INS system is powered up for a minimum of 13 minutes before takeoff in order to achieve the highest positioning accuracy. 13 minutes is the time that a GPS satellite requires to transmit the full GPS almanac data. While gaining GPS data, the photogrammetric camera (Panasonic GX1) is turned on and configured. To ensure reliable and static performance, the camera is always used in the fully manual M-mode with all automation off. The camera exposure time is adjusted to match light conditions and lens focus is locked to infinity.
To start the optical data acquisition also the rest of the HYMSY is powered on. After the start up, HYMSY enters the measurement cycle in which it collects 25 spectrometer scan lines per seconds and a photogrammetric image every two seconds. To calibrate the system for up-to-date dark current level, the first camera and spectrometer frames are taken with the lens caps on. To calibrate for the current illumination conditions, the caps are removed and the HYMSY is manually scanned over a Spectralon (Labsphere Inc) reference panel to acquire reference spectra.
After the calibration phase, the HYMSY is ready for the mapping flight. The mapping flight path is designed based on the required resolution which then defines the maximum flight speed and altitude. The flight path is uploaded to the UAV and an automated flight is performed. Once the UAV finishes the flight, a post flight Spectralon calibration is performed for HYMSY. To finish the measurement procedure, the HYMSY is powered down and data are extracted from the USB flash drive and the SD card to a field computer. The extracted dataset consists of a HYMSY timing txt-file, GPS-INS data bin-file, spectrometer frames as pgm-files (1500/minute × 65 kB = 97.5 MB/minute), and aerial images as rw2-files (30/minute × 19 MB = 570 MB/minute).
5. Discussion
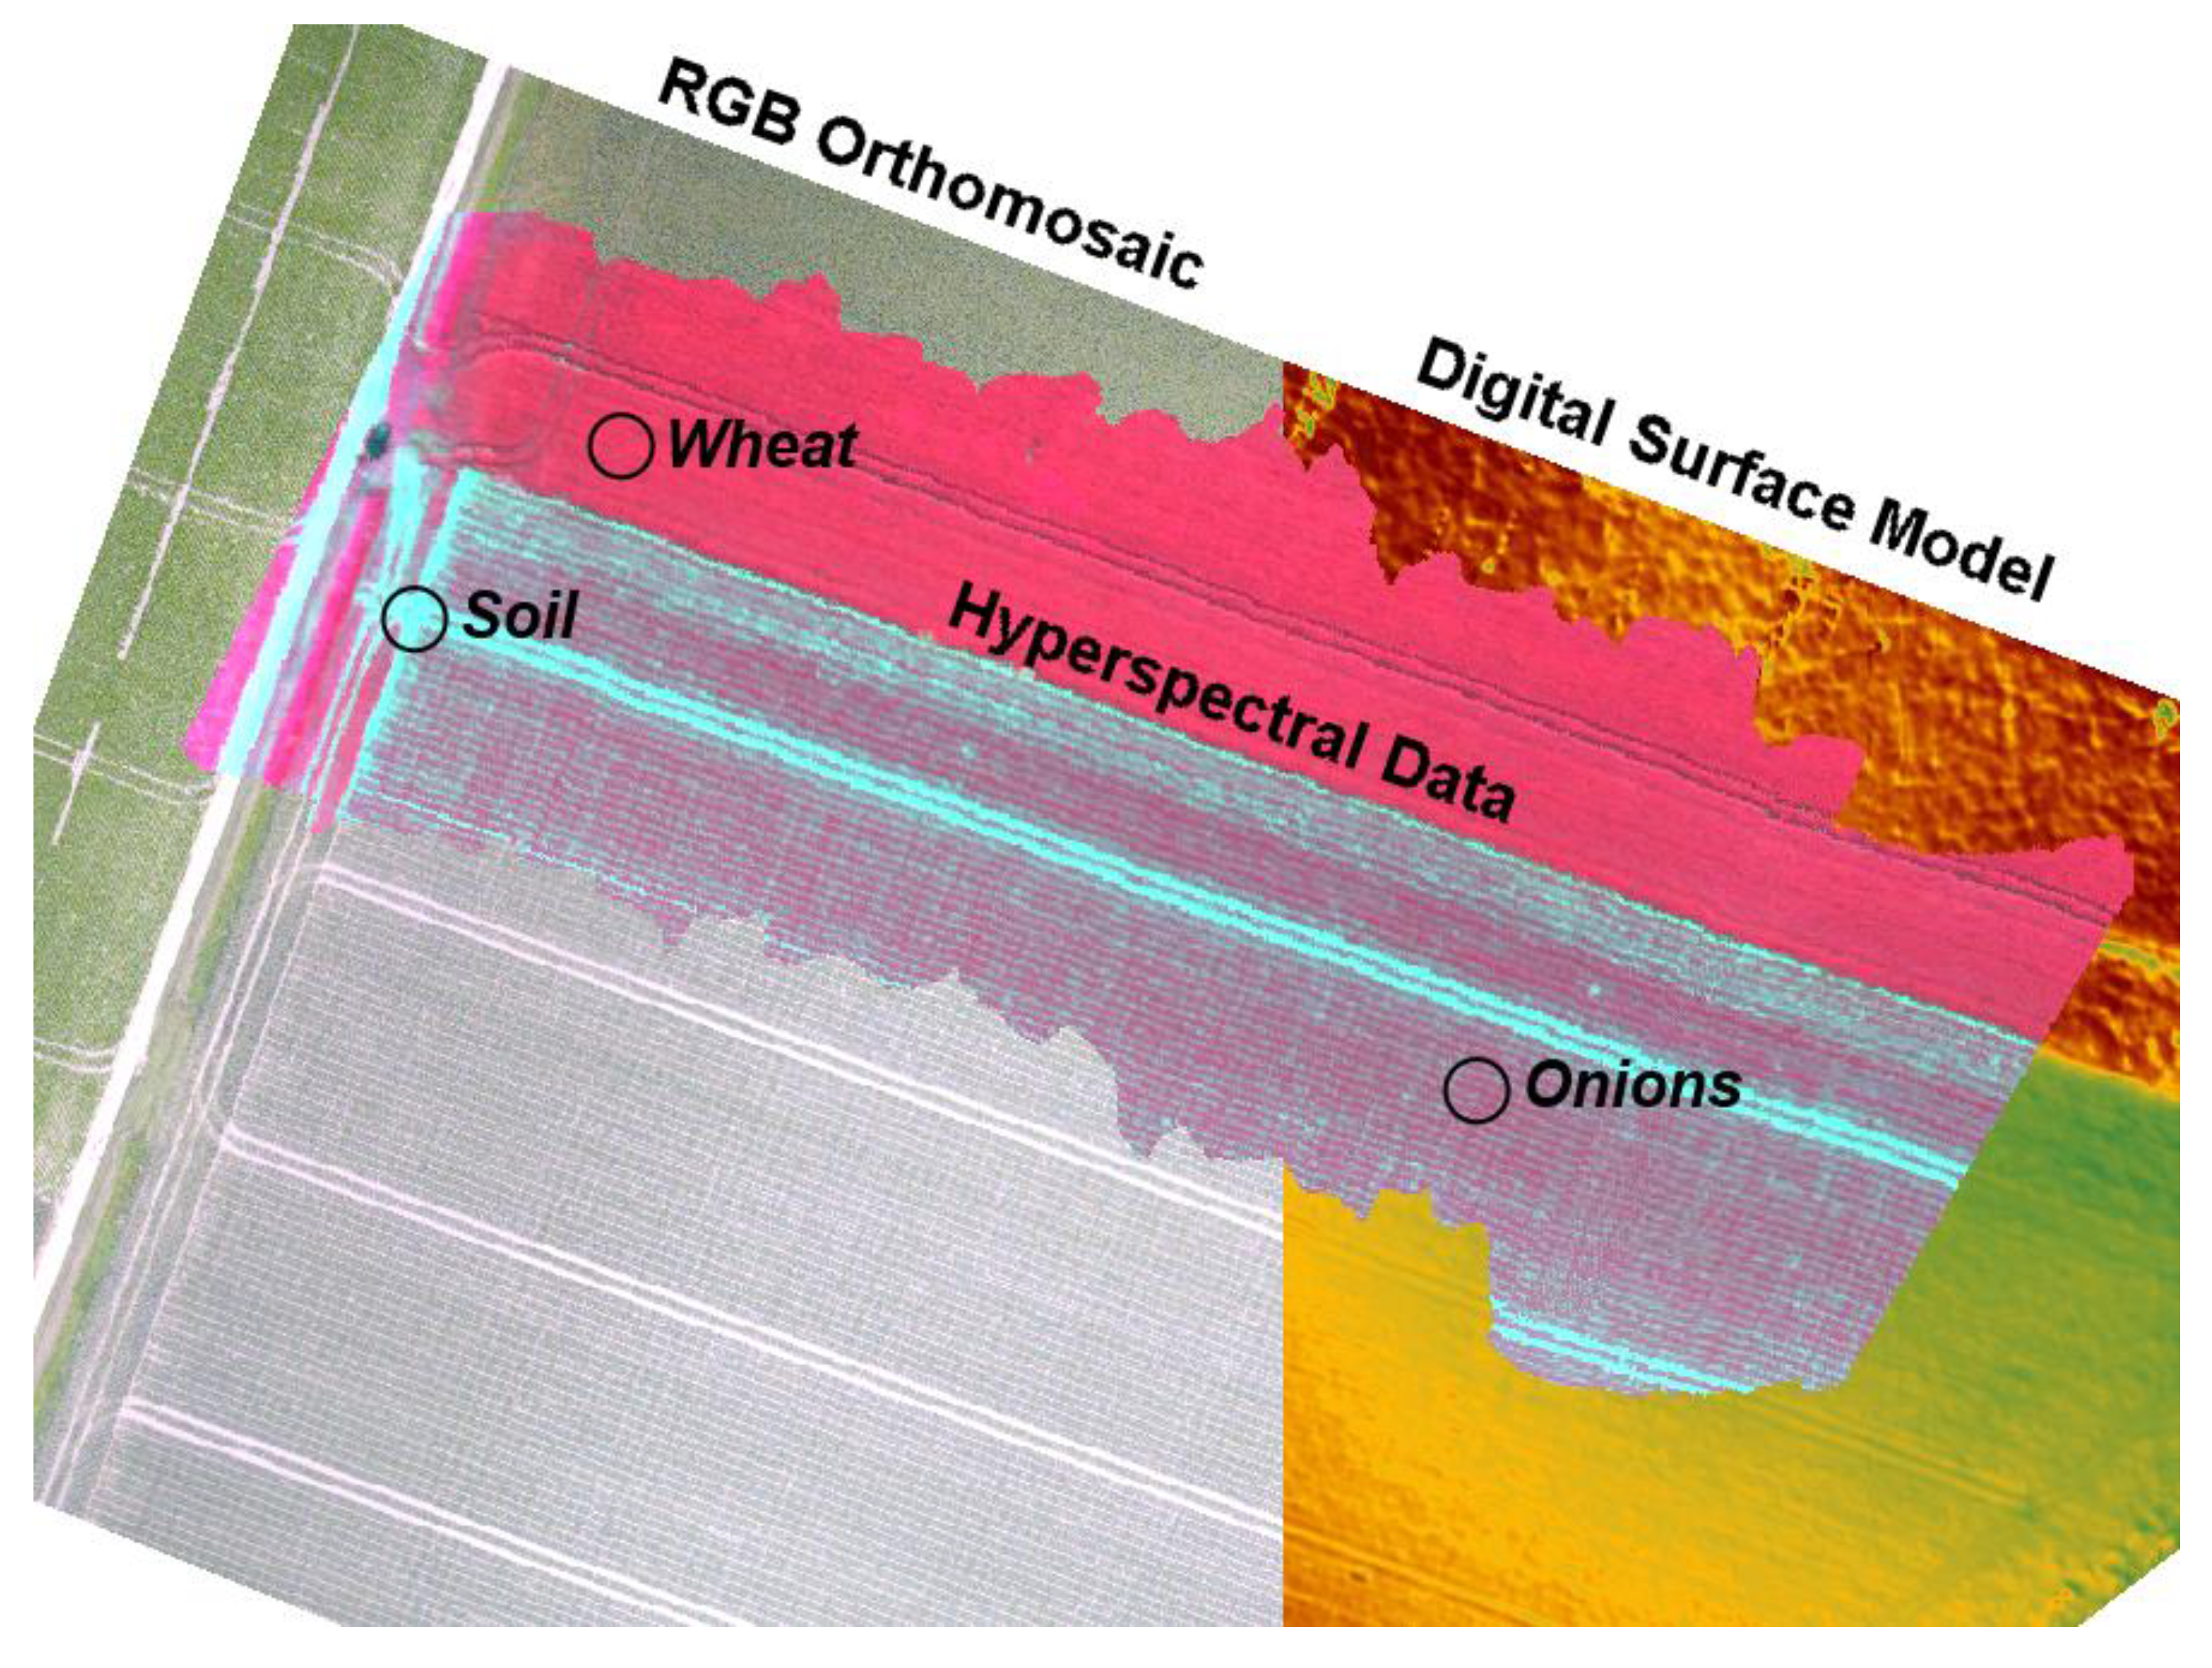
In general, the design goals of the HYMSY have been reached. During 2013 and 2014 the HYMSY performed more than 200 octocopter flights at more than 70 sites. On a typical flight, we mapped a 2–10 ha area producing a RGB orthomosaic at 1–5 cm resolution, a DSM in 5–10 cm resolution, and a hyperspectral datacube at 10–50 cm resolution. Vegetated targets included potatoes [
16], wheat, sugar beets, onions, tulips, agricultural soils, heathlands, coral reefs [
17], and tropical forests. The low weight and size of the whole UAV based mapping system has given us the flexibility to easily perform all these mapping tasks. We also found the added value of the high-resolution photogrammetric camera to be high in multiple aspects. With support of photogrammetric processing, the small GPS-INS unit has proven to be accurate enough for georectification. The co-registered RGB orthomosaic gave a visual identification support of objects in the coarser hyperspectral maps and provides a recognizable result for non-professional audiences. In preliminary tests, we have also found the vegetation height maps generated from DSMs to be useful in image classification tasks.
Although the HYMSY is a fully operational instrument whose design is considered successful for vegetation mapping and monitoring applications, the authors recommend some improvements in the design before cloning the system. The HYMSY was originally designed around the PhotonFocus SM2 industrial camera because it also housed a Digital Signal Processor (DSP) and microSD slot in one package, allowing standalone operation without external data storage. Unfortunately, the performance of SM2 did not fully match our expectations. Firstly, the DSP’s driver architecture prevented writing of data to the SD-card while acquiring new imagery, which decreased the maximum frame rate of the SD storage system to unacceptably low frequencies. As an alternative, the external Raspberry PI was added as a data sink with approximately 100 g of extra weight. Secondly, the DSP was found to be slightly underpowered to the task. Although the SM2 is theoretically capable of reaching frame rates of up to 160 fps, our application, including binning, triggering, GPS-INS communication, and Ethernet output, reached a maximum stable frame rate of only 25 fps in 8-bit output mode. As the camera sensor is typically run with only 12-ms exposures, a system could be operated with two to three times faster frame rate by using faster processing electronics. For these reasons it is recommended to design a future system around either a more powerful DSP or a simpler binning-enabled GigE-camera and an external board-computer.
Because of the above-mentioned issues, the frame rate of the current HYMSY can be considered to be low and in many cases this limits the usability of the system for ultra-high-resolution mapping. Fixed wing UAVs and aircrafts have a minimum airspeed to prevent stalling. With UAV platforms this is usually within a range of 10–15 m/s. Although rotary wing UAVs do not have a minimum airspeed in stalling aspect, for our octocopter platform the slowest smooth flight speed is around 2 m/s. At slower speeds, the UAV autopilot progresses by “hopping forward” with more tilting movements than is desirable for pushbroom mapping. The sensor frame rate and the minimum flight speed define the along track Ground Sampling Distance. Since our octocopter has a minimum speed of 2 m/s and we use a frame rate of 25 fps, the best possible GSD and output resolution is on the order of 10 cm. For a fixed wing UAV the best possible GSD at 25 fps would only be on the order of 40–60 cm. For a future system, effort should be placed on increasing the frame rate.
To increase the frame rate, the spectrometer currently runs in 8-bit mode, which decreases the radiometric quality of the spectrometer output. In an ideal case, the raw pixels could be read in 12-bit resolution, and pixels binned with a 4 × 4 window could contain the full 16-bits of data. Based on the manufacturers specifications, the SNR of such a binned pixel at full well should be up to 1200/1 (10.2 bits). Unfortunately, this high performance is not currently achieved as the pixels are read in and output as 8-bit numbers, decreasing the numerical resolution of a single pixel to 256/1. For the georectified dataset however, the radiometric resolution on full-well is expected to be slightly higher because in the course of georectification, the raw pixels are merged with neighboring pixels both in the spectral and spatial domain which slightly improves the SNR. Since increasing the radiometric resolution would be very beneficial, one of our short-term goals is to investigate if optimization of the DSP program would allow us to increase the numerical resolution of binning and output to 12–16 bits without significantly compromising the frame rate.
In the case of the octocopter, radiometric calibration using reflectance reference panels was found to be a practical method. However, if the processing chain is used for longer flight times or larger distances from the takeoff spot, which is the situation for most fixed wing systems, another radiometric calibration method should be considered [
13]. Using the photogrammetric methods in geometric processing does not restrict the possibilities for radiometric calibration method and the use of atmospheric transmission models or onboard incident light sensors can thus be explored.
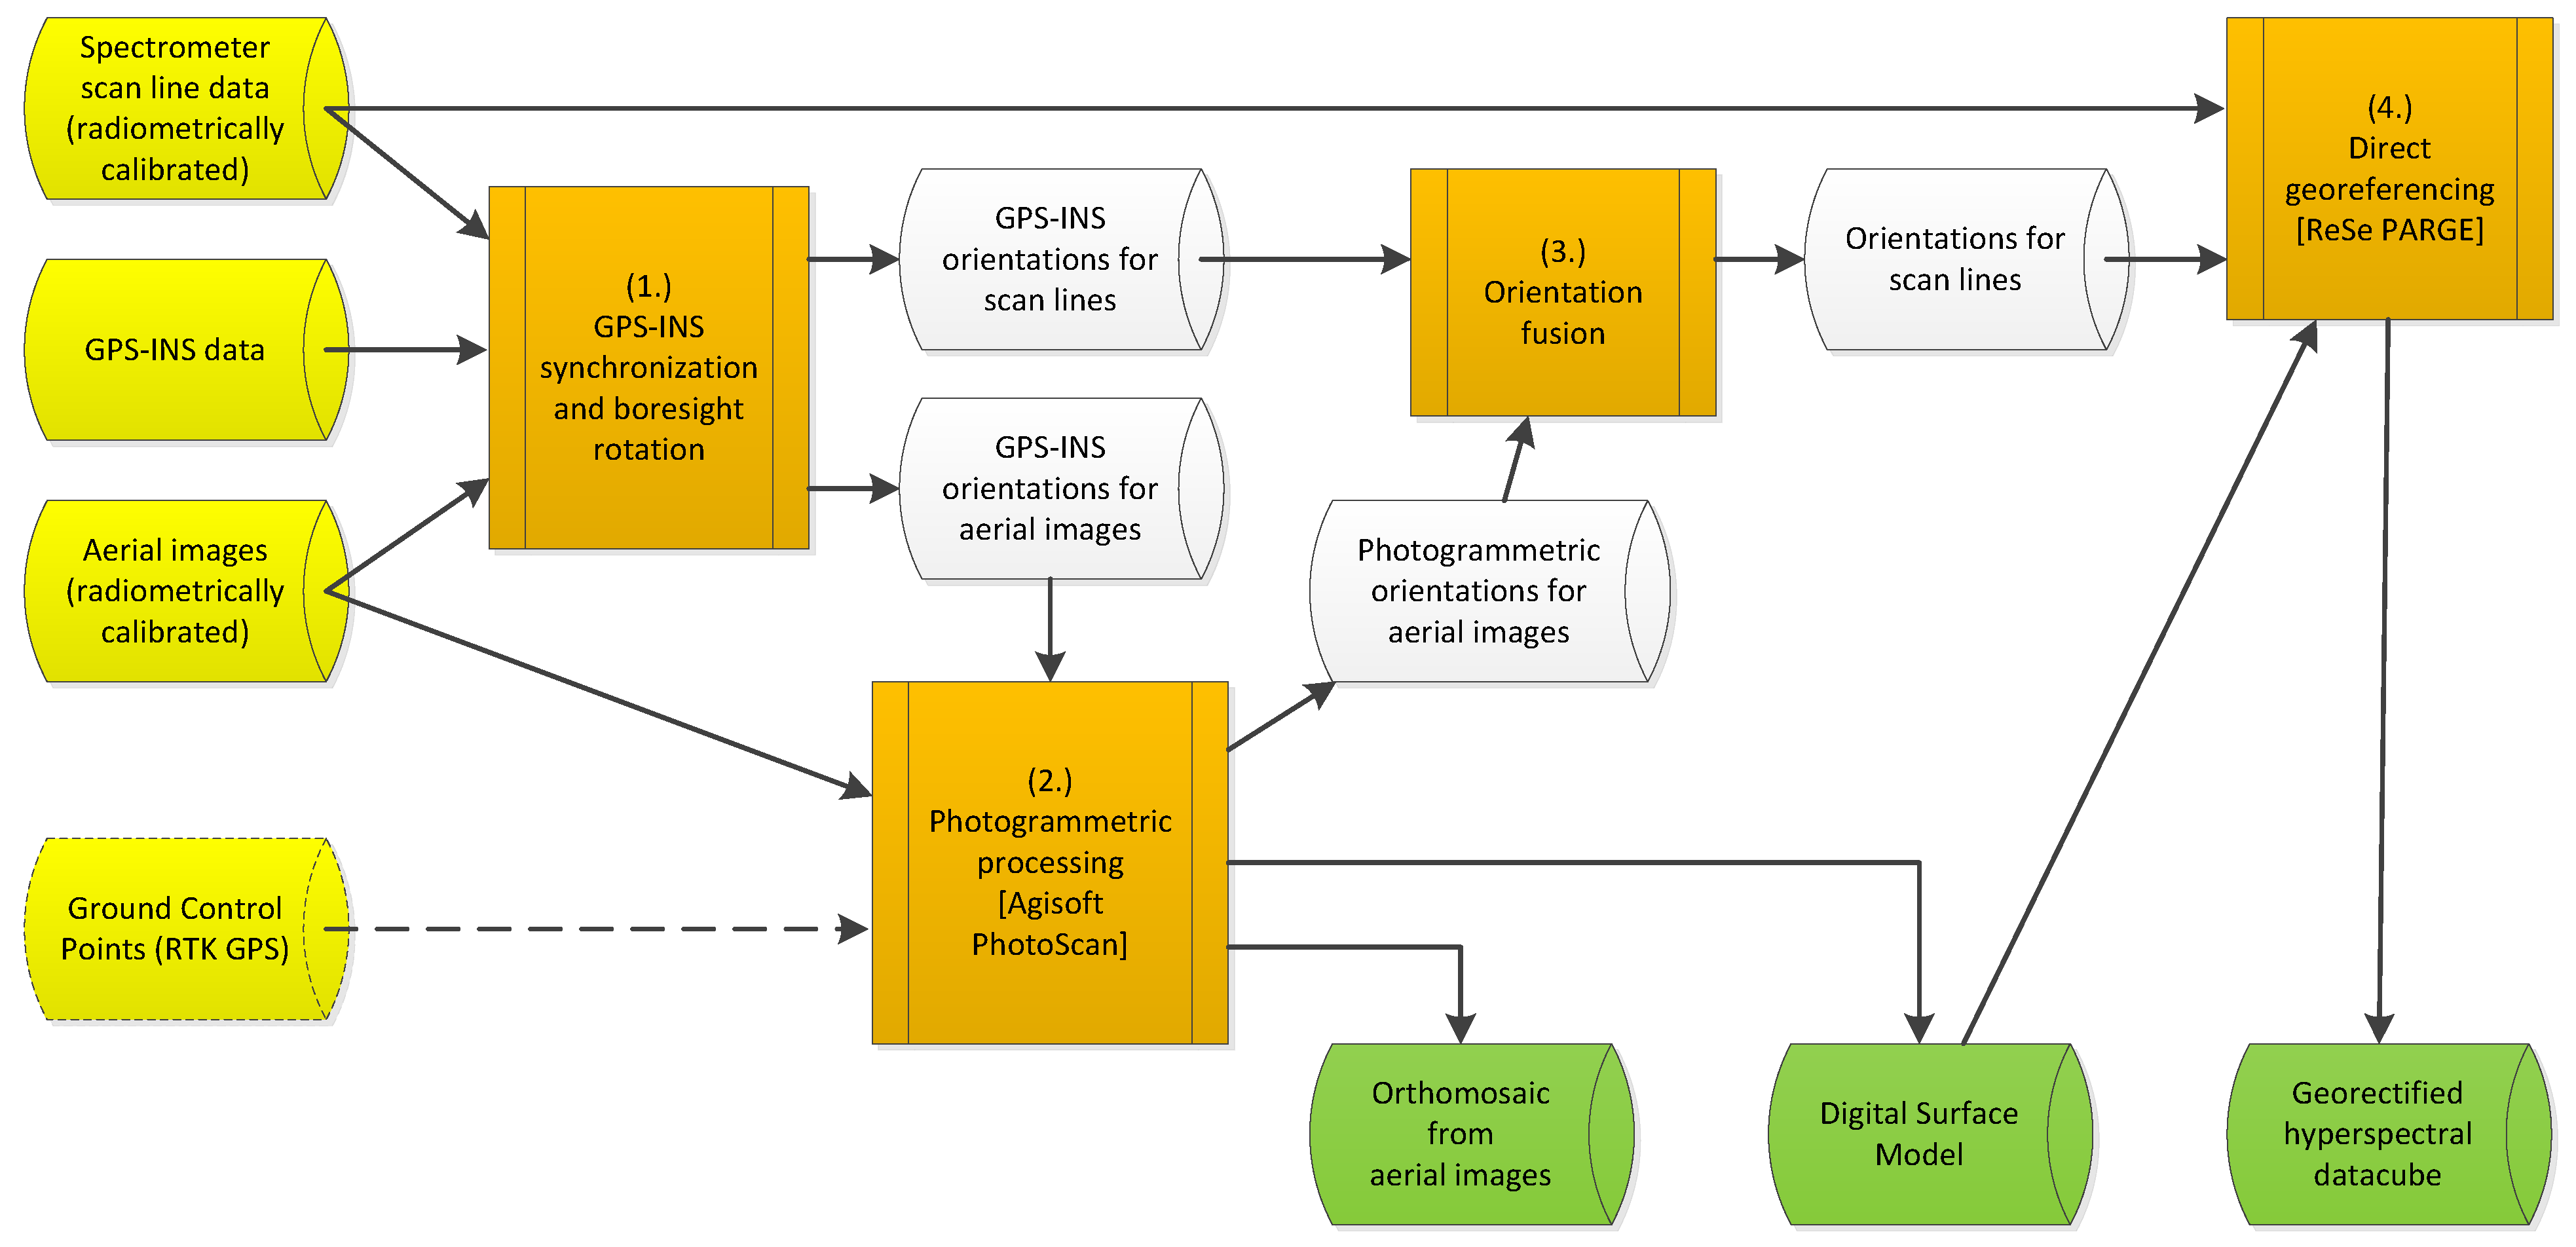
The photogrammetric processing chain has clear advantages over the traditional direct georeferencing that is used by most, if not all, current commercial pushbroom systems: (1) The method allows exploitation of a cheaper and more lightweight GPS-INS system, (2) It is capable of projecting pushbroom data over an up-to-date DSM with fine details of even temporary targets, such as parked cars, vegetation, etc. (3) It allows fully automated georectification with an internal accuracy of a few pixels and a global accuracy depending on the onboard GPS/GNSS receiver.
The drawbacks of the photogrammetric method include uncertainty in success of the photogrammetric processing. Lack of detectable features in the imaged landscape may result in complete failure of the photogrammetric processing. The photogrammetry also will fail if the overlap of aerial images is too low or when the image parallax is too large compared to the complexity of the target. For example, we experienced failure over a forest without leaves when flying too fast. Such issues can be addressed by increasing the overlap between subsequent images, which can be achieved by decreasing flight speed or increasing the frame rate of the aerial image camera, if possible. Failure or severe distortions are also likely to occur above clear water bodies where the water surface refracts underwater objects in the image or waves prevent detection of any stable features.
The photogrammetric processing also introduces some requirements for the flight path of the mapping. In general, the aerial image dataset should consist of images with a two-dimensional spatial distribution significantly larger than the accuracy of the GPS receiver. While the photogrammetric process probably still succeeds in image alignment when the spatial separation of extreme images is smaller than the GPS accuracy, the 3D model and camera view angles become tilted or even rotated completely upside-down. In our experience, this can also happen with a long (>100 m) flight consisting only of a single linear path. One way to solve this is by adding ground control points measured with an RTK-GPS to the photogrammetric processing, unfortunately adding a manual step to the processing chain. This is usually not necessary and a fully automated processing can be performed if the flight lines are planned such that this aspect is taken into account. Simply adding a 10–20 m L-branch to the beginning or end of the flight line, or by flying multiple parallel flight lines with some side-overlap is enough to stabilize the rotation.
Currently the only manual, but optional, step in the georectification process is the selection of the RTK-GPS ground control points on the aerial images. The RTK GPS points are needed to improve the global positioning accuracy above the single band GPS accuracy of the GPS-INS unit. Adding a miniaturized RTK GPS receiver to the imaging system could potentially improve the georectification accuracy to the level of hyperspectral pixel size where other ground control points and manual processing steps would not be needed at all. Even in this scenario however, introduction of additional GCPs is expected to be beneficial for geometric accuracy.
The photogrammetric processing as presented in this paper is a powerful replacement for the high accuracy GPS-INS systems and allows the introduction of new approaches to the technical design of UAV mapping systems. As presented in this study, the technical requirements of adding a photogrammetric capability to mapping system are minor. The system requires a photogrammetric camera, which is synchronized to the pushbroom acquisition. The single requirement of the camera is that its pixel size on the ground should roughly be at least on the same order of magnitude as the required alignment accuracy. Thus, the introduction of photogrammetric processing allows for a decrease in the quality and size of the inertial measurement unit.
The image data collected by the HYMSY have the potential to allow for the characterization of agricultural crop variation within a parcel at specific observation points during the growing season (
Figure 5). First results have shown the application of HYMSY for a crop monitoring experiment in potato [
16]. Vegetation indices based on red-edge bands were evaluated on their relation with measured chlorophyll concentrations in the field. The vegetation indices showed a good linear relation with relevant crop traits and the empirical model based on the chlorophyll red-edge index was used to derive continuous chlorophyll maps using the acquired hyperspectral data cubes. Follow up research will focus on the automated detection of soil, vegetation and shadow components within the image up to the level of individual plant detection by using image analysis techniques like super resolution mapping [
18]. At the individual plant level, crop properties can be estimated and transformed to task maps for variable-rate application within the agricultural parcel.


