Article

The Estimation of Regional Crop Yield Using Ensemble-Based Four-Dimensional Variational Data Assimilation

1
State Key Laboratory of Earth Surface Processes and Resource Ecology, Beijing Normal University, Beijing 100875, China
2
Key Laboratory of Agri-Informatics, Ministry of Agriculture, Beijing 100081, China
3
Institute of Agricultural Resources and Regional Planning, Chinese Academy of Agricultural Sciences, Beijing 100081, China
*
Author to whom correspondence should be addressed.
Remote Sens. 2014, 6(4), 2664-2681; https://doi.org/10.3390/rs6042664
Submission received: 6 January 2014 / Revised: 3 March 2014 / Accepted: 17 March 2014 / Published: 25 March 2014

Abstract

:
To improve crop model performance for regional crop yield estimates, a new four-dimensional variational algorithm (POD4DVar) merging the Monte Carlo and proper orthogonal decomposition techniques was introduced to develop a data assimilation strategy using the Crop Environment Resource Synthesis (CERES)-Wheat model. Two winter wheat yield estimation procedures were conducted on a field plot and regional scale to test the feasibility and potential of the POD4DVar-based strategy. Winter wheat yield forecasts for the field plots showed a coefficient of determination (R2) of 0.73, a root mean square error (RMSE) of 319 kg/ha, and a relative error (RE) of 3.49%. An acceptable yield at the regional scale was estimated with an R2 of 0.997, RMSE of 7346 tons, and RE of 3.81%. The POD4DVar-based strategy was more accurate and efficient than the EnKF-based strategy. In addition to crop yield, other critical crop variables such as the biomass, harvest index, evapotranspiration, and soil organic carbon may also be estimated. The present study thus introduces a promising approach for operationally monitoring regional crop growth and predicting yield. Successful application of this assimilation model at regional scales must focus on uncertainties derived from the crop model, model inputs, data assimilation algorithm, and assimilated observations.

1. Introduction

Regional crop yield information is critical for food security and sustainable agriculture [13]. However, obtaining such data in a timely and accurate manner is challenging if global climate change is considered. Recently, remote sensing data assimilations based on crop growth simulations [4,5] have furnished a potential approach to improving regional crop yield monitoring and forecasting. By making better use of crop-growth models such as the World Food Studies (WOFOST) [6], Erosion Productivity Impact Calculator (EPIC) [7], and Decision Support System for Agro-technology Transfer (DSSAT) [8], crop growth processes can be effectively simulated under different environmental and management conditions while incorporating various limiting factors (e.g., soil, weather, water, and nitrogen) in a dynamic manner [9]. However, the use of spatial observations from remotely sensed data is an ideal option for reducing regional simulation uncertainties [10]. Accordingly, several remote sensing data assimilation strategies based on crop-growth models have been proposed to accurately estimate regional crop yields.
Most data assimilation strategies focus on reducing the discrepancy between observations and simulations by adjusting the uncertain model parameters, initial conditions [11,12], or model state variables [1315]. Early data assimilation strategies based on optimum estimation algorithms failed to consider errors in observations and the model itself. In addition, the iterative process of minimization between the modeled and observed values may require excessive computing time. To address these shortcomings, several researchers have proposed advanced strategies based on sequential Bayesian filters, i.e., the ensemble Kalman filter (EnKF) [16], particle filter (PF) [17], or variational algorithm [18]. More accurate performance of these strategies was also obtained for operational numerical weather predictions [1922], ocean prediction systems [2328], and land surface processing simulations [2935].
Although the abovementioned strategies have been successfully applied at regional scales, many well-known drawbacks limit the efficiency and feasibility of data assimilation with crop-growth models. Sequential data assimilation becomes prohibitively expensive in terms of computational cost for high-dimensional state spaces because of recursive calculations of the posterior distributions of simulated variables [17,36]. The EnKF, in particular, relies on the assumption that the posterior density at every time step is a Gaussian distribution parameterized by a mean and a covariance, which results in an obvious deficiency when addressing complicated estimation issues in a realistic, nonlinear, and non-Gaussian dynamic system [37]. In data assimilation with crop-growth models, the assumptions described above are unlikely to hold true. The PF-based strategy appears to be a better choice for crop-growth models in nonlinear and non-Gaussian systems. However, a particle filter is a suboptimal algorithm whose accuracy and stability depend on the choice of importance density or resampling method [17]. For traditional four-dimensional variational (4DVar) data assimilation, the most attractive feature is the reduced computing cost that can be attributed to the ability to simultaneously assimilate the observational data at multiple times in an assimilation window. However, 4DVar still faces numerous challenges in coding, maintaining, and updating the adjoint model of the forecast model, and it requires linearization of the forecast model [38]. Accordingly, it has not been used frequently in crop-growth models.
To address these problems and maximally exploit the strengths of both sequential and variational data assimilation while simultaneously offsetting their respective weaknesses, a 4DVar method is proposed on the basis of the proper orthogonal decomposition (POD) and ensemble forecasting techniques [39]. Although a Gaussian distribution assumption of the posterior density of the simulated variable is also given, this method is capable of outperforming both the 4DVar and EnKF methods under perfect- and imperfect-model scenarios with lower computational costs than EnKF, which improves accuracy and efficiency and produces correct estimates of prediction uncertainty in nonlinear and non-Gaussian crop-growth model data assimilation. Notably, few studies on POD-based ensemble 4DVar (POD4DVar) for regional crop yield estimations have been published.
The main objective of this study was to introduce the POD4DVar algorithm into crop model data assimilation and to evaluate its performance. The CERES-Wheat model was employed to design a feasible data assimilation strategy because it is an outstanding agro-ecological dynamic model that considers the effects of weather, management, genetics, soil water, carbon, and nitrogen on crop-yield simulations [40,41]. Moreover, the leaf area index (LAI) was used as an observational variable to couple observed LAI with simulated LAI. Two experiments for winter wheat yield estimation were performed. One experiment was performed using the LAI measured in field plots to determine the feasibility of the data assimilation strategy and to compare its performance with that of the EnKF-based data assimilation strategy. A second experiment was conducted on a regional scale by employing remotely sensed LAI to map regional winter wheat yields and to analyze the accuracy and efficiency of the strategy. In addition, the potentials and uncertainties were analyzed for the application of the CERES-Wheat model with POD4DVar to an operational system for monitoring regional crop growth and predicting critical crop variables.

2. Study Area and Data

2.1. Study Area

Hengshui (37°03′–38°23′N; 115°10′–116°34′E), located in the Huang-Huai-Hai Plain of China, was the primary planting area for winter wheat considered in this study. This area has a temperate sub-humid continental monsoon climate, the annual average temperature is between 12 °C and 13° C, the annual cumulative temperature above 0°C is between 4200 °C and 5500 °C, the annual average precipitation is between 500 and 900 mm, the annual cumulative radiation is between 5.0 × 10³ and 5.2 × 10³ MJ/m−2, and the frost-free season lasts between 170 and 220 days. There are abundant water resources, with nine tributaries belonging to four rivers of the Haihe River system. In this region, the anthropogenic soil types are generally categorized as fluvo-aquic soil, sandy fluvo-aquic soil, wet fluvo-aquic soil, salinized fluvo-aquic soil, and meadow saline soil. The main vegetation includes crops such as winter wheat, maize, and cotton. For winter wheat, the developmental period occurs from early October to early June of the next year. The re-greening period begins in early March, the heading stage lasts from the end of April until early May, and the harvest usually occurs in mid-June.

2.2. Regional Soil, Weather, and Crop Information

The soil map for the study area was derived from the Soil and Terrain database of primary Chinese data at a scale of 1:1 million; this map was compiled using enhanced soil information within the framework of the FAO’s Land Degradation Assessment in Drylands (LADA) program. Data on the physical and chemical properties of the soil profiles were collected from the Soil Species of Hebei Province [42].
Meteorological data were derived from the National Meteorological Information Center, China Meteorological Administration and included daily estimates of maximum and minimum temperature, precipitation, sunlight hours, wind speed, and relative humidity. In addition, radiation was estimated at the station level based on sunlight duration [43]. In this study, daily meteorological parameter data for the study area were interpolated as a raster map with grid cells using ANUSPLIN software [44].
Detailed crop management information was also surveyed, including the dates of planting and harvest, planting depth and spacing, planting density, irrigation dates and volumes, fertilization date and volume, phenological calendar, and other data. Winter wheat yield data were measured at 53 field plots, and the regional statistical yields for 11 counties were obtained from the Hebei Rural Statistic Yearbook [45].

2.3. Remotely Sensed LAI Maps

Remotely sensed images with four bands (blue, green, red, and near-infrared) at 30-m spatial resolution were acquired from the Small Satellite Constellation for Environment and Disaster Monitoring and Forecasting and based on data collected by the A and B satellites (HJ-1A/B satellites) from March to June of 2009. A series of pre-processing steps was performed using ENVI software [46] and included radiometric calibrations, atmospheric corrections, and geometric corrections to convert HJ CCD radiance to reflectance with the correct geographic information.
To extract regional winter wheat LAI maps, a two-layer canopy reflectance model (ACRM) [47] was employed to establish the lookup table (LUT) [48]. To avoid an ill-posed inversion, the estimated LUT was regularized according to the statistical information of the image and a priori knowledge obtained from winter wheat observations. To eliminate inversion distortion from clouds, moisture, aerosols, and mixed pixels, a Savitzky-Golay filter [49,50] was used to smooth the time series of the LAI maps. Finally, acceptable LAI maps of winter wheat were extracted with an R2 of 0.82, an RE of 10.75%, and an RMSE of 0.46.

3. Methods

3.1. Crop Growth Model

The CERES-Wheat model was developed and integrated into DSSAT software in an International Benchmark Sites for Agro-technology Transfer project sponsored by the United States Department of Agriculture [8]. Driven by input data on weather, soil, field management, and genetic information, the CERES-Wheat model can simulate daily phenological development, vegetative and reproductive plant developmental stages, assimilate partitioning of the growth of leaves and stems, senescence, biomass accumulation, and root system dynamics under stressful environments, i.e., those involving light, temperature, water, nitrogen, carbon, and field management interventions [11]. The water and nitrogen sub-models have feedback effects on plant growth and development. This model has been widely applied to field sites to assess crop potential productivity [51,52] and the influence of climate change on grain yields [40,41], farmland water, and fertilizer management [53].
To obtain accurate predictions, a model calibration is first performed, i.e., an estimation of cultivar characteristics using field winter wheat experimental data. In this study, in situ data for the study area were employed to estimate the genetic coefficients in the CERES-Wheat model such that differences between the simulated and measured values were minimized to within acceptable error limits.

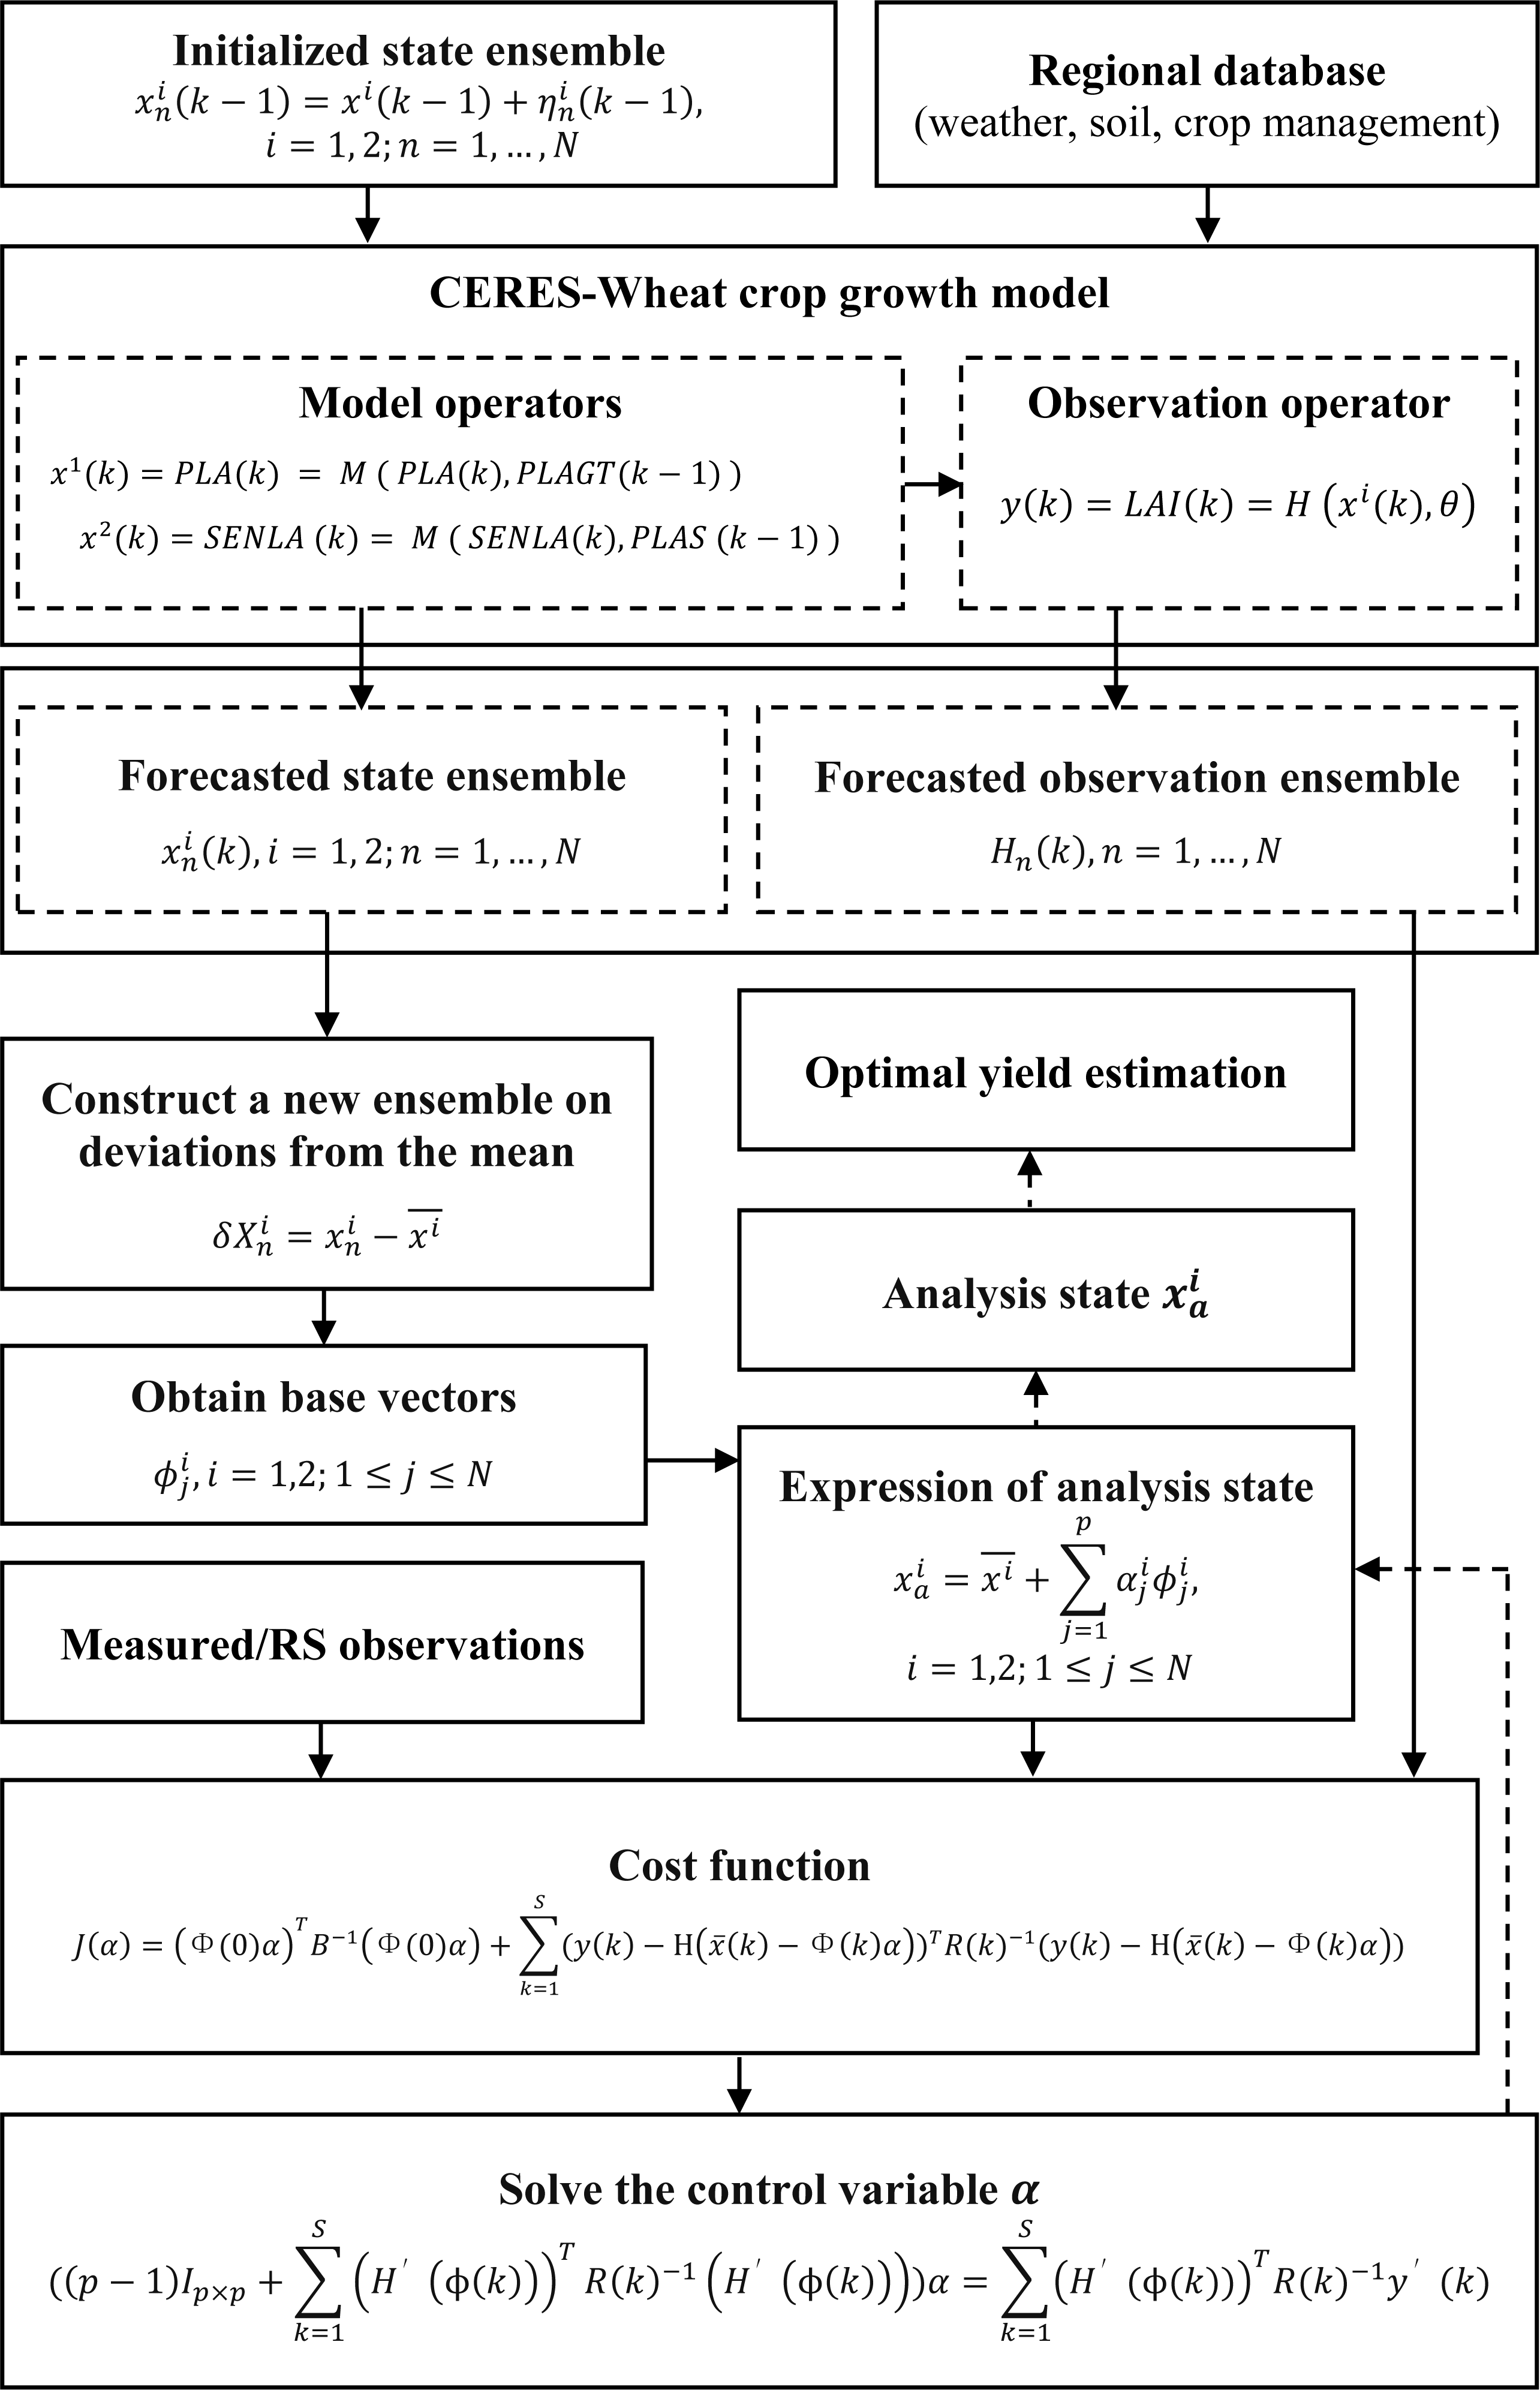
3.2. Ensemble-Based Four-Dimensional Variational Data Assimilation

The POD4DVar was proposed by Tian et al. [54] and is based on incorporating the Monte Carlo method and the proper orthogonal decomposition (POD) technique into 4DVar. The basic idea of this method is to start with a four-dimensional ensemble obtained from the forecast ensembles at all times in an assimilation time window produced using the Monte Carlo method. The POD technique is then applied to the four-dimensional forecast ensemble so that the orthogonal base vectors can capture the spatial structure of the state and reflect its temporal evolution. After the model status is expressed by a truncated expansion of the base vectors obtained using the POD technique, the control variables in the cost function appear explicit so that the adjoint or tangent linear model is no longer required [54].
In principle, the traditional 4DVAR analysis xa is obtained through the minimization of a cost function J, which measures the misfit between the model trajectory H(x(k)) and the observation y(k) at a series of time points tk, k = 1, 2, …, S,
J ( x 0 ) = ( x 0 x b ) T B 1 ( x 0 x b ) + k = 1 S ( y ( k ) H ( x ( k ) ) ) T R ( k ) 1 ( y ( k ) H ( x ( k ) ) )
with the forecast model M imposed as a strong constraint, defined by
x ( k ) = M ( x ( k 1 ) )
where the superscript T stands for a transpose, xb is the background value, the index k denotes the observational time, H(*) is the observational model, and matrices B and R are the background and observational error covariances, respectively. The control variable is the initial condition x0 (at the beginning of the assimilation time window) of the model. In the CERES-Wheat model, the plant area growth function (PLA) and plant area senescence function (SENLA) are considered as state variables whose integrating functions forward with time are considered to be forecast models. The LAI function was used as an observational model in the data assimilation process.
y ( k ) = LAI ( k ) = H ( x i ( k ) , θ ) , i = 1 , 2
x 1 ( k ) = P L A ( k ) = M ( P L A ( k ) , P L A G T ( k 1 ) )
x 2 ( k ) = SENLA ( k ) = M ( SENLA ( k ) , PLAS ( k 1 ) )
where θ is the initial condition of the crop model, index i denotes the number of state variables, PLAGT is the plant growth area, and PLAS is the reduced leaf area resulting from various stress factors.
The POD4DVar strategy is a non-recursive process in which all observations at multiple time nodes are used to solve all “analyses” in an assimilation process. In contrast, sequential assimilation uses the observations at one time node to solve only one “analysis” in a recursive assimilation process. To minimize the cost function, the details of POD4DVar with the CERES-Wheat crop model are as follows (Figure 1):
(1)
Assuming that there are S time steps in the assimilation time window (0, T), generate N random perturbation fields using the Monte Carlo method, add each perturbation field to the initial background field at time point t0, and integrate the model to produce a perturbed four-dimensional field x n i (n = 1, …, N; i = 1, 2) over the entire assimilation time window (S time steps) or at the observational time steps (K). A perturbation of the state variable was conducted with parameterizing error η as a function of state xi as follows, similar to [55]:
x n i ( k ) = x i ( k ) + η n i ( k ) , η n i ( k ) ~ N ( 0 , ( ɛ mod x i ( k ) ) 2 ) , i = 1 , 2 ; n = 1 , , N
where x n i(k) is the nth reperturbed state ensemble member of the ith state variable at time k, η is random noise with a mean of zero and a variance of (ɛmodxi(k))2, and ɛmod is a parameter that is specified as 0.5 to reflect the diversity of the perturbation ensemble.
The average of the state ensemble (PLA, SENLA) at tk is then given by
x i ¯ = 1 N n = 1 N x n i , i = 1 , 2
(2)
A new ensemble matrix, A ( M × N ) = ( δ X 1 i , δ X 2 i , , δ X n i ), i = 1, 2, n = 1,2,⋯, N, is constructed by focusing on deviations from the mean as follows:
δ X n i = x n i x i ¯ , i = 1 , 2 ; n = 1 , 2 , , N
The matrix A is composed of N column vectors, where M = Mg × Mv × S(k), Mg and Mv are the number of model spatial grid points and the number of the model variables, respectively, and S(K) is the number of all time levels (observational time levels) over each analysis time window.
(3)
To compute the POD modes, the nonzero eigenvalue λ and eigenvectors V of T = (ATA)N×N are solved as follows:
T V = λ V
The POD mode matrix is then given by Φ = AV. The truncated reconstruction of the analysis variable x a i is given by
x a i = x i ¯ + j = 1 p α j i ϕ j i , i = 1 , 2 ; 1 j N
where the POD mode matrix is Φ = ( ϕ 1 i , , ϕ p i ), i = 1,2, α is the control variable, and p is the number of POD modes, defined as follows:
p = min { p , I ( p ) = j = 1 p λ j j = 1 N λ j : I ( p ) γ } , 0 γ 1
(4)
The POD mode matrix is used to reconstruct the cost function J, which is expressed as follows:
J ( α ) = ( Φ ( 0 ) α ) T B 1 ( Φ ( 0 ) α ) + k = 1 S ( y ( k ) H ( x ¯ ( k ) Φ ( k ) α ) ) T R ( k ) 1 ( y ( k ) H ( x ¯ ( k ) Φ ( k ) α ) )
that is,
J ( α ) = ( Φ ( 0 ) α ) T B 1 ( Φ ( 0 ) α ) + k = 1 S ( H ( ϕ ( k ) ) α y ( k ) ) T R ( k ) 1 ( H ( ϕ ( k ) ) α y ( k ) )
where
H ( ϕ ( k ) ) = H ( x ¯ ( k ) + ϕ ( k ) ) H ( x ¯ ( k ) )
y ( k ) = y ( k ) H ( x ¯ ( k ) )
Similar to the EnKF [16], the background error covariance can be constructed through the use of perturbed state ensemble members as follows:
B = Φ ( 0 ) Φ ( 0 ) T p 1
In this study, the observational error associated with a normal distribution with a mean of zero and a variance of σ obs 2 will be considered as a function of the observation LAIobs as follows, similar to [55]:
σ obs 2 = ( ɛ obs LAI obs ) 2
where ɛobs is the appropriate coefficient of variation. In this study, the error parameter is specified as ɛobs = 0.1 for all observations. As in the EnKF [16], the observation error covariance can be constructed through the use of the perturbed observation error ensemble E as follows:
R = EE T N 1
(5)
The optimization problem (13) can be solved as follows:
J ( α ) = 0
( ( p 1 ) I p × p + k = 1 S ( H ( ϕ ( k ) ) ) T R ( k ) 1 ( H ( ϕ ( k ) ) ) ) α = k = 1 S ( H ( ϕ ( k ) ) ) T R ( k ) 1 y ( k )
Thus, α is easily determined, and the final results of the analysis are then obtained.

3.3. Assimilation Experiments for Winter Wheat Yield Estimation

To introduce the POD4DVar algorithm into the crop model data assimilation and evaluate its performance, two experiments for winter wheat yield estimation were performed in this study. One experiment at the field scale was conducted to illustrate the feasibility of a data assimilation strategy and to compare its performance with that of the EnKF-based data assimilation strategy. To compare the performance of the POD4DVar- and EnKF-based data assimilation strategies, both methods were coded and coupled with the CERES-Wheat model using the FORTRAN computer programming language. Assimilation with both methods was performed separately on the same computer with the same simulation conditions, including model inputs, initial conditions, 7 assimilating LAIs measured at each field plot with a time interval equal to that of measuring observations, and 50 ensemble members.
Another experiment was conducted on a regional scale to map regional winter wheat yields and to evaluate the accuracy and efficiency of data assimilation with the POD4DVar algorithm. In this experiment, 10 LAIs with a time interval of 8 days were assimilated into the crop model at each pixel. Other simulation conditions were the same as those for the experiment performed at the field scale.
In the data assimilation experiments described above, the crop management parameters in the CERES-Wheat model were set using the regional mean value. The planting date was 10 October 2008, the sowing population was 450 plants per square meter, and the row spacing was 15 cm. Irrigation with a volume of 65 mm was conducted three times on 10 March, 1 April, and 10 May of the following year. The nitrogen fertilizer volume was 120 kg/ha. The soil and weather parameters were derived from field observations.

4. Results and Discussion

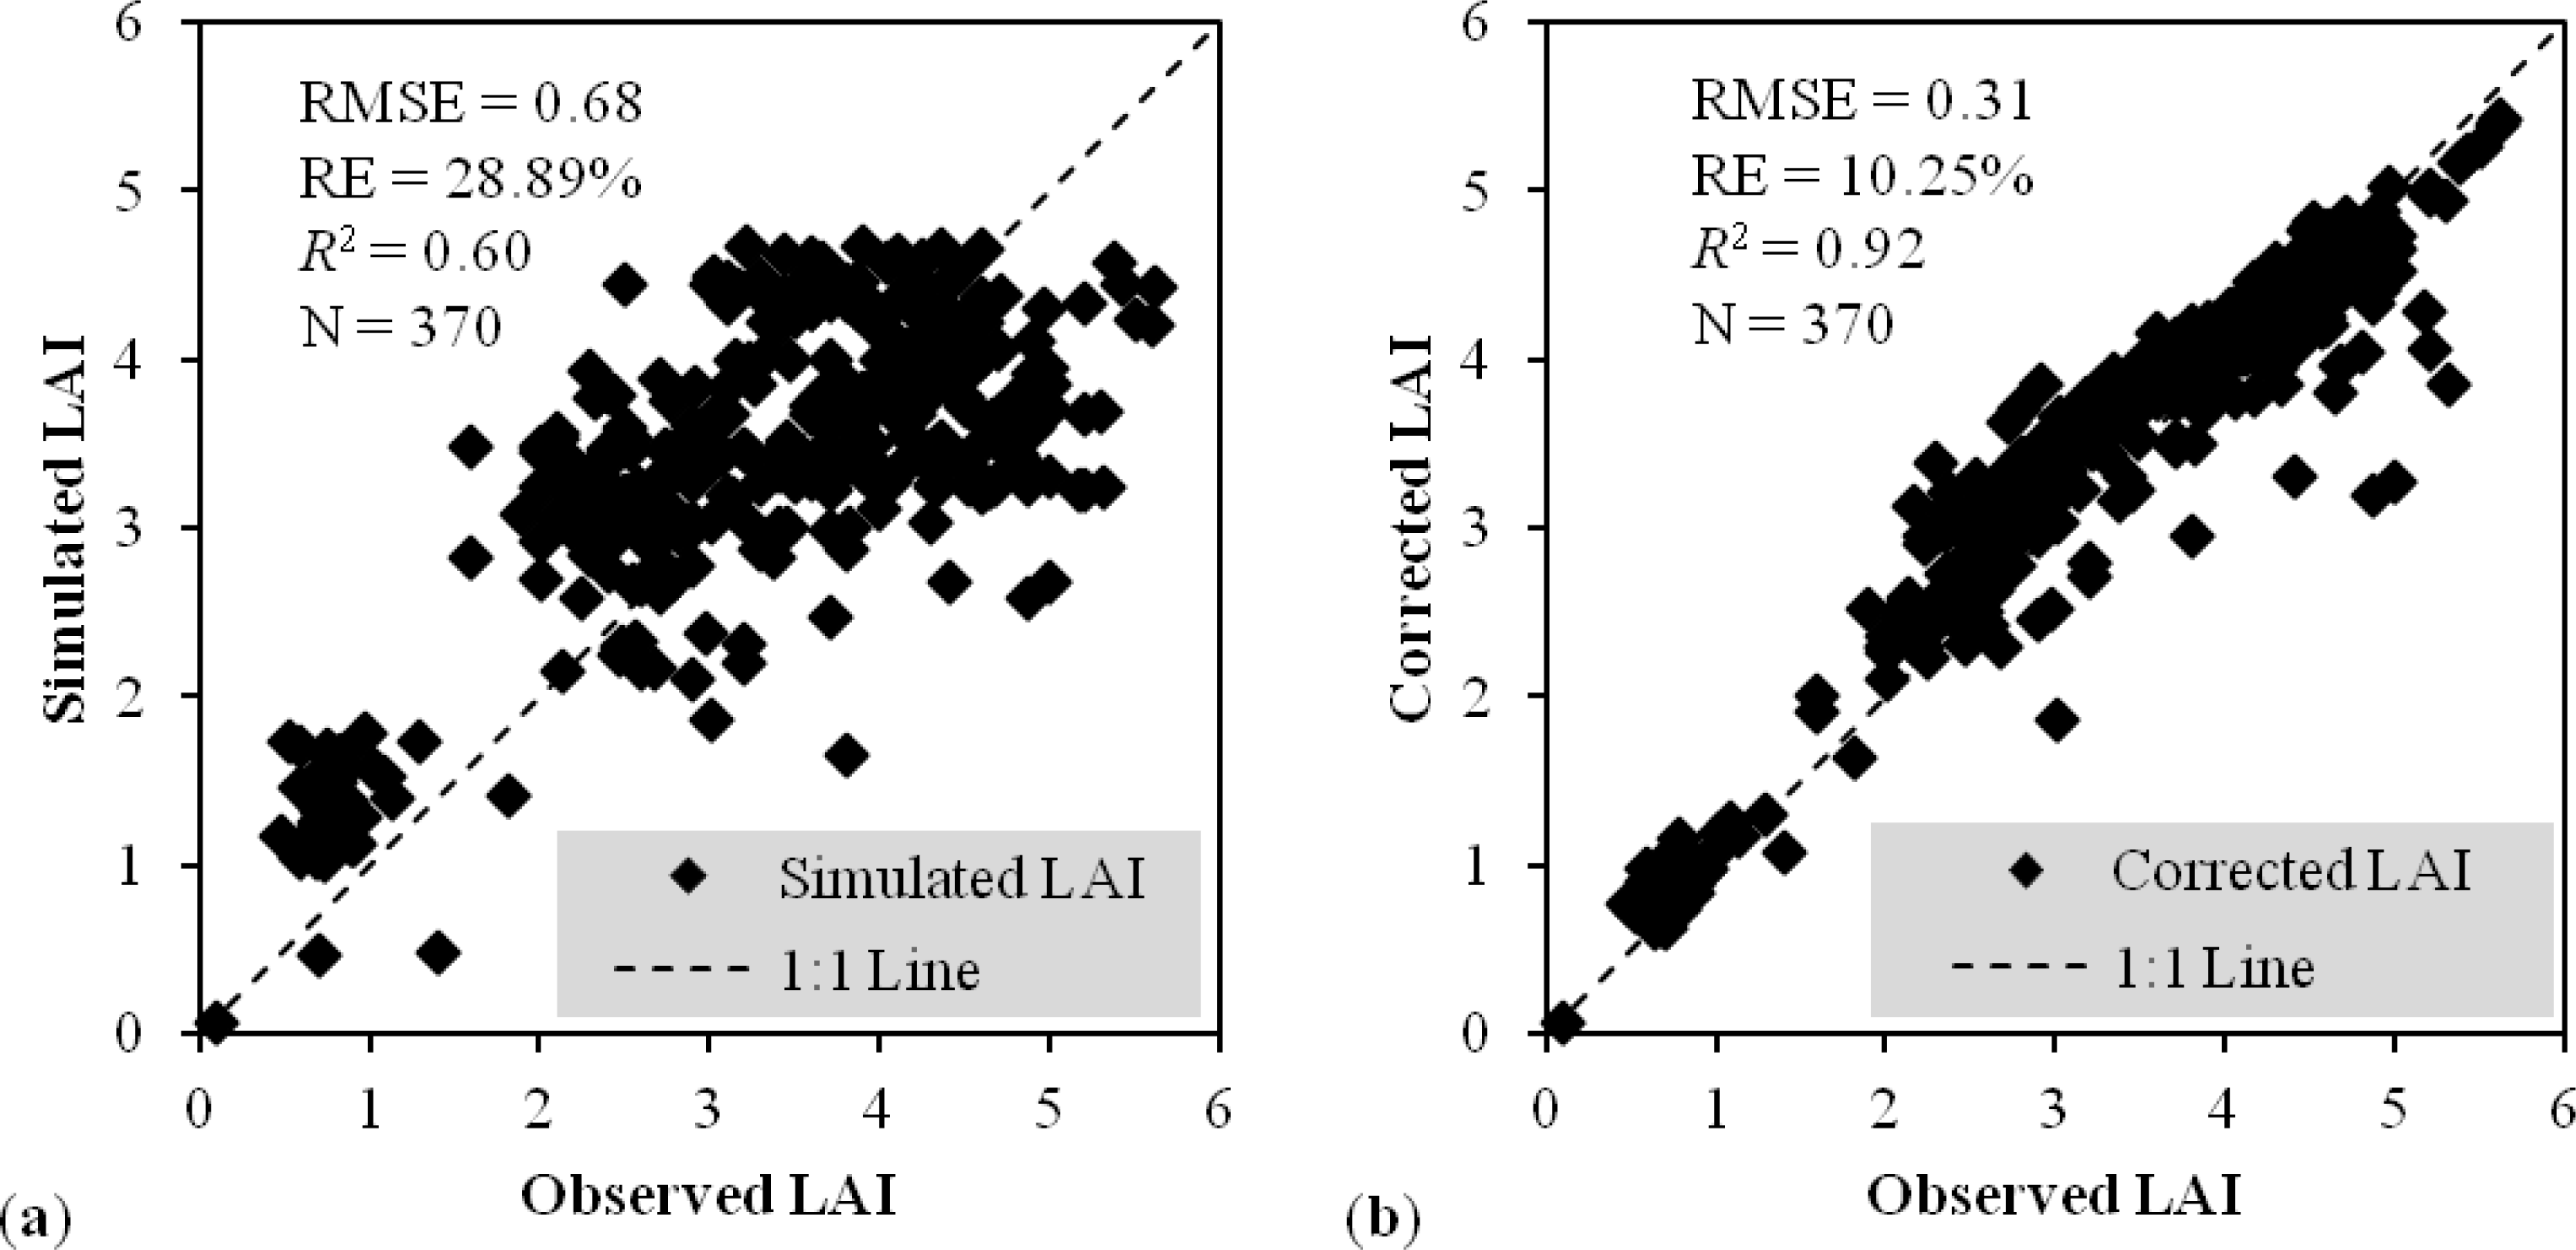
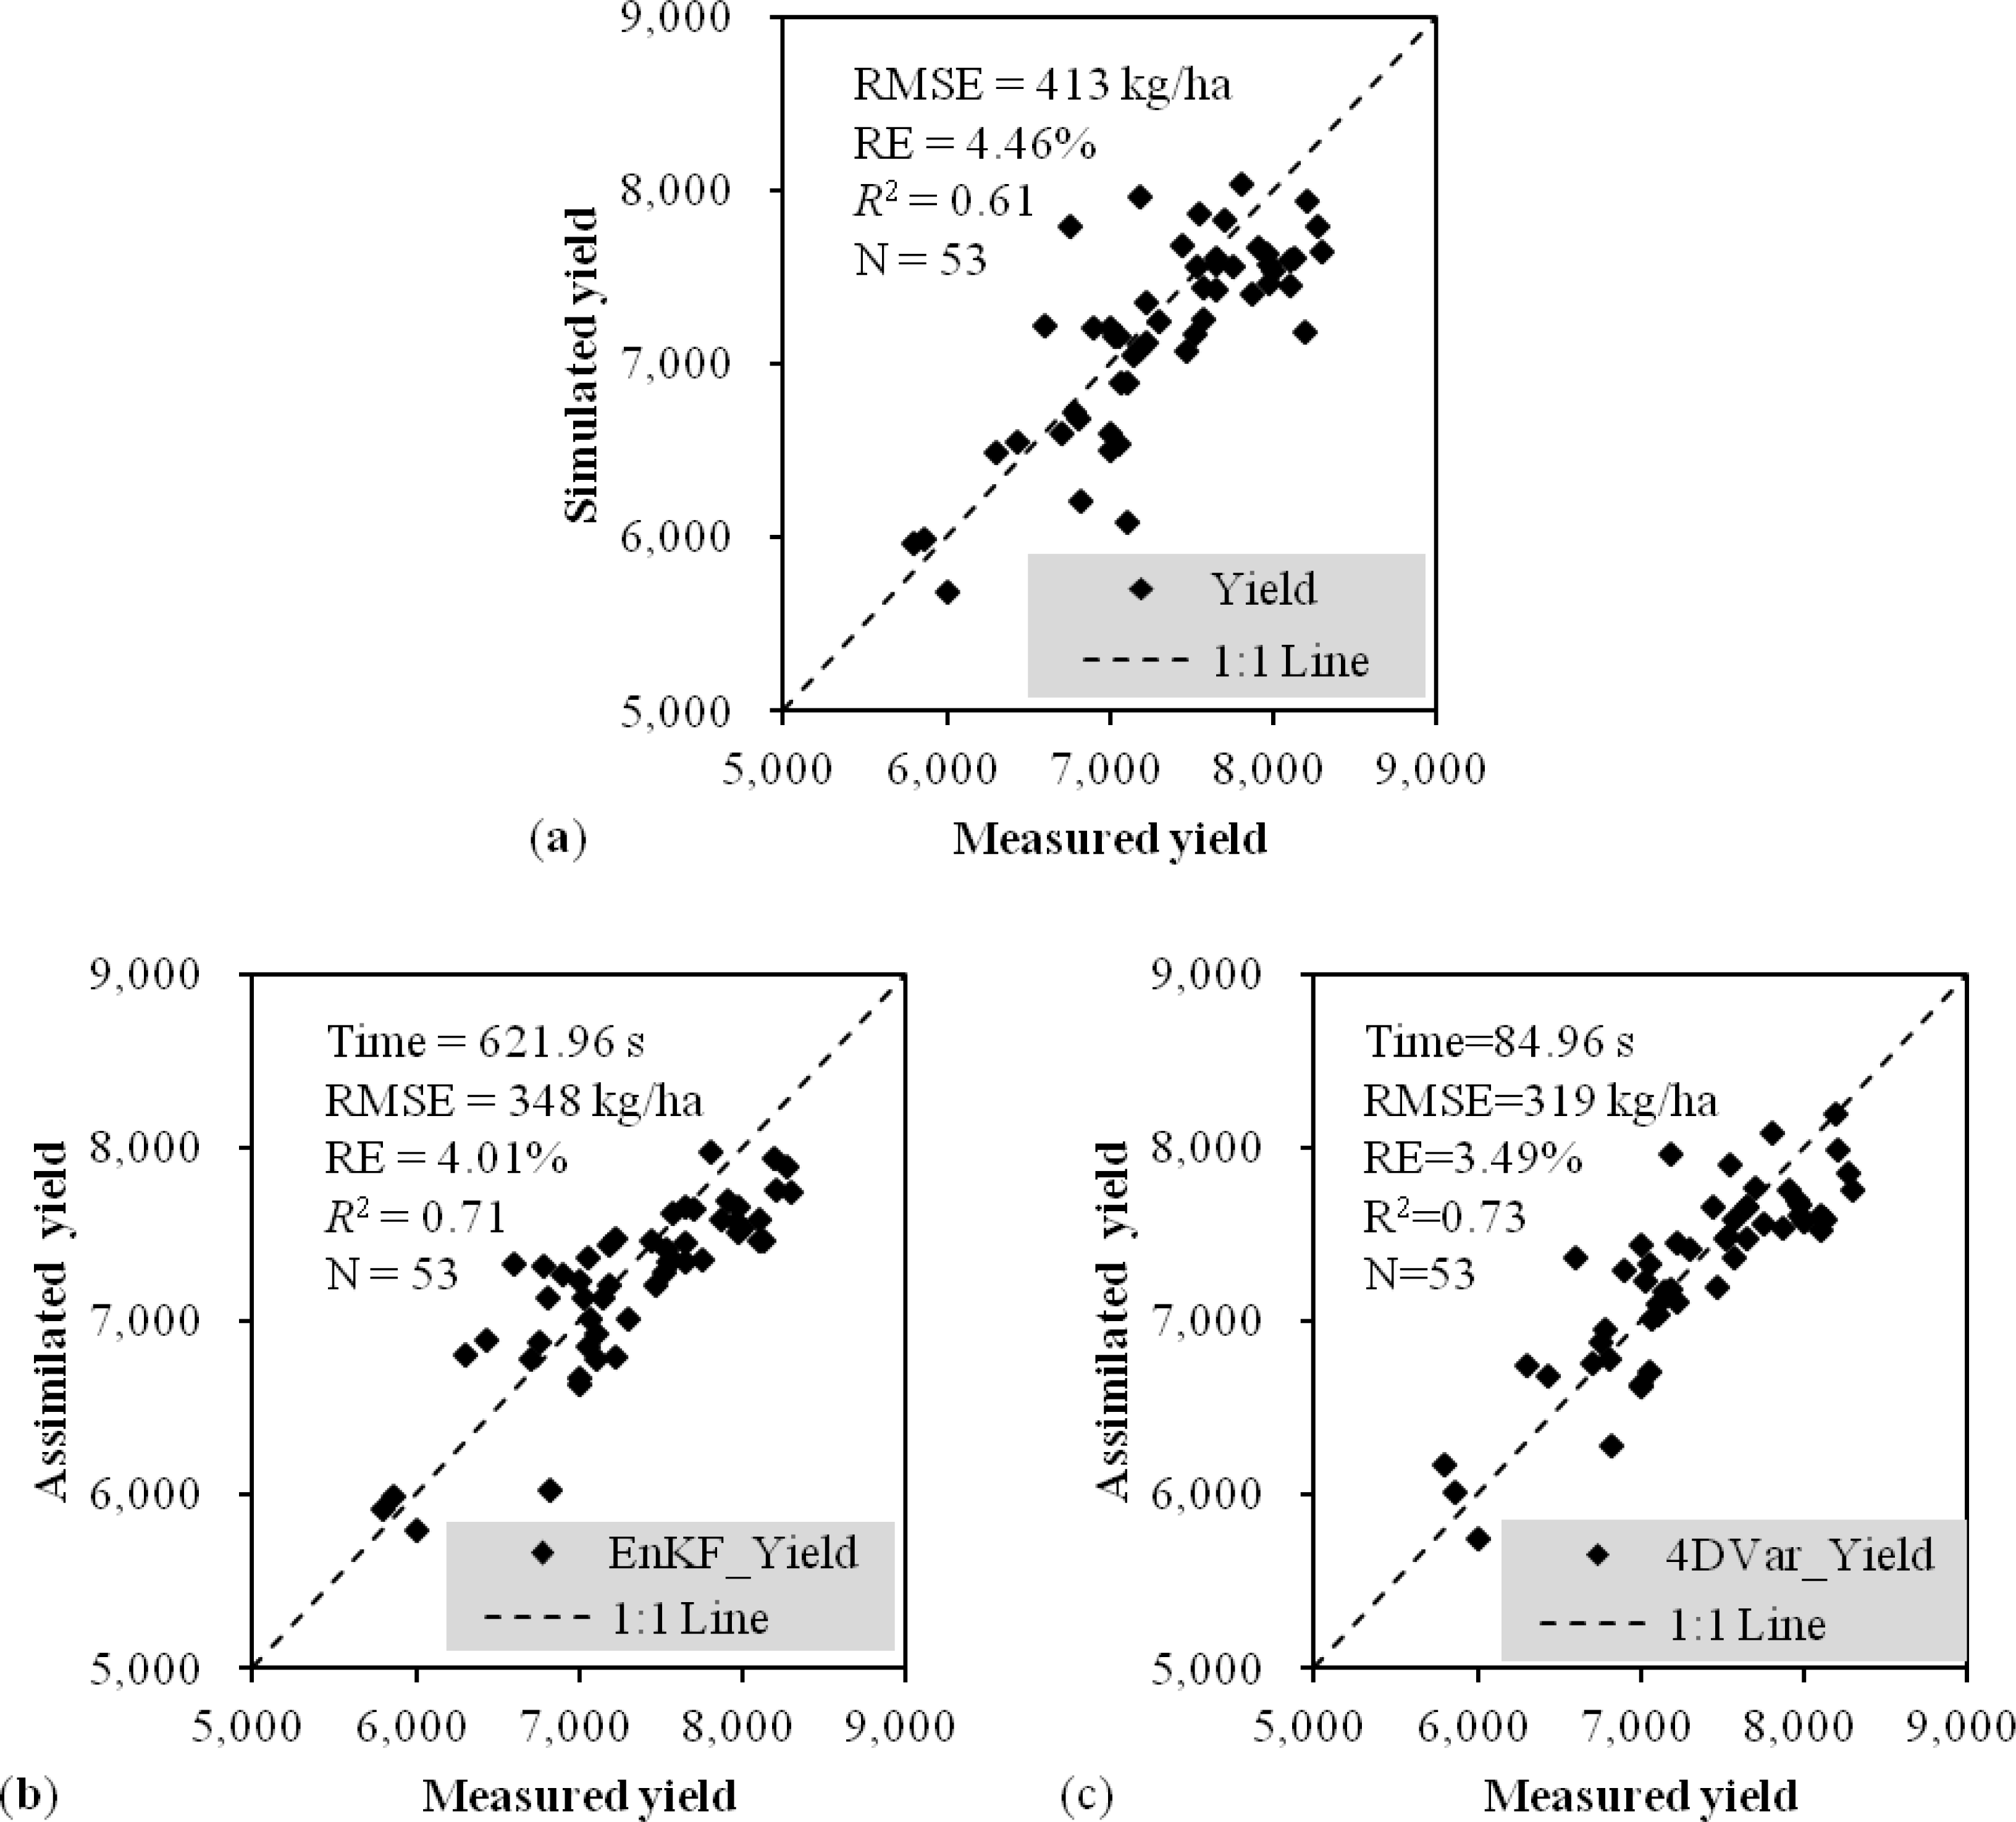
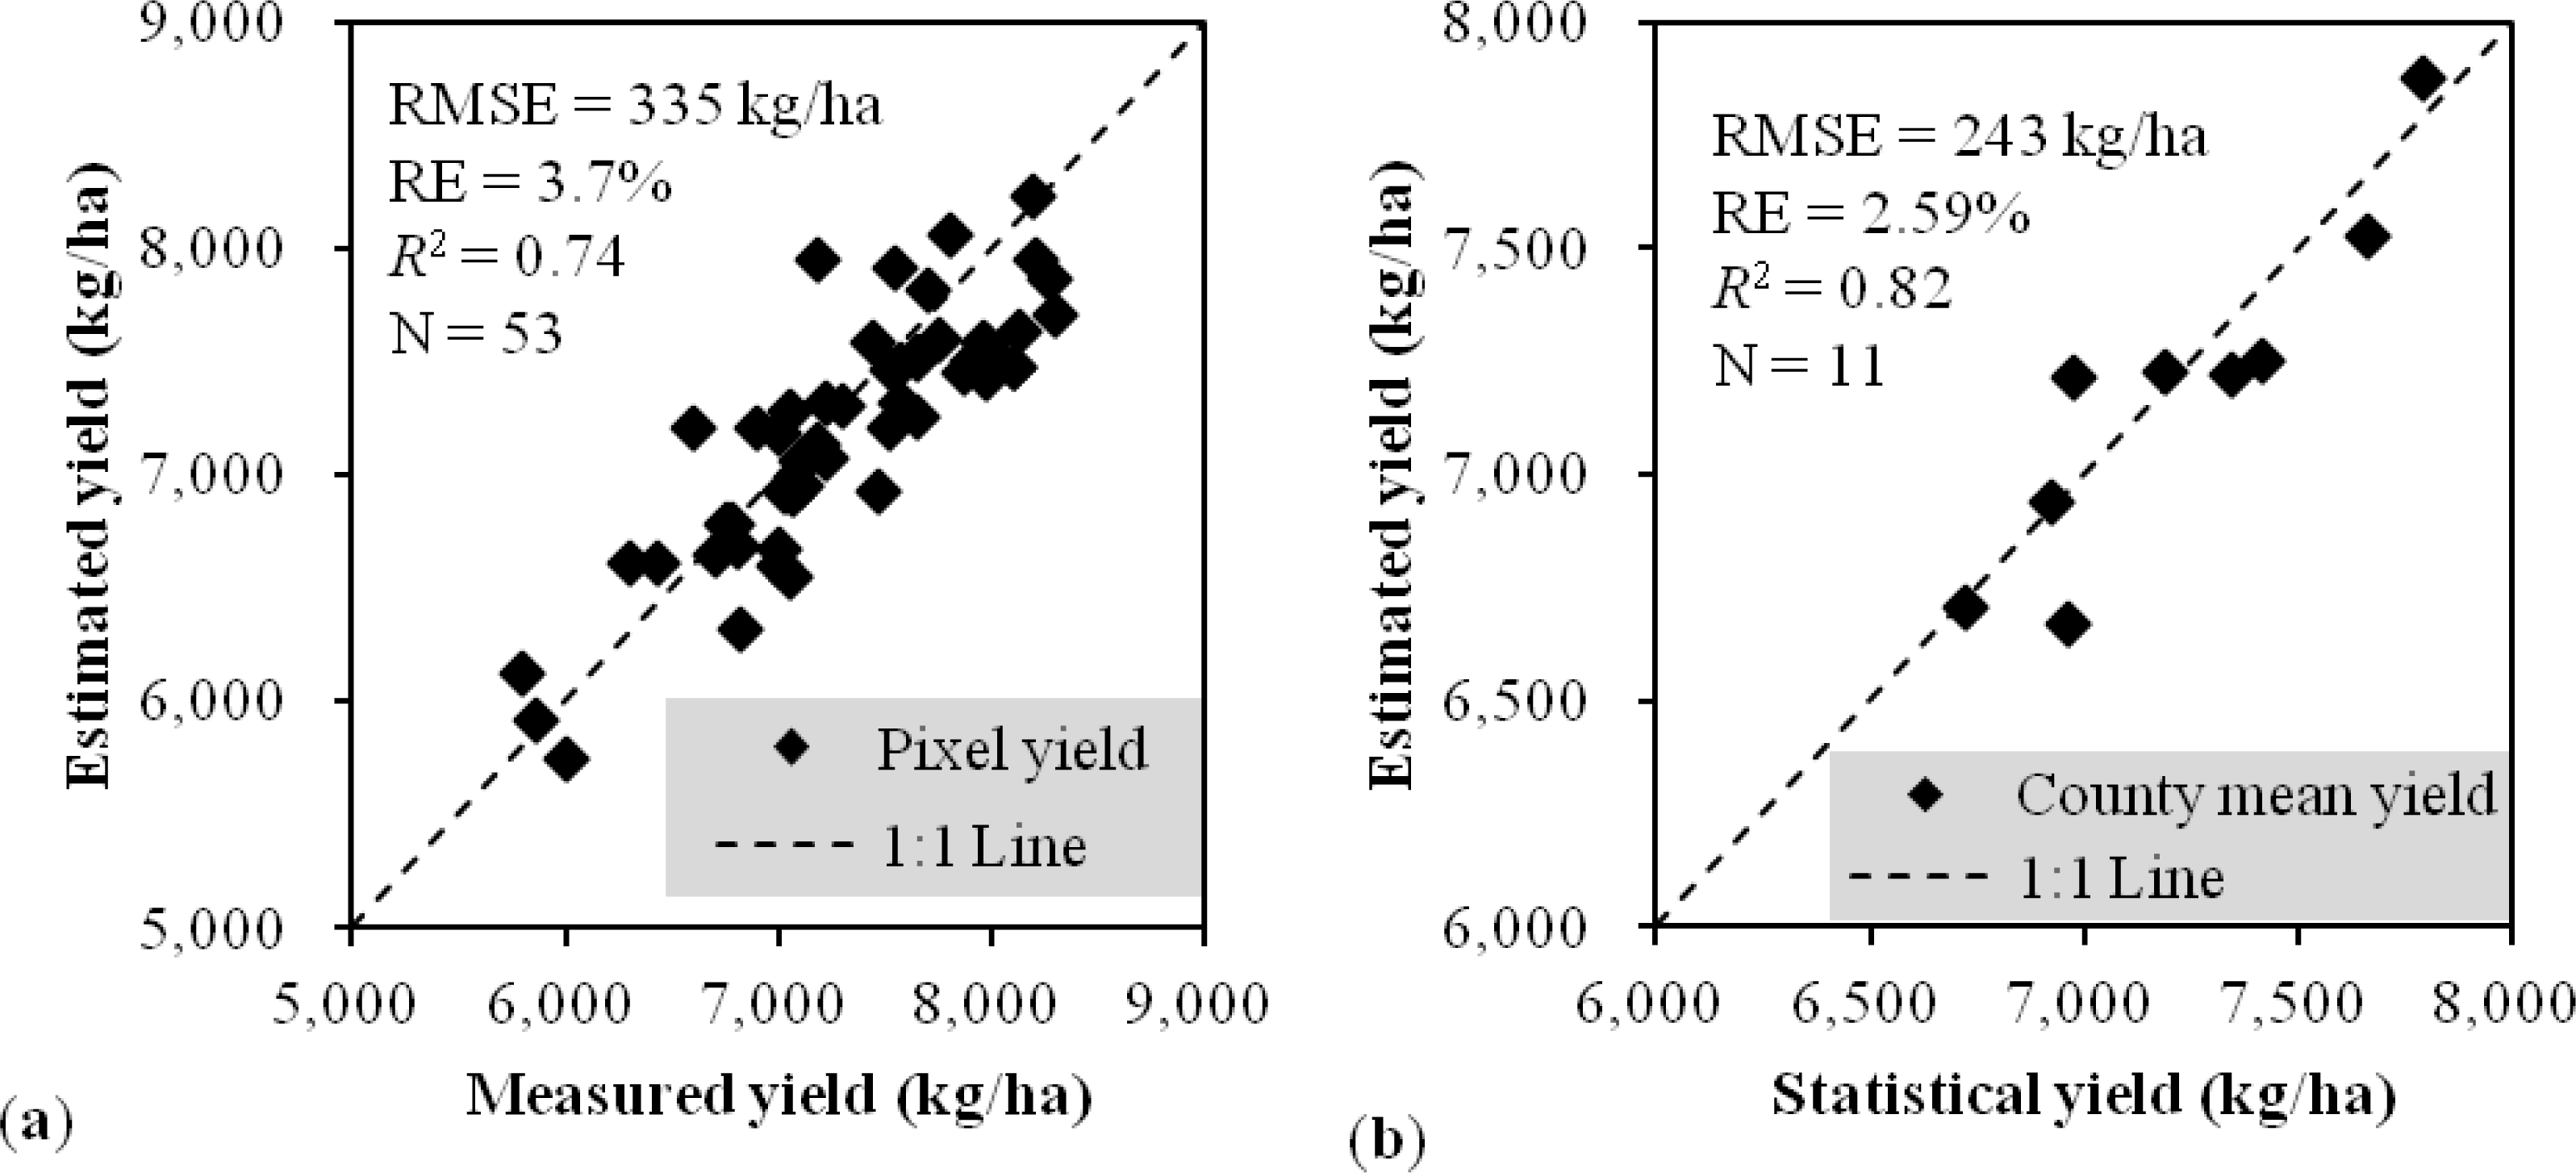
4.1. Experiments for Winter Wheat Yield Estimation at the Field Scale

The initial parameters and conditions regarding the soil, weather, and crop management varied and were difficult to collect on a regional scale. There were often numerous uncertainties regarding the simulation in the CERES-Wheat model when a general model was configured for the study area, especially for aspects of crop management such as planting, irrigation, and fertilization. These factors led to a lower accuracy in regional crop yield estimation and limited the potential application of the crop model. In this experiment, a series of LAIs measured at 53 field plots was assimilated into the CERES-Wheat model. Compared with the LAI simulation process with no data assimilation (Figure 2a), the POD4DVar-based data assimilation performed the incorporation between the observed and modeled LAIs within the dynamic framework of the winter wheat growth process such that the LAI simulation over the entire growing season was optimized and the simulated LAI was more consistent with the actual LAI, with an R2 of 0.92, an RMSE of 0.31, and an RE of 10.25% (Figure 2b).
Consequently, the yield estimates were dramatically improved because of the optimization of the LAI simulation process. Compared with the forecasted yields with no data assimilation (Figure 3a) and the EnKF-based data assimilation (Figure 3b), the estimated yields with the POD4DVar-based data assimilation better predicted the measured yields, with an R2 of 0.73, an RMSE of 319 kg/ha, and an RE of 3.49% (Figure 3c). Furthermore, less computing time was required for the POD4DVar-based strategy (1.60 s over an assimilation window) than for the EnKF-based strategy (11.74 s). The experimental results support the technical and practical feasibility of POD4DVar-based crop model data assimilation, especially in terms of accuracy and efficiency.

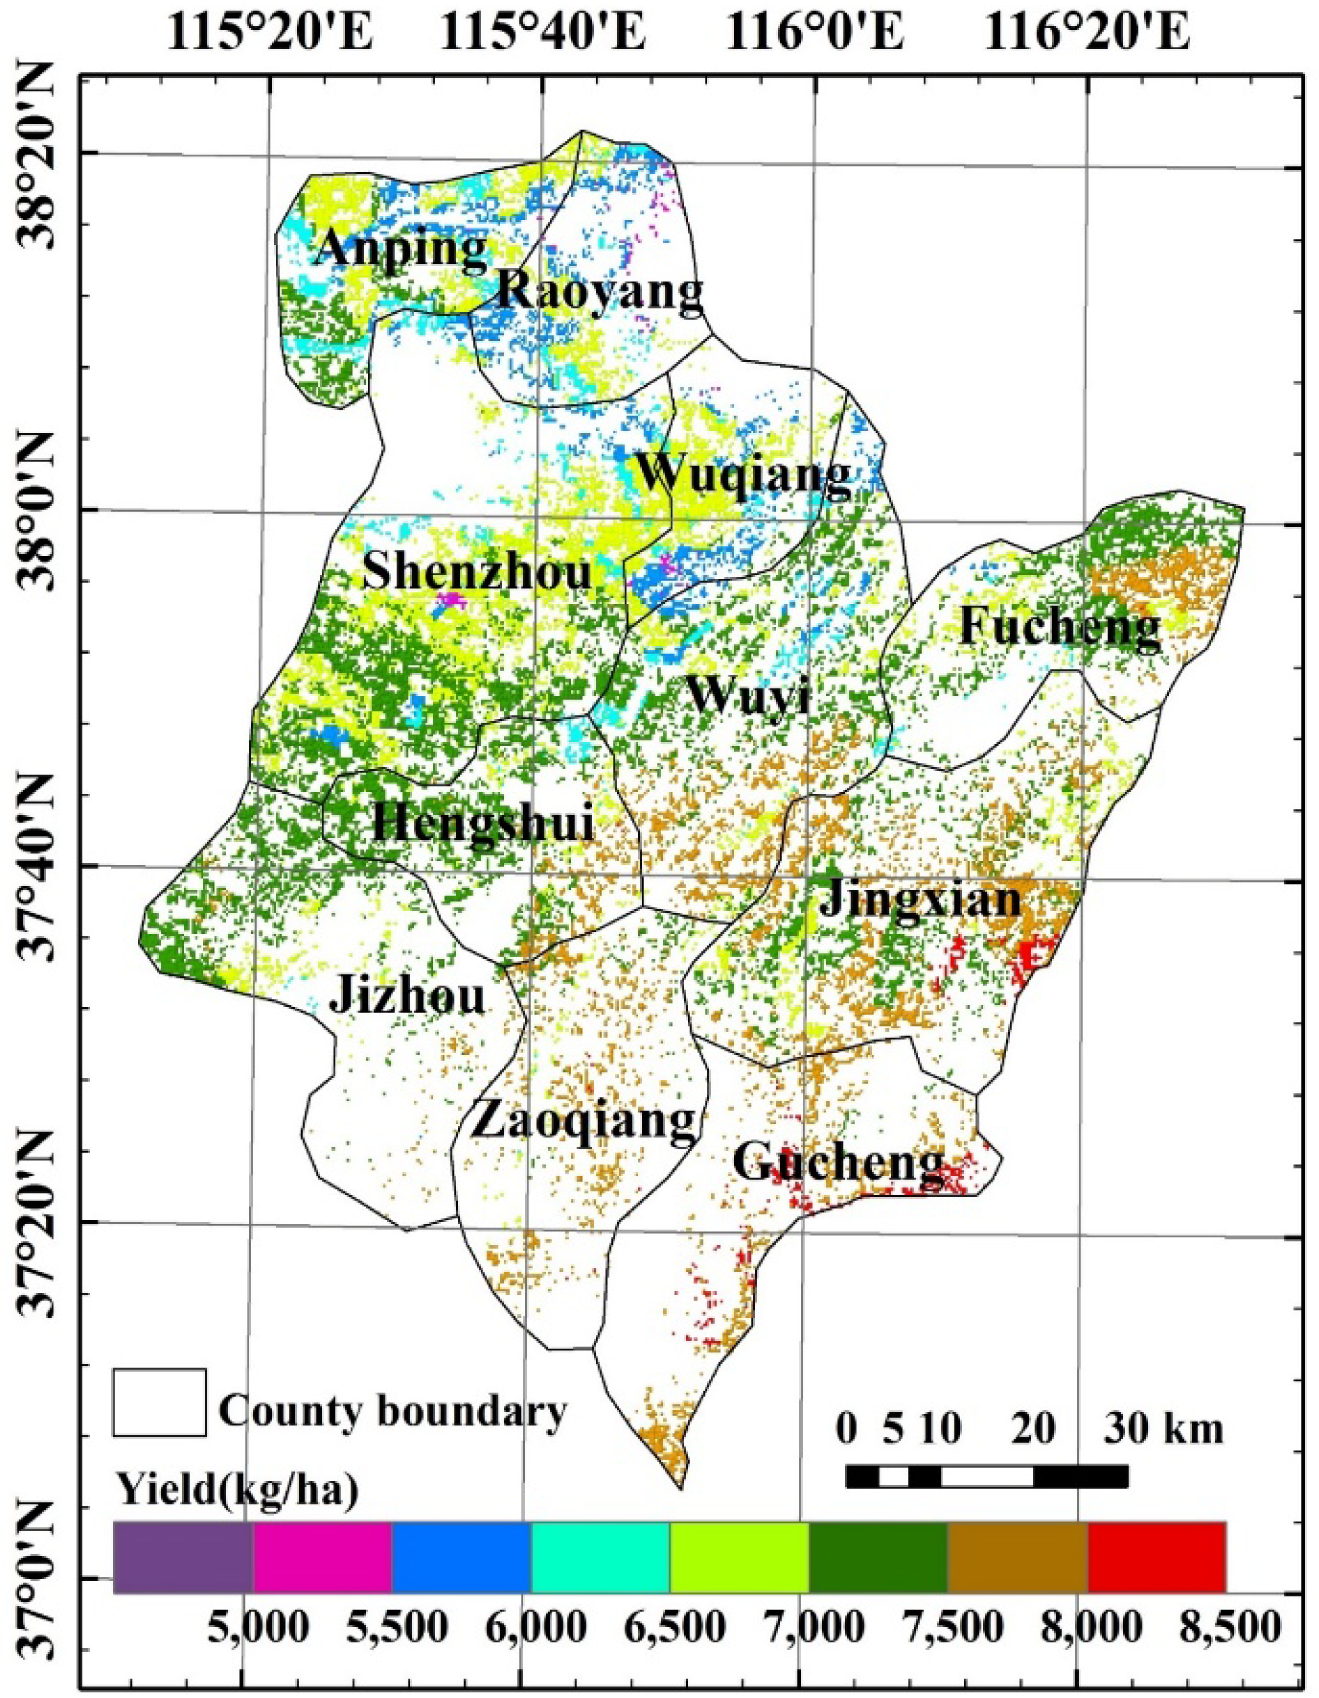
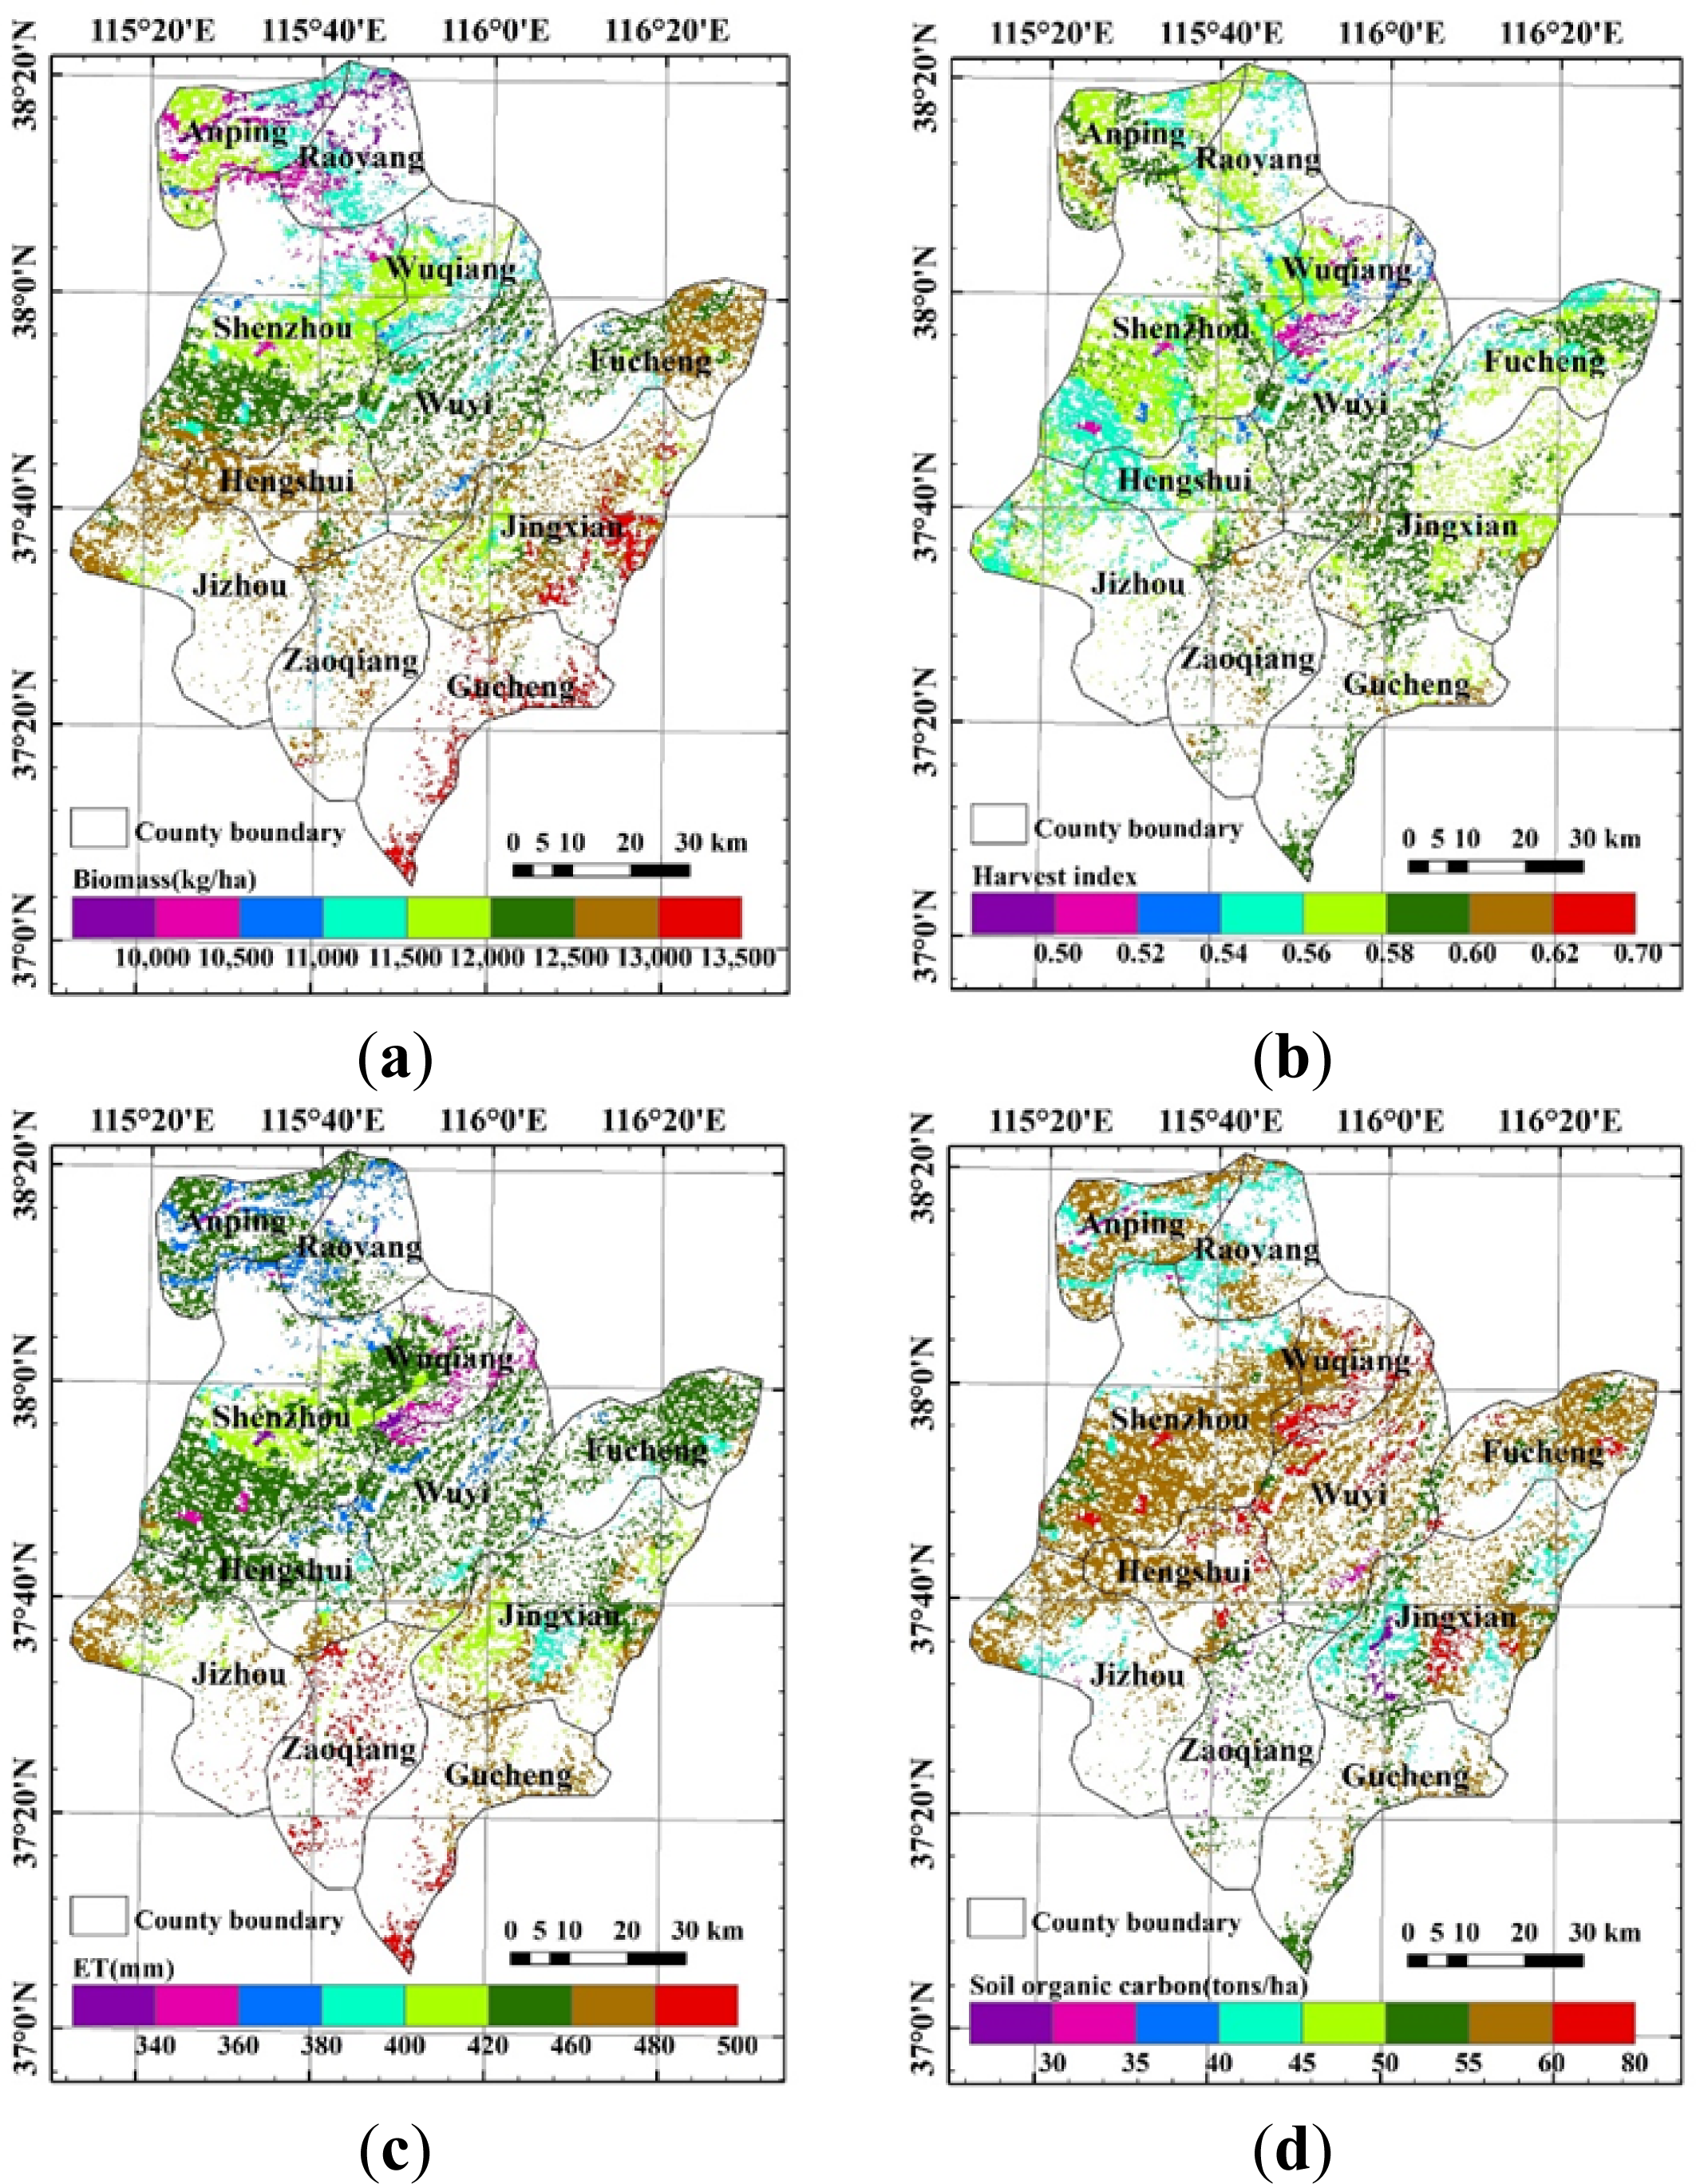
4.2. Experiments for Winter Wheat Yield Estimation on a Regional Scale

Remotely sensed LAI maps with a spatial resolution of 30 m were used to map regional winter wheat yields. The yield map shows that the yield per unit area tended to decrease from the northwest to the southeast of Hengshui (Figure 4). The average yield over the study region was 7069 kg/ha, the yield range was 4957 to 8367 kg/ha, and the standard deviation was 375 kg/ha. The maximum productive capacity was observed in Gucheng county (7884 kg/ha), followed by Zaoqiang (7608 kg/ha) and Jingxian (7456 kg/ha). The minimum yield was 6108 kg/ha in Raoyang.
An accuracy verification was performed on pixel and county scales. The estimated yields of 53 pixels better corresponded to the actual yields of field plots, with an R2 of 0.74, an RMSE of 335 kg/ha, and an RE of 3.70% (Figure 5a). The statistical results for the mean yields for 11 counties showed that the R2 was 0.82, the RMSE was 243 kg/ha, and the RE was 2.59% (Figure 5b). The good performance of the CERES-Wheat model with POD4DVar supports the feasibility and potential of this approach for operational systems that monitor regional crop yield.

4.3. Analysis of the Potential of the CERES-Wheat Model with POD4DVar

The objective of this study was to estimate winter wheat yield by assimilating measured or remotely sensed information into the CERES-Wheat model and to examine the suitability of the CERES-Wheat model with POD4DVar for operational estimates of crop yield at regional scales. In our assimilation strategy, the CERES-Wheat model, as a dynamic agroecosystem model, can be used to simulate temporal changes according to the climate-soil-crop-management system that diagnoses and forecasts crop growth status during various developmental stages. Moreover, remotely sensed data can provide actual information on regional crop growth status in real time. This information is critical for optimizing simulation processes in crop models. Most importantly, the POD4DVar-based strategy simplifies the data assimilation process and retains the main advantages of the traditional 4DVAR method [54]. Consequently, significant improvements in regional yield estimation were observed in our experiments when the POD4DVar-based strategy, rather than the EnKF-based strategy, was used to assimilate remotely sensed LAI maps into the CERES-Wheat model. Contrary to the EnKF-based sequential assimilation strategy, the POD4DVar-based strategy assimilated all observational data at multiple times in an assimilation window such that less computing time was required. In our work, the assimilation efficiency of the POD4DVar-based strategy was at least 7 times faster than that of the EnKF-based strategy in an assimilation window. The significant improvements in yield estimation suggest that the POD4DVar-based CERES-Wheat model data assimilation technique overcomes the shortcomings of the other approaches and can be applied to accurately and efficiently estimate regional crop yields.
In addition to the yield, other critical information on regional crop growth may also be estimated, such as the biomass (Figure 6a), harvest index (Figure 6b), evapotranspiration (Figure 6c), and soil organic carbon (Figure 6d). These findings collectively provide strong support for monitoring crop growth, guiding agricultural activities, and evaluating agricultural contributions to climate change. Hence, some of the observed data will be collected for future analysis to determine the accuracy of these additional estimates. These results suggest that the CERES-Wheat model with POD4DVar-based data assimilation is feasible and has a potential application in operational systems for monitoring regional crops in the near future.

4.4. Uncertainty Analysis of CERES-Wheat Model with POD4DVar

Imperfect predictions are often unavoidable because of uncertainty about future weather conditions and because of imperfect crop models that are limited due to insufficient detailed knowledge of the crop growth process, but the uncertain simulations appear to be well corrected through the use of data assimilation technology. When crop models with data assimilation are employed to estimate regional crop yields and other growing state variables, several uncertainties in the model inputs, data assimilation algorithms, and assimilated observations must be addressed.
It is essential to obtain high-quality model inputs of soil, weather, and field management information because these data may be used for the calibration and validation of crop models. Nevertheless, it appears to be impossible to collect all of these data on a regional scale, especially for regional field management information, which is often parameterized as a general value in an agricultural region. This issue is present in the current study, but a data quality control was performed in the data preparation stage. This procedure reduced the uncertainty due to the model inputs in the data assimilation.
The data assimilation performance of the CERES-Wheat model appears to rely heavily on the parameters of the POD4DVar algorithm and the spatiotemporal scales of the assimilating observations. As in the EnKF method, the state ensembles are used in the POD4DVar method to describe the possibility of real states in crop growth simulations. This characteristic suggests that the quality of the results depends on the perturbed ensembles when POD4Dvar is used [54]. Hence, the state ensembles must be generated in a reasonable manner to reduce the prevalence of uncertain simulations.
The assimilated observations also result in uncertainties. The purpose of data assimilation is to employ the observational data to correct simulations of the crop growing process. A significant improvement at the regional scale could be achieved if remotely sensed observations with high spatiotemporal resolution were assimilated into the crop model. However, these satellite-based observations during the crop growing season are usually limited by frequent cloud coverage, long revisit periods, and/or mixed-pixel errors [56]. These limitations and errors are important factors that result in uncertainty for regional crop yield estimation. This aspect also requires further investigation.

5. Conclusions

By merging the Monte Carlo method and the POD technique into the 4DVar method, the POD4DVar method retains the main strengths of traditional 4DVar and avoids the need for an adjoint or tangent linear model of the forecast model in data assimilation. Compared with the EnKF-based strategy, this method has the advantage of higher computational efficiency in operational monitoring of regional crop yields. Significant improvements in the accuracy and efficiency of crop yield estimation were observed when the measured LAIs or the remotely sensed LAI maps were assimilated into the CERES-Wheat model with POD4DVar. In addition to crop yield estimation, the potential applications of the POD4DVar-based CERES-Wheat model may include the estimation of other critical variables in a crop growing season, such as the biomass, harvest index, evapotranspiration, and soil organic carbon. These potential applications suggest that our data assimilation strategy is a promising approach for operationally monitoring crop growing states and predicting critical crop variables. However, successful application in an operational system for regional crop monitoring must address several issues of uncertainty, such as the crop-growing mechanism in the crop model, model inputs, data assimilation algorithm, and assimilated observations. These issues will be examined in future studies.

Acknowledgments

We are grateful for support from the National Natural Science Foundation of China (41371396, 41301457), the Agricultural Scientific Research Fund of Outstanding Talents and the Open Fund for the Key Laboratory of Agri-informatics, Ministry of Agriculture, P.R. China (2013009), Introduction of International Advanced Agricultural Science and Technology, Ministry of Agriculture, P.R. China (948 Program, No. 2011-G6), and National High Technology Research and Development Program of China (863 Program, No. 2012AA12A307). Three anonymous reviewers are thanked for helpful comments and suggestions that improved the presentation.

Author Contributions

All authors contributed extensively to the work. Zhiwei Jiang, Zhongxin Chen and Jin Chen designed and performed crop msodel data assimilation experiments. Zhongxin Chen and Jin Chen reviewed the manuscript and gave comments and suggestions to the manuscript. All authors performed the field survey. Zhiwei Jiang performed the satellite datasets preprocessing and the inversion of winter wheat LAI. Jianqiang Ren, Zongnan Li and Liang Sun validated the results with the field survey data. Zhiwei Jiang, Zhongxin Chen and Jin Chen wrote the manuscript. All authors participated in editing and revision of the paper.

Conflicts of Interest

The authors declare no conflict of interest.

References

  1. Slingo, J.M.; Challinor, A.J.; Hoskins, B.J.; Wheeler, T.R. Introduction: Food crops in a changing climate. Phil. Trans. R. Soc. Lond. B. Biol. Sci 2005, 360, 1983–1989. [Google Scholar]
  2. Rosegrant, M.W.; Cline, S.A. Global food security: Challenges and policies. Science 2003, 302, 1917–1919. [Google Scholar]
  3. Battisti, D.S.; Naylor, R.L. Historical warnings of future food insecurity with unprecedented seasonal heat. Science 2009, 323, 240–244. [Google Scholar]
  4. Chen, J.; Huang, J.; Lin, H.; Pei, Z. Rice yield estimation by assimilation remote sensing into crop growth model. Sci. Sin. Inform 2010, 40, 173–183. [Google Scholar]
  5. Fang, H.; Liang, S.; Hoogenboom, G.; Teasdale, J.; Cavigelli, M. Corn-yield estimation through assimilation of remotely sensed data into the CSM-CERES-Maize model. Int. J. Remote Sens 2008, 29, 3011–3032. [Google Scholar]
  6. Hijmans, R.J.; Guiking-Lens, I.M.; van Diepen, C.A. System Description of the WOFOST 6.0 Crop Simulation Model Implemented in CGMS. Volume 1: Theory and Algorithms; EUR 15956; Office for Official Publications of the European Communities: Luxembourg, 1994; p. 146. [Google Scholar]
  7. Williams, J.A.J.C. The EPIC crop growth model. Trans. ASAE 1989, 32, 497–511. [Google Scholar]
  8. Jones, J.W.; Hoogenboom, G.; Porter, C.H.; Boote, K.J.; Batchelor, W.D.; Hunt, L.A.; Wilkens, P.W.; Singh, U.; Gijsman, A.J.; Ritchie, J.T. The DSSAT cropping system model. Eur. J. Agron 2003, 18, 235–265. [Google Scholar]
  9. Launay, M.; Guerif, M. Assimilating remote sensing data into a crop model to improve predictive performance for spatial applications. Agric. Ecosyst. Environ 2005, 111, 321–339. [Google Scholar]
  10. Batchelor, W.D.; Basso, B.; Paz, J.O. Examples of strategies to analyze spatial and temporal yield variability using crop models. Eur. J. Agron 2002, 18, 141–158. [Google Scholar]
  11. Dente, L.; Satalino, G.; Mattia, F.; Rinaldi, M. Assimilation of leaf area index derived from ASAR and MERIS data into CERES-Wheat model to map wheat yield. Remote Sens. Environ 2008, 112, 1395–1407. [Google Scholar]
  12. Fang, H.; Liang, S.; Hoogenboom, G. Integration of MODIS LAI and vegetation index products with the CSM-CERES-Maize model for corn yield estimation. Int. J. Remote Sens 2011, 32, 1039–1065. [Google Scholar]
  13. De Wit, A.J.W.; van Diepen, C.A. Crop model data assimilation with the Ensemble Kalman filter for improving regional crop yield forecasts. Agric. For. Meteorol 2007, 146, 38–56. [Google Scholar]
  14. Wang, J.; Li, X.; Lu, L.; Fang, F. Estimating near future regional corn yields by integrating multi-source observations into a crop growth model. Eur. J. Agron 2013, 49, 126–140. [Google Scholar]
  15. Monsivais-Huertero, A.; Graham, W.D.; Judge, J.; Agrawal, D. Effect of simultaneous state-parameter estimation and forcing uncertainties on root-zone soil moisture for dynamic vegetation using EnKF. Adv. Water Resour 2010, 33, 468–484. [Google Scholar]
  16. Evensen, G. The Ensemble Kalman Filter: Theoretical formulation and practical implementation. Ocean Dynam 2003, 53, 343–367. [Google Scholar]
  17. Arulampalam, S.; Maskell, S.; Gordon, N.J.; Clapp, T. A tutorial on particle filters for online nonlinear/non-Gaussian Bayesian tracking. IEEE Trans. Signal Process 2002, 50, 174–188. [Google Scholar]
  18. Moore, A.M.; Arango, H.G.; Broquet, G.; Powell, B.S.; Weaver, A.T.; Zavala-Garay, J. The Regional Ocean Modeling System (ROMS) 4-dimensional variational data assimilation systems: Part I—System overview and formulation. Prog. Oceanogr 2011, 91, 34–49. [Google Scholar]
  19. Gauthier, P.; Tanguay, M.; Laroche, S.; Pellerin, S.; Morneau, J. Extension of 3DVAR to 4DVAR: Implementation of 4DVAR at the Meteorological Service of Canada. Mon. Wea. Rev 2007, 135, 2339–2354. [Google Scholar]
  20. Rosmond, T.; Xu, L. Development of NAVDAS-AR: Non-linear formulation and outer loop tests. Tellus A 2006, 58, 45–58. [Google Scholar]
  21. Rawlins, F.; Ballard, S.P.; Bovis, K.J.; Clayton, A.M.; Li, D.; Inverarity, G.W.; Lorenc, A.C.; Payne, T.J. The Met Office global four-dimensional variational data assimilation scheme. Q. J. R. Meteorol. Soc 2007, 133, 347–362. [Google Scholar]
  22. Honda, Y.; Nishijima, M.; Koizumi, K.; Ohta, Y.; Tamiya, K.; Kawabata, T.; Tsuyuki, T. A pre-operational variational data assimilation system for a non-hydrostatic model at the Japan Meteorological Agency: Formulation and preliminary results. Q. J. R. Meteorol. Soc 2005, 131, 3465–3475. [Google Scholar]
  23. Brassington, G.B.; Pugh, T.; Spillman, C.; Schulz, E.; Beggs, H. BLUElink > development of operational oceanography and servicing in Australia. J. Res. Pract. Inf. Technol 2007, 39, 151–164. [Google Scholar]
  24. Martin, M.J.; Hines, A.; Bell, M.J. Data assimilation in the FOAM operational short-range ocean forecasting system: A description of the scheme and its impact. Q. J. R. Meteorol. Soc 2007, 133, 981–995. [Google Scholar]
  25. Metzger, E.J.; Hurlburt, H.E.; Wallcraft, A.J.; Shriver, J.F.; Smedstad, L.F.; Smedstad, O.M.; Thoppil, P.; Franklin, D.S. Validation Test Report for the Global Ocean Prediction System V3.0—1/12 Degree HYCOM/NCODA: Phase I; Naval Research Laboratory, Stennis Space Center: Arlington, MS, USA, 2008. [Google Scholar]
  26. Usui, N.; Ishizaki, S.; Fujii, Y.; Tsujino, H.; Yasuda, T.; Kamachi, M. Meteorological Research Institute multivariate ocean variational estimation (MOVE) system: Some early results. Adv. Space Res 2006, 37, 806–822. [Google Scholar]
  27. Pinardi, N.; Allen, I.; Demirov, E.; de May, P.; Korres, G.; Lascaratos, A.; le Traon, P.Y.; Maillard, C.; Manzella, G.; Tziavos, C. The Mediterranean ocean forecasting system: First phase of implementation (1998–2001). Ann. Geophys 2003, 21, 3–20. [Google Scholar]
  28. Dombrowsky, E.; Bertino, L.; Brassington, G.; Chassignet, E.; Davidson, F.; Hurlburt, H.; Kamachi, M.; Lee, T.; Martin, M.; Mei, S.; et al. GODAE systems in operation. Oceanography 2008, 22, 80–95. [Google Scholar]
  29. Barbu, A.L.; Segers, A.J.; Schaap, M.; Heemink, A.W.; Builtjes, P.J.H. A multi-component data assimilation experiment directed to sulphur dioxide and sulphate over Europe. Atmos. Environ 2009, 43, 1622–1631. [Google Scholar]
  30. Jia, B.; Xie, Z.; Tian, X.; Shi, C. A soil moisture assimilation scheme based on the ensemble Kalman filter using microwave brightness temperature. Sci. China D Earth Sci 2009, 52, 1835–1848. [Google Scholar]
  31. Krysta, M.; Blayo, E.; Cosme, E.; Verron, J. A consistent hybrid variational-smoothing data assimilation method: application to a simple shallow-water model of the turbulent midlatitude ocean. Mon. Wea. Rev 2011, 139, 3333–3347. [Google Scholar]
  32. Nagarajan, K.; Judge, J.; Graham, W.D.; Monsivais-Huertero, A. Particle filter-based assimilation algorithms for improved estimation of root-zone soil moisture under dynamic vegetation conditions. Adv. Water Resour 2011, 34, 433–447. [Google Scholar]
  33. Qin, J.; Liang, S.; Yang, K.; Kaihotsu, I.; Liu, R.; Koike, T. Simultaneous estimation of both soil moisture and model parameters using particle filtering method through the assimilation of microwave signal. J. Geophys. Res 2009, 114. [Google Scholar] [CrossRef]
  34. Salamon, P.; Feyen, L. Assessing parameter, precipitation, and predictive uncertainty in a distributed hydrological model using sequential data assimilation with the particle filter. J. Hydrol 2009, 376, 428–442. [Google Scholar]
  35. Van der Kwast, J.; Canters, F.; Karssenberg, D.; Engelen, G.; van de Voorde, T.; Uljee, I.; de Jong, K. Remote sensing data assimilation in modeling urban dynamics: Objectives and methodology. Procedia Environ. Sci 2011, 7, 140–145. [Google Scholar]
  36. Moradkhani, H.; Hsu, K.; Gupta, H.; Sorooshian, S. Uncertainty assessment of hydrologic model states and parameters: Sequential data assimilation using the particle filter. Water Resour. Res 2005, 41. [Google Scholar] [CrossRef]
  37. Weerts, A.H.; el Serafy, G.Y.H. Particle filtering and ensemble Kalman filtering for state updating with hydrological conceptual rainfall-runoff models. Water Resour. Res 2006, 42, W9403. [Google Scholar]
  38. Tian, X.; Xie, Z.; Sun, Q. A POD-based ensemble four-dimensional variational assimilation method. Tellus A Dynam. Meteorol. Oceanogr 2011, 63, 805–816. [Google Scholar]
  39. Tian, X.; Xie, Z. Effects of sample density on the assimilation performance of an explicit four-dimensional variational data assimilation method. Sci. China D Earth Sci 2009, 52, 1849–1856. [Google Scholar]
  40. Savin, R.; Satorre, E.H.; Hall, A.J.; Slafer, G.A. Assessing strategies for wheat cropping in the monsoonal climate of the Pampas using the CERES-Wheat simulation model. Field Crop Res 1995, 42, 81–91. [Google Scholar]
  41. Dhungana, P.; Eskridge, K.M.; Weiss, A.; Baenziger, P.S. Designing crop technology for a future climate: An example using response surface methodology and the CERES-Wheat model. Agric. Syst 2006, 87, 63–79. [Google Scholar]
  42. Ding, D. Soil Species of Hebei Province (In Chinese); Hebei Science and Technology Press: Shijiazhuang, China, 1992. [Google Scholar]
  43. Al-Sadah, F.H.; Ragab, F.M. Study of global daily solar radiation and its relation to sunshine duration in Bahrain. Sol. Energy 1991, 47, 115–119. [Google Scholar]
  44. Hutchinson, M.F. ANUSPLIN Version 4.37 User Guide. Available online: http://fennerschool.anu.edu.au/files/anusplin437.pdf (accessed on 18 July 2007).
  45. Cao, Z.; Yang, J.; Qiao, M. Hebei Rural Statistic Yearbook (In Chinese); China Statistics Press: Beijing, China, 2010. [Google Scholar]
  46. Canty, M.J. Image Analysis, Classification, and Change Detection in Remote Sensing: With Algorithms for ENVI/IDL, 2nd ed; CRC Press: Boca Raton, FL, USA, 2009. [Google Scholar]
  47. Kuusk, A. A two-layer canopy reflectance model. J. Quant. Spectrosc. Radiat. Transf 2001, 71, 1–9. [Google Scholar]
  48. He, B.; Quan, X.; Xing, M. Retrieval of leaf area index in alpine wetlands using a two-layer canopy reflectance model. Int. J. Appl. Earth Obs. Geoinf 2013, 21, 78–91. [Google Scholar]
  49. Chen, J.; Jönsson, P.; Tamura, M.; Gu, Z.; Matsushita, B.; Eklundh, L. A simple method for reconstructing a high-quality NDVI time-series data set based on the Savitzky-Golay filter. Remote Sens. Environ 2004, 91, 332–344. [Google Scholar]
  50. Savitzky, A.; Golay, M.J.E. Smoothing and differentiation of data by simplified least squares procedures. Anal. Chem 1964, 36, 1627–1639. [Google Scholar]
  51. Dettori, M.; Cesaraccio, C.; Motroni, A.; Spano, D.; Duce, P. Using CERES-Wheat to simulate durum wheat production and phenology in Southern Sardinia, Italy. Field Crop Res 2011, 120, 179–188. [Google Scholar]
  52. Arora, V.K.; Singh, H.; Singh, B. Analyzing wheat productivity responses to climatic, irrigation and fertilizer-nitrogen regimes in a semi-arid sub-tropical environment using the CERES-Wheat model. Agric. Water Manag 2007, 94, 22–30. [Google Scholar]
  53. Singh, A.K.; Tripathy, R.; Chopra, U.K. Evaluation of CERES-Wheat and CropSyst models for water–nitrogen interactions in wheat crop. Agric. Water Manag 2008, 95, 776–786. [Google Scholar]
  54. Tian, X.; Xie, Z.; Dai, A. An ensemble-based explicit four-dimensional variational assimilation method. J. Geophys. Res 2008, 113. [Google Scholar] [CrossRef]
  55. Clark, M.P.; Rupp, D.E.; Woods, R.A.; Zheng, X.; Ibbitt, R.P.; Slater, A.G.; Schmidt, J.; Uddstrom, M.J. Hydrological data assimilation with the ensemble Kalman filter: Use of streamflow observations to update states in a distributed hydrological model. Adv. Water Resour 2008, 31, 1309–1324. [Google Scholar]
  56. Yao, Y.; Liu, Q.; Liu, Q.; Li, X. LAI retrieval and uncertainty evaluations for typical row-planted crops at different growth stages. Remote Sens. Environ 2008, 112, 94–106. [Google Scholar]
Figure 1. Flowchart of POD4DVar with the CERES-Wheat crop model.
Remotesensing 06 02664f1
Figure 2. (a) Simulated LAIs of winter wheat with no data assimilation and (b) with the POD4DVar data assimilation.
Remotesensing 06 02664f2
Figure 3. (a) Comparisons of winter wheat yield estimated by the CERES-Wheat model with no data assimilation, (b) the EnKF-based data assimilation, and (c) the POD4DVar-based data assimilation.
Remotesensing 06 02664f3
Figure 4. The 30 m by 30 m winter wheat yield map in Hengshui based on the assimilation of remotely sensed LAI maps into the CERES-Wheat crop model using the POD4DVar strategy.
Remotesensing 06 02664f4
Figure 5. Comparisons between the real and estimated yields on (a) pixel and (b) county scales.
Remotesensing 06 02664f5
Figure 6. Estimation of additional information in the CERES-Wheat model with POD4DVar-based data assimilation. (a) Above-ground biomass; (b) Harvest index; (c) Evapotranspiration; (d) Soil organic carbon.
Remotesensing 06 02664f6

