Article

Initial Stability Assessment of S-NPP VIIRS Reflective Solar Band Calibration Using Invariant Desert and Deep Convective Cloud Targets

1
Science Systems and Applications, Inc., 1 Enterprise Pkwy, Hampton, VA 23666, USA
2
NASA Langley Research Center, Hampton, VA 23666, USA
3
Sigma Space Corp., 4801 Forbes Blvd, Lanham, MD 20706, USA
4
NASA Goddard Space Flight Center (GSFC), Greenbelt, MD 20771, USA
*
Author to whom correspondence should be addressed.
Remote Sens. 2014, 6(4), 2809-2826; https://doi.org/10.3390/rs6042809
Submission received: 7 January 2014 / Revised: 12 March 2014 / Accepted: 18 March 2014 / Published: 27 March 2014

Abstract

:
The latest CERES FM-5 instrument launched onboard the S-NPP spacecraft will use the VIIRS visible radiances from the NASA Land Product Evaluation and Analysis Tool Elements (PEATE) product for retrieving the cloud properties associated with its TOA flux measurement. In order for CERES to provide climate quality TOA flux datasets, the retrieved cloud properties must be consistent throughout the record, which is dependent on the calibration stability of the VIIRS imager. This paper assesses the NASA calibration stability of the VIIRS reflective solar bands using the Libya-4 desert and deep convective clouds (DCC). The invariant targets are first evaluated for temporal natural variability. It is found for visible (VIS) bands that DCC targets have half of the variability of Libya-4. For the shortwave infrared (SWIR) bands, the desert has less variability. The brief VIIRS record and target variability inhibits high confidence in identifying any trends that are less than ±0.6%/yr for most VIS bands, and ±2.5%/yr for SWIR bands. None of the observed invariant target reflective solar band trends exceeded these trend thresholds. Initial assessment results show that the VIIRS data have been consistently calibrated and that the VIIRS instrument stability is similar to or better than the MODIS instrument.

Graphical Abstract

1. Introduction

The Clouds and the Earth’s Radiant Energy System (CERES) [1] provides the climate community with a continuous global top-of-atmosphere (TOA) shortwave and longwave flux observation record beginning in 2000 using CERES instruments mounted onboard the Terra, Aqua and Suomi National Polar-orbiting Partnership (S-NPP) spacecrafts. CERES relies on the accompanying onboard imager to provide the necessary cloud retrievals in order to accurately convert the observed CERES instrument footprint radiances into fluxes. The conversion uses Angular Directional Models (ADM), which are dependent on solar, viewing and azimuthal angles, surface type, and cloud properties [2,3]. The recorded CERES dataset must have consistent cloud properties as not to bias the radiance-to-flux conversion. Any drift in the imager calibration may cause spurious cloud retrievals. CERES does not incorporate the official NASA Goddard Space Flight Center (GSFC) imager cloud product properties [4], and thus applies its own retrieval algorithm, specifically designed to be stable throughout the record, and consistent in providing cloud properties for all identified cloud pixels [5]. This method ensures that the cloud properties do not introduce any artificial trends in the radiance-to-flux conversion.
The latest of the CERES instruments, Flight Model-5 (FM-5), was launched aboard the S-NPP spacecraft on 28 October 2011 from the Vandenberg Air Force Base, California [6]. Another key instrument onboard S-NPP is the Visible Infrared Imaging Radiometer Suite (VIIRS), which collects the Earth view data in 22 spectral bands with wavelengths ranging from 0.41 to 12 μm [7,8]. The cloud retrievals provided in the CERES FM5 NPP Single Scanner Footprint (SSF) Edition 1 product will be based on the simultaneous visible radiance measurements from VIIRS. In order for CERES to provide temporally consistent cloud property retrievals, the radiometric stability of the VIIRS visible sensors must be assessed and ensured. This study provides an independent assessment of the radiometric stability of the VIIRS reflective solar bands calibration using two pseudo-invariant Earth targets: Libya-4 desert in Saharan Africa and deep-convective cloud (DCC) pixels acquired over the Tropical Western Pacific (TWP) region.

2. Sensor Overview and Dataset Selection

VIIRS is nominally operated in a sun-synchronous orbit at 13:30 local equatorial crossing time. It is a scanning radiometer with a large swath width of 3040 km. The ground sampling distance at nadir is 375 m for high-resolution imagery bands (I-bands) and 750 m for moderate resolution bands (M-bands). Because of the better radiometric stability and accuracy, the M-bands are recommended for quantitative studies, while the I-bands are useful for producing higher resolution images [8]. Out of the 22 spectral bands in VIIRS, 14 lie in the visible (VIS), near infrared (NIR), and shortwave infrared (SWIR) regions, and are referred to as the reflective solar bands (RSB). Seven VIIRS bands are in the mid-wave infrared (MWIR) and long-wave infrared (LWIR) regions and, therefore, referred to as the thermal emissive bands (TEB). The VIIRS sensor also carries a panchromatic day-night band (DNB). The VIIRS RSB are calibrated on-orbit using a solar diffuser (SD) and a solar diffuser stability monitor (SDSM) [7,8]. The SD calibration data are collected every orbit. The SDSM, currently operated on a daily basis, uses simultaneous observations of the sun through an attenuator and the diffuser to track SD on-orbit degradation. The calibration coefficients derived from the SD and SDSM observations are used to update the VIIRS calibration lookup tables (LUTs), throughout the mission. The VIIRS calibration LUTs are currently updated on monthly basis.
The CERES project does not use the VIIRS level 1B radiance sensor data record (SDR) product available at the NOAA Comprehensive Large Array-data Stewardship System (CLASS) for cloud retrievals, but rather uses an especially reformatted subset of the NPP VIIRS AS3100 dataset [9] generated by the NASA Land Product Evaluation and Analysis Tool Elements (PEATE). The Land PEATE uses mission-long, consistently reprocessed calibration LUTs provided by the NASA VIIRS Characterization Support Team (VCST). This effort enables an independent evaluation of the VIIRS SDR quality and supports the science discipline teams in their Environmental Data Records (EDRs) assessment and validation effort. The NASA Land PEATE AS3100 subsetted data for the CERES project are archived at the Atmospheric Science Data Center Distributed Active Archive Center (ASDC DAAC), and contain radiance data for 8 VIIRS RSB. This paper focuses on the stability assessment of these bands only. The characteristics of these bands are listed in Table 1. In this study the NIR band is classified with the VIS bands for convenience. Bands with wavelengths less than 1 μm are referred to as VIS bands, and those greater than 1 μm as SWIR bands.

3. Methodology

Pseudo-invariant Earth targets have been used extensively to monitor the post-launch radiometric stability of satellite sensors for over two decades [1020]. These targets primarily include subtropical deserts, polar ice sheets, and deep convective clouds. The premise of this method is that the TOA reflectance measured over desert and polar-ice scenes, or as in the case of DCC, the mode and mean statistics of combined DCC pixel response, are effectively constant over time. Any temporal changes observed in the sensor response are then considered as instrument degradation. Hereafter, pseudo-invariant Earth targets will simply be called invariant targets, with the understanding that for the purpose of vicarious calibration of satellite sensors, these scenes are considered to be radiometrically and temporally stable.

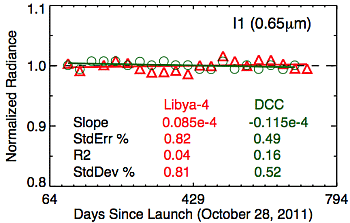
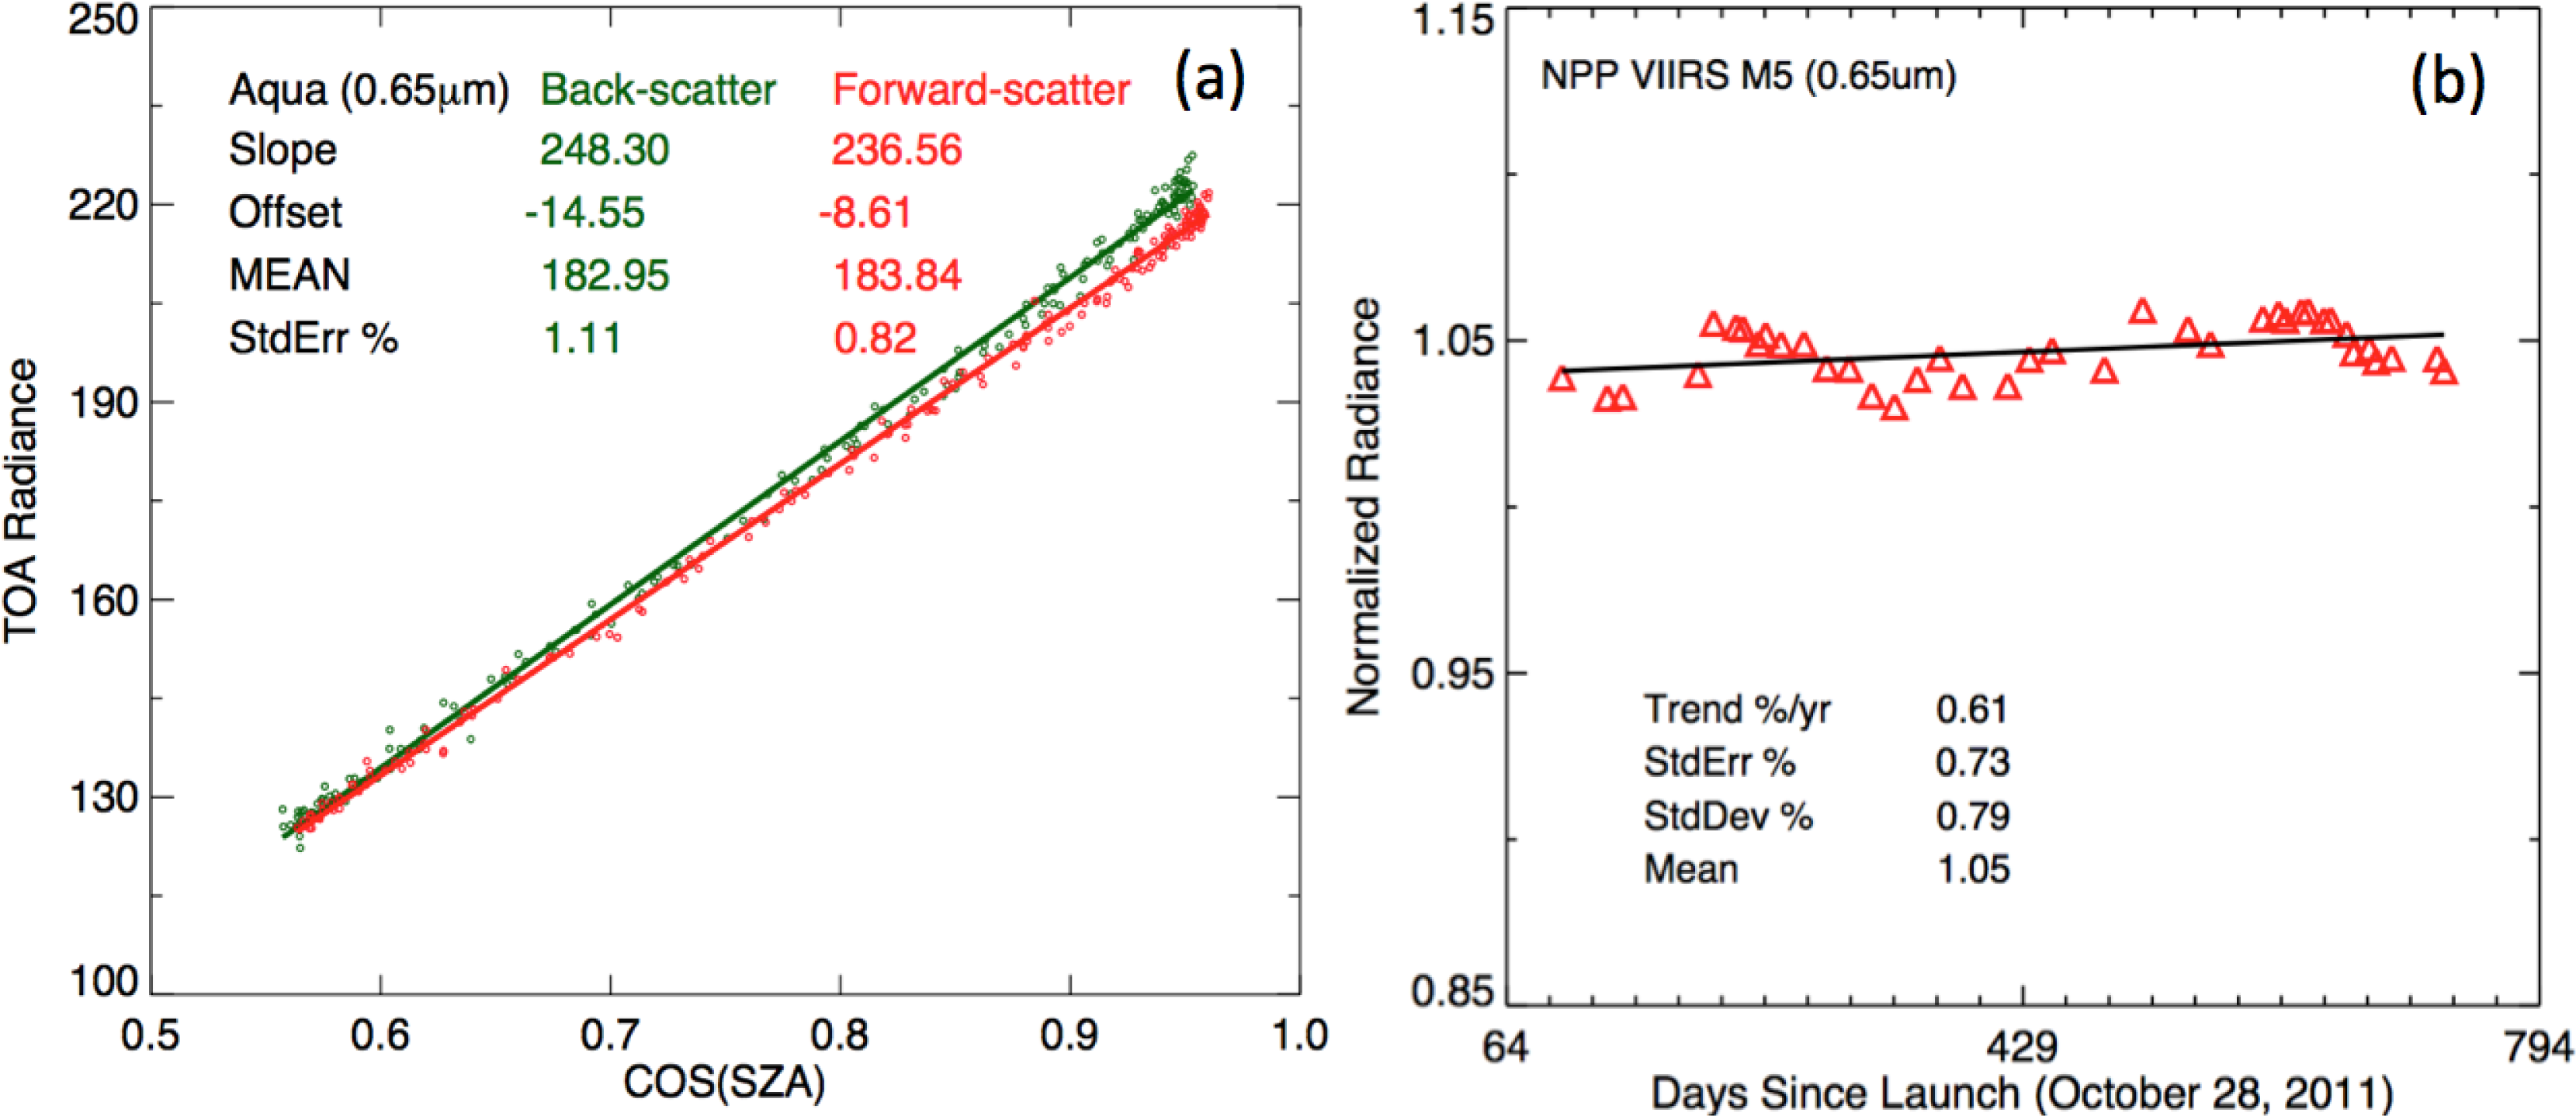
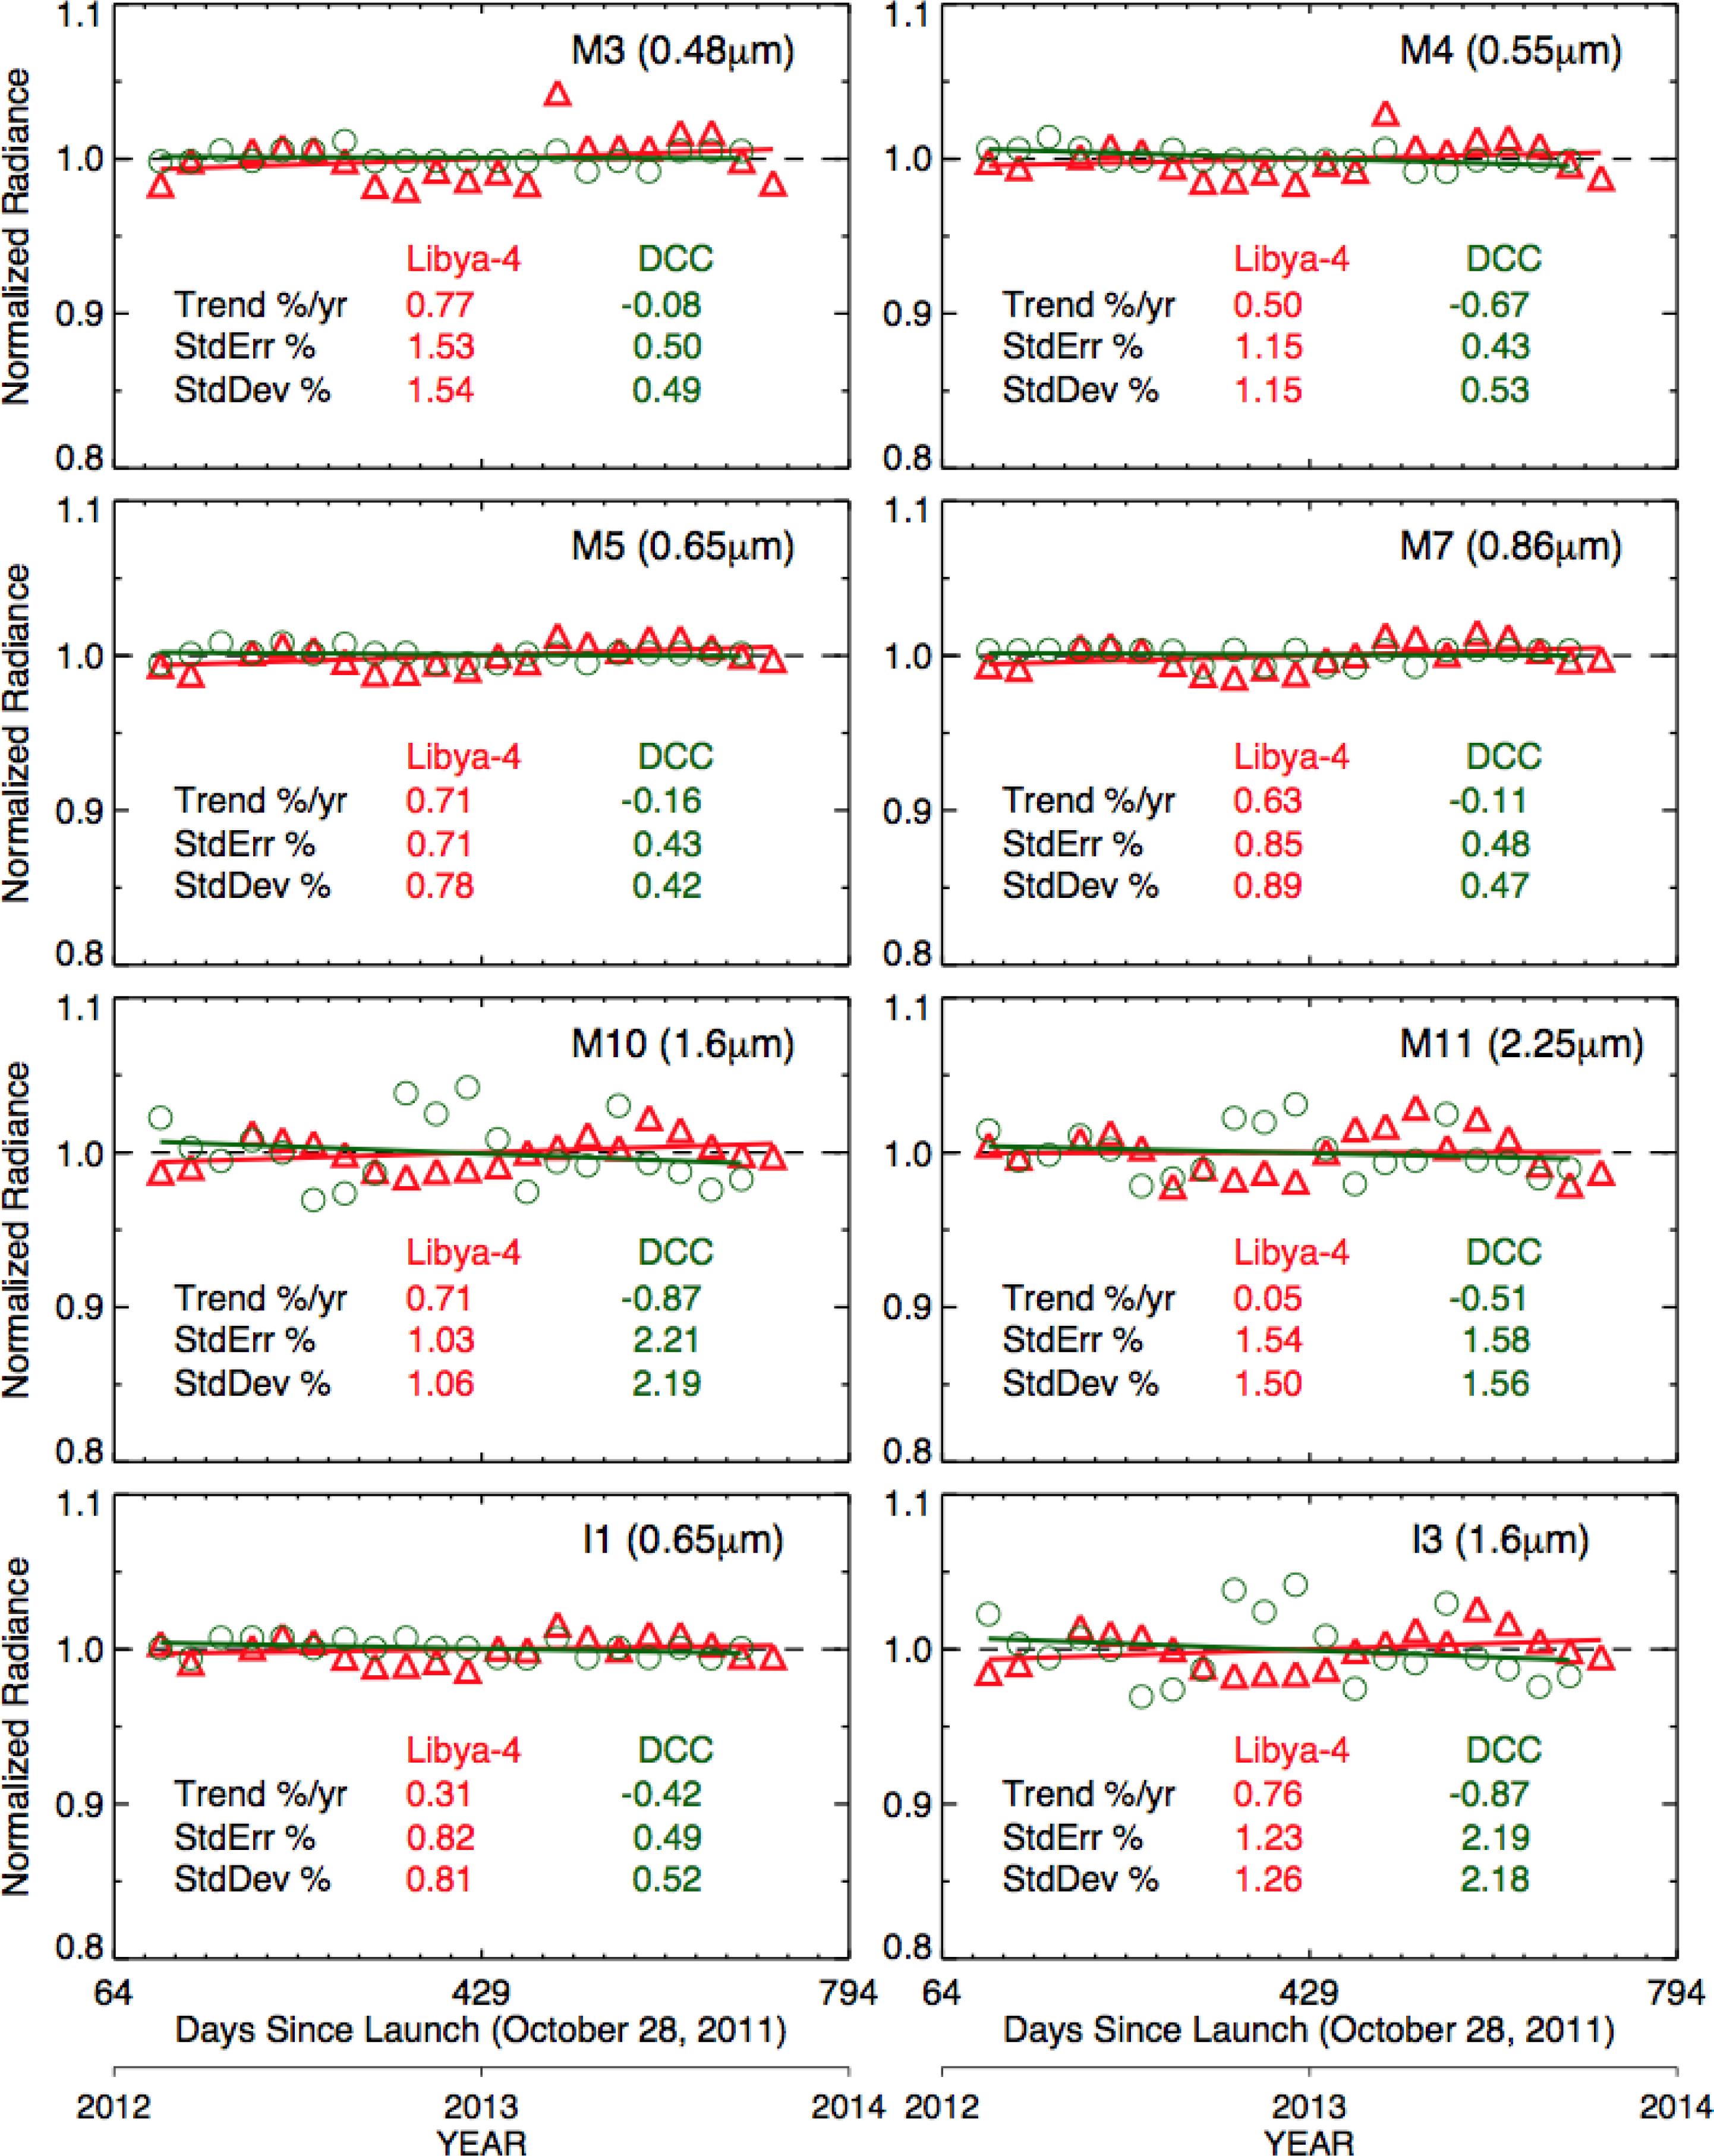
3.1. Desert Approach
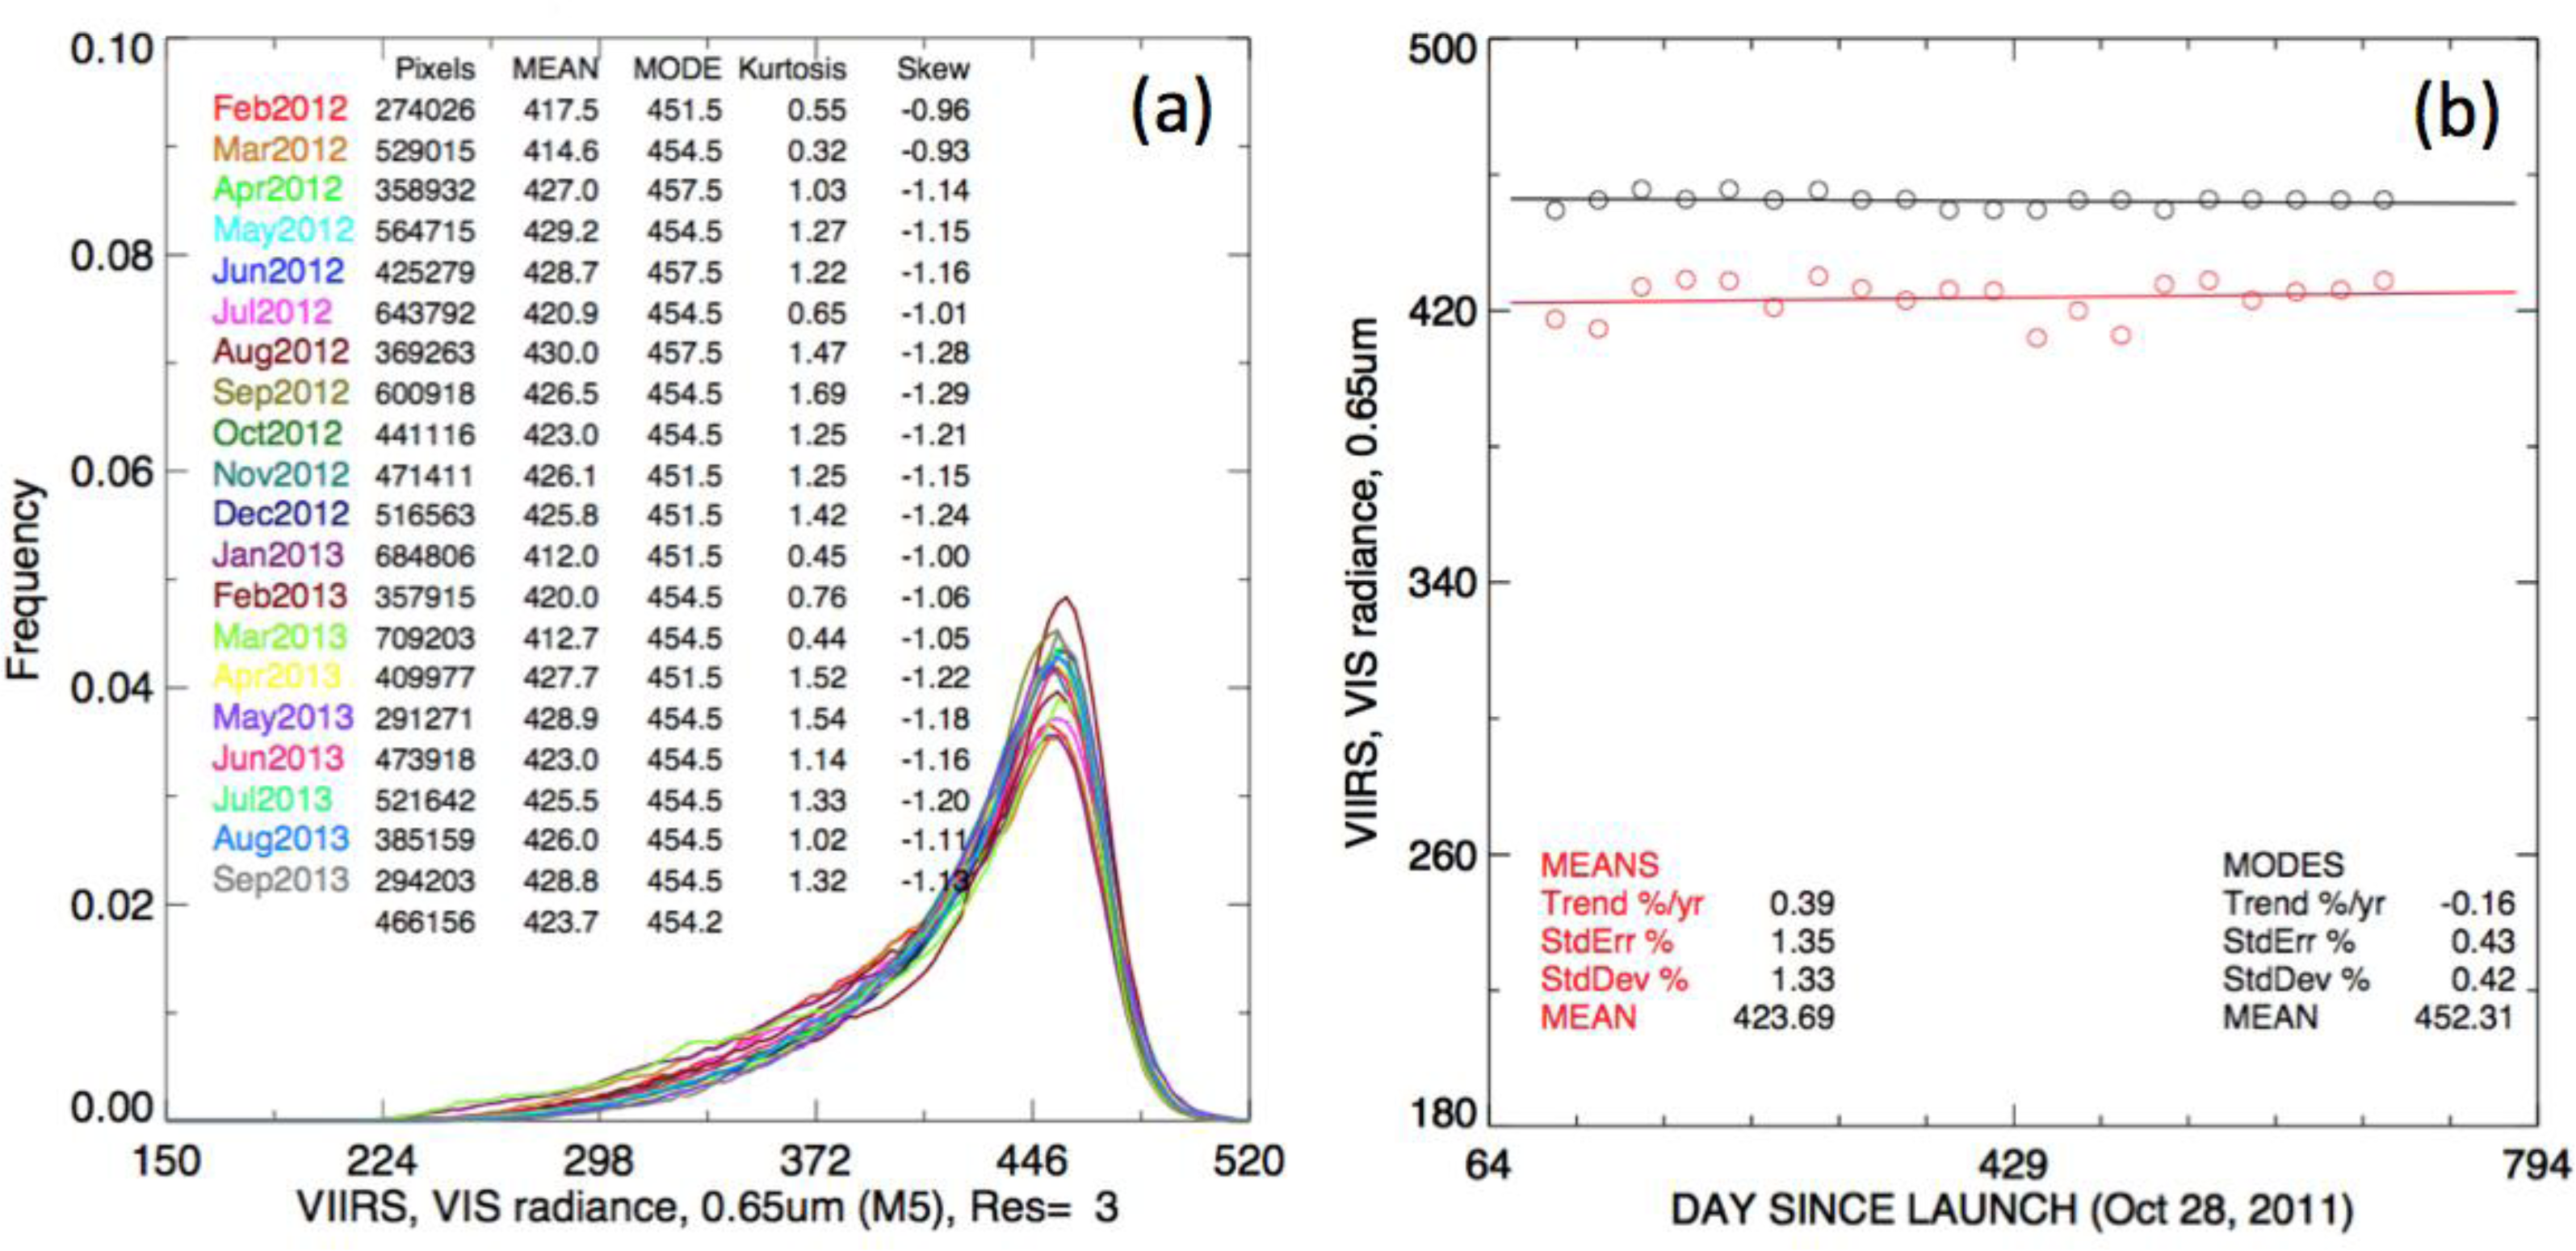
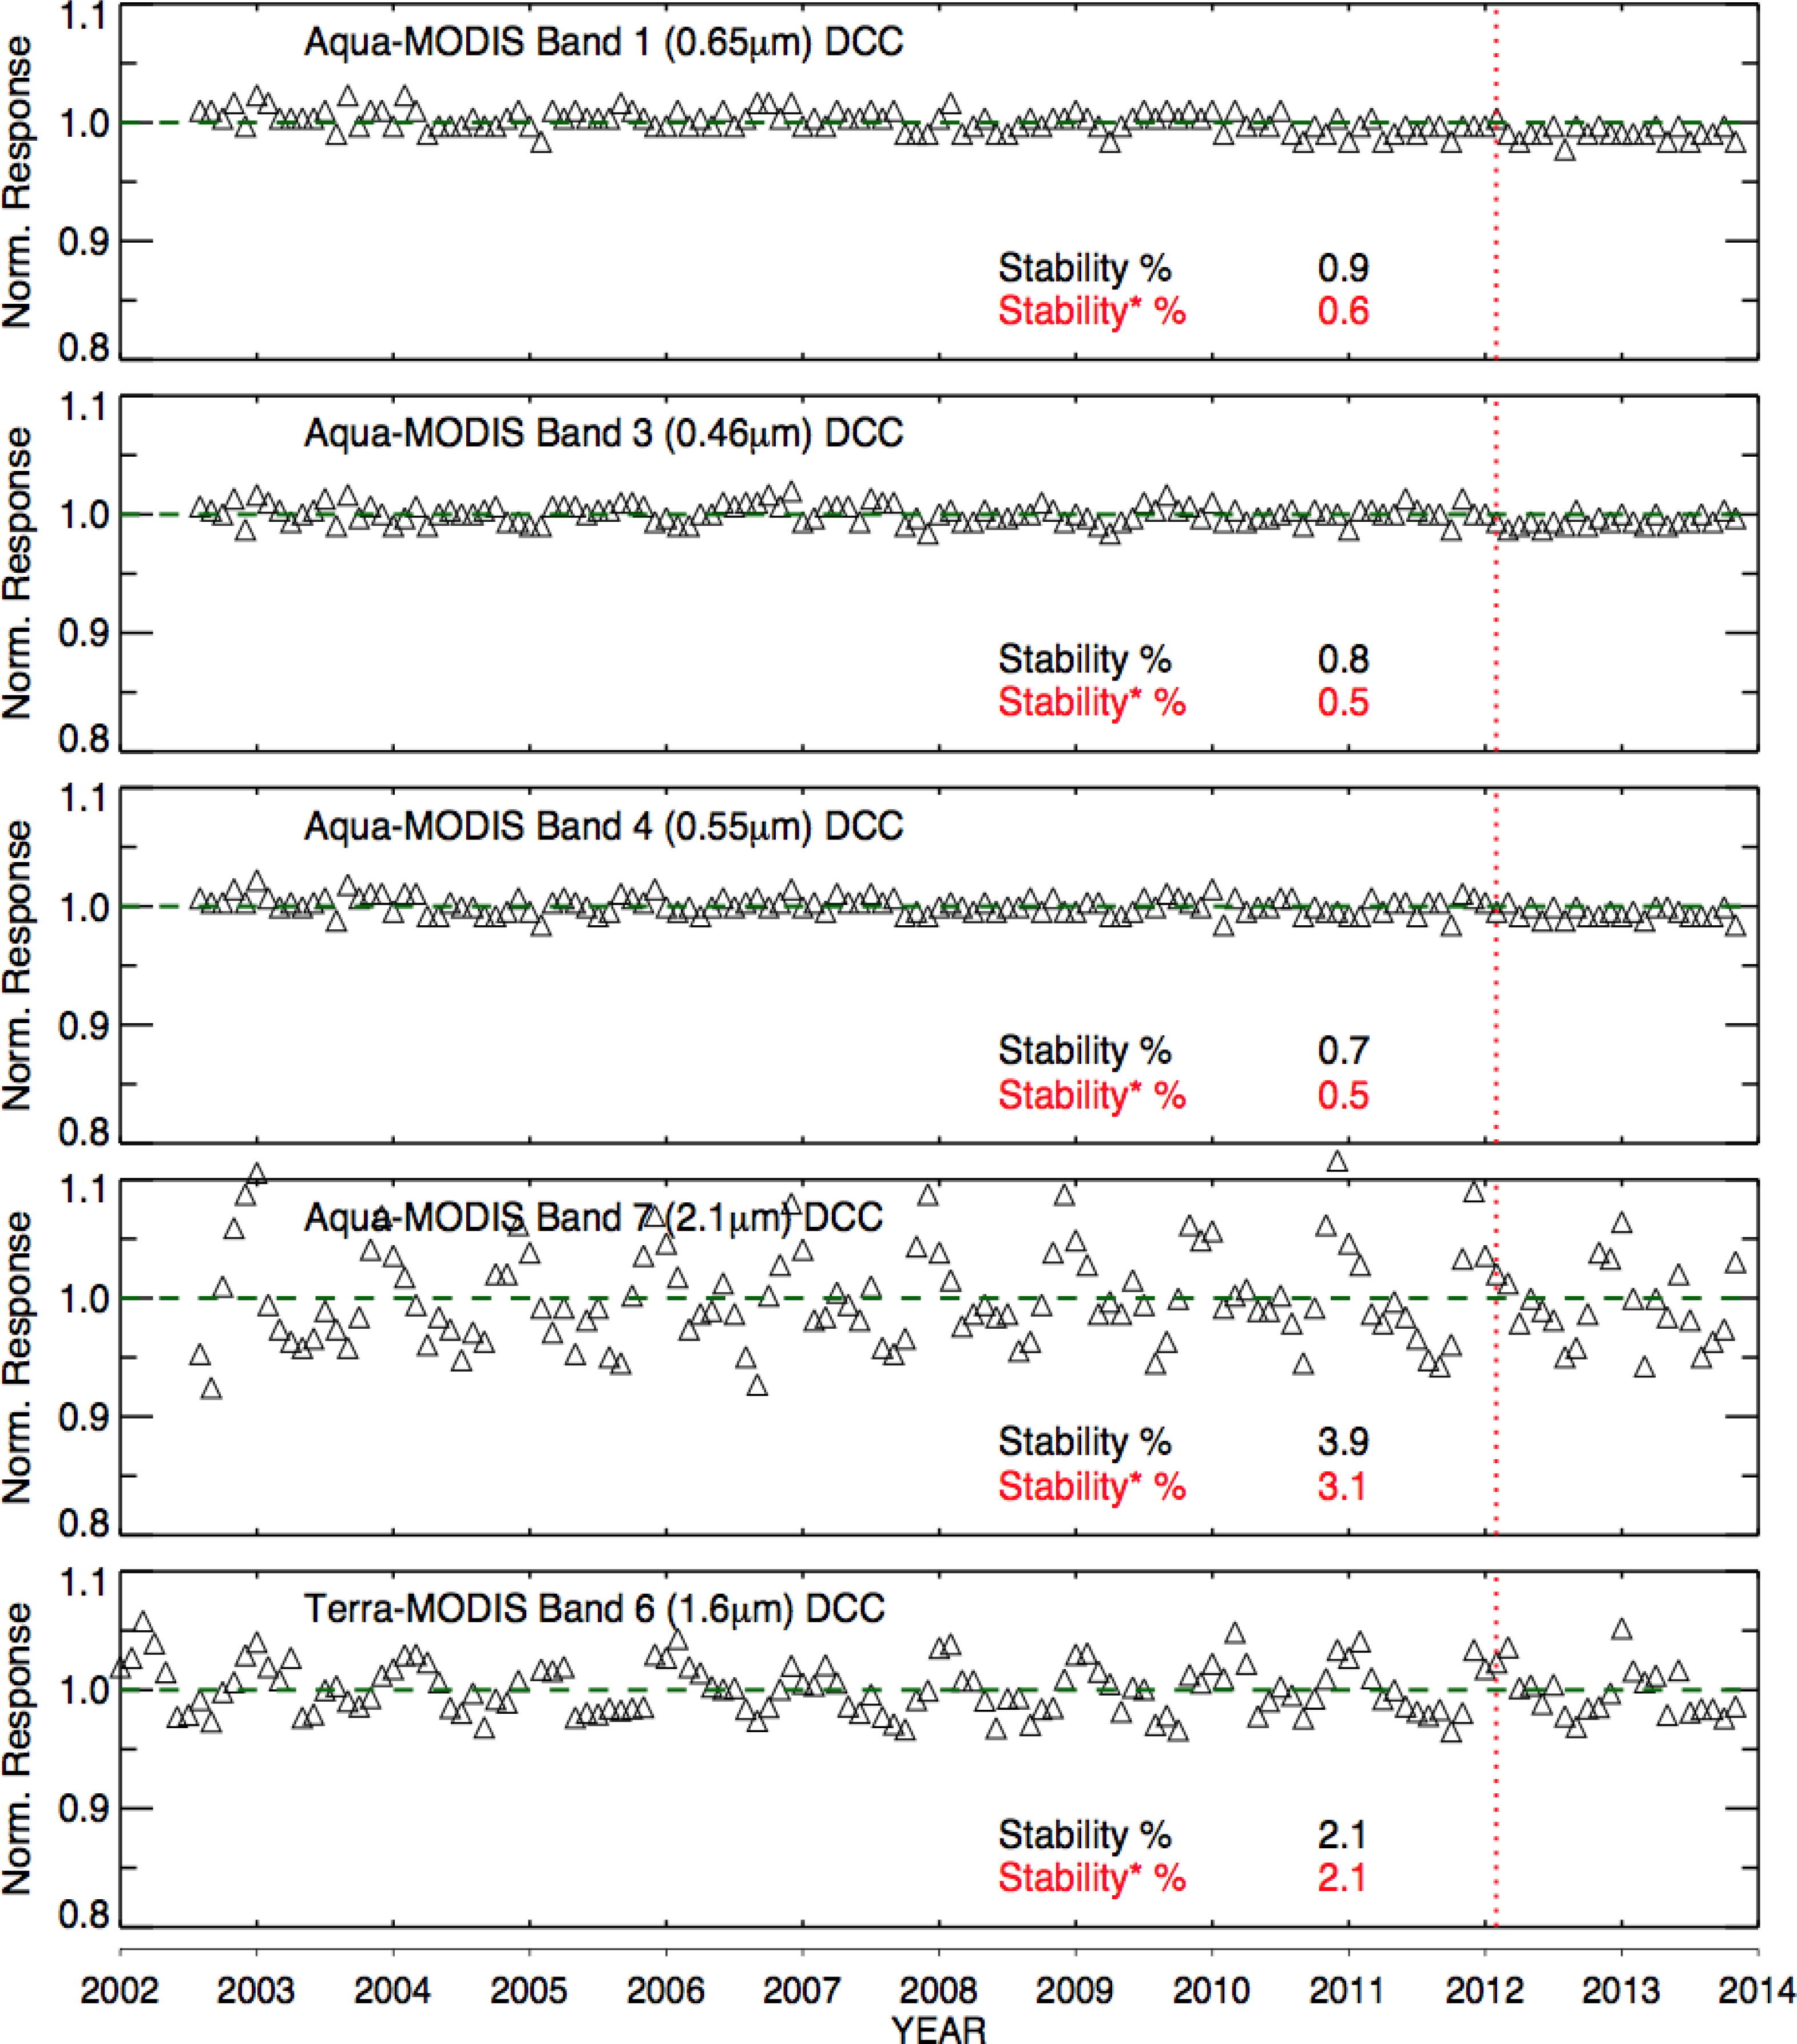
Several past researchers have reported on the qualification of invariant desert sites for calibration [13,2123]. Based on these criteria, the most invariant desert targets are found in the Saharan and Arabian Desert regions. The Libya-4 desert (28.6°N latitude and 23.4°E longitude) located in the Saharan Desert is the most well-known of the six reference standard test sites recommended by the Committee on Earth Observation Satellites (CEOS) Infrared and Visible Optical Sensors (IVOS) subgroup for monitoring the post-launch degradation of the space-borne optical sensors [24]. Owing to its high surface reflectance, high spatial homogeneity, excellent radiometric stability (less than 2% in VIS and NIR [21]), low aerosol loading, and minimal cloud cover, Libya-4 is considered to be one of the best invariant targets on Earth for post-launch satellite calibration and validation purpose [20,21,24]. Libya-4 has been used for monitoring the temporal stability of many satellite sensors including Landsat Multispectral Scanner (MSS) [19], Thematic Mapper (TM) [16], and Enhanced Thematic Mapper plus (ETM+) [17], AVHRR [12], and Aqua and Terra MODIS [17,18]. This study also uses Libya-4 as a radiometrically invariant target to assess the calibration stability of the 8 VIIRS RSB listed in Table 1.
The observed pristine clear-sky TOA reflectance over an invariant desert site is dependent on the anisotropic surface, the gaseous absorption of water vapor, ozone, and other trace gases, as well as aerosol effects. The measured reflectance will also contain the natural variability of the desert surface reflectance and any calibration artifacts of the observing instrument. Since anisotropic effects are spectrally dependent, it is preferable to construct a sensor specific empirically derived bidirectional reflectance distribution function (BRDF) model [18,20]. Generally, the BRDF is constructed using the first few years of data, when the instrument is most understood, and all known calibration anomalies have been removed. The current VIIRS data record is too short to derive a robust BRDF model.
For this study, MODIS bands, that are similar to VIIRS bands in Table 1, are used to generate the band-specific BRDF models. The MODIS Collection 6 (C6) radiances offer significant improvements over Collection 5 (C5) in terms of radiometric stability and accuracy [2527]. At the time of this study only the Aqua-MODIS level 1B C5 files were available and the C5 radiances were converted to C6 using calibration coefficients provided by the MODIS calibration support team (MCST). Figure 1 displays the spectral response functions (SRF) of the MODIS and VIIRS band-specific pairings. The 0.55 μm, 0.65 μm (with I1), and 0.86 μm MODIS and VIIRS bands are very similar, whereas the 0.48 μm, 0.65 μm (with M5), 2.2 μm bands have little overlap. Aqua is the preferred MODIS instrument because both Aqua and NPP are in the same 13:30 sun-synchronous orbit, thereby avoiding any diurnal BRDF effects. More than half of the Aqua-MODIS band 6 (1.6 μm) detectors, however, are inoperable [28]. For the VIIRS M10 and I3 bands, the BRDF is, therefore, derived using the Terra-MODIS band 6 data.
A 0.5° × 0.5° latitude by longitude area centered at 28.6°N latitude and 23.4° E longitude defines the Libya-4 region-of-interest (ROI) used in this study. To ensure that only pristine clear-sky reflectances are used to assess the stability, a spatial pixel-level homogeneity threshold, as described in [20], is used. The standard deviation of the pixel-level reflectances for pristine clear-sky observations are consistent and the lowest of the all observations. This threshold is effective in removing thin clouds and aerosol events caused by windy conditions. Only near-nadir viewing zenith angle (VZA) conditions (VZA < 10°) are considered to minimize the BRDF effects.
Bhatt et al. [29] found that under near-nadir viewing condition, the MODIS visible radiances over Libya-4 were stratified by scattering direction or relative azimuth angle (RAA), and can be simply modeled with two linear functions of cosine of solar zenith angle (SZA). We used the angular convention of CERES ADM [2] that defines the RAA as the azimuth angle position of the satellite relative to the solar plane. Using this convention, all measurements with RAA < 90° are considered backward scattering, whereas measurements with RAA > 90° are considered forward scattering. Figure 2a shows the Aqua-MODIS Band 1 (0.65 μm) TOA radiances plotted as a function of cosine of SZA and scattering direction. It clearly shows that the observed TOA radiances are slightly brighter in the backward scattering than in the forward scattering direction. The modeled radiances have been normalized to an Earth-Sun distance of 1 AU. The MODIS-based forward and backward regression models are used to compute the predicted VIIRS TOA radiance for a given SZA and scattering direction. The ratio of the observed and predicted VIIRS radiances should be mostly free from angular dependencies. This ratio can thus be trended over time to monitor the stability of the VIIRS sensor.
Figure 2b shows the temporal trend of the VIIRS M5 channel ratio, which exhibits a bias of 5% (Aqua-MODIS is darker). A constant bias is observed in the ratio, which is primarily caused by the spectral differences between the VIIRS M5 and MODIS Band 1 as shown in Figure 1. The incoming spectral irradiance difference alone is 4.6%. Other factors such as the Libya-4 surface reflectance, gaseous absorption difference, and the absolute calibration of the two sensors will also impact the ratio. Bhatt et al. [29] shows that after accounting for the spectral differences using the SCanning Imaging Absorption SpectroMeter for Atmospheric CHartographY (SCIAMACHY) hyper-spectral radiances observed over Libya-4, the VIIRS M5 to MODIS Band 1 radiance ratio is nearly 1.0, which suggests that the absolute radiometric calibration of MODIS and VIIRS are consistent. The full investigation of the absolute radiance difference between other VIIRS and similar MODIS bands, mainly due to spectral disparity, is beyond the scope of this study. For bands where the MODIS and VIIRS spectral differences are much larger, the band dependent atmospheric absorption effects and BRDF differences may increase the temporal noise and possibly impact the trend analysis, which is not investigated in this study. The authors, however, believe that because the maintained sun-synchronous satellite orbital ground tracks of VIIRS repeat annually, any uncorrected bidirectional effects will also be replicated annually, and will not artificially alter the VIIRS stability analysis. A trend of the VIIRS ratios is then established and normalized to 1.0 at the midpoint of the VIIRS record.

3.2. DCC Approach

Deep convective clouds are invariant targets located over the tropical tropopause layer (TTL) and are the brightest of all terrestrial invariant targets [15,30,31]. They have a high signal-to-noise ratio over visible wavelengths, exhibit nearly flat visible reflection spectra, and minimally impacted by water vapor and aerosols in TOA measurements [30,31]. Since DCC are the coldest targets at the tropics, they can be easily identified using a simple IR temperature threshold. Another noteworthy feature of DCC as invariant target is that they are viewed by (and thus applicable to) all satellite sensors. The first attempt of using the DCC pixel-level radiances for calibration purpose was made by Hu et al. [14] to examine the radiometric stability of the CERES shortwave measurements on board the Tropical Rainfall Measuring Mission (TRMM), as well as of the Visible and Infrared Scanner (VIRS) and MODIS imagers on TRMM and Terra satellites, respectively. A similar approach was followed by Doelling et al. [15] to monitor the calibration drift of the Advanced Very High Resolution Radiometer (AVHRR) sensors on board the NOAA-16 and NOAA-17 satellites. Later, Doelling et al. [3032] made significant contributions towards refining the technique by analyzing the natural variability of the DCC response geographically, temporally, seasonally, and for differences of convection initiated over land and ocean, using 10-years of Aqua-MODIS data. The spectral characteristics of DCC were also examined using SCIAMACHY-measured hyper-spectral radiances and were reported to be flat in the VIS and NIR region [31].
In this study, the VIIRS DCC pixels are acquired over a fixed Tropical West Pacific (TWP) domain extending from 120°E to 160°E longitude, and 20°N to 20°S latitude, which has the highest frequency of DCC events. DCC radiance pixels within the TWP DCC domain are identified using an 11 μm brightness temperature (BT) less than 205.0° K threshold. To take advantage of the most isotropic part of the DCC reflectivity the identified DCC pixels are then filtered by SZA < 40°, VZA < 40°, 10° < RAA< 170° [31]. To remove optically thin clouds, the following spatial standard deviation filters are used; σBT < 1.0° K, and σVIS < 3%, where σBT and σVIS are the standard deviations of the surrounding 3 × 3 pixel block in IR (11 μm) and VIS (0.65 μm) channels, respectively. The filtered DCC radiance pixels are anisotropically corrected using the angular distribution model (ADM) from Hu et al. [14], which normalizes all DCC response to a common set of angular conditions. The normalized DCC pixel radiances are then compiled into monthly probability distribution functions (PDFs).
Figure 3a shows the monthly PDFs of the normalized DCC radiances from the VIIRS M5 channel. The peaks of the PDFs are consistent as expected from a stable instrument. Over 200,000 DCC pixels were identified every month using this technique. The statistical mean and mode are computed for each monthly PDF, and are tracked over time to monitor the stability of the instrument. Figure 3b shows the linear regression of the monthly PDF modes and means to derive the stability of the VIIRS M5 channel, which is found to be 0.39%/yr using the mean and −0.16%/yr using the mode. It is noted that the mode statistic exhibits a third of the month-to-month variability than that of the mean statistic for this band. For VIS bands, the mode statistic is used for stability analysis. For SWIR bands, the mean statistic is used, since it provides more consistent monthly TOA radiances than the mode statistic [31].

4. Target Temporal Variability

The monthly averaged observed desert ratios and monthly DCC anisotropic normalized radiances are further normalized to 1 at the midpoint of the VIIRS record and simple temporal linear regressions are applied to them. The results are shown in Figure 4 along with associated statistics for quantitative analysis. The DCC natural variability is half of the desert natural variability for most VIS bands. For the 1.6 μm bands, the desert response is more stable, and for the M11 and B7 bands, the desert and DCC response stability is comparable. The seasonal variations in the desert TOA observations are evident. At first glance, no trends exceeded 1%/yr and there were no band outlier trends. The desert-based trends were positive whereas the DCC derived trends were negative. The VIIRS calibration drift is smaller, given that the drift is embedded in the invariant target natural variability. For deserts, the natural variability is the combination of seasonal atmospheric absorption and aerosol effects [20], and any short-term (e.g., owing to rain events) surface reflectivity changes [33]. For DCC, the natural variability is manifested in the temporal and spatial coverage fluctuations during the annual migration of DCC with the sun [31]. This is especially true for the SWIR bands, where the signal to noise ratio is much smaller than for the VIS bands, and the reflectance is dependent on the cloud microphysics, which changes during the DCC convective cycle. However, the NPP sun-synchronous orbit guarantees consistent local time sampling of the DCC convective cycle.
Because the VIIRS data record may be short for reliable trend analysis, the stability assessment is performed by comparing the target variability against MODIS observations. If the temporal standard deviation of the VIIRS observations exceeds those of the MODIS observations for similar bands during the VIIRS record, then the increased observational noise can be attributed to the VIIRS instrument characteristics, such as calibration and spectral band differences. Then it follows that if the standard deviations of the VIIRS and MODIS observations are consistent during the VIIRS record, then both instruments have similar calibration stability. It may also be the case that the invariant target variability greatly exceeds the calibration uncertainty of both sensors. In this case, the observed variability in the VIIRS channel response is merely due to the stability limits of the targets used. In order to detect any short-term invariant target TOA radiance anomalies, the MODIS observations during the VIIRS time period can be compared to the full MODIS record. Not accounting for short-term invariant target brightening or darkening events may be interpreted as calibration issues.
The same desert and DCC methodologies described in this paper are performed on the MODIS Collection 6 radiances for stability analysis and the results are summarized in Table 2. Table 2 displays the temporal standard deviation of Aqua-MODIS invariant target radiances over the full record (July 2002 to October 2013) and the VIIRS time frame (February 2013 to October 2013), and the corresponding NPP VIIRS radiance stability. The Terra-MODIS record (January 2002 to October 2013) is used to compare the 1.6 μm bands, due to inoperable detector issue with the corresponding Aqua-MODIS band [28]. All VIIRS and corresponding MODIS band standard deviations during the VIIRS time frame are within 0.2%, except for the M11 SWIR band, where the VIIRS standard deviation is 1.6% for both desert and DCC invariant targets. This is a reduction of 0.5% and 1.5% for deserts and DCC, respectively, for the M11 band, and may simply be due to the non-overlapping spectral bands. The VIIRS M5 and I1 (0.65 μm) bands show a consistent decrease for both desert and DCC targets between 0.1% and 0.2% over Aqua-MODIS band 1. In fact the lowest standard deviation recorded is the VIIRS M5 band using DCC at 0.4%. The VIIRS I3 and M10 (1.6 μm) band shows an increase of 0.4% and 0.2% over Terra-MODIS over desert. This result is not confirmed by DCC, because the DCC SWIR band natural variability is much higher. To conclude, the VIIRS response over Libya-4 and DCC in bands M3 (0.48 μm), M4 (0.55 μm), and M7 (0.86 μm) is stable on order of corresponding MODIS band, whereas the M5 (0.65 μm), I1 (0.65 μm), and M11 (2.25 μm) band responses are more stable than MODIS, and the I3 and M10 (1.61 μm) band responses are less stable than MODIS. The measured disparities between the VIIRS and MODIS temporal standard deviations are probably due to differences in the instrument characteristics, such as SRF, that affect measured radiances over these targets.
Figures 5 and 6 show the desert and DCC, respectively, TOA normalized radiances over the entire MODIS record. The VIIRS time period is to the right of the red vertical dotted line. The standard deviations of the entire MODIS and VIIRS time period are posted in both Figures 5 and 6 as well as in Table 2. Any short-term fluctuations over the invariant targets during the VIIRS time period can be identified by visual examination. The MODIS desert standard deviations were greater by 0.1% to 0.2% during the VIIRS time period than during the entire MODIS record for all VIS and SWIR bands, except for the M7 (0.86 μm) band, which was similar. This is easily identifiable in Figure 5, where the MODIS response slightly went down in most bands during 2011–2012, and recovered in early 2013. This could be the cause for the positive observed VIIRS trends over Libya-4.
On the contrary, the measured MODIS DCC standard deviations in VIS bands were smaller by 0.2% to 0.3% during the VIIRS time period, and are comparable to the corresponding VIIRS bands DCC standard deviations. The exception is the MODIS Band 7, where the DCC response was found to be less stable (3.1%) than the VIIRS M11 band (1.6%), and may be owed to the different spectral characteristics of these two bands. In addition, the detector striping in VIIRS-TEB is significantly better than the corresponding MODIS bands [8]. Improved RSB and TEB pixel co-registration and reduced noise improves the results of the DCC methodology.
The DCC natural variability is half of the desert natural variability for most VIIRS VIS bands, for the 1.6 μm bands, the desert is more stable, and for the M11 band the stability is comparable. This is because the DCC spectrum is flat and has a nearly Lambertian reflectance over the VIS wavelengths, whereas the desert is impacted by seasonal impact of water vapor and aerosol variations. For the SWIR bands, the desert is more robust, because the DCC pixels are less reflective in this spectral domain and are dependent on the cloud microphysical properties, such as particle size, which undergo changes during the convection cycle.

5. Trend Significance

If the invariant target observations represented only the VIIRS calibration drifts in Figure 4, then simple statistical trend significance tests can be performed. However, in this case the calibration trend is only significant if it exceeds the natural variability of the invariant target. The VIIRS linear regressions are evaluated using the statistical approach of trend detection as described by Weatherhead et al. [34,35]. This approach relates the minimum number of years of data required to confidently detect a given specified trend within the magnitude of the natural variability of a time-series of data. Or it can also be used to determine the minimum trend that can be detected with confidence based on the record length.
According to Weatherhead et al. [35], the following equation can be used to compute the required number of years (N) to detect a trend of magnitude ω0 at the 95% confidence level and with a 50% probability,
N = ( 2 σ N | ω 0 | 1 + 1 ) 2 / 3
where, σN and Φ are the month-to-month variability and 1-month lag autocorrelation in the data time-series, respectively. If the observations are auto-correlated or not independent from each other, then trend detection will take longer. In this study, the equation is slightly modified to use N as an input and solve for ω0, which now gives the minimum detectable trend for a given data time-series. It should be noted that the units of σN and ω0 are the same in this equation. σN is expressed in percentage by dividing it by the mean value. Similarly, N is computed in terms of years by dividing the total number of months by 12.
Table 3 displays the band-specific observed band trend shown in Figure 4 and the associated minimum detectable trend (ω0), based on Equation (1), which can be confidently detected given the natural variability of the data time series. All trends have been expressed in %/yr to facilitate the comparison of the two trends. The comparison shows that all of the observed trends are within the corresponding minimum detectable trend amounts, thus indicating that the observed trends do not rise above the natural variability. It can also be stated that the VIIRS calibration drift does not exceed minimum detectable trend. The VIIRS VIS band calibration drift is within 0.54%/yr, except for the M4 band (0.55 μm) based on the DCC invariant target. The VIIRS band calibration drift is contained within 2.5%/yr.
Generally, the magnitude of the natural variability can be estimated by the standard deviation of the monthly TOA observations. In addition, the standard deviation is constant in time (Figures 5 and 6) after the record reaches a few years. In this case, the VIIRS record contains a short-term desert fluctuation, and the early MODIS DCC record contains noisy pixel-level radiances. If one assumes that the future Libya-4 VIIRS lifetime record will resemble the MODIS full record, and that the future DCC VIIRS lifetime record will resemble the current VIIRS time frame, one can compute the number of years required to detect a trend with a magnitude equal to the temporal standard deviation per decade. Because the natural variability or monthly standard deviation is band-dependent, the number of years needed to detect a trend based on the overall standard deviation should be similar among bands.
Table 4 displays the number of years required to significantly detect a trend with a magnitude equal to the standard deviation per decade. For Libya-4, the number of years required is ~11 years, and for DCC ~9 years. If the DCC VIS band trends are doubled the number of years is reduced to ~5 years (not shown). This supports that any VIIRS calibration drifts greater than 1%/decade can be detected in ~5 years using DCC targets and in ~11 years using Libya-4.

6. Concluding Remarks

This study has provided an initial assessment of the radiometric calibration stability of the S-NPP VIIRS RSB of the NASA Land PEATE AS3100 product archived at ASDC using the Libya-4 desert and the DCC pixels located over the TWP region as two independent radiometrically stable targets. This VIIRS product has removed all known calibration anomalies, such as the sensor degradation of the UV bands and the bands impacted by tungsten contamination [8]. The stability of the VIIRS multispectral imager is important for the CERES project to derive temporally consistent and reliable cloud retrievals. The VIIRS stability analysis was limited by the natural variability of the invariant targets and the brief VIIRS observational record. For VIS bands, the DCC target has half of the temporal variability compared to Libya-4, whereas for the SWIR bands, Libya-4 has less temporal variability. The desert TOA BRDF normalized radiance reveals a seasonal dependency due to the water vapor and aerosol fluctuations. The low DCC reflectance and cloud microphysical variations dependent on the convective cycle increase the temporal variability in the SWIR bands. The temporal standard deviation of monthly VIIRS DCC TOA observations is within 0.53% for VIS bands and for SWIR bands the temporal standard deviation of VIIRS Libya-4 TOA observations is within 1.56%. The Libya-4 target stability is hampered by a brightening event that occurred during the VIIRS record. The improved VIIRS DCC VIS band temporal stability compared with MODIS confirms that the VIIRS detector noise, or striping, is significantly smaller than that of MODIS [8]. Otherwise the VIIRS temporal stability is similar to the corresponding MODIS band temporal stability.
The VIIRS calibration drift is embedded in the invariant target natural variability. Only drifts that exceed the natural variability can be detected using these targets. The minimum detectable trend was computed over the VIIRS observed record, along with linear regressions based on the measurements. The desert measured trends ranged from 0.05%/yr to 0.77%/yr. The DCC trends ranged from −0.08%/yr to −0.87%/yr. None of these trends exceeded the minimum detectable trend based on the observed natural variability over the invariant targets. Only longer time records can confirm smaller VIIRS calibration trends using these targets. The fact that the desert and DCC trends are of opposite sign reveals that the target variability masks the true VIIRS calibration signal. For VIS bands, it is predicted that ~9 years are required to detect a VIIRS calibration trend greater than 0.55%/decade using the DCC target and ~5 years to detect a trend of 1%/decade. For SWIR bands ~11 years are required to confirm a trend that exceeds ~1%/decade.
Currently, the VIIRS instrument calibration stability based on the two stable Earth targets discussed in this paper is found similar to or better than the MODIS instrument. This study also supports that the NPP VIIRS AS3100 subsetted data from NASA Land PEATE should provide consistent cloud retrievals for the CERES FM-5 flux data products during the time of study. It must be noted that any scan mirror calibration drifts for scan positions outside of 40° (DCC) and 10° (Libya-4) VZA were not evaluated in this study.

Acknowledgments

This work was supported by the National Aeronautics and Space Administration Earth Science Enterprise Office through the CERES, CLARREO and the Satellite Calibration Interconsistency Programs and by the National Atmospheric and Oceanic Administration Climate Data Records Program through Grant MOA IA1-1016.

Author Contributions

Rajendra Bhatt and David Doelling designed the study, developed the methodology, performed the analysis, and wrote most of the manuscript. Aisheng Wu and Xiaoxiong (Jack) Xiong are members of the MODIS and VIIRS characterization support team responsible for the MODIS Collection 6 and VIIRS NASA Land PEATE calibration, and they wrote the VIIRS sensor overview part of the manuscript. Benjamin Scarino, Conor Haney, and Arun Gopalan contributed toward processing the MODIS and VIIRS DCC and desert data, implementing the MODIS C6 calibration coefficients into the processing, and reviewing the manuscript.

Conflicts of Interest

The authors declare no conflict of interest.

Reference

  1. Wielicki, B.A.; Barkstrom, B.R.; Harrison, E.F.; Lee, R.B., III; Smith, G.L.; Cooper, J.E. Clouds and the earth’s radiant energy system (CERES): An earth observing system experiment. Bull. Am. Meteor. Soc 1996, 77, 853–868. [Google Scholar]
  2. Loeb, N.G.; Kato, S.; Loukachine, K.; Smith, N.M. Angular distribution models for top-of-atmosphere radiative flux estimation from the Clouds and the Earth’s Radiant Energy System instrument on the Terra satellite. Part I: Methodology. J. Atmos. Ocean. Technol 2005, 22, 338–351. [Google Scholar]
  3. Loeb, N.G.; Kato, S.; Loukachine, K.; Smith, N.M.; Doelling, D.R. Angular distribution models for top-of-atmosphere radiative flux estimation from the Clouds and the Earth’s Radiant Energy System instrument on the Terra satellite. Part II: Validation. J. Atmos. Ocean. Technol 2007, 24, 564–584. [Google Scholar]
  4. MODIS Atmosphere. Available online: http://modis-atmos.gsfc.nasa.gov/MOD06_L2/ (accessed on 20 February 2014).
  5. Minnis, P.; Sun-Mack, S.; Young, D.F.; Heck, P.W.; Garber, D.P.; Chen, Y.; Spangenberg, D.A.; Arduini, R.F.; Trepte, Q.Z.; Smith, W.L.; et al. CERES Edition-2 cloud property retrievals using TRMM VIRS and Terra and Aqua MODIS data, Part I: Algorithms. IEEE Trans. Geosci. Remote Sens 2011, 49. [Google Scholar] [CrossRef]
  6. Priestley, K.; Thomas, S.; Smith, G.L. Ceres Flight Model 5 on NPP: Post-Launch Performance and Initial Sensor Data Record Validation Results. In Proceedings of the 2012 IEEE International Geoscience and Remote Sensing Symposium (IGARSS), Munich, Germany, 22–27 July 2012; pp. 1096–1099.
  7. Xiong, X.; Chiang, K.; McIntire, J.; Oudrari, H.; Wu, A.; Schwaller, M.; Butler, J. Early Assessment of VIIRS On-Orbit Calibration and Support Activities. In Proceedings of the 2012 IEEE International Geoscience and Remote Sensing Symposium (IGARSS), Munich, Germany, 22–27 July 2012; pp. 7189–7192.
  8. Cao, C.; de Luccia, F.J.; Xiong, X.; Wolfe, R.; Weng, F. Early on-orbit performance of the visible infrared imaging radiometer suite onboard the suomi national polar-orbiting Partnership (S-NPP) satellite. Trans. Geosci. Remote Sens 2014, 52. [Google Scholar] [CrossRef]
  9. VIIRS Land. Available online: http://viirsland.gsfc.nasa.gov/Products.html (accessed on 20 February 2014).
  10. Kizu, S.; Kawamura, H. Degradation of the VISSR Visible Sensor on GMS-3 during June 1987 December 1988. J. Atmos. Ocean. Tech 1993, 10, 509–517. [Google Scholar]
  11. Moulin, C.; Lambert, C.E.; Poitou, J.; Dulac, F. Long term (1983–1994) calibration of the Meteosat solar (VIS) channel using desert and ocean targets. Int. J. Remote Sens 1996, 17, 1183–1200. [Google Scholar]
  12. Rao, C.R.N.; Chen, J. Revised post-launch calibration of channels 1 and 2 of the advanced very high resolution radiometer on board the NOAA-14 spacecraft. Int. J. Remote Sens 1999, 20, 3485–3491. [Google Scholar]
  13. Smith, D.L.; Mutlow, C.T.; Rao, C.R.N. Calibration monitoring of the visible and near-infrared channels of the Along-Track Scanning Radiometer-2 by use of stable terrestrial sites. Appl. Opt 2002, 41, 515–523. [Google Scholar]
  14. Hu, Y.; Wielicki, B.; Yang, P.; Stackhouse, P.; Lin, B.; Young, D. Application of deep convective cloud albedo observations to satellite-based study of terrestrial atmosphere: Monitoring stability of space-borne measurements and assessing absorption anomaly. IEEE Trans. Geosci. Remote Sens 2004, 42, 2594–2599. [Google Scholar]
  15. Doelling, D.R.; Nguyen, L.; Minnis, P. On the use of deep convective clouds to calibrate AVHRR data. Proc. SPIE 2004. [Google Scholar] [CrossRef]
  16. Helder, D.L.; Markham, B.; Thome, K.; Barsi, J.; Chander, G.; Malla, R. Updated radiometric calibration for the Landsat 5 Thematic Mapper reflective bands. IEEE Trans. Geosci. Remote Sens 2008, 46, 3309–3325. [Google Scholar]
  17. Chander, G.; Xiong, X.; Choi, T.; Angal, A. Monitoring on-orbit calibration stability of the Terra MODIS and Landsat 7 ETM+ sensors using pseudo-invariant test sites. Remote Sens. Environ 2010, 114, 925–939. [Google Scholar]
  18. Wu, A.; Xiong, X.; Doelling, D.R.; Morstad, D.L.; Angal, A.; Bhatt, R. Characterization of Terra and Aqua MODIS VIS, NIR, and SWIR spectral band calibration stability. IEEE Trans. Geosci. Remote Sens 2012, 51, 4330–4338. [Google Scholar]
  19. Helder, D.L.; Karki, S.; Bhatt, R.; Micijevic, E.; Aaron, D. Radiometric calibration of the Landsat MSS sensor series. IEEE Trans. Geosci. Remote Sens 2012, 50, 2380–2399. [Google Scholar]
  20. Bhatt, R.; Doelling, D.R.; Morstad, D.; Scarino, B.R.; Gopalan, A. Desert-based absolute calibration of successive geostationary visible sensors using a daily exoatmospheric radiance model. IEEE Trans. Geosci. Remote Sens 2014, 52, 3670–3682. [Google Scholar]
  21. Helder, D.L.; Basnet, B.; Morstad, D.L. Optimized identification of worldwide radiometric pseudo-invariant calibration sites. Can. J. Remote Sens 2010, 36, 527–539. [Google Scholar]
  22. Cosnefroy, H.; Leroy, M.; Briottet, X. Selection and characterization of Saharan and Arabian desert sites for the calibration of optical satellite sensors. Remote Sens. Environ 1996, 58, 101–114. [Google Scholar]
  23. Teillet, P.; Barsi, J.; Chander, G.; Thome, K. Prime candidate earth targets for the post-launch radiometric calibration of space-based optical imaging instruments. Proc. SPIE 2007. [Google Scholar] [CrossRef]
  24. CEOS WGCV Calibration and Validation Portal. Available online: http://calvalportal.ceos.org (accessed on 20 February 2014).
  25. Toller, G.; Xiong, X.; Sun, J.; Wenny, B.N.; Geng, X.; Kuyper, J.; Angal, A.; Chen, H.; Madhavan, S.; Wu, A. Terra and aqua moderate-resolution imaging spectroradiometer collection 6 level 1B algorithm. J. Appl. Remote Sens 2013, 7. [Google Scholar] [CrossRef]
  26. Sun, J.; Angal, A.; Xiong, X.; Chen, H.; Geng, X.; Wu, A.; Choi, T.; Chu, M. MODIS RSB calibration improvements in Collection 6. Proc. SPIE 2012. [Google Scholar] [CrossRef]
  27. Wenny, B.N.; Wu, A.; Madhavan, S.; Wang, Z.; Li, Y.; Chen, N.; Chiang, V.; Xiong, X. MODIS TEB calibration approach in collection 6. Proc. SPIE 2012. [Google Scholar] [CrossRef]
  28. Wang, L.; Qu, J.J.; Xiong, X.; Hao, X.; Xie, Y.; Che, N. A new method for retrieving band 6 of aqua MODIS. IEEE Geosci. Remote Sens. Lett 2006, 3, 267–270. [Google Scholar]
  29. Bhatt, R.; Doelling, D.R.; Scarino, B.; Gopalan, A.; Haney, C.O. An initial assessment of the VIIRS onboard calibration using DCC and desert referenced to the Aqua-MODIS calibration. Proc. SPIE 2013. [Google Scholar] [CrossRef]
  30. Doelling, D.R.; Hong, G.; Morstad, D.L.; Bhatt, R.; Gopalan, A.; Xiong, X. The characterization of deep convective cloud albedo as a calibration target using MODIS reflectances. Proc. SPIE 2010. [Google Scholar] [CrossRef]
  31. Doelling, D.R.; Morstad, D.L.; Scarino, B.R.; Bhatt, R.; Gopalan, A. The characterization of deep convective clouds as an invariant calibration target and as a visible calibration technique. IEEE Trans. Geosci. Remote Sens 2013, 51, 1147–1159. [Google Scholar]
  32. Doelling, D.R.; Morstad, D.L.; Bhatt, R.; Scarino, B. Algorithm Theoretical Basis Document (ATBD) for Deep Convective Cloud (DCC) Technique of Calibrating GEO Sensors with Aqua-MODIS for GSICS, GSICS, 2011. Available online: http://gsics.nesdis.noaa.gov/pub/Development/AtbdCentral/GSICS_ATBD_DCC_NASA_2011_09.pdf (accessed on 20 February 2014).
  33. Angal, A.; Chander, G.; Xiong, X.; Choi, T.; Wu, A. Characterization of the Sonoran Desert as a radiometric calibration target for earth observing sensors. J. Appl. Remote Sens 2001, 5. [Google Scholar] [CrossRef]
  34. Weatherhead, E.C.; Reinsel, G.C.; Tiao, G.C.; Meng, X.L.; Choi, D.S.; Cheang, W.K.; Keller, T.L.; Deluisi, J.; Wuebbles, D.J.; Kerr, J.B.; et al. Factors affecting the detection of trends: Statistical considerations and applications to environmental data. J. Geophys. Res 1998, 103, 17149–17161. [Google Scholar]
  35. Weatherhead, E.C.; Reinsel, G.C.; Tiao, G.C.; Jackman, C.H.; Fleming, E.L.; Bishop, L.; DeLuisi, J.; Keller, T.; Herman, J.; McPeters, R.; et al. Detecting the recovery of total column ozone. J. Geophys. Res 2000, 105, 22201–22210. [Google Scholar]
Figure 1. Comparison of the spectral response functions (SRFs) of the matching spectral bands of the MODIS (in red) and VIIRS (in green) instruments. Band numbers are posted in the upper left corner.
Remotesensing 06 02809f1
Figure 2. (a) Linear BRDF regression models derived from near-nadir TOA radiance measurements from Aqua-MODIS band 1 over Libya-4 (2002−2013) for forward (in red) and back scattering directions (in green); and (b) the VIIRS M5 observed divided by the predicted BRDF modeled in (a) radiance ratios before the normalization of the ratios over the VIIRS record.
Remotesensing 06 02809f2
Figure 3. (a) The VIIRS M5 channel DCC monthly PDFs over the TWP domain; and (b) the corresponding PDF mode and mean radiance trends showing the stability of the sensor. The ADM normalized radiance units are in W·m−2·sr−1·μm−1.
Remotesensing 06 02809f3
Figure 4. The normalized desert and DCC responses time-series for VIIRS RSB during the 2012–2013 time period.
Remotesensing 06 02809f4
Figure 5. The normalized desert responses for MODIS RSB during the 2002–2013 time period. The standard deviation (stability) for the whole record and the VIIRS time frame is labeled in black and red (*) respectively. The dotted horizontal red line demarcates the beginning of the VIIRS record.
Remotesensing 06 02809f5
Figure 6. Same as Figure 5, except for the DCC invariant target. The MODIS band 2 saturates for DCC target.
Remotesensing 06 02809f6
Table 1. VIIRS RSB available in the VIIRS Land PEATE AS3100 subsetted data archived at the ASDC.
BandCentral Wavelength (nm)Spatial Resolution at Nadir (m)Spectral Region
M3488750VIS
M4555750VIS
M5672750VIS
M7865750NIR
M101610750SWIR
M112250750SWIR
I1640375VIS
I31610375SWIR
Table 2. Comparison of the observed desert (Libya-4) and DCC (TWP domain) target stability (%) computed from the full MODIS record (July 2002 to October 2013) and during the VIIRS time frame (February 2013 to October 2013), and from VIIRS observations.
VIIRS/MODIS BandLibya-4DCC

Observed MODIS Stability (%)Observed VIIRS Stability (%)Observed MODIS Stability (%)Observed VIIRS Stability (%)


Full RecordVIIRS TimeframeFull RecordVIIRS Timeframe
M3/B31.11.31.40.80.50.5
M4/B41.01.21.10.70.50.5
M5/B10.91.00.80.90.60.4
M7/B21.01.00.9MODIS band saturates0.5
M10/B60.80.91.12.12.12.2
M11/B71.92.11.63.93.11.6
I1/B10.91.00.80.90.60.5
I3/B60.80.91.32.12.12.2
Table 3. Comparison of the observed VIIRS desert and DCC trends (%/yr) with the minimum detectable trend computed at 95% confidence level and with 50% probability using Equation (1).
VIIRS BandLibya-4DCC

Observed Trend (%/yr)Minimum Detectable Trend ± (%/yr)Observed Trend (%/yr)Minimum Detectable Trend ± (%/yr)
M30.771.83−0.080.53
M40.501.66−0.670.82
M50.711.34−0.160.54
M70.631.70−0.110.44
M100.712.00−0.873.24
M110.052.60−0.512.2
I10.311.26−0.420.52
I30.762.50−0.873.22
Table 4. The band-specific trends are arbitrarily based on the invariant target standard deviations divided by a decade. The number of years needed to detect the given trend at the 95% confidence level and with 50% probability using Equation (1), where the Libya-4 time series is based on the MODIS full record, and the DCC is based on the VIIRS record is also listed.
Libya-4 (MODIS Full Record)DCC (VIIRS)

BandTrend ± (%/Decade)Years To Detect TrendTrend ± (%/Decade)Years to Detect Trend
M31.1110.58
M41.0110.510
M50.9100.49
M71.0110.57
M100.8142.29
M111.9101.69
I10.9100.57
I30.8172.29

