Article

Segmentation of Sloped Roofs from Airborne LiDAR Point Clouds Using Ridge-Based Hierarchical Decomposition

1
GIScience Research Group, Heidelberg University, Berliner Str. 48, Heidelberg 69120, Germany
2
Department of Photogrammetry and Remote Sensing, Technische Universitaet Muenchen, Acisstr. 21, Munich 80333, Germany
3
The State Key Laboratory of Remote Sensing Science, Beijing Normal University, Beijing 100875, China
4
College of Surveying and GeoInfomatic, Tongji University, Sipinglu 1239, Shanghai 200092, China
*
Author to whom correspondence should be addressed.
Remote Sens. 2014, 6(4), 3284-3301; https://doi.org/10.3390/rs6043284
Submission received: 20 November 2013 / Revised: 27 February 2014 / Accepted: 24 March 2014 / Published: 11 April 2014

Abstract

:
This paper presents a new approach for roof facet segmentation based on ridge detection and hierarchical decomposition along ridges. The proposed approach exploits the fact that every roof can be composed of a set of gabled roofs and single facets which are separated by the gabled roofs. In this work, firstly, building footprints stored in OpenStreetMap are used to extract 3D points on roofs. Then, roofs are segmented into roof facets. The algorithm starts with detecting roof ridges using RANSAC since they are parallel to the horizon and situated on the top of the roof. The roof ridges are utilized to indicate the location and direction of the gabled roof. Thus, points on the two roof facets along a roof ridge can be identified based on their connectivity and coplanarity. The results of the segmentation benefit the further process of roof reconstruction because many parameters, including the position, angle and size of the gabled roof can be calculated and used as priori knowledge for the model-driven approach, and topologies among the point segments are made known for the data-driven approach. The algorithm has been validated in the test sites of two towns next to Bavaria Forest national park. The experimental results show that building roofs can be segmented with both high correctness and completeness simultaneously.

1. Introduction

Recent technological advances such as aerial photogrammetry, laser scanning measurement, 3D computer graphics, etc., have greatly eased data acquisition, construction and visualization of detailed 3D building models. Hence, 3D building reconstruction has been an active research topic for almost two decades.
In general, 3D building reconstruction can be distinguished between image-based and point cloud based approach. Most image-based approaches have focused on the reconstruction of specific building models: rectilinear shapes [13], flat roofs [48] or parametric models [911]. The image-based approach has the advantage of extracting outlines of roofs. It is hence suitable for detection roofs with simple shape or structure, e.g., flat roof, shed roof and simply gabled or hipped roof. However, it can fragment or miss the line segments inside of the outlines, due to low contrast, occlusions and bad perspectives. Therefore, it is not appropriate for roofs with complicated shape and structure, e.g., multi-gabled or hipped roof, or complicated roofs of building group. To overcome this limitation, many researchers used stereo images to generate a Digital Surface Model (DSM) to remove non-building structure using height information at first. Then, they focused on building shape and rooftop contours. For instance, Brunn and Weidner [12] separated buildings and vegetation areas using height and geometric information on DSM data, and extracted rooftop geometries using surface normal. Sirmacek et al. [13] proposed a two-step approach using DSM: (i) detecting building ground floor shapes using an active shape detection approach; and (ii) extract roof structure by derivative filters. Galvanin and Poz [14] extracted rooftop by segmentation of DSM with a recursive splitting technique and region merging process. In fact, methods using DSM data can be regarded as point cloud based approaches, although 3D points are acquired by dense matching of stereo aerial images. In other point cloud based approaches, buildings are measured by LiAR (Liht Detecting and Ranging) with 3D geometries directly and represented as a number of 3D points. Building detection and reconstruction from LiAR data has been an active research topic in recent years. Comprehensive literature reviews about various approaches in this field have been made available in [1517].
Most methods start by converting the LIDAR point cloud to a depth image [1822] and then use well known image segmentation techniques to detect buildings as rectilinear shapes. A detailed literature review about the various approaches to extract buildings using imagery and LIDAR data can be found in [23,24]. On the other hand, several approaches are raised for 3D roof reconstruction by operating LIDAR data directly. The process contains two steps. Firstly, points are grouped together when they have similar properties, e.g., heights or normal vectors. For this process, various methods have been borrowed from the field of image processing or statistical learning, for instance, region growing [25,26], Hough transformation [20,27] and RANSAC (RANdom Sample Consensus) [28,29].
After building roofs are extracted from 3D point clouds, roofs are reconstructed by using either a model-driven or data-driven approach. In a model-driven approach [27,2936], a model library of roof forms is required and a roof model is found out based on determination of model primitives that will fit a dense and detailed 3D roof point clouds best. The advantage of this kind of approach is that it can always reconstruct a topologically consistent model. However, the process may often fail when a roof falls beyond the predefined models, since building roofs reveal a hug variety in structure and shape. In a data-driven approach [3740], polyhedral model is extracted and calculated from the segmented point cloud for individual roof plane. The challenge of this kind of approach is to determine the topologic relations among detected roof segments in the first step and to adjust and to modify the extracted polygons accordingly. Furthermore, roof facets constructed by data-driven approaches might be incomplete due to the obstacle of trees.
In comparison to the previous approaches, the work presented in this paper can be regarded as a combination of model-driven and data-driven approaches. The segmentation is achieved according to the knowledge how a roof is normally decomposed. To the date, the density of laser foot points is getting higher and higher (up to more than 10 points per square meter). This makes it possible that roof ridges are detected from the laser point cloud. In the process of segmentation, the search area and the resulted computation cost are reduced substantially because a detected roof ridge indicates the location and direction of a gabled roof. In addition, for the roof reconstruction it provides parameters, for instance, the position, angle, and size of the gabled roof, as priori knowledge for the model-driven approach; and topologies among the point segments for the data-driven approach. Another novelty in this work is that building footprints data in OpenStreetMap is used to extract building objects in a pre-process step. This enables the automated extracting and segmenting building of roofs directly from raw LiDAR point clouds with high efficiency and accuracy.
The segmentation approach is proposed based on roof ridge detection, since a simple (gabled) roof can be divided into two planar facets along the roof ridge. In general, every non-flat-roof can be decomposed of several (symmetric or asymmetric) gabled roof parts and a set of single roof facets which are normally of triangle or rectangular shape, whereby a shed roof is regarded as an asymmetric gabled roof with only one roof side. The presented work utilizes the advantage of the regulation of this kind of decomposition. The process starts with detecting 3D points of local maximum of height as roof ridges. For each detected roof ridge, seed points are selected along the roof ridge. Then, 3D points are segmented to their corresponding roof facets because they are located on the same plane as the seed points. In the next step, roof ridges at second high level are detected. Then, 3D points are segmented to their corresponding roof facets using seed points along roof ridges. The process terminates when no roof ridge can be detected.
The remainder of this paper is structured as follows. Section 2 describes the proposed methodology including roof ridge detection and point segmentation. Section 3 introduces the experimental data and presents the pre-processing of OpenStreetMap (OSM) aided roof extraction from LiDAR point clouds. Section 4 presents evaluates the experiment results. Finally, Section 5 concludes the whole work and gives some remarks on the future work.

2. Methodology

The overall approach is based on a process of twofold roof decomposition: (i) hierarchical decomposition of roof into several gabled roofs; and (ii) decomposition of gabled roof into two plane facets along roof ridge. Hence, the process starts with the detection of roof ridges (Subsection 2.1) and then points can be segmented along roof ridges (Subsection 2.2).

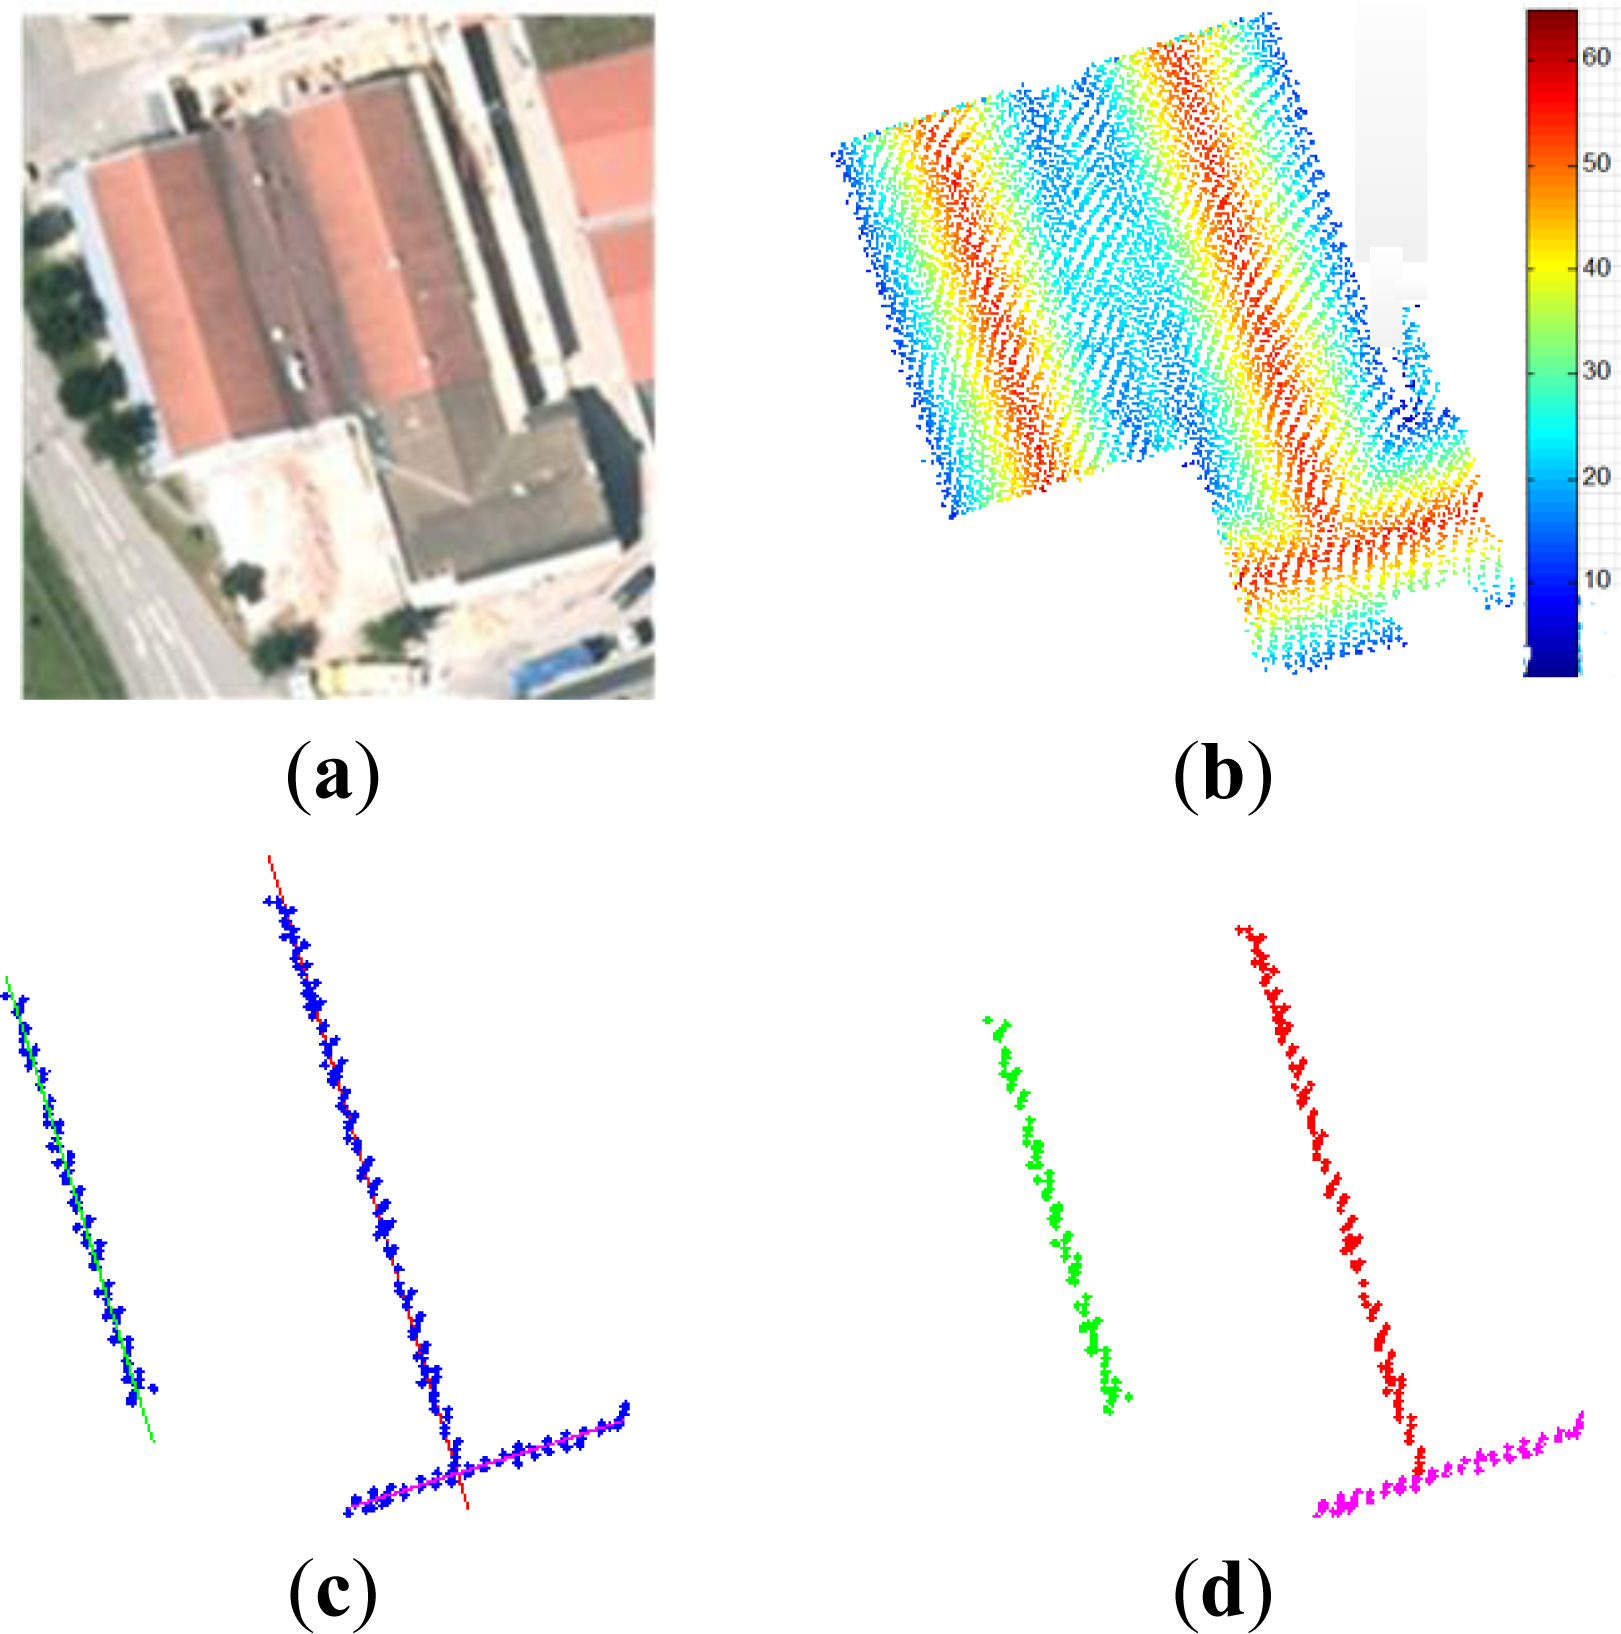
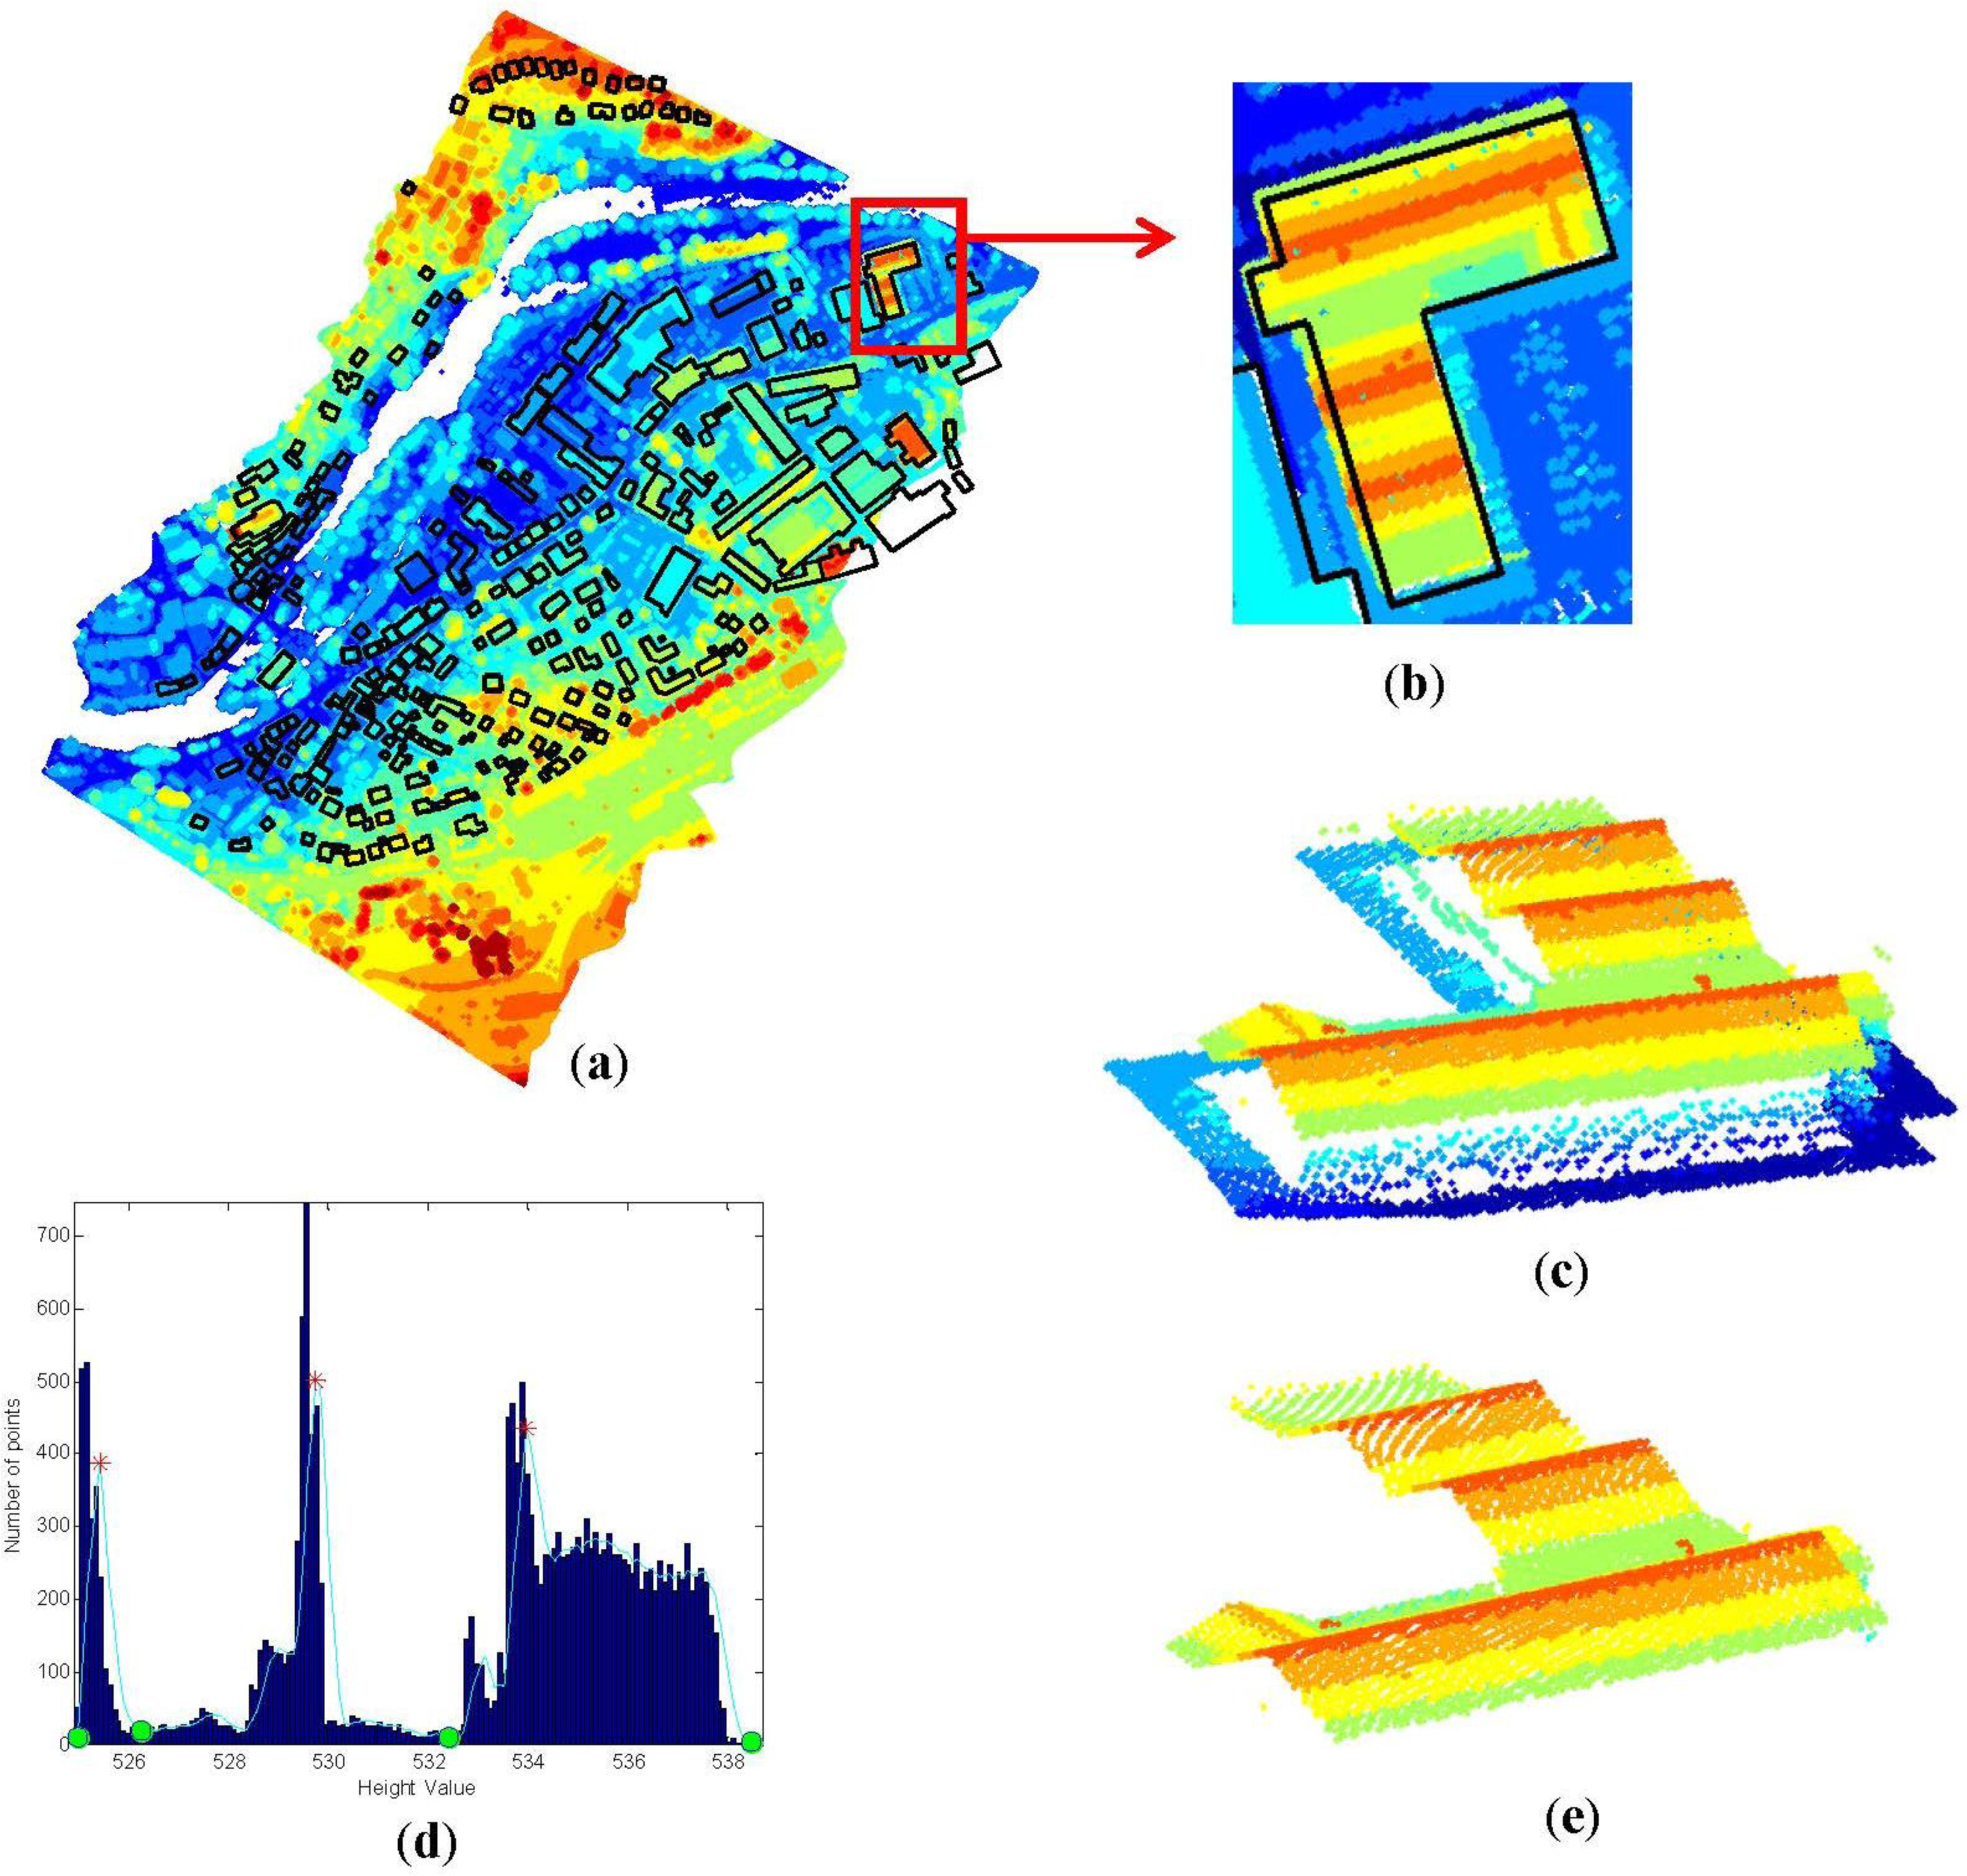
2.1. Detection of Roof Ridges

In this subsection the process of detecting roof ridges is described by taking a complicated house (Figure 1a) as an example. Prior to the ridge detection, the point cloud of a roof is divided into 20 layers along the height (Figure 1b), whereas every layer has the equal interval of height. Then, the layers of points are selected from top to down until the number of points in the selected layers is larger than 50 which is set empirically to avoid that only points of chimney are selected in case the top of chimney is higher than roof ridges. The selected points are unorganized. In this work, linear components are detected from these points using the RANdom Sample Consensus (RANSAC) [41]. The process initiates with two random points and calculates Euclidean distances of all the points to the line through these two points. If there are enough points which are closely located to the line, a candidate line component is found initially. In the next step, the parameters and inliers of this line component are iteratively estimated. The inliers are then 3D points on a line component. This linear component is regarded as a roof ridge. Then, points are assigned to this roof ridge when they are close to a line component. The points have to connected to each other with a maximal neighboring point distance smaller than twice the average laser point spacing. These points are removed. The remaining points are used for the detection of the next roof ridge. The process terminates when there are fewer points left. The detection process is robust against noise points such as chimneys and other small objects on the roof or trees near a building, because no line component can be detected by using RANSAC due to the low number of points. In the example of Figure 1, three linear components (Figure 1c) were detected and dotted by red, green and magenta respectively. As a result, the 3D points of roof ridges are identified as three ridges (Figure 1d).
It should be pointed out that the ridges detected in Figure 1 are called ridges at the first level in our work. In some cases, there are building parts with lower gabled roofs, for instance, roofs of side houses. This kind of ridge is then a ridge at the second level, or even third level. They can be detected using the same algorithm, after the points on the gabled roofs of the first layer ridges are identified and segmented. The process of the segmentation is described in the next subsection.

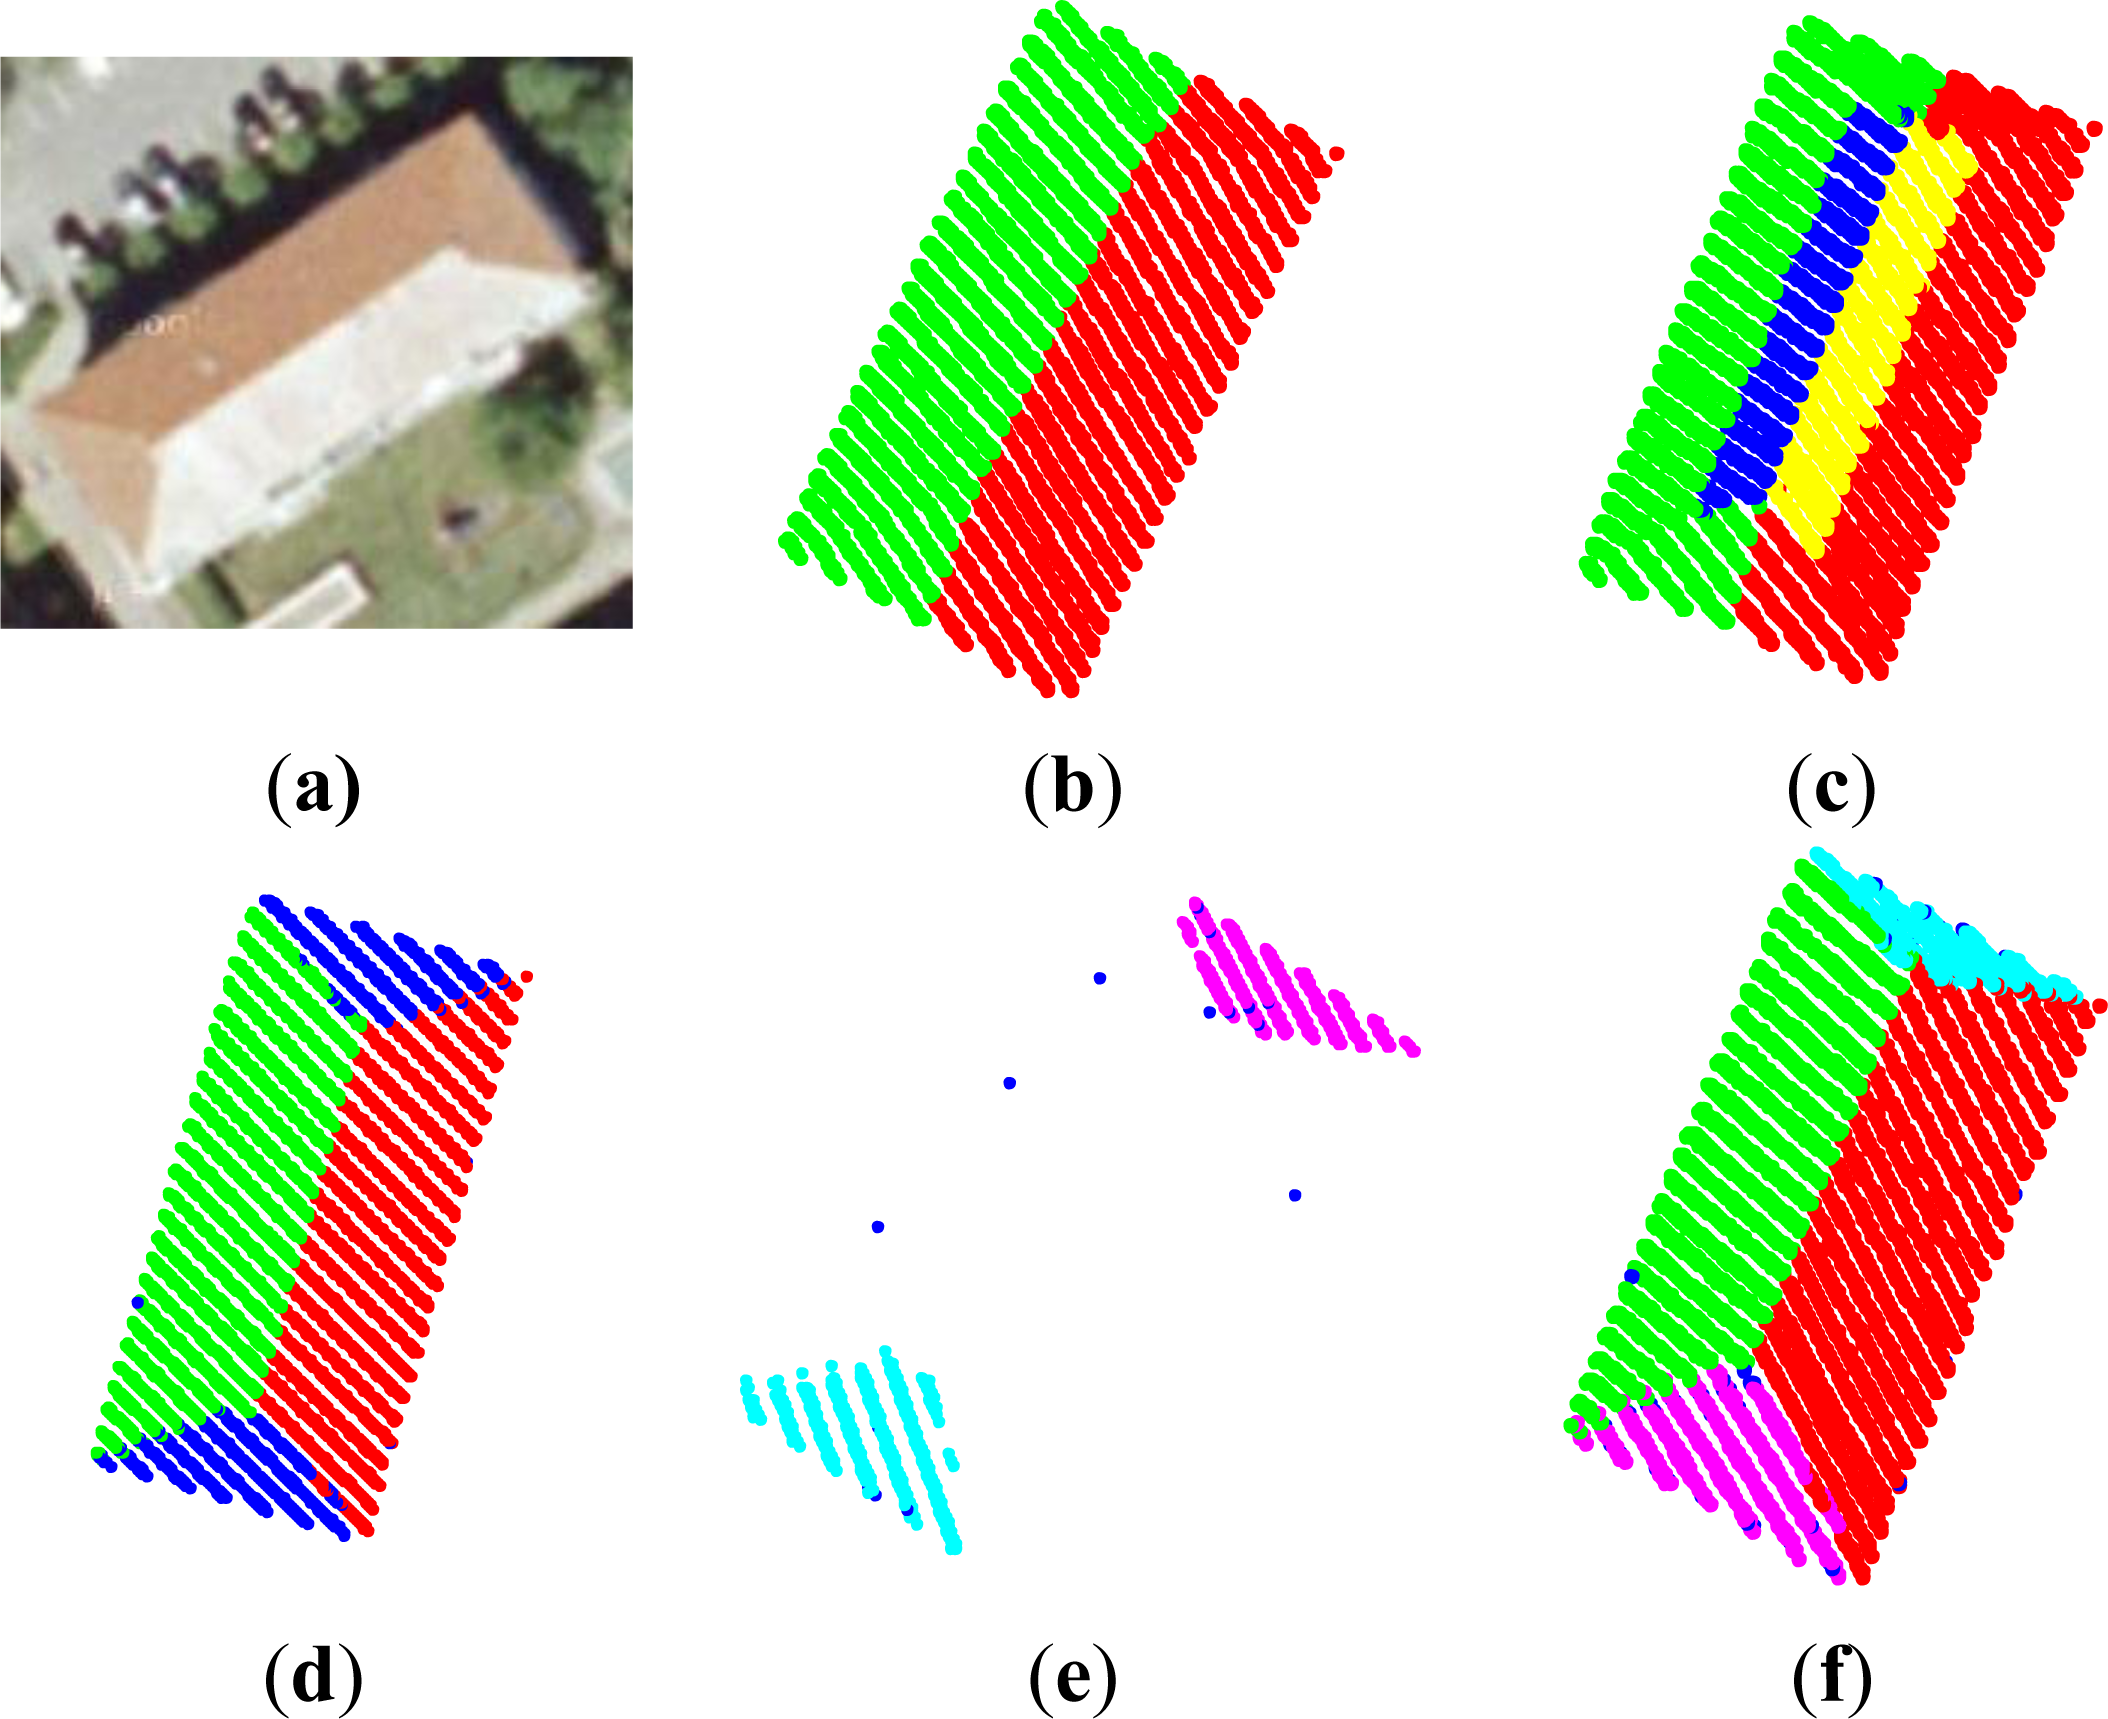
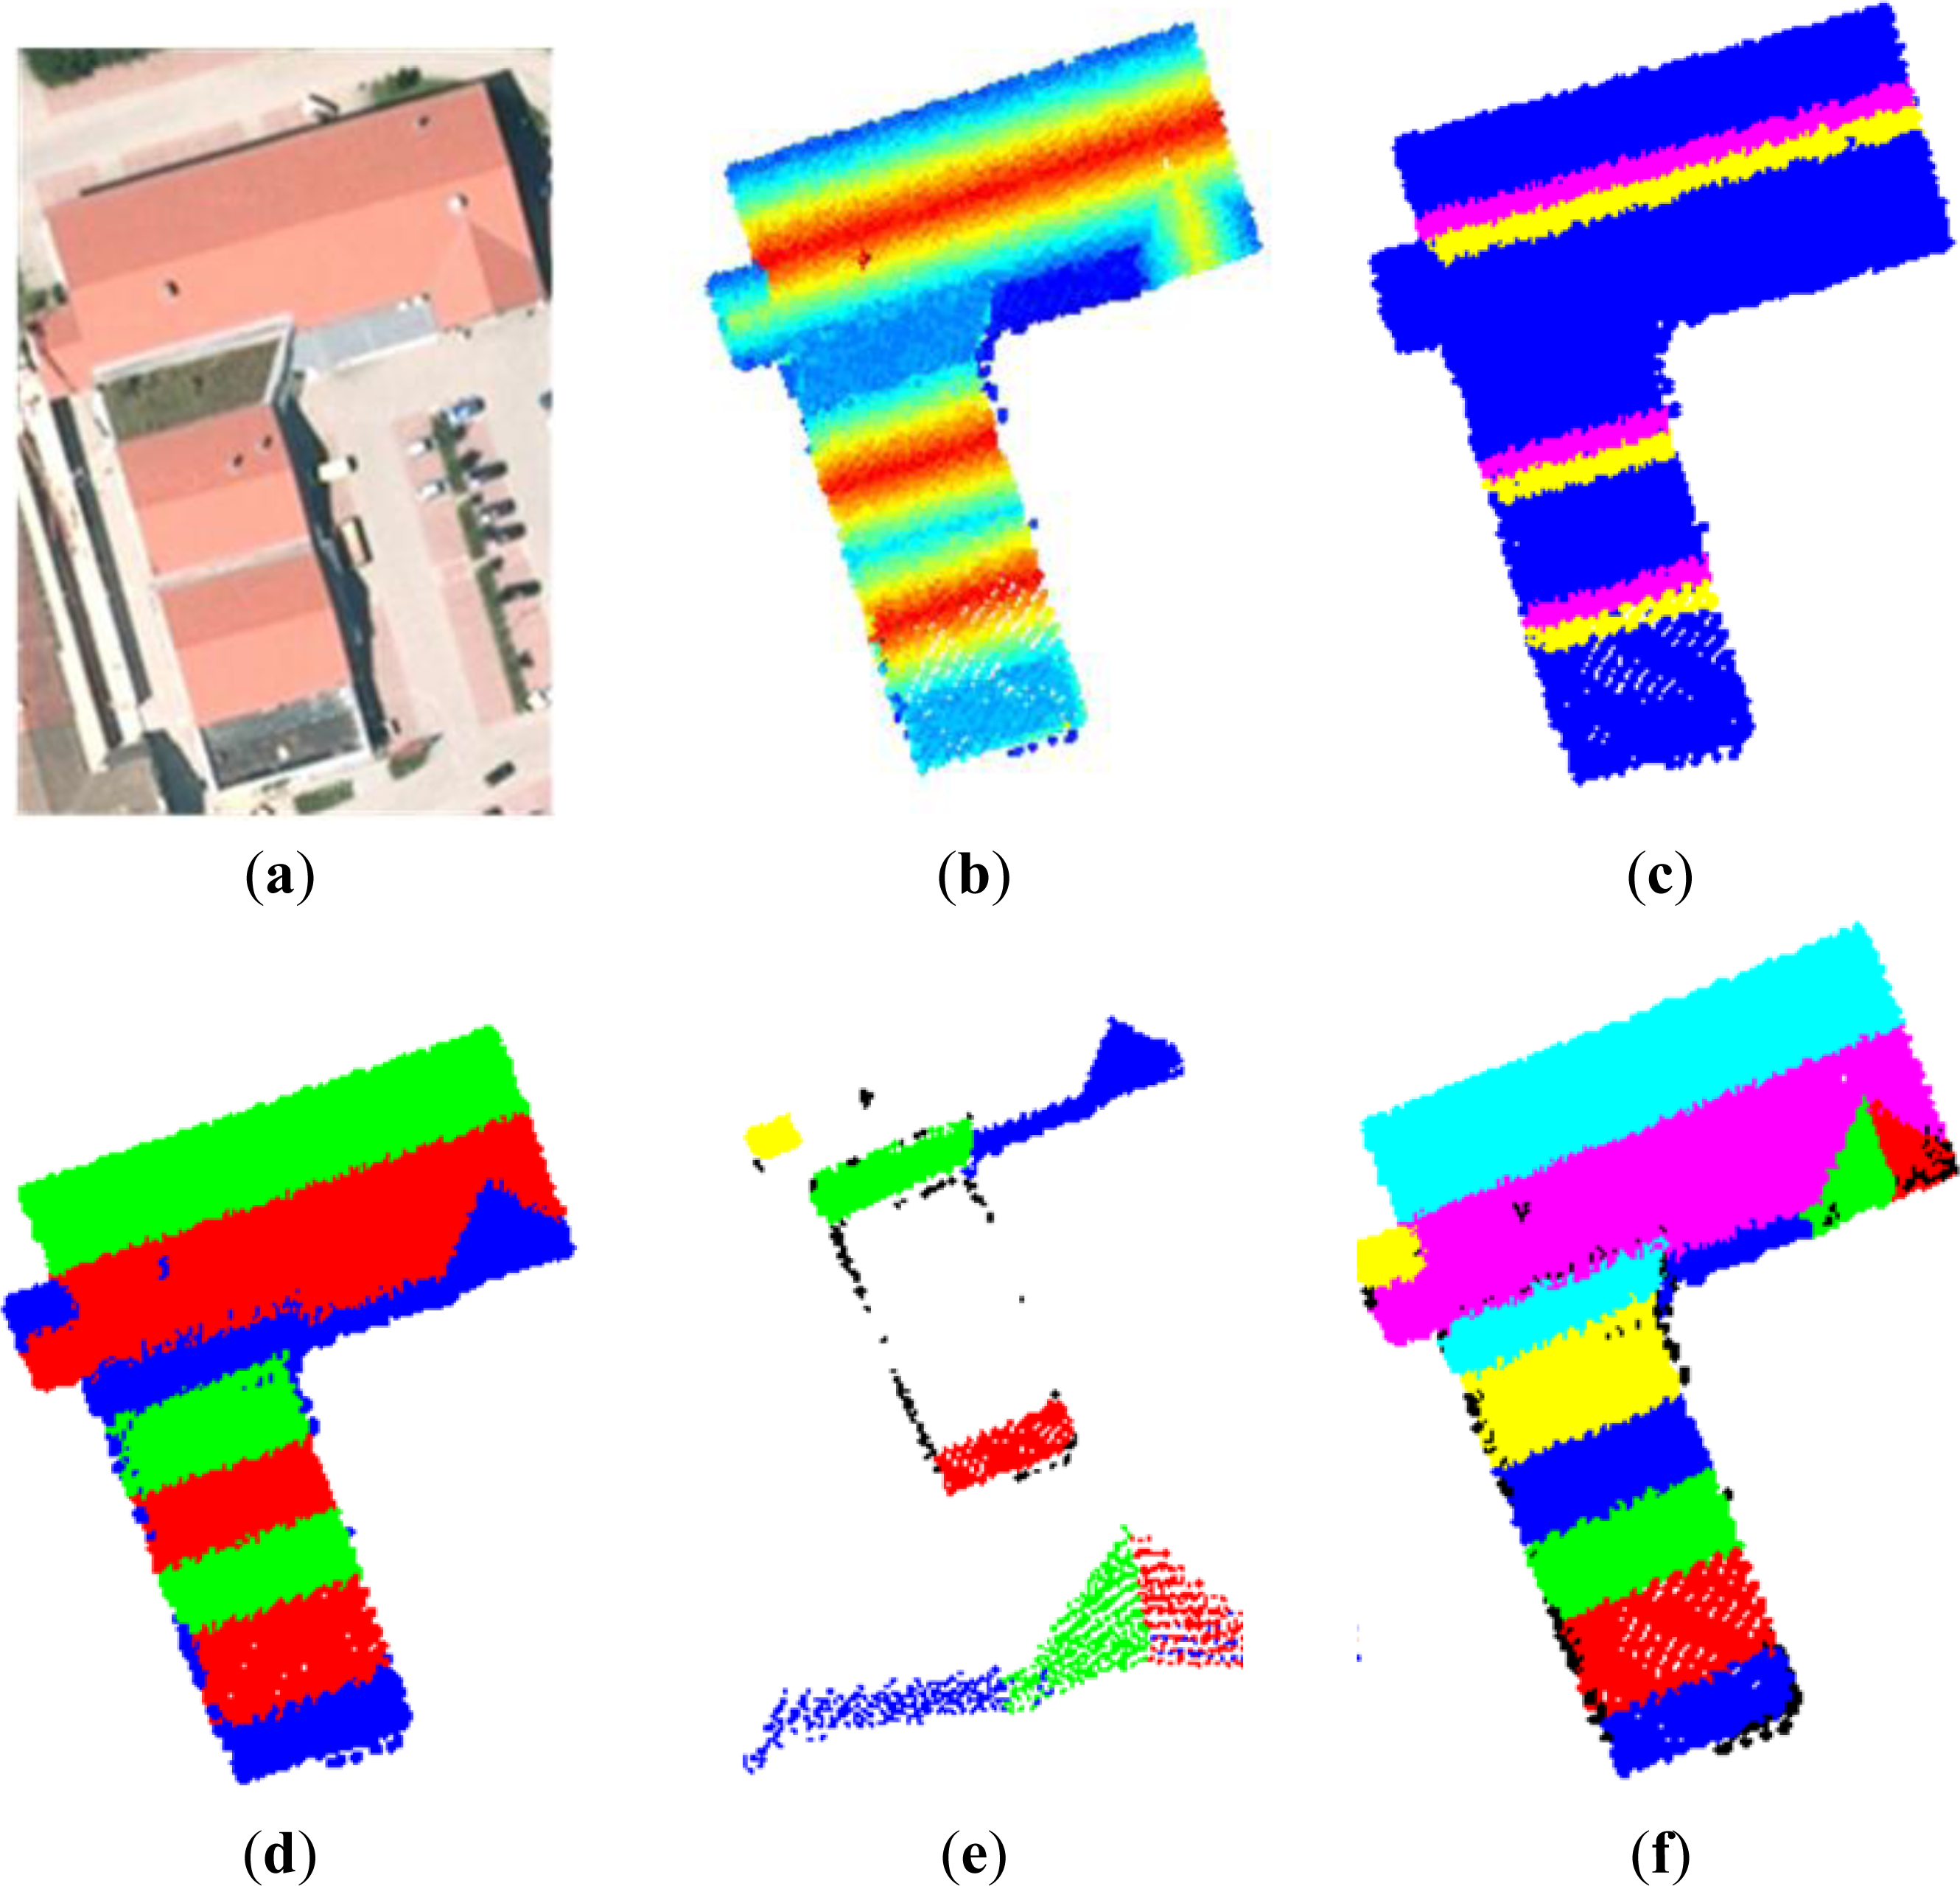
2.2. Segmentation of Points along Hierarchical Decomposition of Roof Structure

The process of the segmentation is to calculate the vectors of facet planes and find points on their corresponding facets. Figure 2a shows a hipped roof which is treated as a special case of gabled roof in our work. After its roof ridge is detected, a plane is constructed so that it contains the adjusted line of the roof ridge and is perpendicular to the horizon. Then, points on the roof are divided by this plane into two groups (Figure 2b). For each point group, a set of points are found which have perpendicular distances to the line of the roof ridge shorter than a threshold and dropped perpendicular feet located on the line segment of the roof ridge. Figure 2c shows the two sets of points highlighted with blue and yellow, respectively.
In the proposed approach, the threshold is set for two meters which is shorter than the width of the most of roof facets. In fact, these two sets of points are taken as seed points for the two roof facets. Aiming at finding all the points of a roof facet, an adjust plane φ(x, y, z) is fitted using the seed points. The plane can be defined by using the equation:
ax + by + cz + d = 0
where n⃗ = [a, b, c] is the normal vector of the plane and d is the closest distance of the plane to the origin of the coordinate system. The parameters of plane φ(x, y, z) are solved by an iterative process. Assuming the point (x0, y0, z0) is located on the plane, the plane of Equation (1) can be reformed for all the points of this plane as follows:
a ( x x 0 ) + b ( y y 0 ) + c ( z z 0 ) = 0
For the roof facet, the point (x0, y0, z0) can be taken as the centroid of the seed points. Equation (2) can be represented as:
( x 1 x 0 y 1 y 0 z 1 z 0 x 2 x 0 y 2 y 0 z 2 z 0 x n x 0 y n y 0 z n z 0 ) ( a b c ) = A n = 0
where (x1, y1, z1), (x2, y2, z2), …, and (xn, yn, zn) are seed points.
The normal vector n⃗ = [a, b, c] can be obtained by calculating the normalized eigenvectors of N, whereby N = AT · A. Finally, the parameter d in Equation (2) can be calculated by:
d = ( a x 0 + b y 0 + c z 0 )
The residuals of the seed points can be calculated by Δy = A · V (V is the eigenvector of matrix N). The parameters obtained from Equations (3) and (4) are taken as initial result for the iterative process. In each iteration, (i) those points are neglected if their residuals falls beyond the tolerant interval of a given a-priori standard deviation δa, (ii) and the centroid point (x0, y0, z0) is updated. The iteration terminates when
( Δ y T Δ y ) / n 3 δ a n is the number of the remaining points )
Then the points on the roof facet can be extracted when their distances to the above calculated plane equal to zero in ideal case. In the reality, roofs undulate normally about 10 cm due to the form of tiles. Considering the accuracy of the measurement, the tolerance is defined as 20 cm in our work. Therefore, the point segment of a roof facet is defined as:
Ω = { p ( x , y , z ) | f ( p , φ ) 0.2 }
where f(p, φ) is distance function of point p(x, y, z) to plane φ(x, y, z).
Sometimes there are trees, or some other building roofs nearby, the points of which or some error measurements could be coplanar with the roof plane. These points can be separated by based on the concept of density clustering and connectivity analysis [4244]. The corresponding threshold in this work is chosen as two times of the average distance between neighboring laser points. That means that the maxima distance between neighboring points in a cluster should be smaller than two times the average laser spacing. The cluster of points is then the roof facet if this cluster contains points of the roof ridge. As a result, the points on the two roof facets along the roof ridge are clustered. As shown in Figure 2d, red and green points are located on two roof facets, respectively, while blue points remained un-segmented. The remaining points mainly belong to the two side roof facets (Figure 2e). They are disconnected after the points of the gabled roof between them are segmented. They can be easily clustered using connectivity analysis. Then, two adjusted planes are fitted to respective point clusters. Finally, the points on a roof facet are identified (Figure 2f) using Equation (6).
For a complicated structured roof, taking roof in Figure 3 as an example, their roof ridges at the first level are detected at first. For every roof ridge, points are identified associated to the two roof facets along the ridge. The remaining points are clustered based on the connectivity analysis. If the amount of the points in a cluster is fewer than 50 which might construct the smallest roof facet, the points are regarded as noise points. Otherwise, an adjusted plane will be calculated at first. If more than 80% of the points are located on the plane with a certain tolerance (20 cm in our work), the points should belong to a flat roof facet, or a shed roof facet, or a side triangle of a hipped roof, and they can be segmented together. If most of the points distance themselves from the adjusted plane, the point cluster may contain one or several gabled roofs at the second level. The process restarts with the detection of roof ridge(s) at the second level, and segmentation is conducted along the roof ridge. The process terminates when there are only noise points in the point cluster. Figure 3 demonstrates the aforementioned process of segmentation of a complicated roof with two levels of ridges.

3. Dataset and Pre-Processing

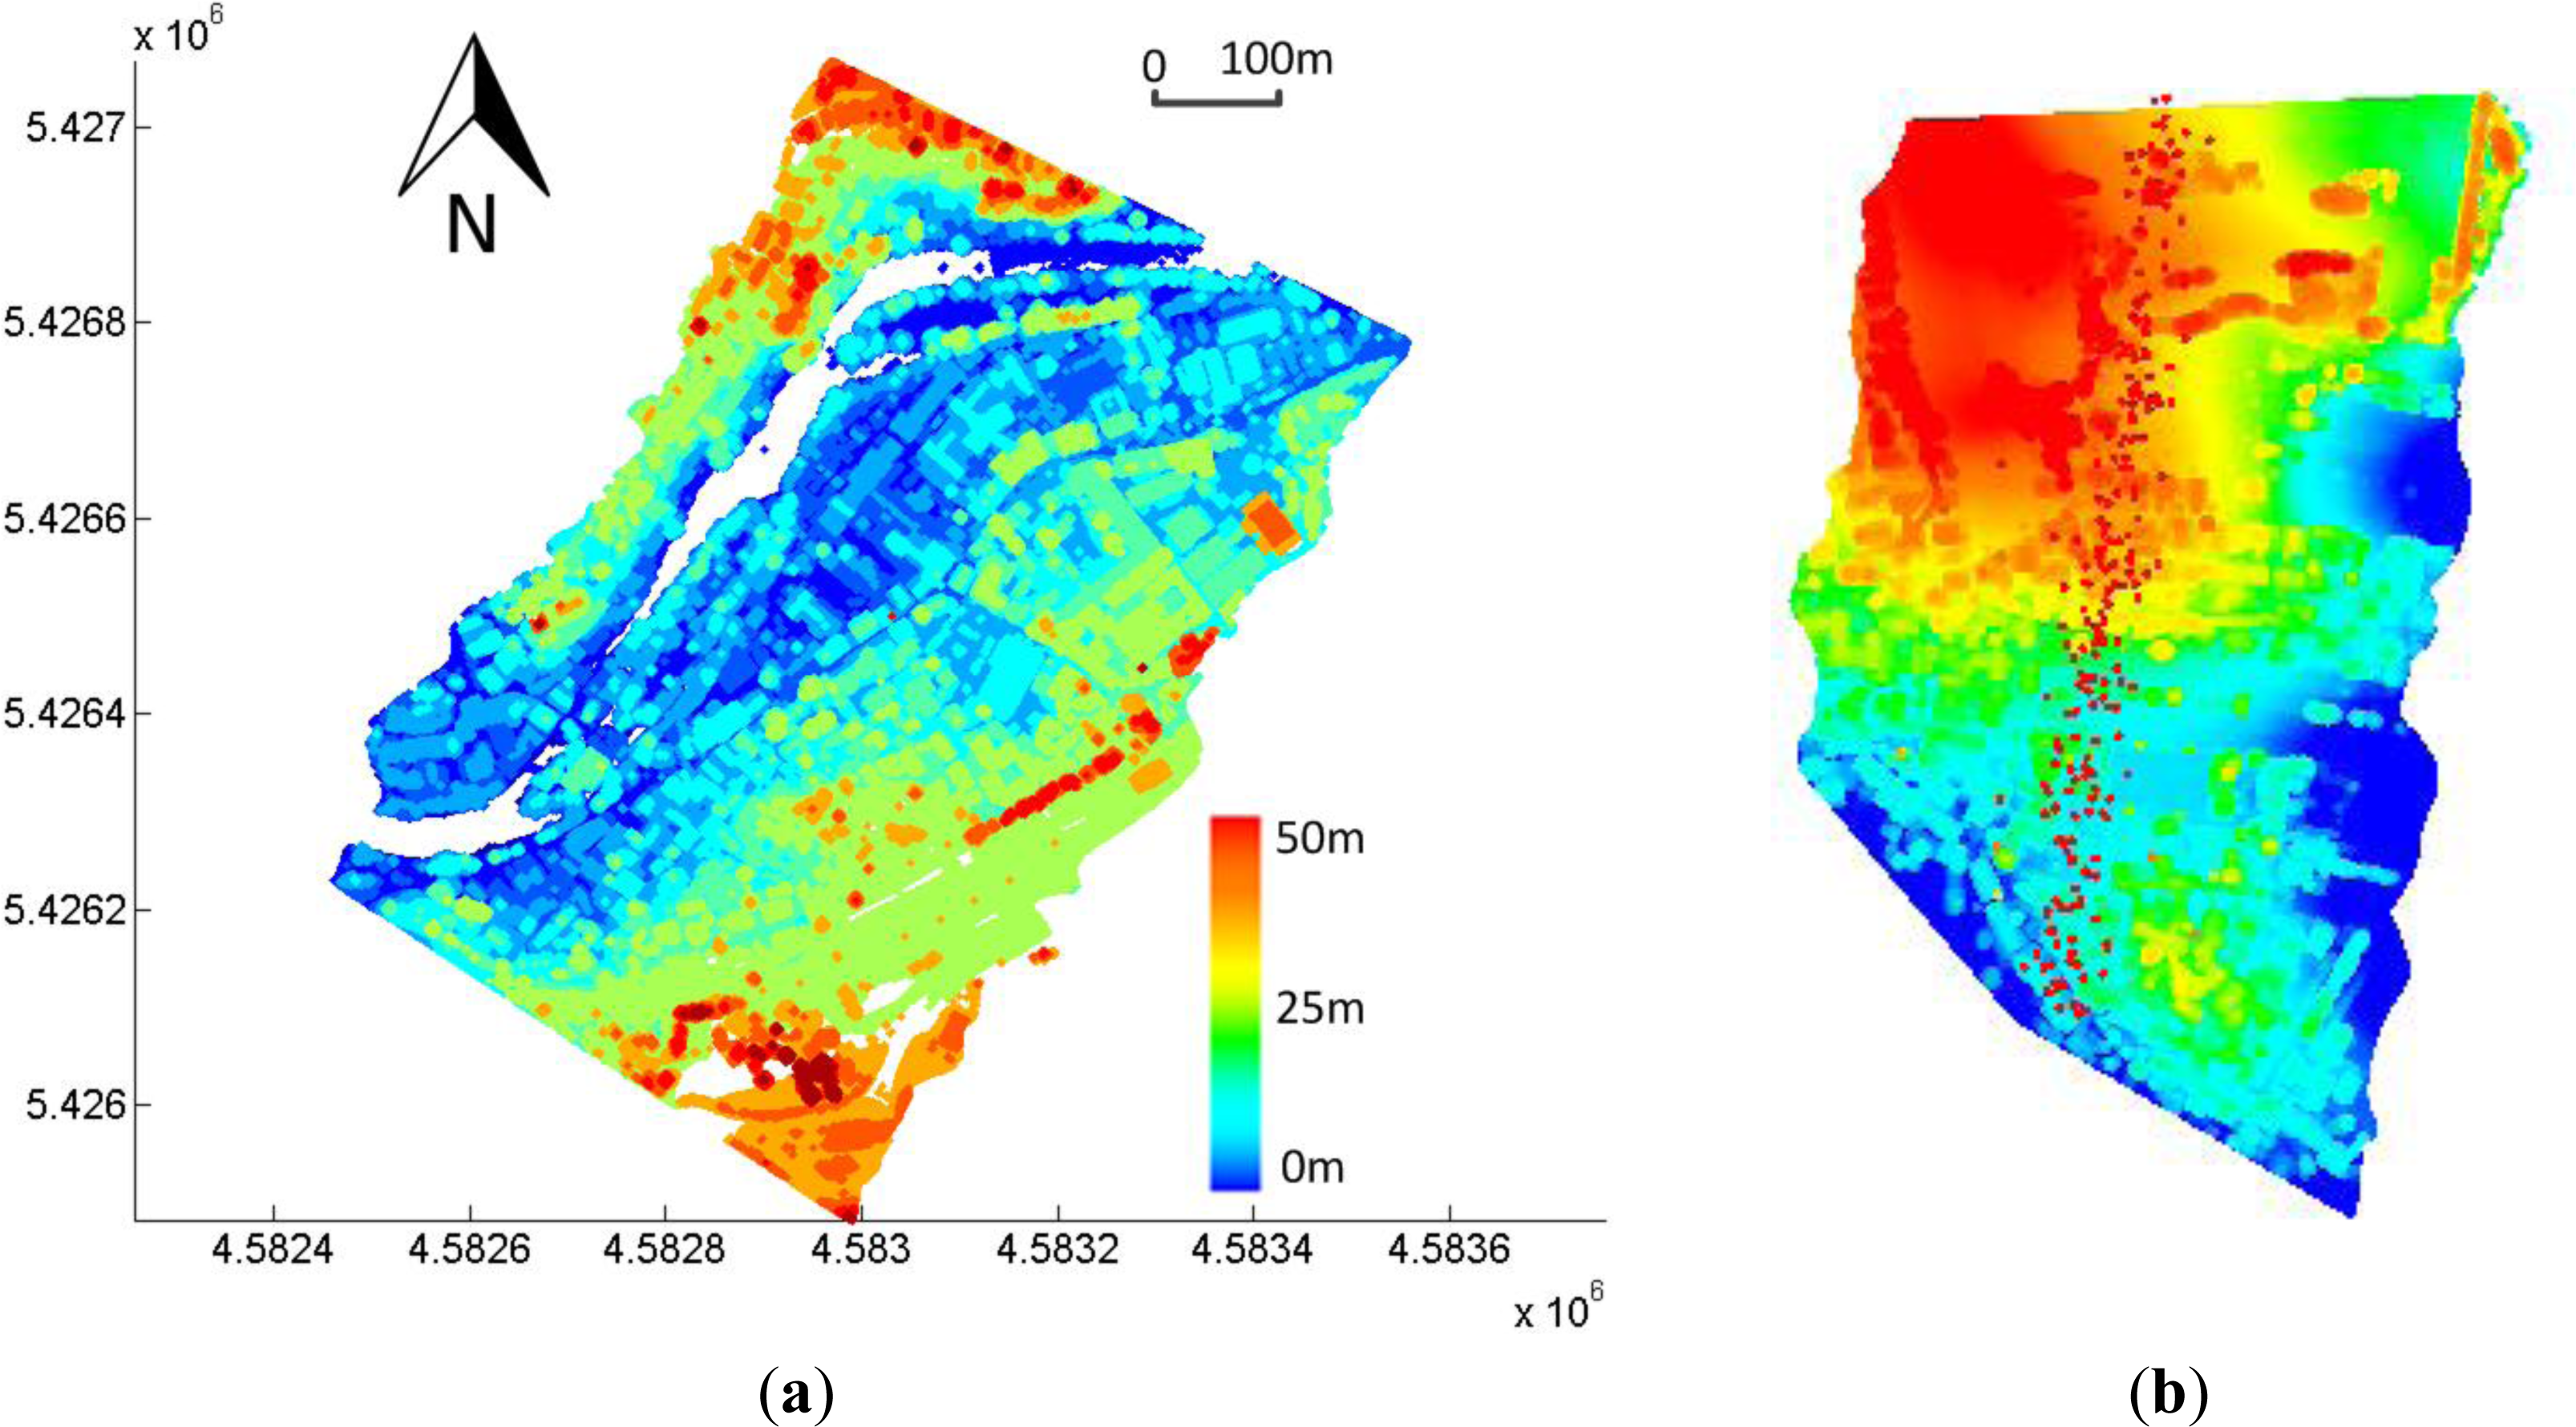
3.1. Experimental Data

The proposed approach is applied to the dataset Regen (Figure 4a) and the dataset Kirchdorf (Figure 4b), respectively. Regen and Kirchdorf are situated in the Bavaria Forest. They are typical German towns: (i) almost all (over 95%) the buildings are structured with sloped-roofs; (ii) more than 60% of buildings are structured with simple gabled roofs; (iii) about 20% of buildings are cross-gabled which can be decomposed of two gabled roofs; (iv) about 10% of buildings are actually building groups consists of more than two buildings with simple gabled roofs; (v) fewer than 10% of buildings are complicated structured with three or four levels of roof ridges. The technical details of the two data sets are summarized in Table 1.

3.2. OSM Aided Extraction of Building Roofs

Prior to the segmentation of roof structure, point clouds of buildings (including roofs) are extracted by means of an OSM (OpenStreetMap) aided approach in a pre-processing step, whereby building footprints stored in OSM are used.
As demonstrated in Figure 5, 3D laser scanning points are overlapped by OSM footprints data at first (Figure 5a). Since building footprints in OSM are mostly acquired by directly digitalizing outlines of roofs on aerial (or satellite) imagery, there are normally offsets to the true position due to the oblique perspective of used sensors. For this reason, OSM building footprints cannot be well matched with LiDAR point clouds directly, as shown in Figure 5b. In the presented work, a buffer zone is generated for the area covered by a building footprint, whereby the width of buffer zone is set as 5 m according to a statistic about the offsets of building footprints in OSM [45]. The points that fall in the footprint and its buffer zone are considered as candidate points for the roof. However, points on the ground surface and on walls are also selected (Figure 5c). In order to remove these points, the histogram of heights of all the candidate points is analyzed to detect local valleys (green dots on Figure 5d) and peaks (red stars in Figure 5d). The valley before the last peak on histogram indicates the disconnection of facades and roof, because building facades are only partly scanned on the one hand. On the other hand, the number of points at the same high level is low due to the vertical structure of the walls. Hence, the corresponding height value is selected as the threshold for roof points. That means that all the points which are located higher than this threshold are viewed as points on the roof (Figure 5e).

4. Experimental Analysis

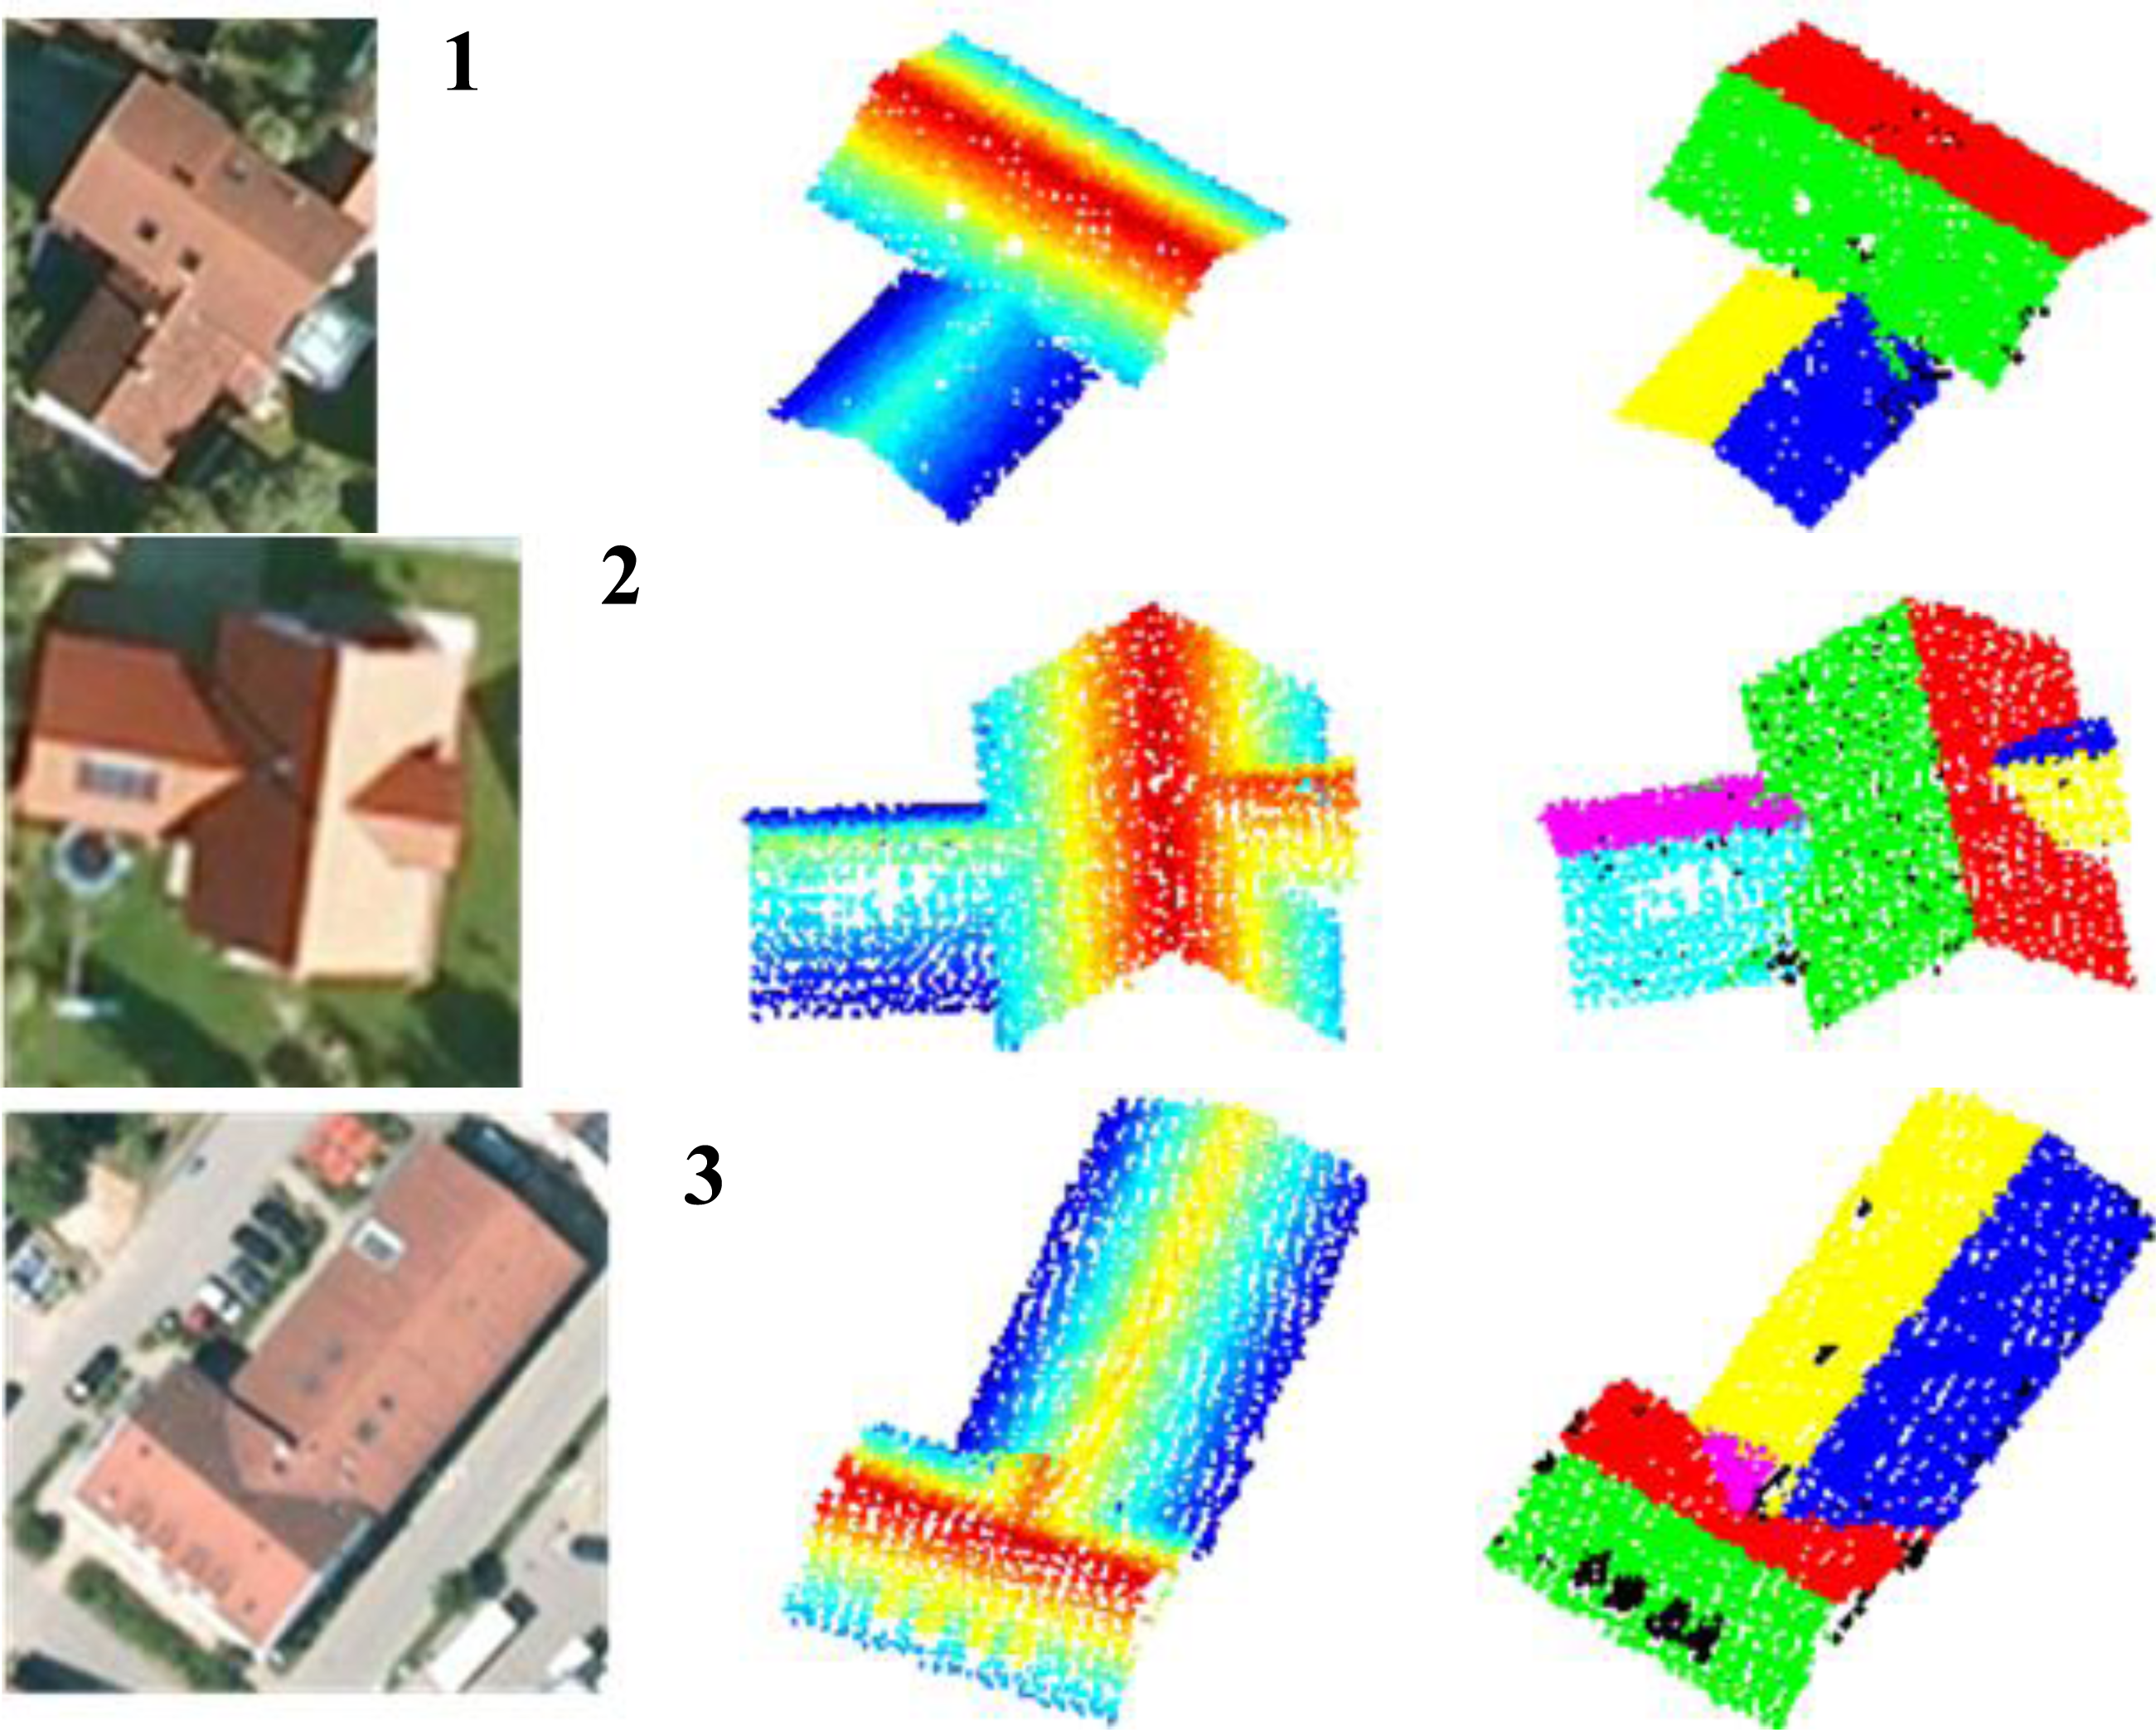
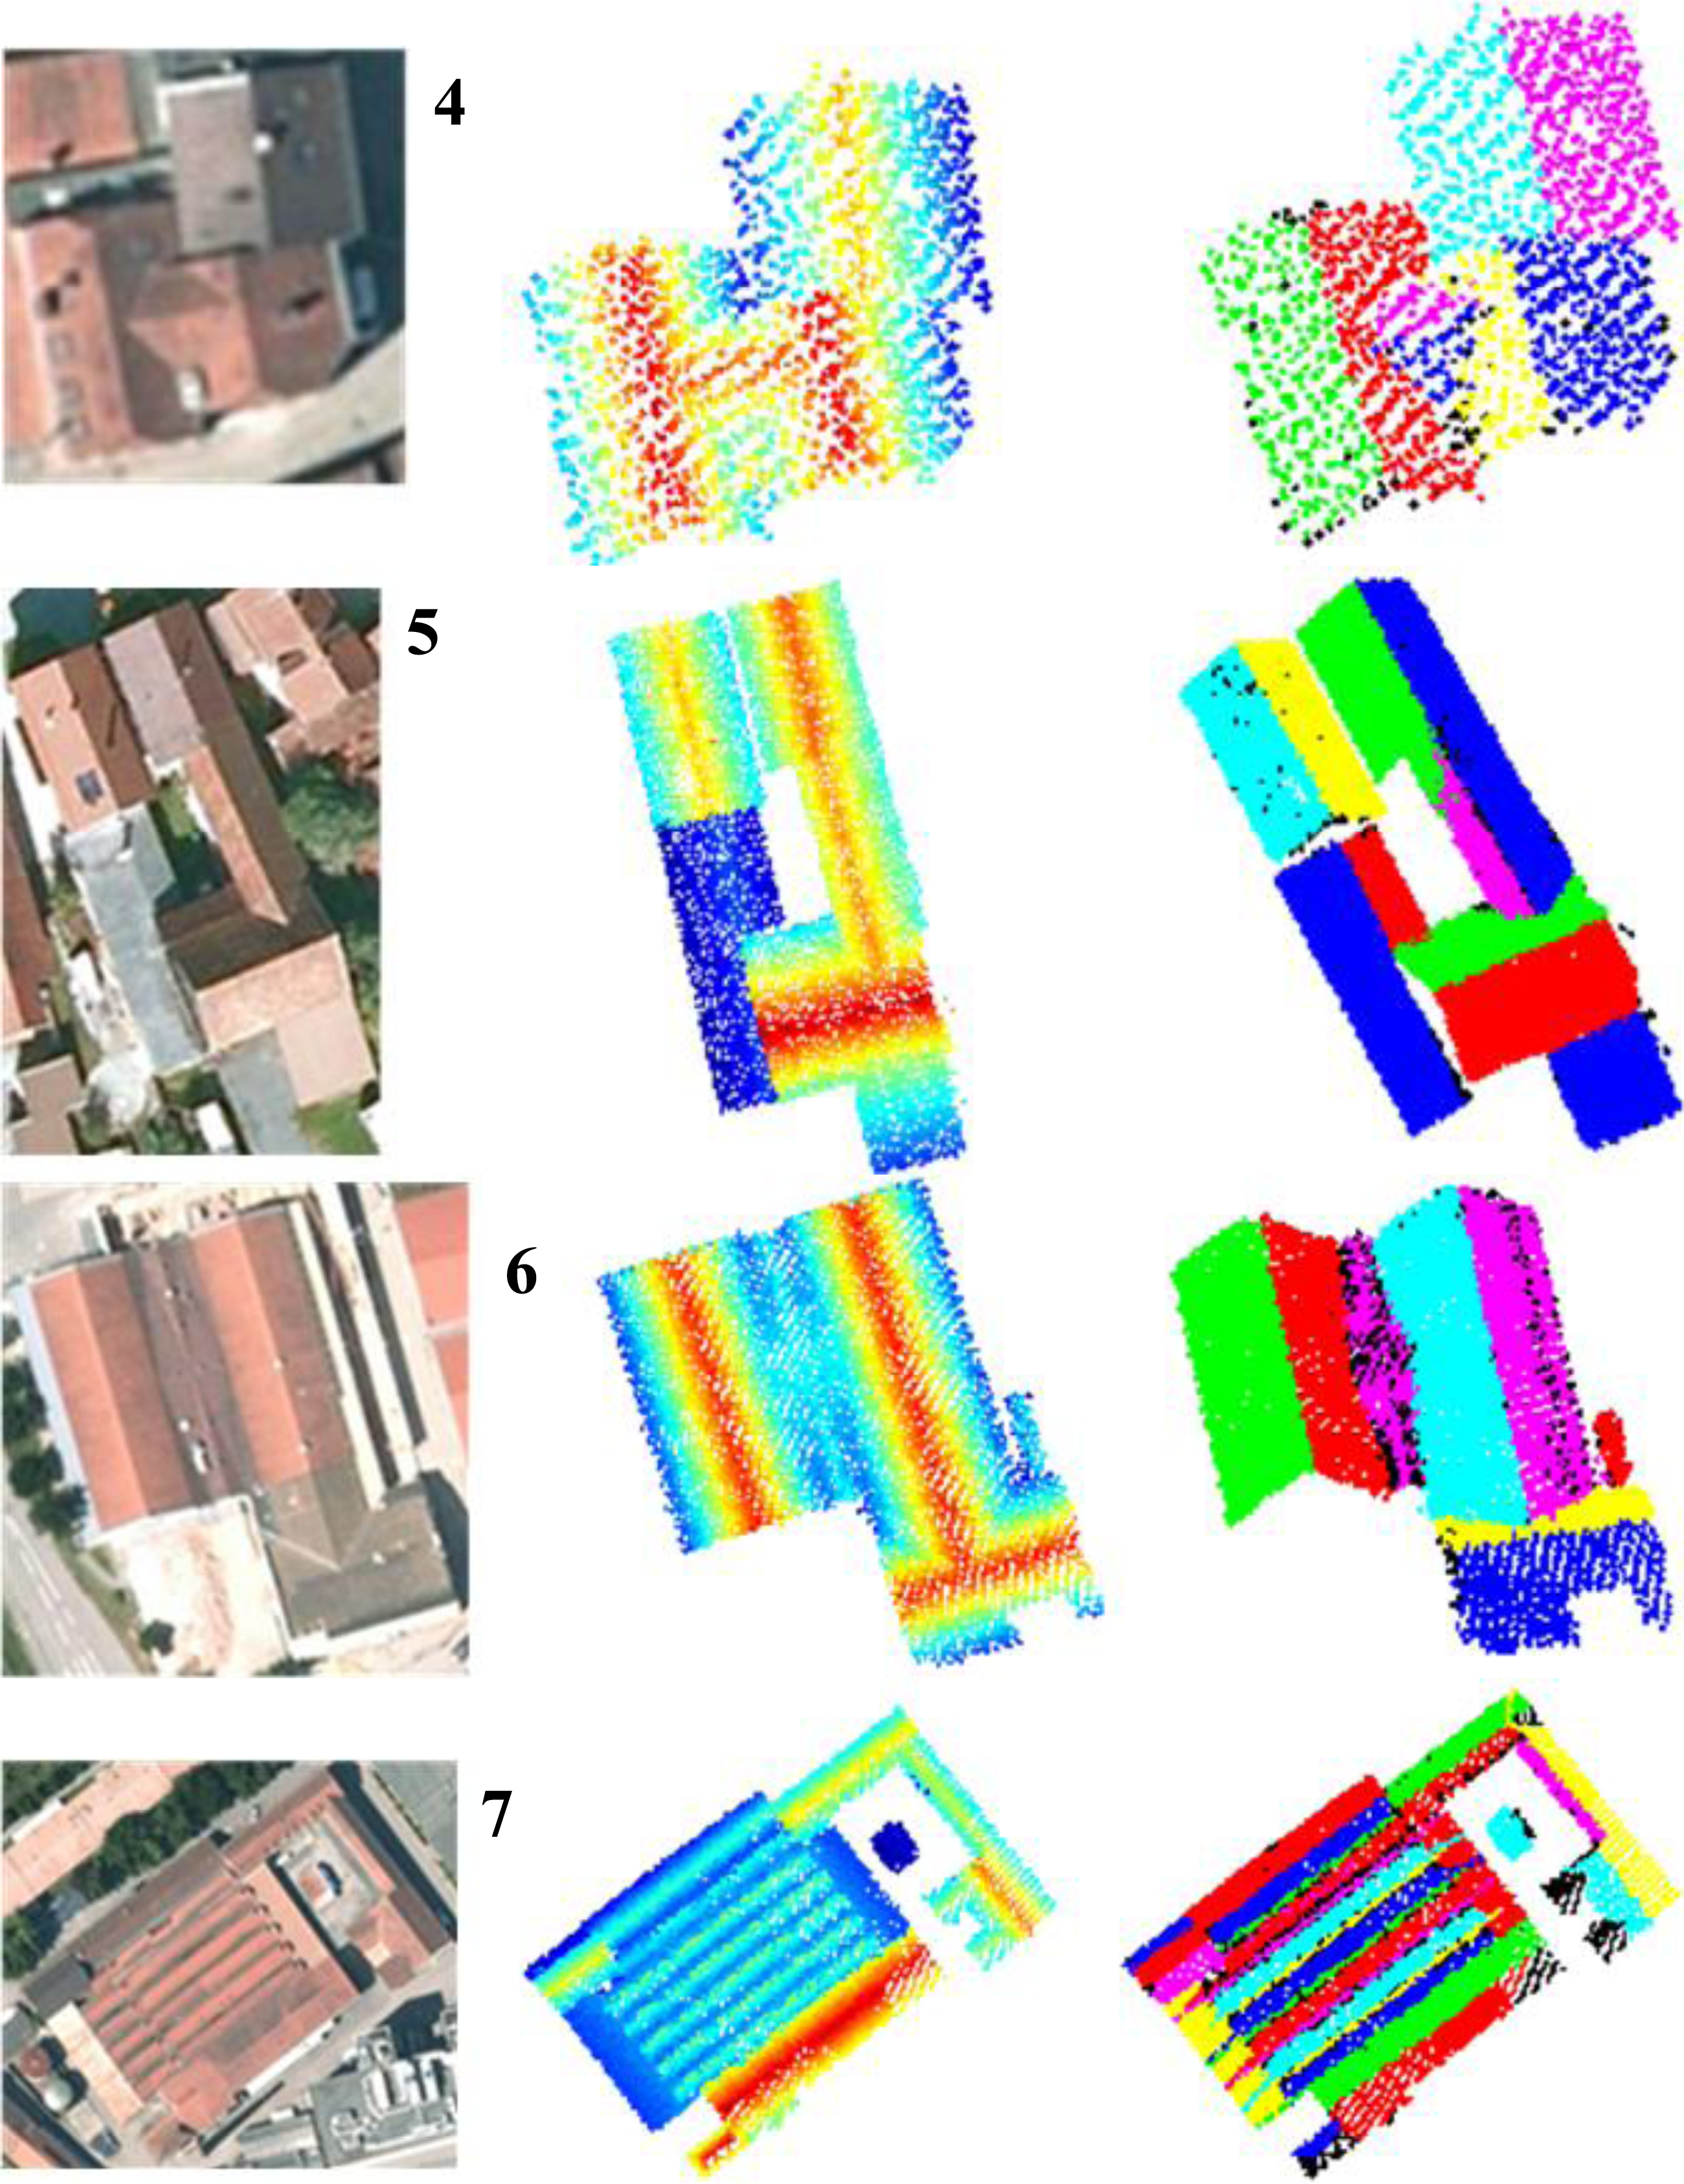
4.1. Evaluation of Segmented Roofs

The results of Subsection 3.2 show that 243 buildings are extracted in Regen and 136 buildings are extracted in Kirchhof. These buildings are categorized into five classes: 9 buildings with flat roof, 35 buildings with complicated roof (more than one roof ridges), 15 buildings with hipped roof, 4 buildings with pinnacle roof, and 316 buildings with simple gabled roof.
These building roofs except the 9 flat roofs are segmented using the proposed approach. Similar to the evaluation of segmented roof facets presented in [37], the results are compared to aerial image of Google map in a manner of visual inspection. It shows that (i) all the simple gabled roofs and hipped roofs are correctly segmented; (ii) 29 complicated roofs are correctly segmented; while (iii) there are missing segmentations on 6 complicated roofs; and (iv) the 4 pinnacle roofs are incorrectly segmented. Then, an overall correctness could be calculated as 360/370 = 97%. Figure 6 presents a selection of examples, where the buildings are structured with two or more roof ridges in order to show the capability of the presented algorithm. Despite the segmentation results, the aerial photos (from GoogleMap) and roof point clouds are also displayed to show the overall roof structure as well as roof ridges.
Through a visual comparison of the segmented roof facets with original LiDAR data, Table 2 gives the completeness of segmentation of the building roof in Figure 4 and the seven building roofs in Figure 6. In Figure 5b, there is a small gabled roof attached with the main building (the upper left corner of Figure 5b.). In the experiment, the points on one of its side are segmented together with the neighboring large roof facet, because they are geometrically belonging to one object, although they are two roof facets semantically. Building (#5) in Figure 6 demonstrates a similar example. Semantically, there are two gabled roofs in the upper right part of the building. The ridge of the wide roof is situated a little bit higher than its neighbor. However, their roof facets on the right side of the ridges have almost the same slope. Therefore, they are segmented as one roof facet. On the left side, the wide roof facet (green dote between the blue and yellow parts) has a little bit gradual slope than its neighboring narrow roof facet (magenta dotes). Most points of these two roof facets are differentiated. Still, there are some errors in matching near the connection edges.
The geometrical accuracy of the boundary for segmented roof facets is also evaluated and displayed in Table 2. The vertices of a roof facet are manually selected and located in 3D point clouds. For each vertex of a segmented roof facet, the nearest boundary point of the corresponding roof plane in the reference is searched. This point does not necessarily correspond to a vertex of that polygon. The (3D) Euclidean distance d between the corresponding vertex points is calculated. If this distance is larger than a threshold (3 m in the example below), it is discarded. Finally, the RMS error of the distances RMSd is computed in Equation (7)
RMS d = d 2 N = ( ( x refi x resj ) 2 + ( y refi y resj ) 2 + ( z refi z resj ) 2 ) N
In the equation, xrefi, yrefi, zrefi and xresj, yresj, zresj are two coordinate values of vertex points of corresponding roof facets, being situated in the reference and the results, respectively. In both cases, N is the number of points for which a correspondence has been found within a predefined search buffer. While the numbers are given for “segmented roof facets”, the nearest point on the reference roof facet was determined for each vertex in the segmentation results.
Points are segmented on two types of roof facets, namely, gabled roof facets and roof facets connected by the gabled roofs. For the first type of roof facet, the minimum gabled roof facet that can be detected in our work is of 2 × 2 square meters, because we set two meters for the minimum length in the process of detecting ridge and searching for seed points. Therefore, point cloud of a smaller gabled roof upon a dormer window cannot be segmented and are treated as noise points, as shown in building #3 in Figure 6. After the gabled roofs are segmented, the remaining points are separated into several clusters. In each cluster, an adjusted plane is firstly fitted for the points in order to check if they belong to the same facet. Therefore, even smaller facet can be detected for the second type of roof facet. Such roof facets can be found in the building of Figure 3 and buildings (#3 and 6).
The building (#6) in Figure 6 has more than eight roof facets, because the connection part of the two gabled roofs is actually a special case of cross gabled roof. However, the ups and downs are not significant enough, so that they can be differentiated in the point cloud. Therefore, the points on this roof part are segmented as a flat roof facet (magenta dotes) with many noise points (black dotes).
A complicated structured industrial building (#7) in Regen challenges the presented approach. The average density of the building is six points per square meter. But the points are very unevenly distributed. The point density of the right building part is about 2–4 points/m2. On the dormer roofs upon the two roof windows, the average distance of neighboring points is 0.5 m along the fight path and 1.4 m in the across-track direction. Therefore, these two dormer roofs are not segmented, because no roof ridges can be detected from the point cloud. In addition, only one facet of the hipped roof (lower right of #7) can be segmented. The other three sides cannot be segmented due to the low density of the point clouds.

4.2. Computational Performance

This subsection studies the time efficiency of the proposed approach. The algorithm is implemented in Matlab 2009a. The program is carried on a PC with Intel(R) Xeon(R) CPU 3.3 GHz. Table 3 shows the computational performance of individual building roofs. It is obvious that the computational time depends strongly on the number of laser points. The iterations needed for plane fitting also affects the computation time, but not significantly. It can be used to evaluate the quality of the inputting data. In general, the proposed approach is very efficient.

5. Conclusions and Outlook

A simply gabled roof has two roof facets with a shared roof ridge which is situated on the top of the roof and parallel to the horizon. A simply hipped roof consists of a gabled roof and two disconnected roof facets (separated by the gabled roof). In this way, any arbitrarily complicated roof can be decomposed in a set of gabled roofs and a set of single roof facets. In this work we exploit this kind of decomposition for two reasons. Firstly, it can describe almost all kinds of roofs except pyramid shaped roofs and roofs with strongly curved shape. Secondly, it benefits the process of point segmentation and the further roof reconstruction from laser scanning point cloud. The proposed approach is tailored for sloped roofs. In the first step, roof ridges are detected easily from the point cloud, since they are situated in the highest level in their locality. Concerning the segmentation, a detected roof ridge indicates the location and direction of a gabled roof. Hence, the search area and the resulted computation cost are reduced substantially. The reconstruction in the further step becomes less effortless, because many parameters, for instance, the position, angle, and size of the gabled roof can be calculated and used as priori knowledge for the model-driven approach; and topologies among the point segments are known for the data-driven approach. It should be noted that the detected roof ridges do not geometrically correspond to the exact roof ridges, because laser points may not exactly hit the ridges. To this end, roof ridges can be represented approximately, and this kind of inaccuracy does not have any influence on the further process of the segmentation.
In terms of segmentation accuracy, our experiments show good results. However, ambiguous segmentation exists where two roof facets are immediately adjacent to each other. Error segmentation occurs for some cross gabled roofs when the eaves of two gabled roofs are not at the same high level but the side gabled roof is lower than the main roof. In this case (building #1 and #2 in Figure 6), some points of the side gabled roof are segmented into the main roof, as the main roof is processed in advance. This problem cannot be solved by a recursive process, because those points are actually the intersections of the two fitted planes and connected closely to both of the roofs. However, it can be solved when reconstructing the roof polygons by using the rules that all the polygons on roofs are structured with straight line-segments and homogenous polygons which do not contain long and narrow extrusions.
In the presented work, building footprints data in OpenStreetMap is used to extract 3D points on individual roofs. However, the building footprints could not be used for polygonal modeling of roof structure in the further step, because on the one hand there are offset between OSM building footprint and the outline of buildings in reality; on the other hand OSM building footprints normally correspond to simplified version of the outline of building. The limitation of the proposed approach is that it has strict requirement for the density of LiDAR point clouds. It means that the point density of the input LiDAR data has to be high enough so that roof ridges can be detected. Otherwise, the method may fail. In the future, the proposed approach will be applied to ISPRS benchmark datasets [46] in order to evaluate the method within the international community. Additionally, the approach will be adapted for big cities in line with a cooperative project at our department. Both model-driven and data-driven approaches are going to be deployed in order to evaluate advantages of the proposed algorithm to these two approaches.

Acknowledgments

This work is supported by NSFC (National Natural Science Foundation of China) projects No:41101443 and 41201425, Open Fund of State Key Laboratory of Remote Sensing Science (Grant No. OFSLRSS201212) and the Klaus Tschira Foundation (KTS) in Germany.

Author Contributions

Hongchao Fan wrote the manuscript and was responsible for the research design, mathematical model and analysis. Wei Yao provided the data, and was responsible for data preparation, as well as the data analysis. Qing Fu supported the analysis and technical implementation. All of the authors contributed in editing and reviewing the manuscript. All of the authors contributed in editing and reviewing the manuscript.

Conflicts of Interest

The authors declare no conflict of interest.

References

  1. Roux, M.; McKeown, D.M. Feature Matching for Building Extraction from Multiple Views. Proceedings of the 1994 IEEE Computer Society Conference on Computer Vision and Pattern Recognition, Menterey, CA, USA, 21–23 June 1994; pp. 331–339.
  2. Wu, J.-W.; Sun, J.; Yao, W.; Stilla, U. Building Boundary Improvement for True Orthophoto Generation by Fusing Airborne LiDAR Data. Proceedings of the IEEE and ISPRS Joint Event on Urban Remote Sensing (JURSE2011), Munich, Germany, 11–13 April 2011; pp. 1–4.
  3. Chen, L.C.; Teo, T.A.; Shao, Y.C.; Lai, Y.C.; Rau, J.Y. Fusion of LIDAR data and optical imagery for building modelling. Int. Arch. Photogramm. Remote Sens. Spat. Inf. Sci 2004, 35, 586–591. [Google Scholar]
  4. Tarantino, E.; Figorito, B. Extracting buildings from true color stereo aerial images using a decision making strategy. Remote Sens 2011, 3, 1553–1567. [Google Scholar]
  5. Lin, C.; Huertas, A.; Nevatia, R. Detection of Buildings Using Perceptual Grouping and Shadows. Proceedings of the IEEE Computer Society Conference on Computer Vision and Pattern Recognition (CVPR), Seattle, WA, USA, 21–23 June 1994; pp. 62–69.
  6. Jaynes, C.; Marengoni, M.; Hanson, A.; Riseman, E.; Schultz, H. Knowledge-Directed Reconstruction from Multiple Aerial Images. Proceedings of the ARPA Image Understanding Workshop, New Orleans, LA, USA, May 1997; Volume II,. pp. 971–976.
  7. Noronha, S.; Nevatia, R. Detection and modeling of buildings from multiple aerial images. IEEE Trans. Pattern Anal. Mach. Intell 2011, 23, 501–518. [Google Scholar]
  8. Shi, F.; Xi, Y.; Li, X.; Duan, Y. An automation system of rooftop detection and 3D building modeling from aerial images. J. Intell. Robot. Syst 2011, 62, 383–396. [Google Scholar]
  9. Fischer, A.; Kolbe, T.H.; Lang, F.; Cremers, A.B.; Förstner, W.; Plümer, L.; Steinhage, V. Extracting buildings from aerial images using hierarchical aggregation in 2D and 3D. Comput. Vis. Image Underst 1998, 72, 185–203. [Google Scholar]
  10. Suveg, I.; Vosselman, G. Automatic 3D building reconstruction. Proc. SPIE 2002. [Google Scholar] [CrossRef]
  11. Hammoudi, K.; Dornaika, F.A. Featureless approach to 3D polyhedral building modeling from aerial images. Sensors 2011, 11, 228–259. [Google Scholar]
  12. Brunn, A.; Weidner, U. Extracting buildings from digital surface models. Int. Arch. Photogramm. Remote Sens 1997, 32, 17–19. [Google Scholar]
  13. Galvanin, E.A.S.; Poz, A.P.D. Extraction of building roof contours from lidar data using a Markov random field based approach. IEEE Trans. Geosci. Remote Sens 2012, 50, 981–987. [Google Scholar]
  14. Sirmacek, B.; Taubenbock, H.; Reinartz, P.; Ehlers, M. Performance evaluation for 3-D city model generation of six different DSMs from air and spaceborne sensors. IEEE J. Sel. Top. Appl 2012, 5, 59–70. [Google Scholar]
  15. Brenner, C. Building reconstruction from images and laser scanning. Int. J. Appl. Earth Obs. Geoinf 2005, 6, 187–198. [Google Scholar]
  16. Vosselman, G. Building reconstruction using planar faces in very high density height data. Int. Arch. Photogramm. Remote Sens 1999, 32, 87–92. [Google Scholar]
  17. Haala, N.; Kada, M. An update on automatic 3D building reconstruction. ISPRS J. Photogramm. Remote Sens 2010, 65, 570–580. [Google Scholar]
  18. Brenner, C. Interactive Modelling Tools for 3D Building Reconstruction. In Photogrammetric Week 99’; Fritsch, D., Spiller, R., Eds.; Wichmann Verlag: Berlin, Germany, 1999; pp. 23–34. [Google Scholar]
  19. Vosselman, G.; Dijkman, S. 3D building model reconstruction from point clouds and ground plans. Int. Arch. Photogramm. Remote Sens. Spat. Infor. Sci 2001, 34, 37–44. [Google Scholar]
  20. Alharthy, A.; Bethel, J. Heuristic Filtering and 3D Feature Extraction from Lidar Data. Proceedings of the ISPRS Commission III, Graz, Austria, 9–13 September 2002.
  21. You, S.; Hu, J.; Neumann, U.; Fox, P. Urban Site Modeling from Lidar. Proceedings of the Computational Science and Its Applications—ICCSA 2003, Montreal, QC, Canada, 18–21 May 2003; pp. 579–588.
  22. Rottensteiner, F.; Briese, C. Automatic Generation of Building Models from LiDAR Data and the Integration of Aerial Images. Proceedings of the ISPRS Working Group III/3 Workshop on 3-D Reconstruction from Airborne Laserscanner and InSAR Data, Dresden, Germany, 8–10 October 2003; Volume XXXIV. pp. 174–180.
  23. Hu, J.; You, S.; Neumann, U. Approaches to large-scale urban modeling. IEEE Comput. Graph. Appl 2003, 23, 62–69. [Google Scholar]
  24. Tack, F.; Buyuksalih, G.; Goossens, R. 3D building reconstruction based on given ground plan information and surface models extracted from spaceborne imagery. ISPRS J. Photogramm. Remote Sens 2012, 67, 52–64. [Google Scholar]
  25. Rottensteiner, R. Automatic generation of high-quality building models from LiDAR data. IEEE Comput. Graph. Appl 2003, 23, 42–50. [Google Scholar]
  26. Dorninger, P.; Pfeifer, N. A comprehensive automated 3D approach for building extraction, reconstruction, and regularization from airborne laser scanning point clouds. Sensors 2008, 8, 7323–7343. [Google Scholar]
  27. Maas, H.-G.; Vosselman, G. Two algorithms for extracting building models from raw laser altimetry data. ISPRS J. Photogramm. Remote Sens 1999, 54, 153–163. [Google Scholar]
  28. Tarsha-Kurdi, F.; Landes, T.; Grussenmeyer, P. Extended RANSAC algorithm for automatic detection of building roof planes from LiDAR data. Photogramm. J. Finl 2008, 21, 97–109. [Google Scholar]
  29. Hebel, M.; Stilla, U. Simultaneous calibration of ALS systems and alignment of multiview LiDAR scans of urban areas. IEEE Trans. Geosci. Remote Sens 2012, 50, 2364–2379. [Google Scholar]
  30. Susaki, J. Knowledge-based modeling of buildings in dense urban areas by combining airborne LiDAR data and aerial images. Remote Sens 2013, 5, 5944–5968. [Google Scholar]
  31. Huang, H.; Brenner, C.; Sester, M. A generative statistical approach to automatic 3D building roof reconstruction from laser scanning data. ISPRS J. Photogramm. Remote Sens 2013, 79, 29–43. [Google Scholar]
  32. Kada, M. Scale-Dependent Simplification of 3D Building Models Based on Cell Decomposition and Primitive Instancing. Proceedings of the 8th International Conference On Spatial Information Theory (COSIT’07), Melbourne, Australiia, 19–23 September 2007; Springer-Verlag: Berlin/Heidelberg, Germany; pp. 222–237.
  33. Haala, N.; Becker, S.; Kada, M. Cell Decomposition for the Generation of Building Models at Multiple Scales. Proceedings of the International Archives of Photogrammetry, Remote Sensing and Spatial Information Sciences (PCV06), Bonn, Germany, 20–22 September 2006.
  34. Henn, A.; Gröger, G.; Stroh, V.; Plümer, L. Model driven reconstruction of roofs from sparse LiDAR point clouds. ISPRS J. Photogramm. Remote Sens 2013, 76, 17–29. [Google Scholar]
  35. Oude Elberink, S.; Vosselman, G. Building reconstruction by target based graph matching on incomplete laser data: Analysis and limitations. Sensors 2009, 9, 6101–6118. [Google Scholar]
  36. Verma, V.; Kumar, R.; Hsu, S. 3D Building Detection and Modeling from Aerial LiDAR Data. Proceedings of the IEEE Computer Society Conference on Computer Vision and Pattern Recognition (CVPR), New York, NY, USA, 2006; Volume 2,. pp. 2213–2220.
  37. Kim, K.; Shan, J. Building roof modelling from airborne laser scanning data based on level set approach. ISPRS J. Photogramm. Remote Sens 2011, 66, 484–497. [Google Scholar]
  38. Sampath, A.; Shan, J. Segmentation and reconstruction of polyhedral building roofs from aerial LiDAR point clouds. IEEE Trans. Geosci. Remote Sens 2010, 48, 1554–1567. [Google Scholar]
  39. Zhou, Q.-Y.; Neumann, U. 2.5D Building Modeling by Discovering Global Regularities. Proceedings of the IEEE Computer Society Conference on Computer Vision and Pattern Recognition (CVPR), Providence, RI, USA, 16–21 June 2012; pp. 326–333.
  40. Rottensteiner, F.; Trinder, J.; Clode, S.; Kubik, K. Automated delineation of roof planes in LiDAR data. Int. Arch. Photogramm. Remote Sens. Spat. Inf. Sci 2008, 36, 221–226. [Google Scholar]
  41. Fischer, M.A.; Bolles, R. Random sample consensus: A paradigm for modelling fitting with applications to image analysis and automated cartography. Commun. ACM 1981, 24, 381–395. [Google Scholar]
  42. Jain, A.K.; Murty, M.N.P.; Flynn, J. Data clustering: A review. ACM Comput. Surv 1999, 31, 264–323. [Google Scholar]
  43. Duda, R.O.; Hart, P.E.; Stork, D.G. Unsupervised Learning and Clustering. In Pattern Classification, 2nd ed; Wiley: Hoboken, NJ, USA, 2001; pp. 519–598. [Google Scholar]
  44. Berkhin, P. A Survey of Clustering Data Mining Techniques. In Grouping Multidimensional Data: Recent Advances in Clustering; Kogan, J., Nicholas, C., Teboulle, M., Eds.; Springer-Verlag: New York, NY, USA, 2006; pp. 25–71. [Google Scholar]
  45. Fan, H.; Zipf, A.; Fu, Q.; Neis, P. Quality assessment of building footprints data on OpenStreetMap. Int. J. Geogr. Inf. Sci 2013, 28, 700–719. [Google Scholar]
  46. Rottensteiner, F.; Sohn, G.; Gerke, M.; Wegner, J.D.; Breitkopf, U.; Jung, J. Results of the ISPRS benchmark on urban object detection and 3D building reconstruction. ISPRS J. Photogramm. Remote Sens 2014, in press.. [Google Scholar]
Figure 1. Detection of roof ridges using RANdom Sample Consensus (RANSAC) line detection. (a) Aerial photo from Google Map. (b) point clouds of building sorted by height. (c) linear component detected by RANSAC. (d) detected roof ridges.
Remotesensing 06 03284f1
Figure 2. Segmentation of a simple gabled roof (hipped roof as a special case). (a) Aerial photo from Google Map. (b) divided by ridge plane into two groups. (c) Seed planes along the roof ridge. (d) segmentation along roof ridge. (e) Segmentation of rest points. (f) final result.
Remotesensing 06 03284f2
Figure 3. Segmentation of a complicated roof: (a) aerial photo from Google Map. (b) the roof point cloud sorted by height. (c) seed points (yellow and magenta dotes) of roof facets along roof ridges at first level. (d) segmentation of roof facets (red and green dotes) along roof ridges at first level, the blue dotes are the rest points. (e) clustering of the remaning points (Upper) and segmenation along the ridge at the second level (Lower). (f) final result, black dots are the noises.
Remotesensing 06 03284f3
Figure 4. Experimental data sets: (a) Regen and (b) Kirchhof.
Remotesensing 06 03284f4
Figure 5. Extracting roof points aided by OpenStreetMap (OSM) footprints data. (a) LAS point clouds overlapped with OSM footprints. (b) offset between building points and OSM footprint. (c) building points extracted with help of OSM building footprint. (d) histogram analysis ofextracted building points along height. (e) final result of extracted roof points.
Remotesensing 06 03284f5
Figure 6. Segmented roof, from left to right: aerial photo, roof point cloud sorted by height, and segmented roof (noise points with black dotes).
Remotesensing 06 03284f6aRemotesensing 06 03284f6b
Table 1. Property summary of the two data sets.
LocationEquipmentDate of AcquisitionAverage Point DensityScan Angle
RegenRiegl LMS-Q5602007 May6+30°
KirchdorfRiegl LMS-Q5602007 May9+30°
Table 2. Completeness of the segmentation.
Figure ##Building# Segmented Roof Facets# Roof Facets in DataCompleteness (%)Geometric Accuracy (RMSdm)
31121392.30.17
1441000.24
2661000.31
3551000.37
64881001.09
59.71188.20.35
6881000.46
7283482.40.45

Mean95.40.43
Table 3. Computational performance of individual building.
Figure #Building #Number of Points# Average Iterations of Plane FittingComputation Time (s)
4113,3627.38.49
159523.81.89
246974.01.21
345544.01.05
5415515.90.66
517,7885.39.51
685227.47.91
715,42610.317.44

Mean6.02

