1. Introduction
The National Polar-orbiting Partnership (NPP) is the first in a series of next-generation of polar orbiting environmental satellites, serving as risk reduction to the future Joint Polar Satellite System (JPSS) U.S. operational program. It was launched into a sun-synchronous 1330 local time ascending node orbit on 28 October 2011. On 24 January 2012, NPP was formally christened ‘
Suomi NPP,’ (hereafter, S-NPP) in honor of environmental satellite pioneer Verner E. Suomi [
1]. S-NPP orbits the Earth at roughly 834 km altitude and completes a single orbit in ~101 min. As such, it provides daily global coverage upon completion of roughly 14 orbits. S-NPP carries five earth-observing sensors: the Visible Infrared Imaging Radiometer Suite (VIIRS), the Cross-track Infrared Sounder (CrIS), the Advanced Technology Microwave Sounder (ATMS), the Ozone Mapping and Profiler Suite (OMPS), and the Clouds and the Earth’s Radiant Energy System (CERES). Most of these instruments provide significantly improved observations over their heritage sensor counterparts. S-NPP data are used in NOAA’s operational weather forecasts, and provide continuity to NASA’s research in climate change, Earth’s energy budget, and the global cycling of water and carbon.
VIIRS collects both visible and infrared imagery spanning from 0.4–12 μm, and combines key capabilities of several legacy instruments: Advanced Very High Resolution Radiometer (AVHRR), the Moderate-resolution Imaging Spectroradiometer (MODIS), and the Operational Linescan System (OLS). Perhaps the most unique component of VIIRS is the Day/Night Band (DNB) [
2], which has the ability to collect visible/near-infrared (500–900 nm spectral response) imagery during both day and night. The DNB has very high sensitivity to small amounts of light present in its band pass, and is capable of detecting from its orbital altitude the light emitted from a single isolated street lamp [
3,
4,
5]. The DNB offers a wide range of applications at night [
6], ranging from fire detection, meteorological phenomena to observations of anthropogenic light sources. It has become apparent that the scope of possible applications far exceeds the basic nocturnal imagery requirement that drove the DNB’s design.
While meteorological phenomena observed via natural light sources (e.g., moonlight) are mainstays of DNB’s utility to forecasters, this paper examines the DNB’s usage to observe anthropogenic light emission sources, with particular emphasis on the activity of maritime vessels. While navigation lighting on maritime vessels, defined by the International Regulations for Preventing Collisions at Sea 1972 (Colregs) [
7], notionally is too weak to be detected by the DNB as a point light source, many commercial maritime vessels operate far more powerful lights than those required by the regulations. For example, some fishing boats use strong lights as part of their operations. In particular, squid boats utilize an extreme form of light-luring, operating large arrays of high-powered lamps that emit up to 300 kW per vessel [
8]. Certain non-fishing vessels also emit levels of light sufficient for DNB detection. Examples include icebreakers, which operate searchlights and other high intensity forms of lighting for navigating ice at night. Also facilitating detection is the fact that most maritime vessels operate away from other natural and anthropogenic light sources, such as cities, making their singular sources easier to discern in DNB imagery.
Whereas the literature is replete with OLS-based studies on various fishing activities [
9,
10,
11], attributes of the higher spatial resolution of the DNB over the OLS (750 m at nadir for the DNB as compared to 5 km for the OLS) which may allow for refined comparisons, e.g., of the complex fishery agreements in various regions of the world, have yet to be examined. This paper explores three illustrative case studies highlighting the improved ability of the DNB to observe ship lights. We compare the capabilities of the DNB and the OLS for ship light detection, demonstrate the utility of this improved detection in the arena of operational support, and examine the research potential of these measurements in the context of gaining a statistical perspective on fishing activity over a given region, as well as adherence to international fishing agreements. Through these examples, we aim to spur a reinvigoration of research in these areas based on the wealth of new information content present in the DNB observations.
2. Tracking Ship Movements
A more expedient and economical intercontinental transport of goods between the mid-latitude nations of the Northern hemisphere has long stood as motivation for a northern passage, via the Arctic, as an alternative to the Suez Canal in Egypt. While the original idea of such a route dated back to the 1500s, it was not until 1878 that the first passage of the Northern Sea Route (NSR) was completed [
12]. Some segments of the NSR are free of ice for only two months per year and require the use of icebreakers to escort convoys of commercial boats through the ice packed portions of the route. The development of nuclear-powered icebreakers by the former Soviet Union first allowed for the regular transit of the NSR. These ships are among the largest and most powerful icebreakers in the world. The
Taimyr class ships are shallow draft ships intended for coastal icebreaking operations [
13], equipped to handle ice up to 2 m thick. As with most large vessels, sufficient on-deck lighting permits their detection by the DNB.
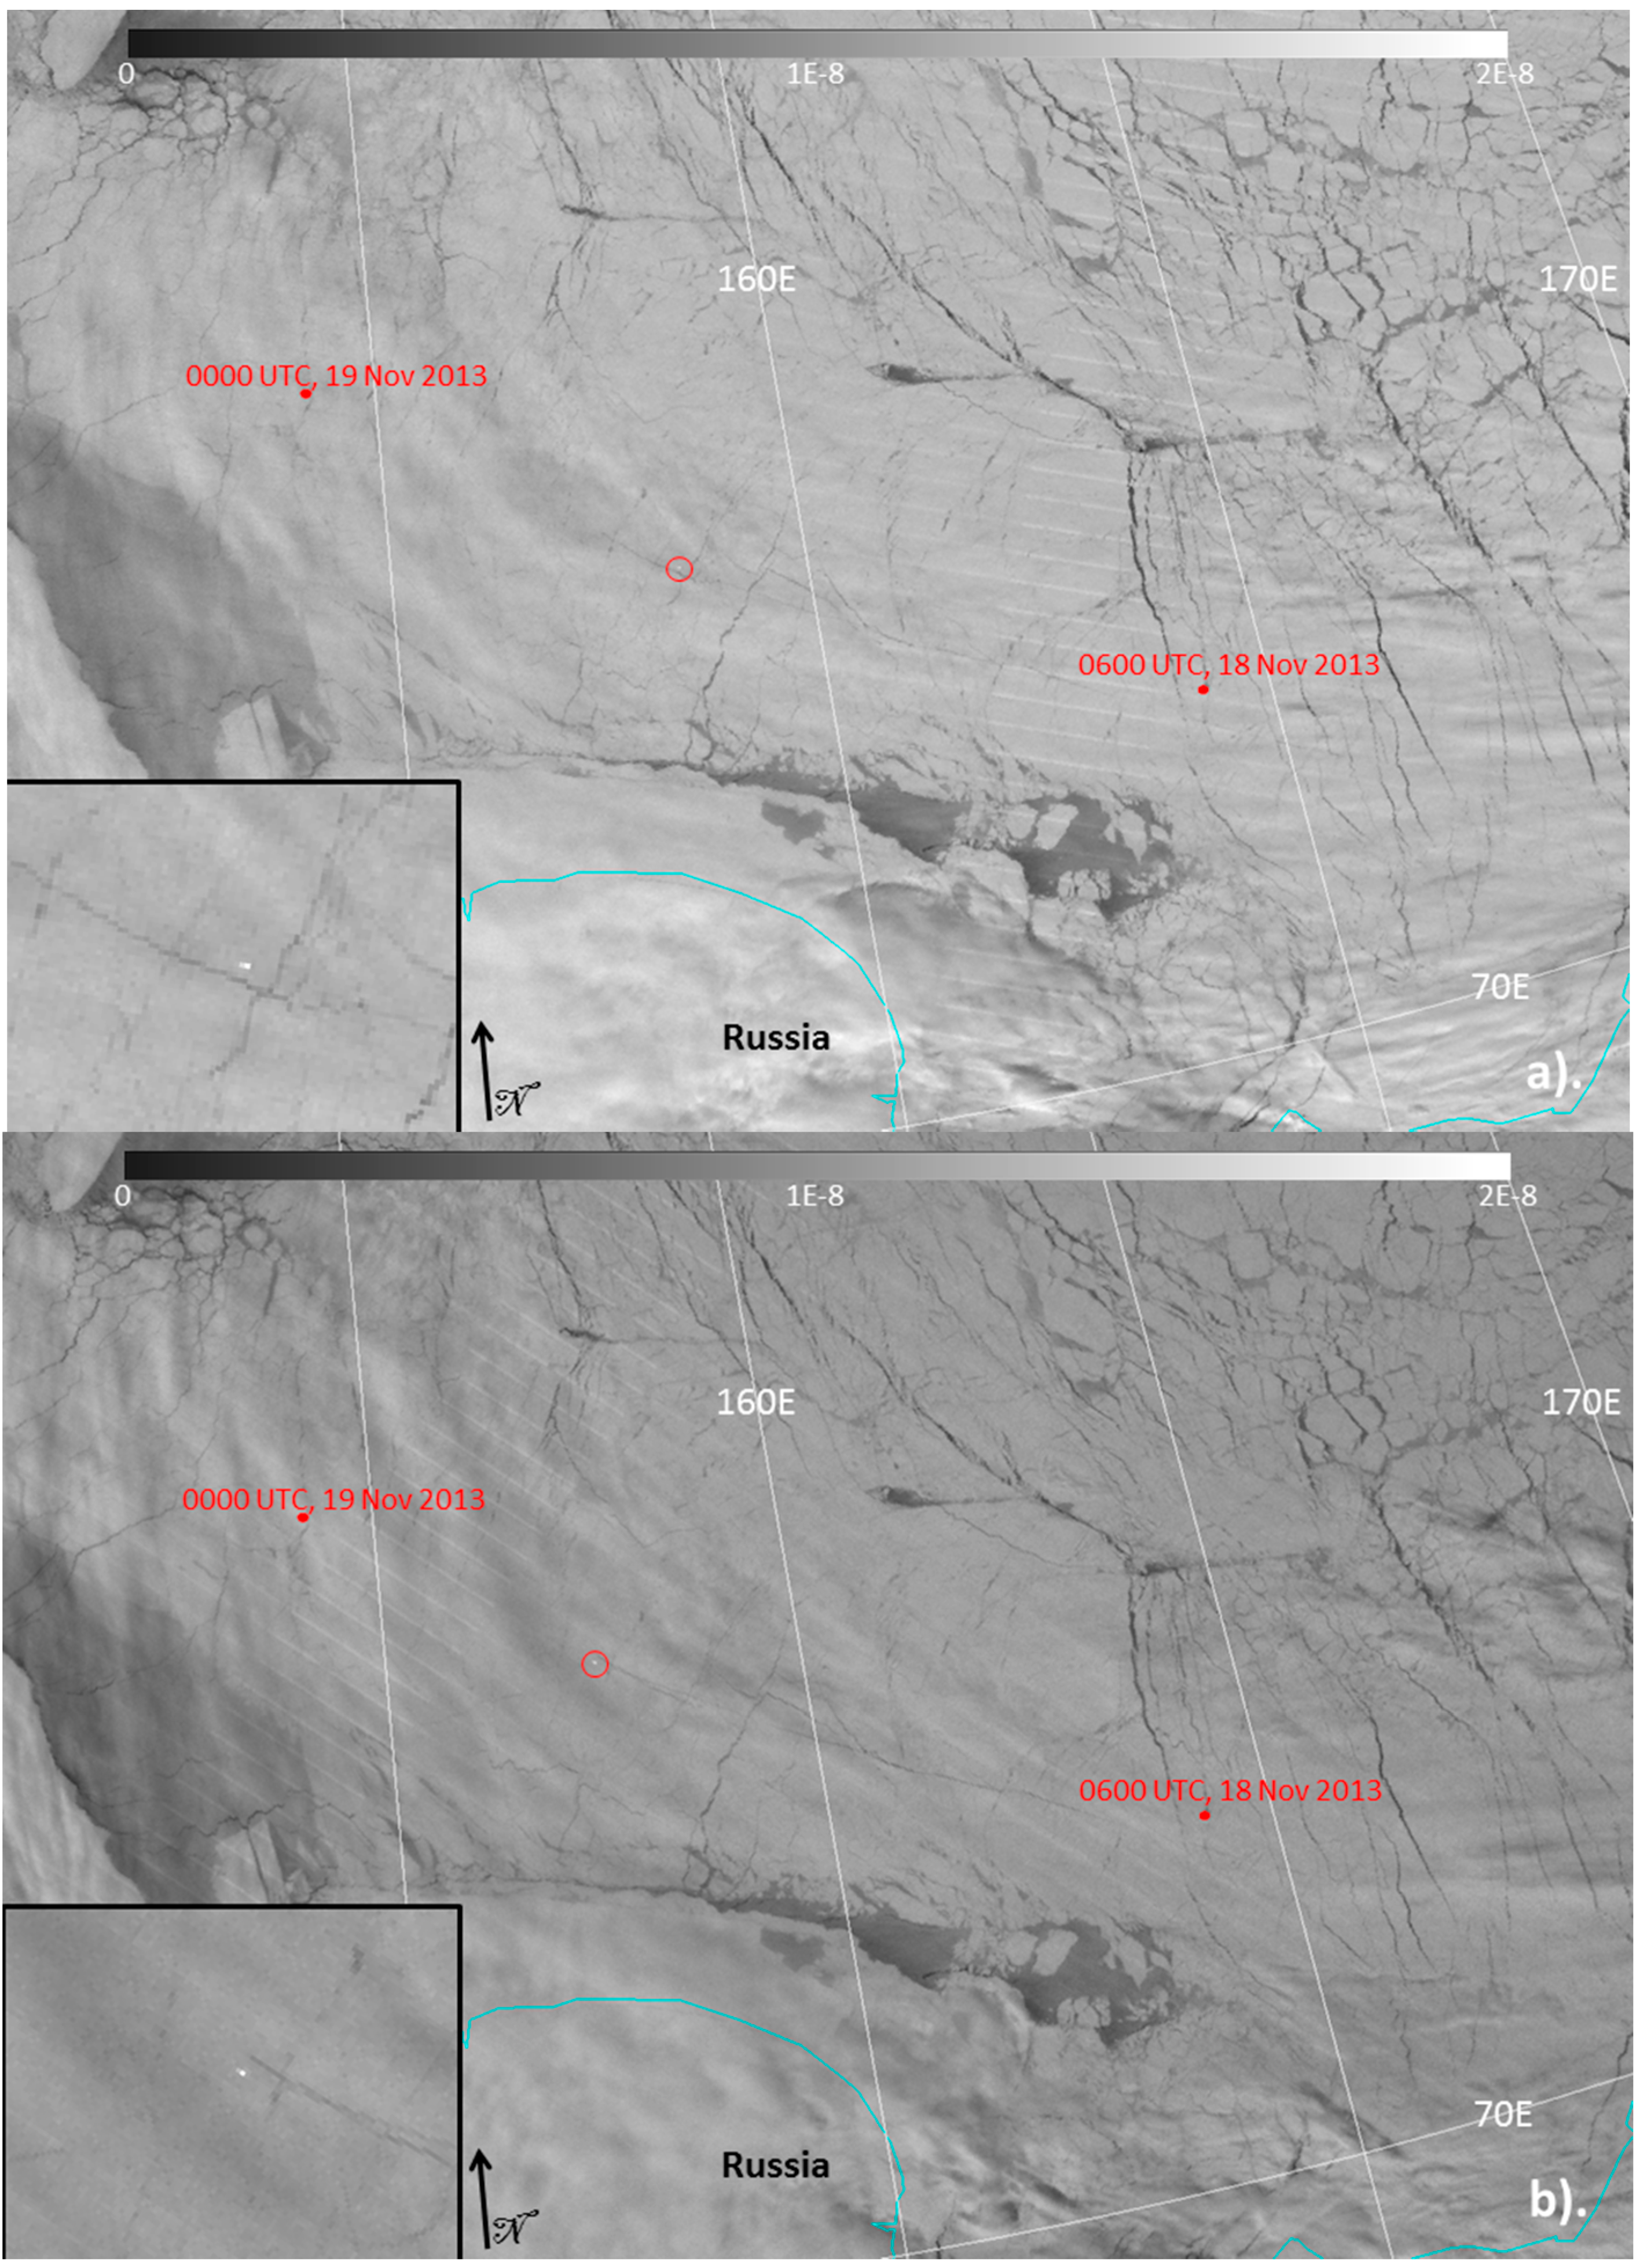
Figure 1 and
Figure 2 demonstrate the DNB’s unique ability to monitor ship transits in the Polar Regions. DNB imagery from two successive passes of Suomi NPP on 18 November 2013 are shown in
Figure 1a (1554 UTC) and
Figure 1b (1735 UTC). Here, the light emitted by the
Taimyr at roughly 72N, 158E (circled in red to highlight the ship light and shown as an inset in
Figure 1a,b). Positions of the
Taimyr from 0600UTC on 18 November 2013 (71.3°N, 164°E) and 0000 UTC on 19 November 2013 (72.9°N 153.9°E) were available from the World Meteorological Organization’s Voluntary Observing Ship (VOS) scheme [
14]. While these data do not match the exact times of the satellite overpasses, they provide approximate locations of ships and offer a notional ground truth for ship identification. The VOS positions for the
Taimyr overlaid in
Figure 1 were obtained from sailwx.info (
http://www.sailwx.info/shiptrack/shipdump.phtml?call=UEMM), who allowed us to utilize their database (Personal Communication with Hal Mueller, 2014).
Figure 1.
DNB imagery from 1554UTC on 18 November 2013 (
a) and 1735UTC on 18 November 2013 (
b). The VOS locations of Taimyr from sailwx.info (
http://www.sailwx.info/shiptrack/shipdump.phtml?call=UEMM) are also shown as red dots on the image. The location of the Taimyr is circled in red. Inset shows zoomed image of ship light. Values are W·cm
−2·sr
−1.
Multiple satellite observations separated in time can be used to estimate vectors of ship travel. An estimation of the speed of the Taimyr was derived from the two successive VIIRS passes. In the 15:54:43 UTC pass, the ship light is located at 72.16221°N 158.4802°E. In the 17:35:44 UTC image, the light from the ship is located at 72.3142°N 157.5319°E. Thus, in roughly 1 h and 41 min, the Taimyr traveled roughly 36.38 km, suggesting an average velocity of 21.61 km/h (~11.67 knots). Using the VOS positions, a distance of roughly 387.7 km was traversed in 18 h, with an average speed of 21.5 km/h (~11.61 knots). In light of assumptions on constant motion between the two points and a single vector of travel, the satellite and VOS-derived vectors are in reasonable agreement. The estimates are also consistent with the conditions. For reference, the open water speed of the Taimyr is 18.5 knots (about 60% faster than what was observed) and is 3 knots when traveling through 2.2 m thick ice. With additional data from the operators of the Taimyr (Atomflot and the Russian government), an empirical relationship between observed speed and mean ice thickness over the path traversed may be inferable from the ship light data.
While the transit of the
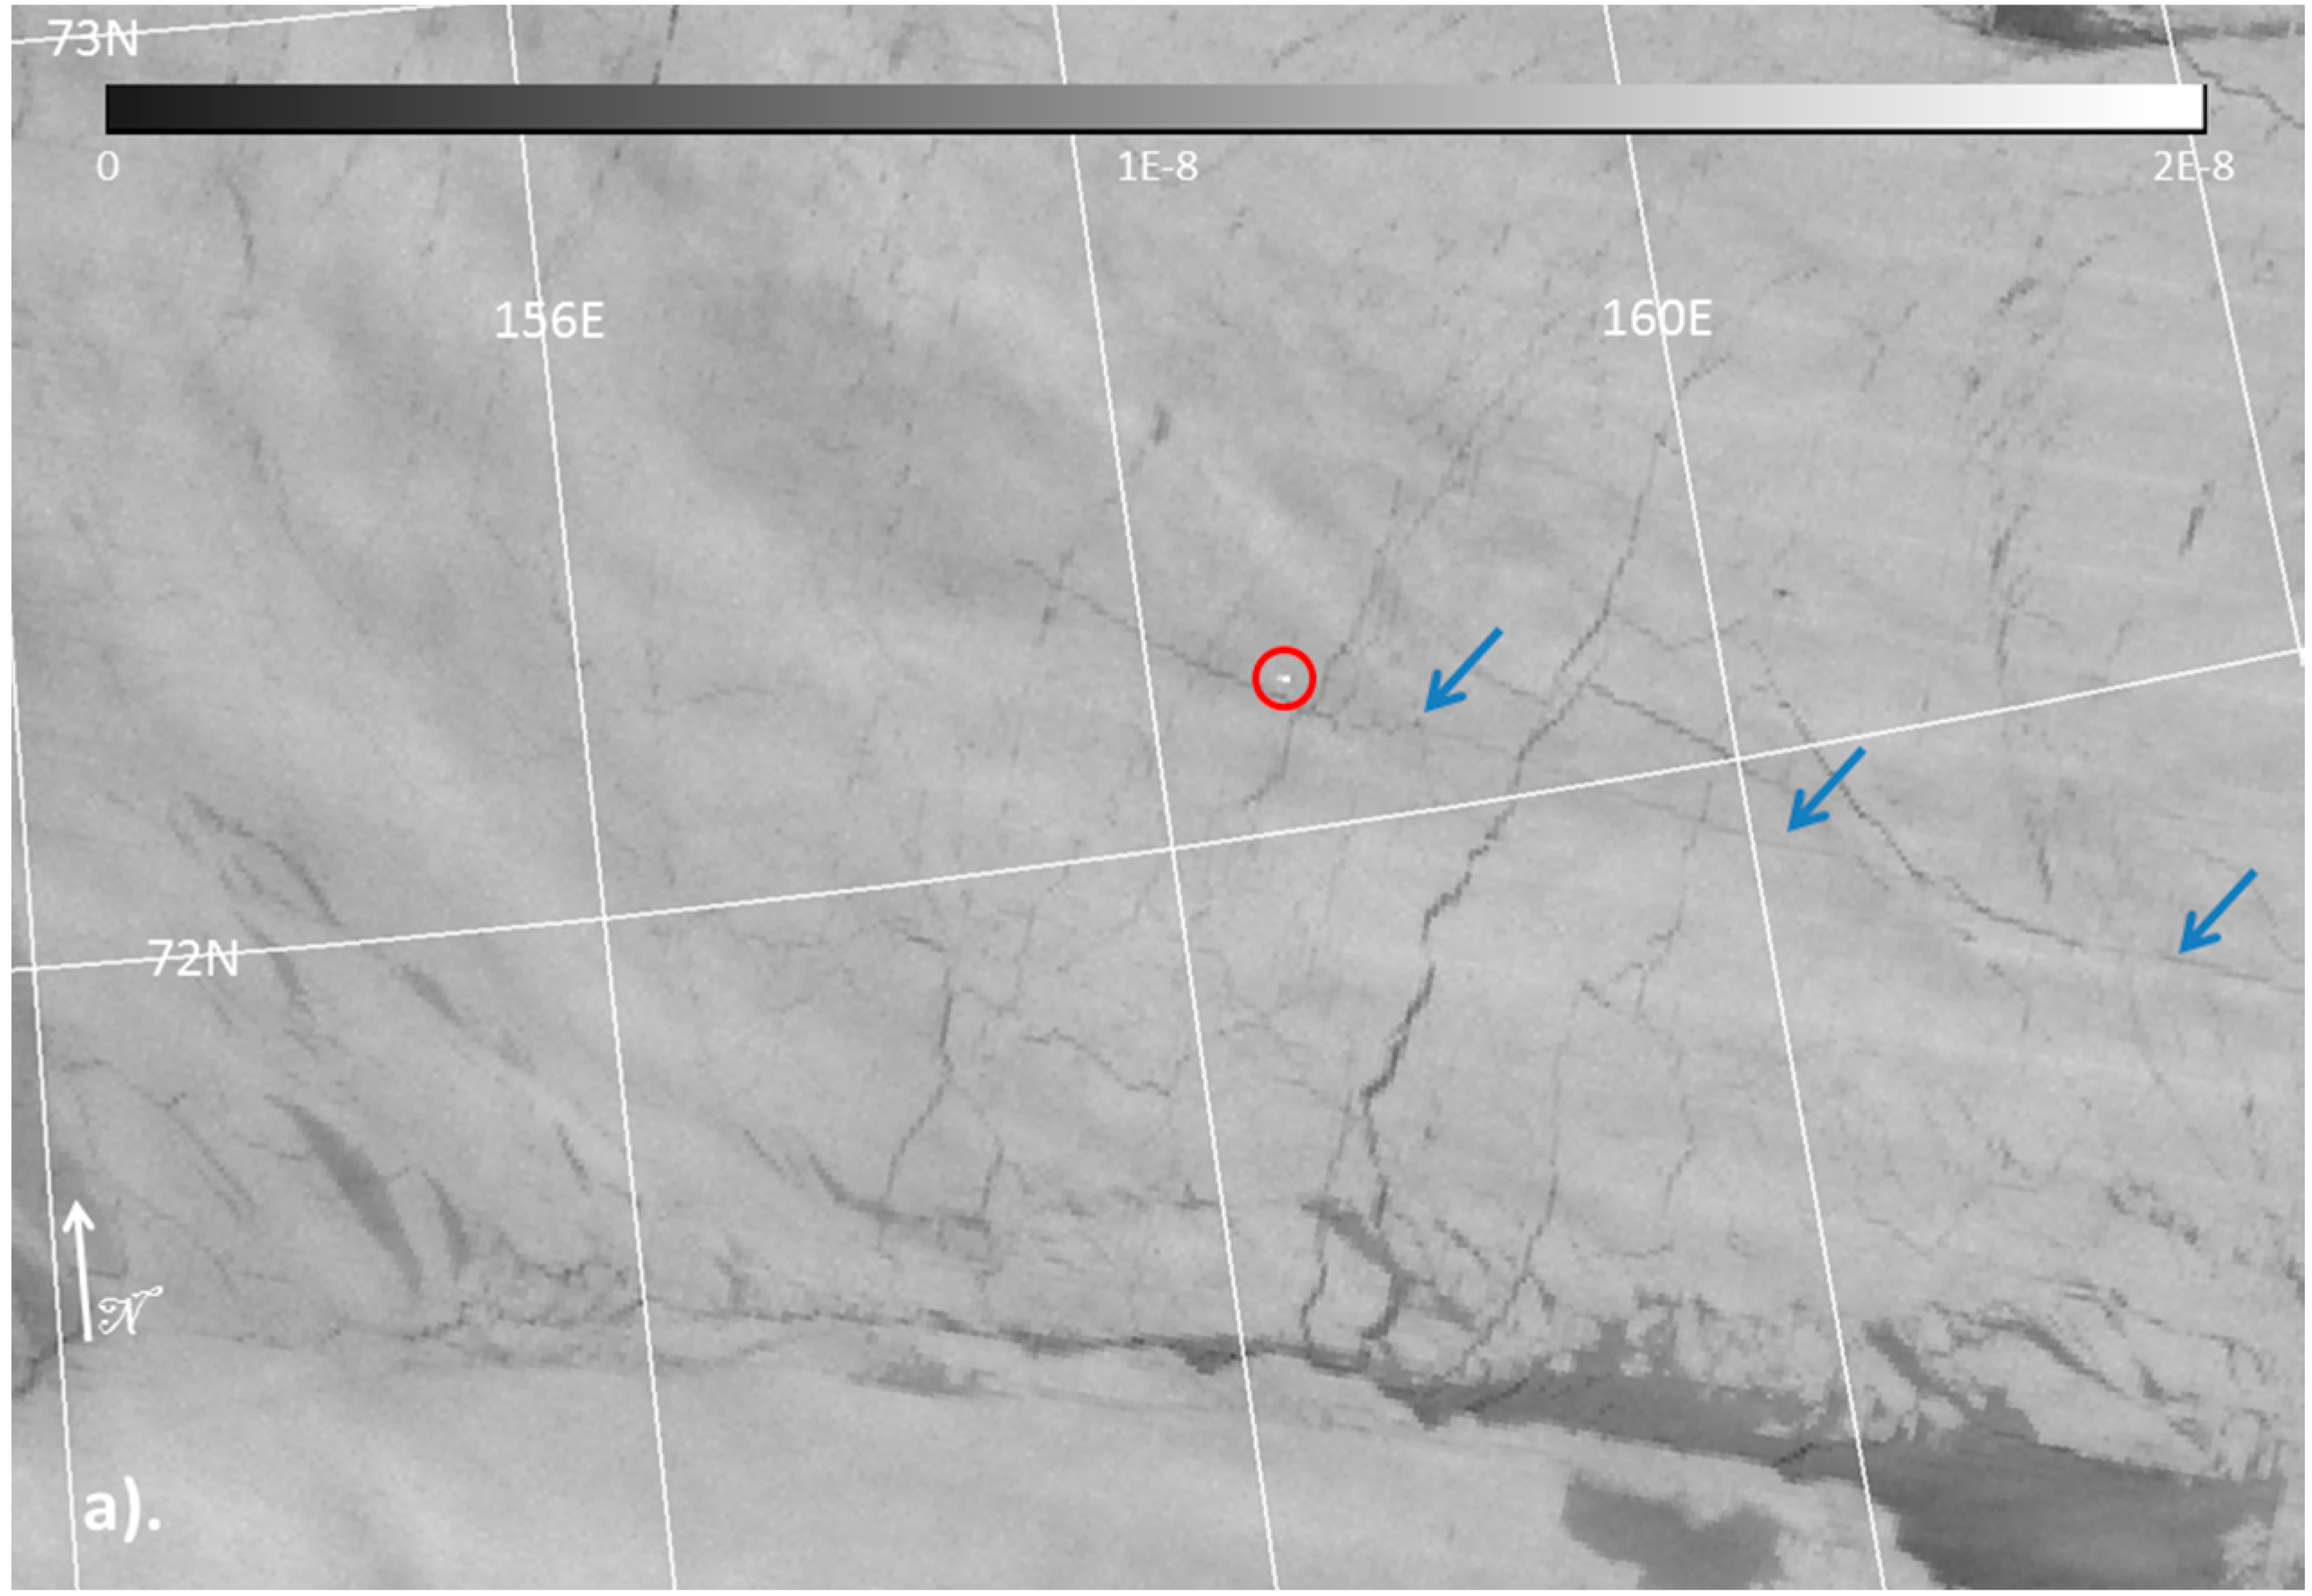
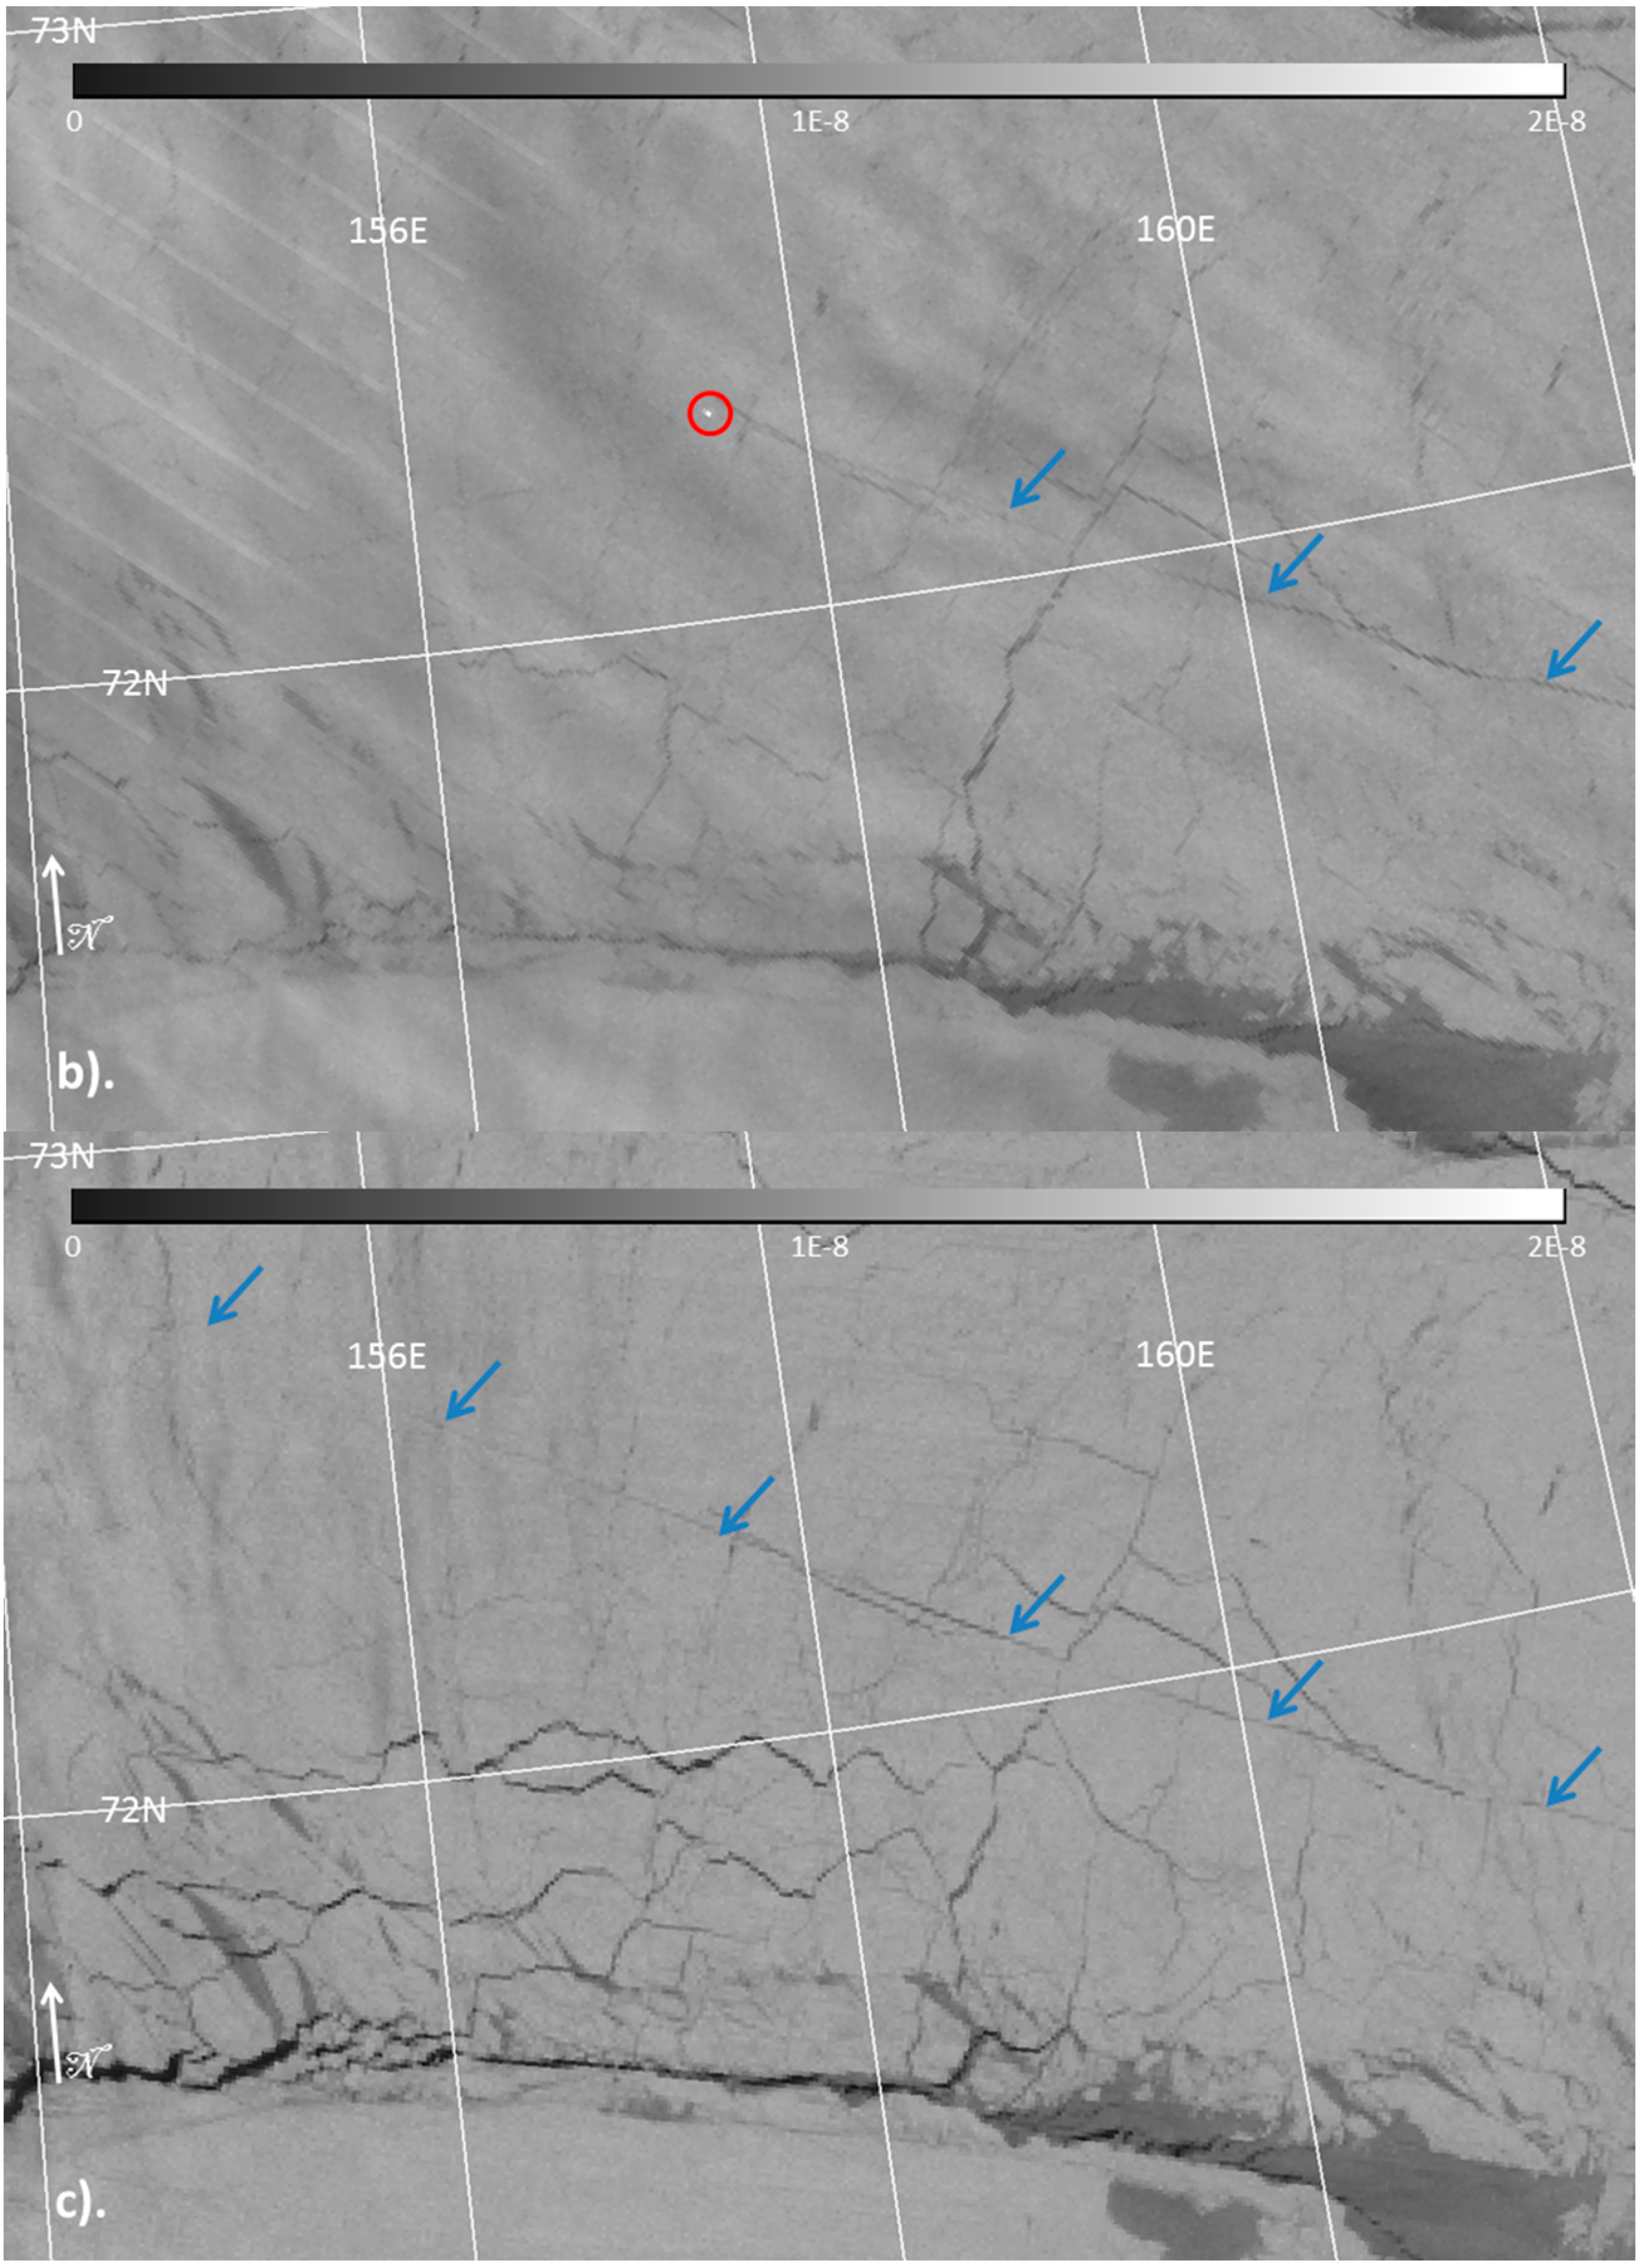
Taimyr illustrates a unique way in which the DNB can assist in the tracking of various ships as they transit the NSR, a particularly compelling additional capability emerged during close inspection of this case study. By virtue of moonlight, details of the highly reflective sea ice, including fissures and leads where darker (low albedo) ocean waters provide strong reflective contrast, were easily discerned in the DNB imagery. Careful inspection of the multi-pass series of satellite imagery revealed the subsequent breakup of the sea ice along the path of the
Taimyr as it transited the Arctic Sea. The emerging ice lead, oriented along the
Taimyr’s vector of travel is highlighted by arrows in
Figure 2a–c. The transit of the
Taimyr in the 1553 UTC and 1734 UTC passes on 18 November 2013 is marked by the red circle in
Figure 2a,b. By the next S-NPP overpass at 1543 UTC pass on 19 November 2013,
Figure 2c, the
Taimyr was well to the west of the region shown, as indicated by the lack of the light from the ship. However, a fresh sea ice lead formed by the transit of the
Taimyr is indicated by the set of blue arrows in all three images. Many other naturally occurring fissures are also present across this ice sheet. The ability to observe these detailed spatial changes in the nocturnal sea ice from satellite-based low-light visible imaging is unprecedented.
Figure 2.
DNB imagery from 1553UTC on 18 November 2013 (a), 1734UTC on 18 November 2013 (b), and 1534UTC on 19 November 2013 (c). The location of the light of the Taimyr is circled in red. The blue arrow shows the crack formed by the transit of the Taimyr. Values are W·cm−2·sr−1.
Figure 2.
DNB imagery from 1553UTC on 18 November 2013 (a), 1734UTC on 18 November 2013 (b), and 1534UTC on 19 November 2013 (c). The location of the light of the Taimyr is circled in red. The blue arrow shows the crack formed by the transit of the Taimyr. Values are W·cm−2·sr−1.
The DNB’s low-light visible capability bears particular relevance to increased maritime operations in the Arctic during the winter months, when very short days and copious cloud cover serve to confuse and obscure sea ice details in the thermal channels [
6]. So long as ships are far removed from any other light sources (
i.e., aurora, other ships, cities, gas flares,
etc., that might make it difficult to identify an isolated ship) and are not completely obscured by clouds, such as in this example, their progress can be tracked. It is worth pointing out that even with thin clouds, the bright lights from the icebreakers, though diffused, can be seen.
To qualify the advances of the DNB over heritage sensors in the capacity of ship tracking, we consider the OLS from the Defense Meteorological Satellite Program (DMSP). The DMSP satellites also operate in a low earth orbit. One of the current operational DMSP satellites, designated F18, which flies a sun-synchronous orbit with ~0800 local time, descending node, crossed the region the
Taimyr was located (per VOS data) four times on 18 November 2013 at between 0503UTC and 1009 UTC. Given the previously demonstrated ability for the OLS to pick out fishing activities [
9,
10,
11], it might be possible for it to resolve the powerful lights from the
Taimyr. One of the OLS passes, from 0827 UTC on 18 November 2013, is shown in
Figure 3.
Figure 3.
Operational Linescan System (OLS) imagery from 18 November 2013 at 0827 UTC. Values are in OLS count space.
Figure 3.
Operational Linescan System (OLS) imagery from 18 November 2013 at 0827 UTC. Values are in OLS count space.
Because the
Taimyr was moving at roughly 12 knots, the ship is present somewhere in the region spanned by the OLS imagery. However, the F18 OLS imagery (
Figure 3) gives no obvious indication of the same isolated ship light feature seen in
Figure 2 by the DNB. Under aggressive scaling, other features such as ice leads are marginally observable, but the ship is not discernible. The cause for this missed detection is most likely tied to spatial resolution limitations. The OLS offers significantly lower spatial resolution than the DNB (45–88 times coarser, depending on position in scan; Miller
et al., 2013), meaning that small features such as a ship light would be far more difficult to detect uniquely in OLS imagery due to spatial averaging. The challenges are augmented when the surrounding background (in this case, widespread sea ice) reflects moonlight strongly. As inferred from the sea ice details, during the period of these observations there was a waning gibbous moon, with significant moonlight present.
3. Supporting Operational Navigation
We demonstrated in the previous section that even under moonlit conditions, the DNB has sufficient sensitivity to identify and notionally track ship lights. We also demonstrated that under the moonlit conditions the DNB has a unique ability to provide high-resolution detail of sea ice structure. These capabilities can in principle be leveraged to the benefit of maritime operations, and we explore here one noteworthy example of this concept put into practice under the most extreme environmental conditions and challenging levels of illumination.
Alaskan king crab fishing has an occupational fatality rate that is 36 times the rate of all other U.S. occupations [
15,
16], and for this it earns the distinction of being among the world’s most dangerous professions. The season is conducted during the fall and winter months in the waters off the coast of Alaska and the Aleutian Islands. The boats often operate near the ice pack in order to avoid freezing ocean spray, which would freeze upon contact and coat the upper portions of the vessel, making it unstable and prone to capsizing under the force of accompanying strong winds. However, operating near ice pack introduces its own array of hazards.
During the second week of February 2013, the F/V Kiska Sea, a fishing vessel that has been featured as part of the Deadliest Catch reality television series on the Discovery Channel, was operating as the northernmost vessel of the Bering Sea crab fleet, close to the sea ice edge. Recent passage of a polar low-pressure system brought strong northerly winds across the central Bering Sea, causing a rapid advance of sea ice that threatened to encroach on the region where the fleet had placed over 150 crab pots. On 10 February 2013 the Kiska Sea encountered significant sea ice near the location where they had placed these pots, prompting the ship’s captain to request assistance from the Ice Desk at the National Weather Service, based in Anchorage, AK. Ice Desk analysts examined the previous night’s DNB imagery, provided by Geographic Information Network of Alaska’s (GINA) direct broadcast antenna located in Fairbanks, AK, along with the navigation information provided by the captain of the Kiska Sea, and confirmed that the ice was indeed encroaching on the ship’s location. The Kiska Sea and the Ice Desk continued to exchange information regarding the situation as the ship navigated the increasing ice field.
However, on 13 February 2013 the conditions deteriorated rapidly, and the Kiska Sea found herself surrounded by sea ice, some in excess of 3 feet thick. This was a potentially dangerous situation for the Kiska Sea as the ship is not an ice class vessel, meaning that it cannot break through thick ice without running the risk of sinking. Lacking solar or even lunar illumination (the new moon occurred on 10 February 2013) to assist in visual navigation, it was imperative that the F/V Kiska Sea navigate out of the sea ice quickly.
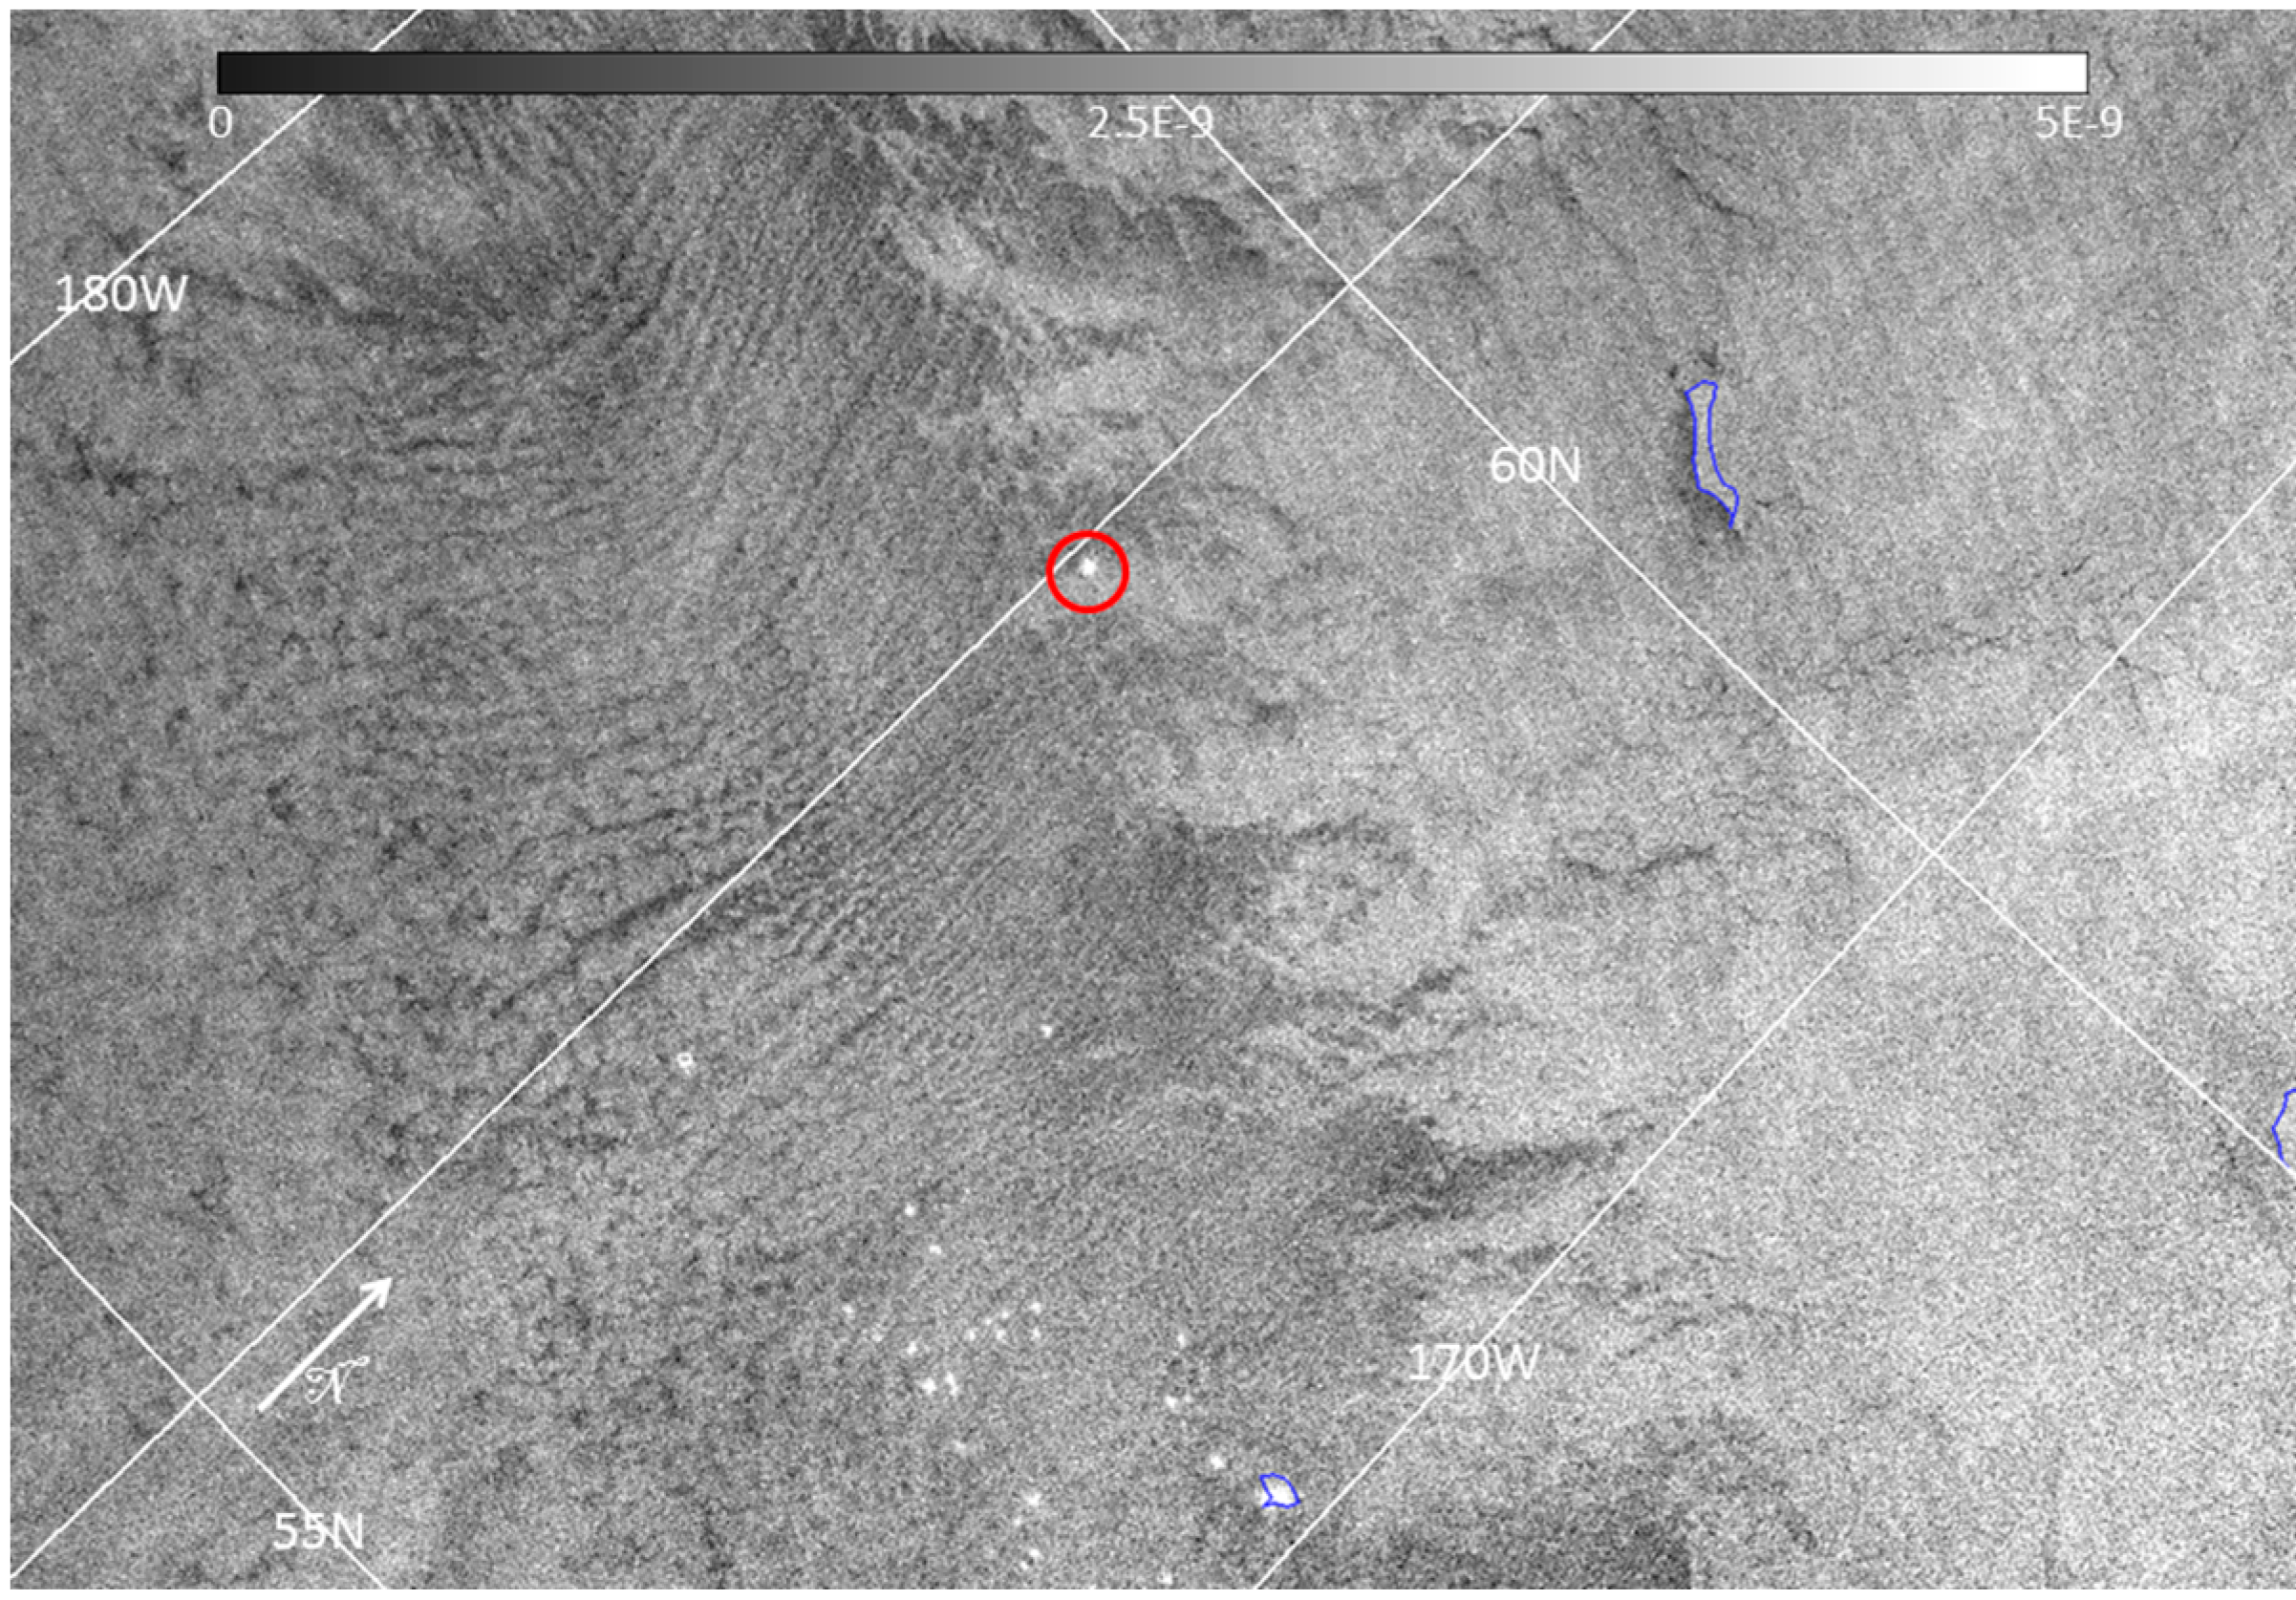
Figure 4 shows the DNB imagery at 05:26 AM Alaska Standard Time (UTC-9:00) on 13 February 2013. Similar to previous examples of
Taimyr, the
Kiska Sea can be seen here as a discrete point of light (red circle) close to the sea ice edge, with the main Bering Sea crab fishing fleet deployed to the south, near St. Paul Island (57.19N, −170.26W). We can be certain of this as the
Kiska Sea communicated their intentions to move away from the main crab fishing fleet to retrieve their crab pots, along with communicating their coordinates to the NWS Ice Desk when they requested assistance. The sea ice edge, along with other meteorological features such as low level stratus clouds, can also be seen in the DNB imagery, despite the fact that these data were collected during a moonless night. The detection is due to illumination from atmospheric nightglow, which offers nocturnal low-light visible imagery even on moonless nights [
17]. Although some of these features are also evident in the VIIRS I05 (11 μm) infrared brightness temperature (BT) imagery, shown in
Figure 5, critical details of the sea ice edge near the
Kiska Sea’s location are confused or obscured completely by low clouds, which appear as linear streets aligned parallel to strong northwesterly winds. In particular, the DNB nightglow imagery provides specific detail on sea ice edge extent in the immediate vicinity of the ship under duress.
Figure 4.
Day Night Band imagery of the Bering Sea at 1426 UTC on 13 February 2013. The red circle indicates the position of the Kiska Sea. Ship lights from the main crab fishing fleet can also be seen near St. Paul Island (near the bottom of the image). The moon is in waxing crescent and well below the horizon at the time of overpass; the illumination for clouds and sea ice in this case is atmospheric nightglow. Values are W·cm−2·sr−1.
Figure 5.
VIIRS 11μm BT from of the Bering Sea at 1426 UTC on 13 February 2013. Red circle indicates Kiska Sea. Units are Kelvins (K).
Figure 5.
VIIRS 11μm BT from of the Bering Sea at 1426 UTC on 13 February 2013. Red circle indicates Kiska Sea. Units are Kelvins (K).
The NWS Ice Desk was able to use the timely direct-broadcast DNB imagery from S-NPP to chart a track safely out of the growing and shifting ice pack. The guidance helped Kiska Sea avoid areas of thicker and higher concentration sea ice, and a possible tragedy at sea.
As with the
Taimyr case study, we considered the DNB imagery in the context of heritage sensor capabilities as a way of assessing the advanced utility. Here again, we enlisted OLS from the F18 DMSP satellite, which overflew the area multiple times during the
Kiska Sea incident. Imagery from an OLS pass collected on 13 February 2013 at 0556 UTC is shown in
Figure 6. There are virtually no anthropogenic lights present in the scene. The
Kiska Sea does not appear as a unique light within the noisy imagery. In addition, the meteorological clouds and sea ice and edge, features which were easy to distinguish in the DNB imagery in
Figure 4, and noted in
Figure 6 by “A”, are not visible in OLS imagery—owing to the lower sensitivity and spectral shift away from the nightglow emissions [
17].
Figure 6.
OLS imagery from 13 February 2013 at 0556 UTC. Values are in OLS count space. “A” marks the region where sea ice can be seen in the DNB imagery.
Figure 6.
OLS imagery from 13 February 2013 at 0556 UTC. Values are in OLS count space. “A” marks the region where sea ice can be seen in the DNB imagery.
There is one anthropogenic source of light which can be seen in the OLS imagery, located roughly at 58N, 170W. However, this light source does not move from pass to pass and, upon closer inspection, one finds it is associated with Saint Paul Island (noted in
Figure 6). This shows that, even with the lack of moonlight as a source of background reflectance contamination, the OLS does not have the spatial and radiometric sensitivity to distinguish individual ship lights at the level of fidelity demonstrated by the next-generation DNB sensor.
4. Fishery Boundaries
The world’s oceans, comprising 71% of the Earth’s surface, provide an important source of global economic activity. In this section, we highlight a specific application of DNB ship detection bearing high importance for the monitoring of fishing activities and adherence to international agreements. The United Nations Convention on the Law of the Sea (UNCLOS) [
18] defines regions where a given nation holds special rights over the exploration and use of marine resources, such as fishing or exploitation of mineral resources, which are called Exclusive Economic Zones (EEZs). These EEZs extend out to 200 nautical miles from the coast of a given nation. However, there are certain regions in the world where the EEZs of multiple nations overlap. These are designated by UNCLOS as “semi-enclosed seas”.
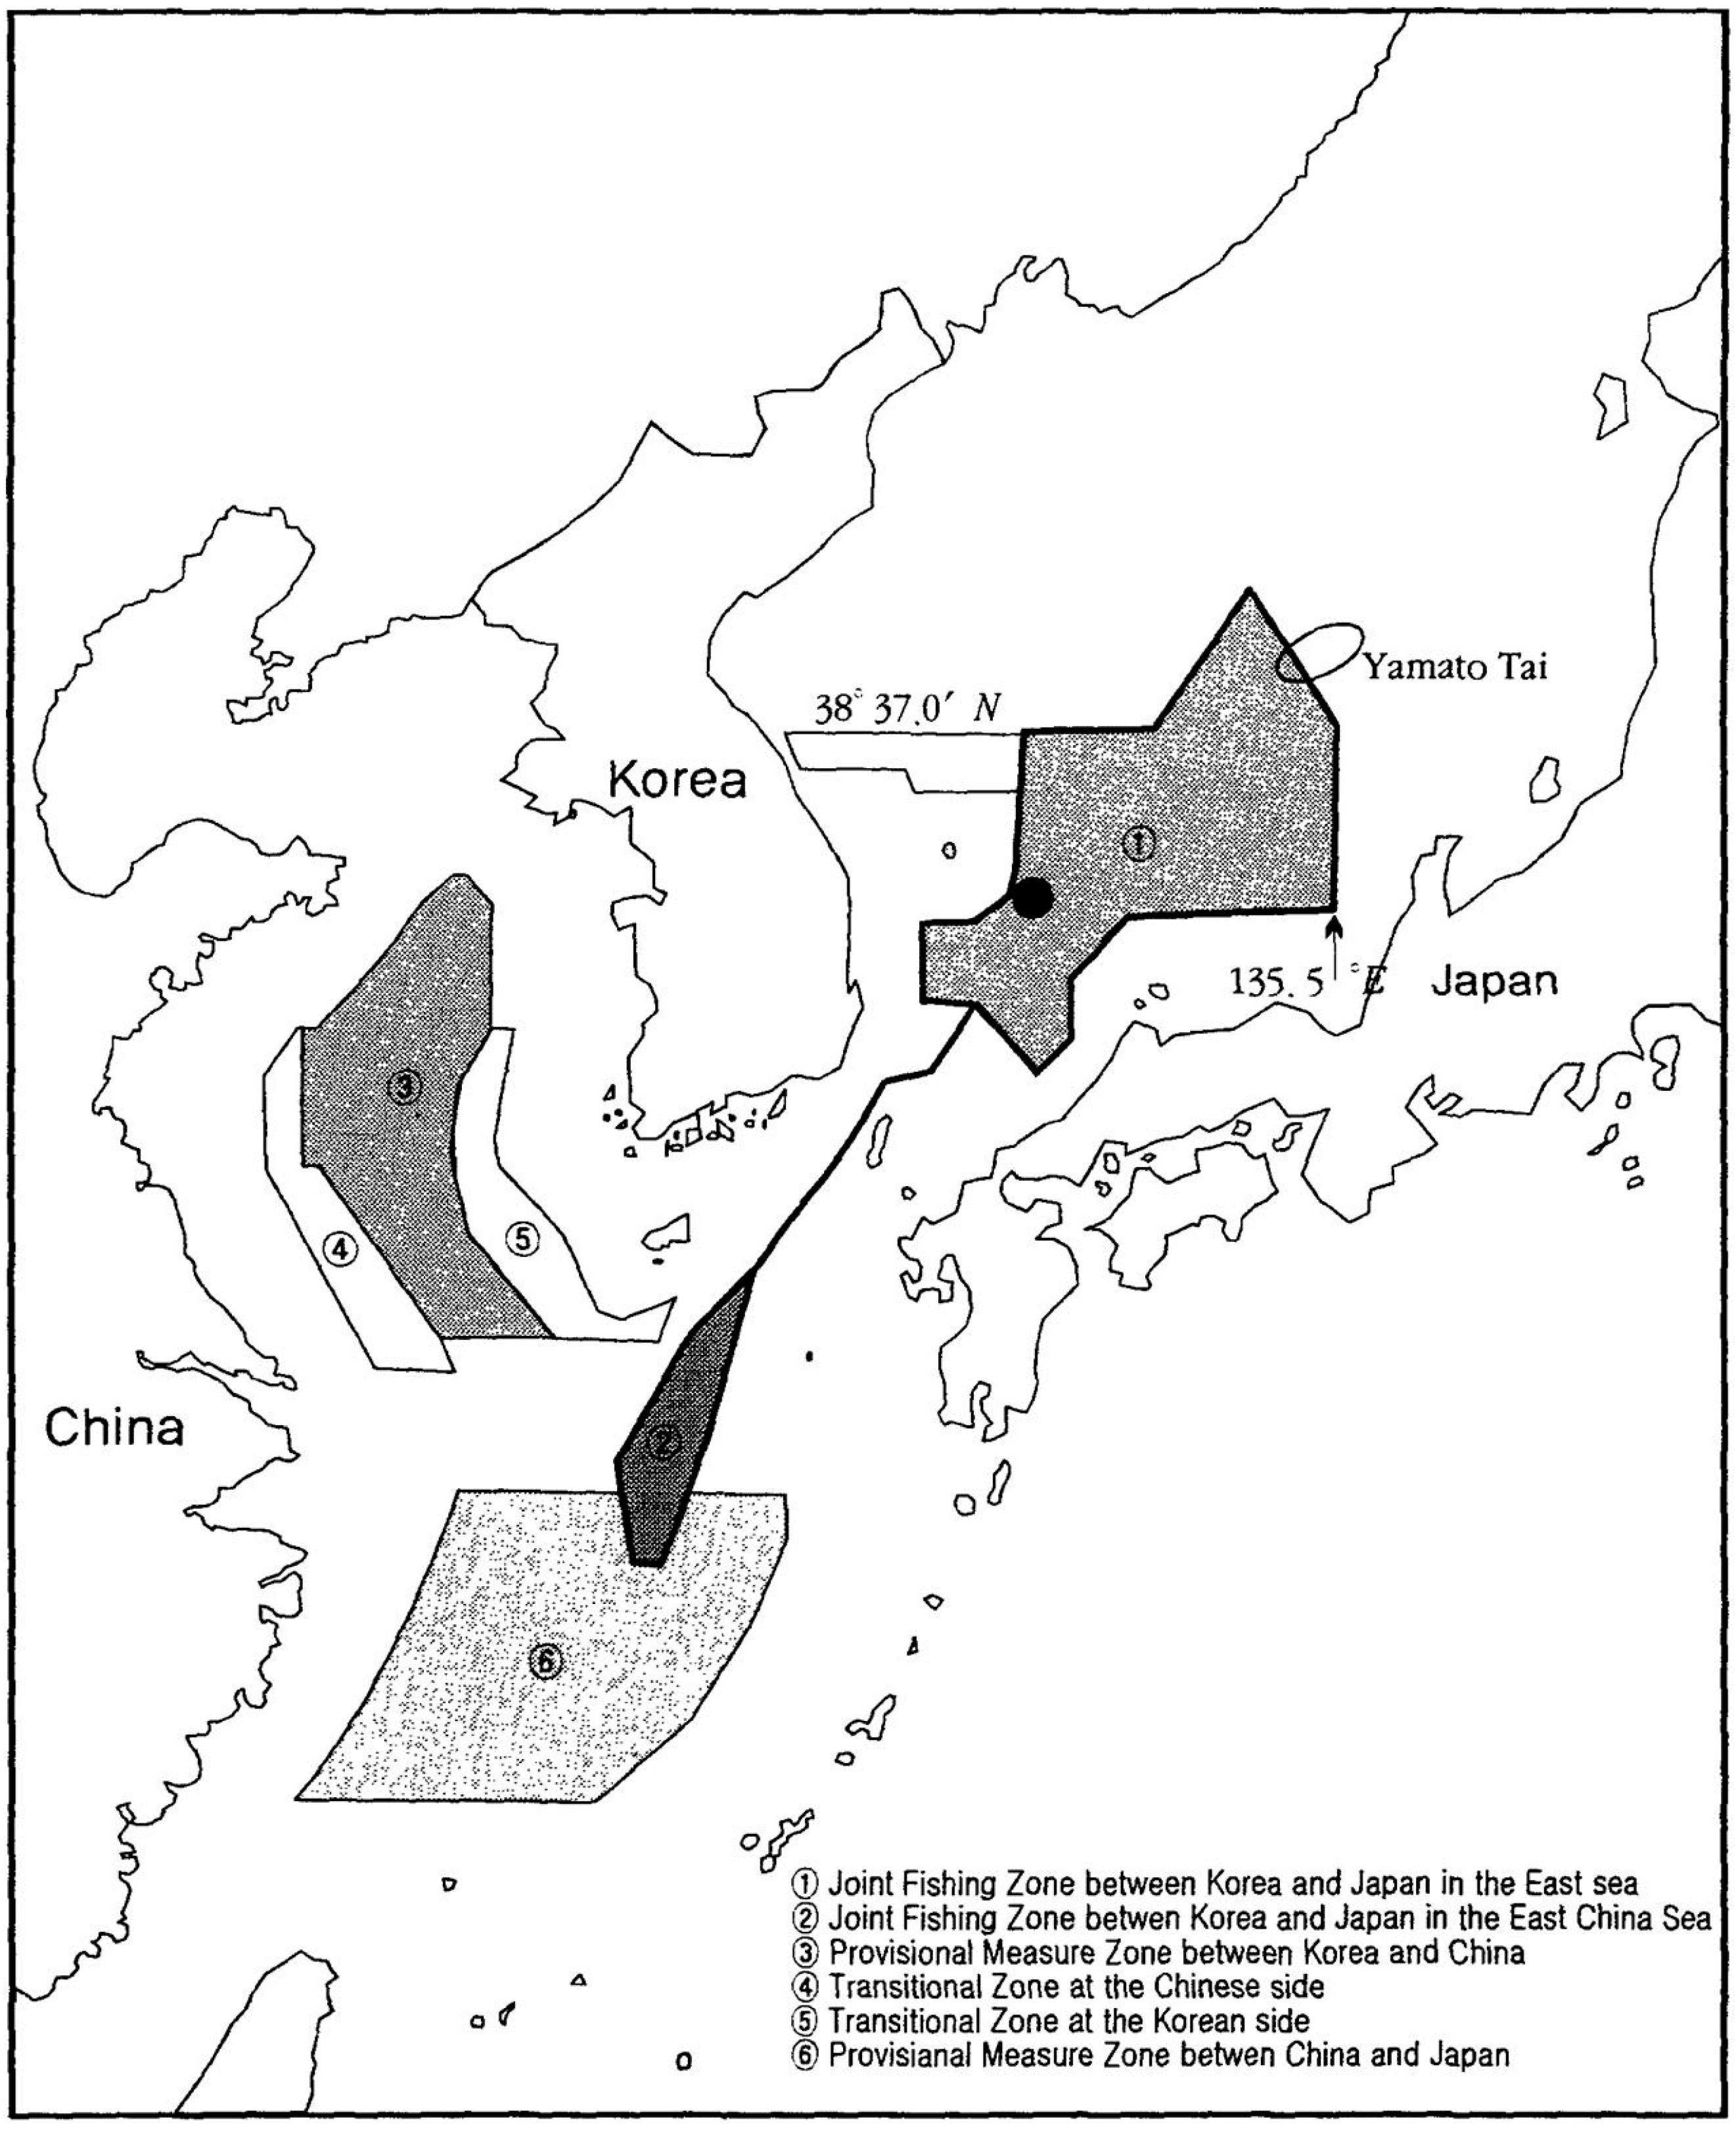
One notable example is the East China Sea, which is shared by People’s Republic of China (PRC), Japan and the Republic of Korea (ROK). In order to resolve the numerous disagreements which have arisen in the past and continue to arise to this day, several bilateral agreements were reached once the UNCLOS came into effect in 1994. A map of the various agreements in the East China Sea as they exist today is shown in
Figure 7.
Figure 7.
Map of the various fishery agreements, Sun Pyo Kim, Maritime Delimitation and Provisional Arrangements in North East Asia (The Hague/London/Boston: Kluwer Law International, 2004), p. 226 [
19]. Reproduced with permission from Sun Pyo Kim; Kim (2004).
Figure 7.
Map of the various fishery agreements, Sun Pyo Kim, Maritime Delimitation and Provisional Arrangements in North East Asia (The Hague/London/Boston: Kluwer Law International, 2004), p. 226 [
19]. Reproduced with permission from Sun Pyo Kim; Kim (2004).
One of these agreements, the Sino-Japanese Fishery Agreement of 1997, establishes a Provisional Measures Zone (PMZ), which is a jointly managed fishing zone by the PRC and Japan. Within this PMZ, which extends from roughly 124°E to 127.75°E, and from 27°N to 30.667°N [
20,
21,
22,
23]( shown as Zone 6, or the southernmost region depicted in
Figure 7), ships from both nations may conduct fishing operations. The intent of this jointly managed region is to prevent overfishing (particularly of squid) of these waters. North of 30.667°N are regions where there are multiple fishery agreements between Japan, China and South Korea as well as a region where no fishing permits are required (hereafter referred to as the NFPZ).
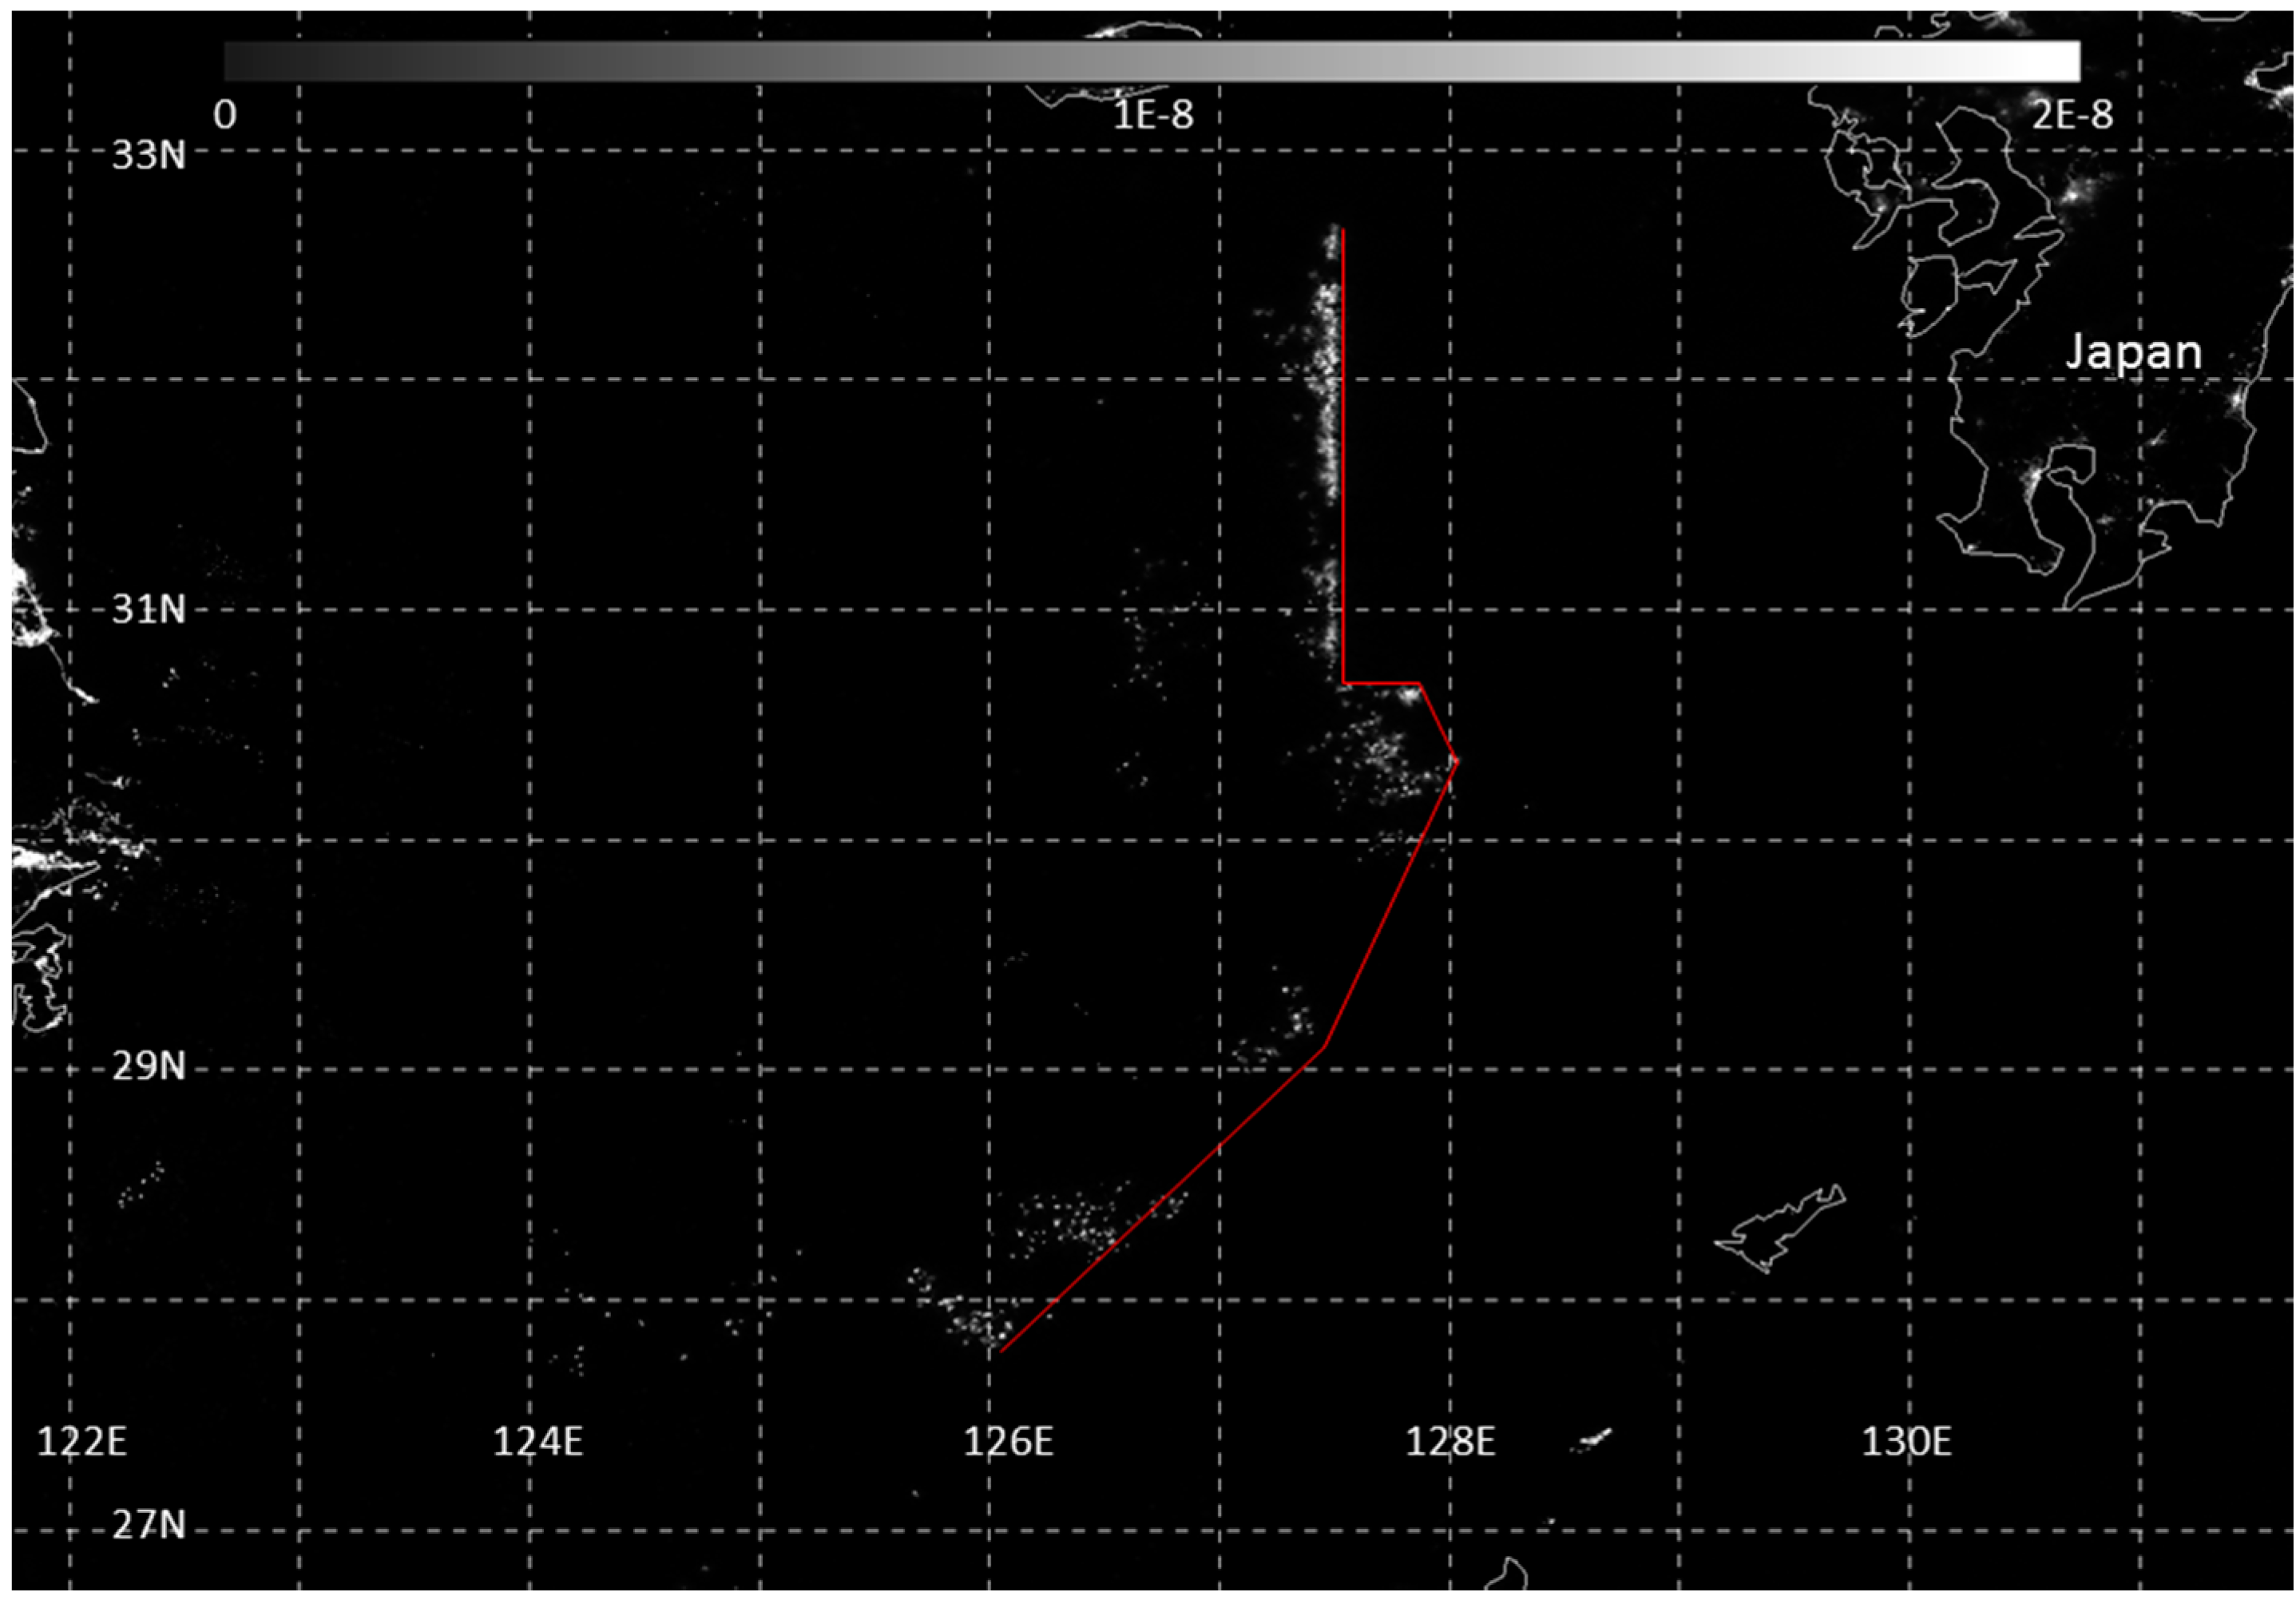
Figure 8 shows the DNB imagery from a single pass on 11 November 2012 at 1717 UTC covering the East China Sea region. One identifiable boundary that can be seen is the eastern edge of the PMZ of the Sino-Japanese Fishery Agreement of 1997 south of 30.667°N. In addition, another boundary is oriented north/south at 127.5°E. This appears to be the eastern edge of the region of shared waters where vessels from both nations can fish without any licenses. The NFPZ extends north of 30.667°N and has a western boundary of 124.75°E and an eastern boundary of 127.5°E. However, as seen in
Figure 7, there is also a Provisional Measures Zone between South Korea and Japan in this same area.
Figure 8.
Day Night Band imagery from 11 November 2012. The red line is placed along the approximate eastern boundary of the ship lights. Values are W·cm−2·sr−1.
Figure 8.
Day Night Band imagery from 11 November 2012. The red line is placed along the approximate eastern boundary of the ship lights. Values are W·cm−2·sr−1.
Temporal composites of nighttime lights have been produced by the Earth Observation Group (EOG) at NOAA’s National Geophysical Data Center (NGDC) using the OLS imagery for many years [
24]. This group is now starting to produce similar composites using the DNB [
25]. For this study, monthly and annual composites from August 2013 to July 2014 were created by EOG using cloud-free data from moonless nights. This time period was selected to avoid data impacted by stray light [
3], as the stray light mitigation algorithm went into operation in August 2013.
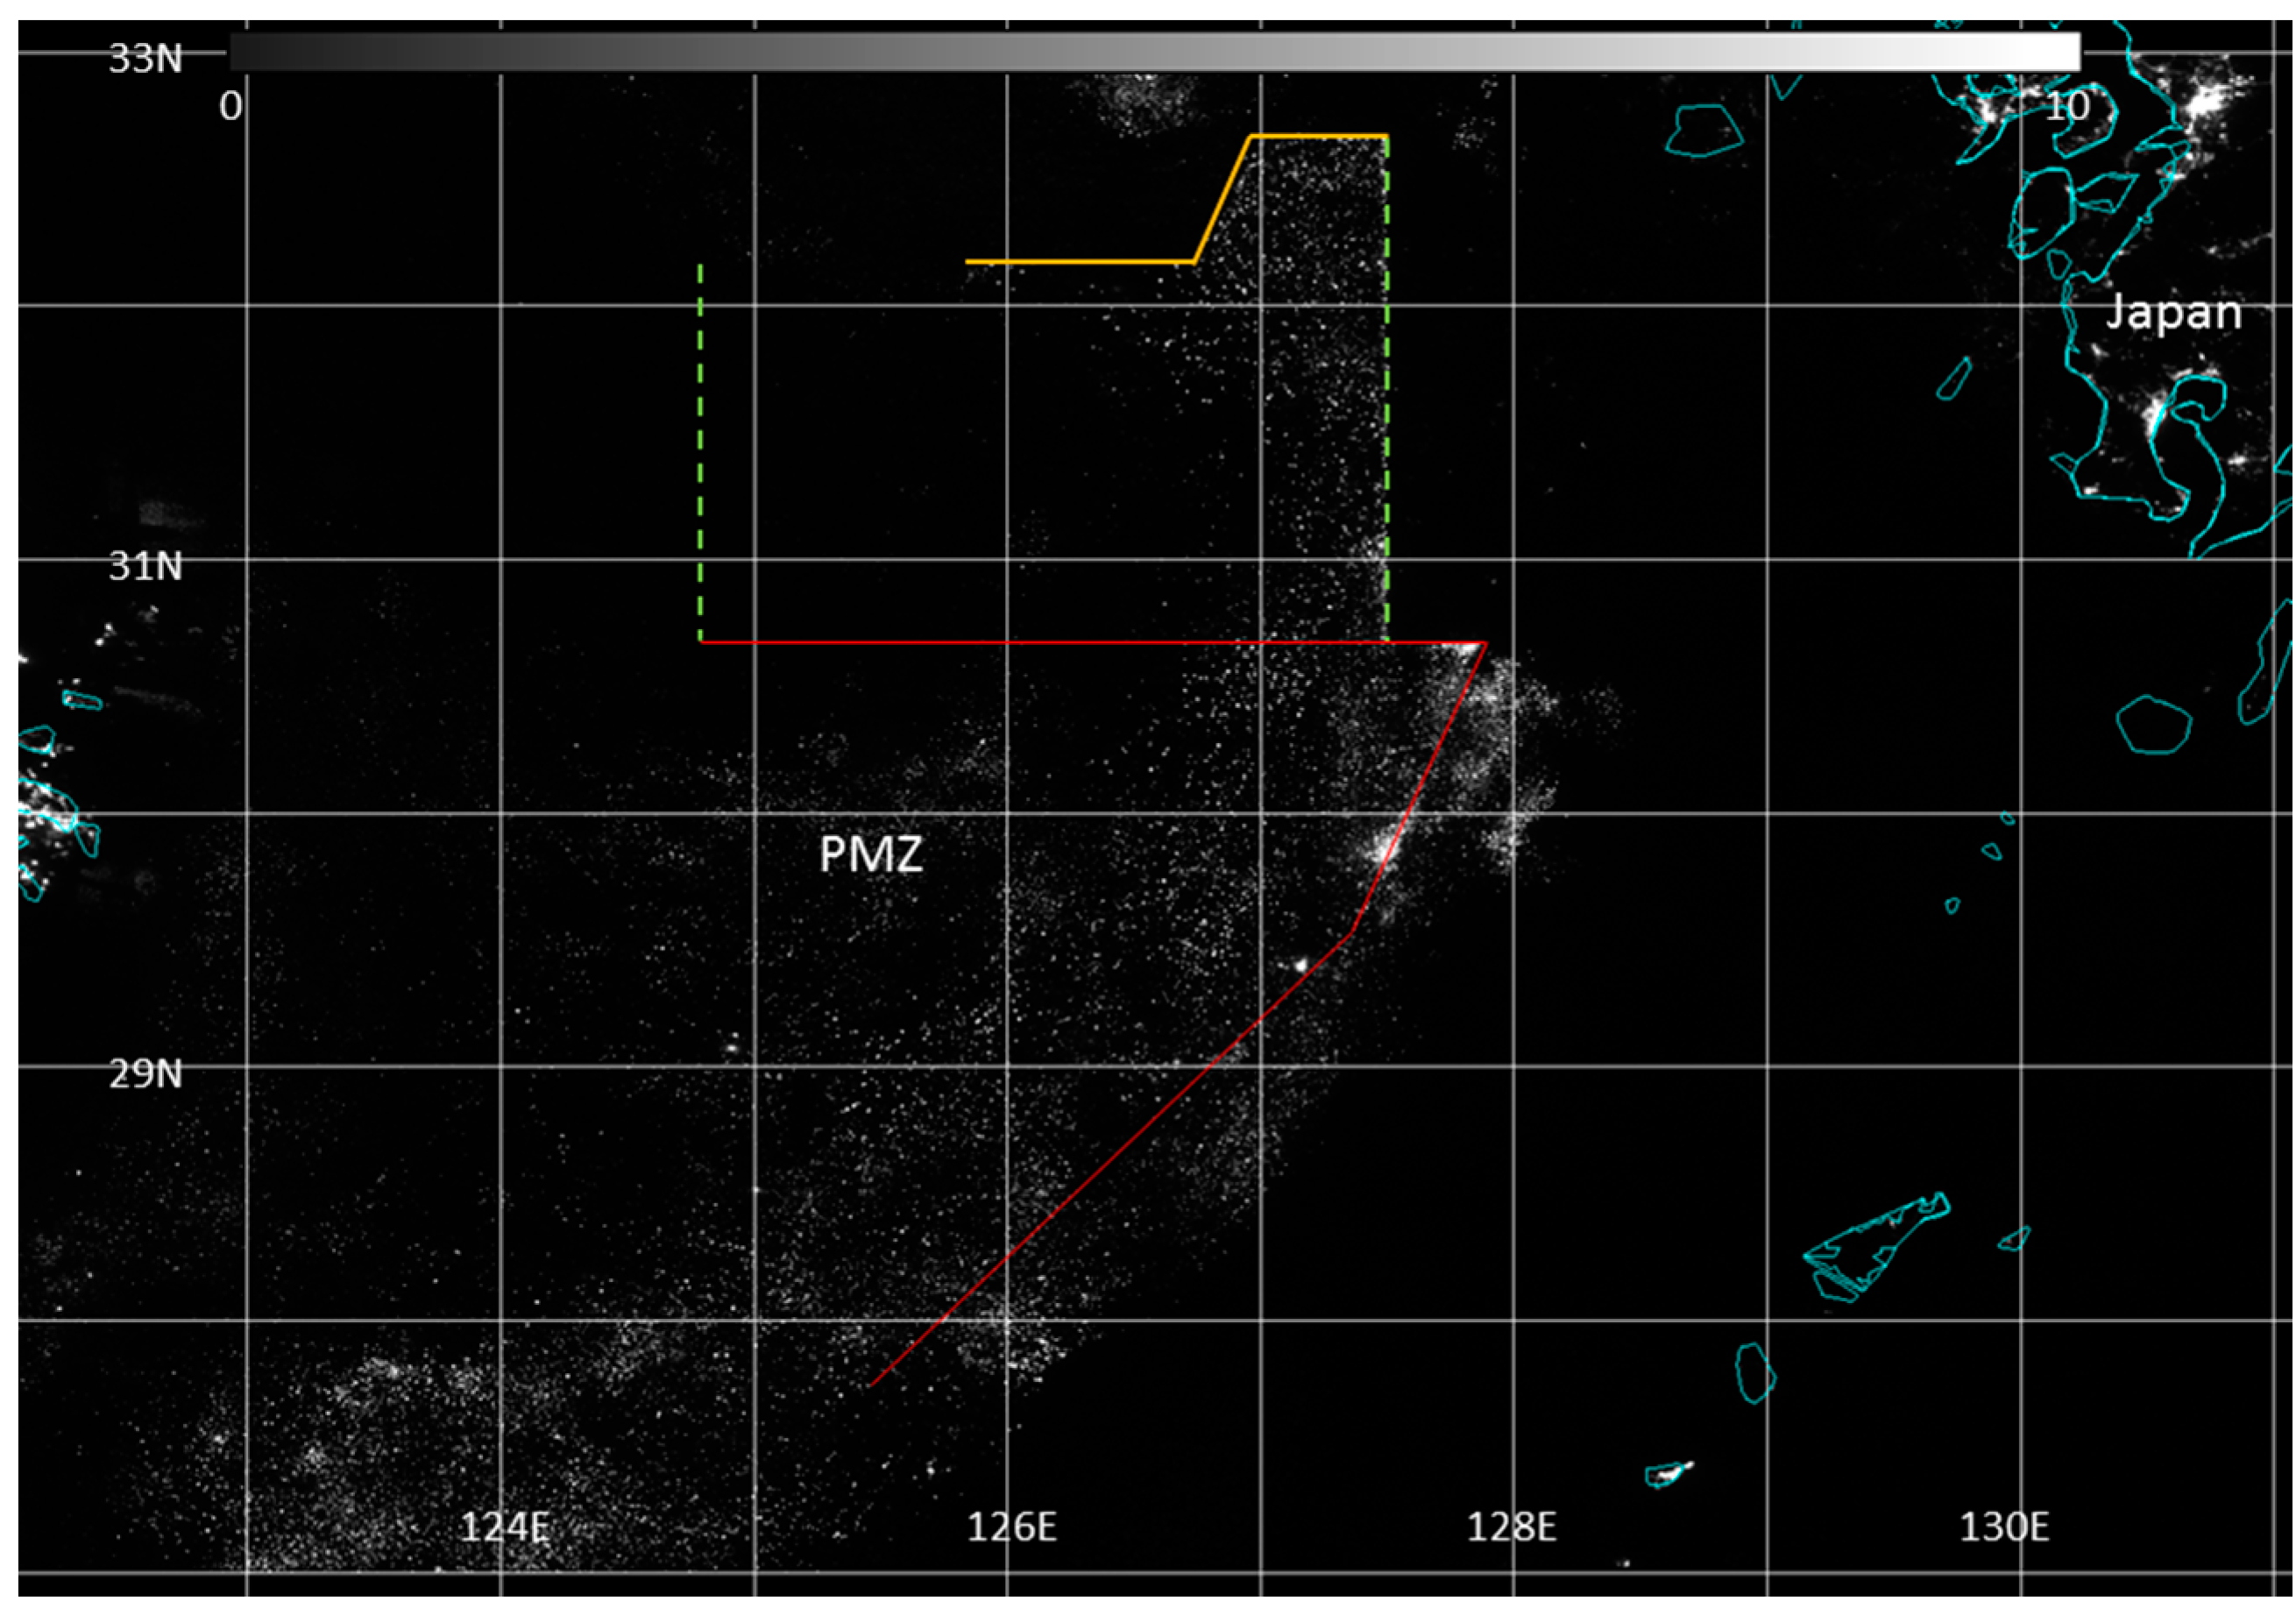
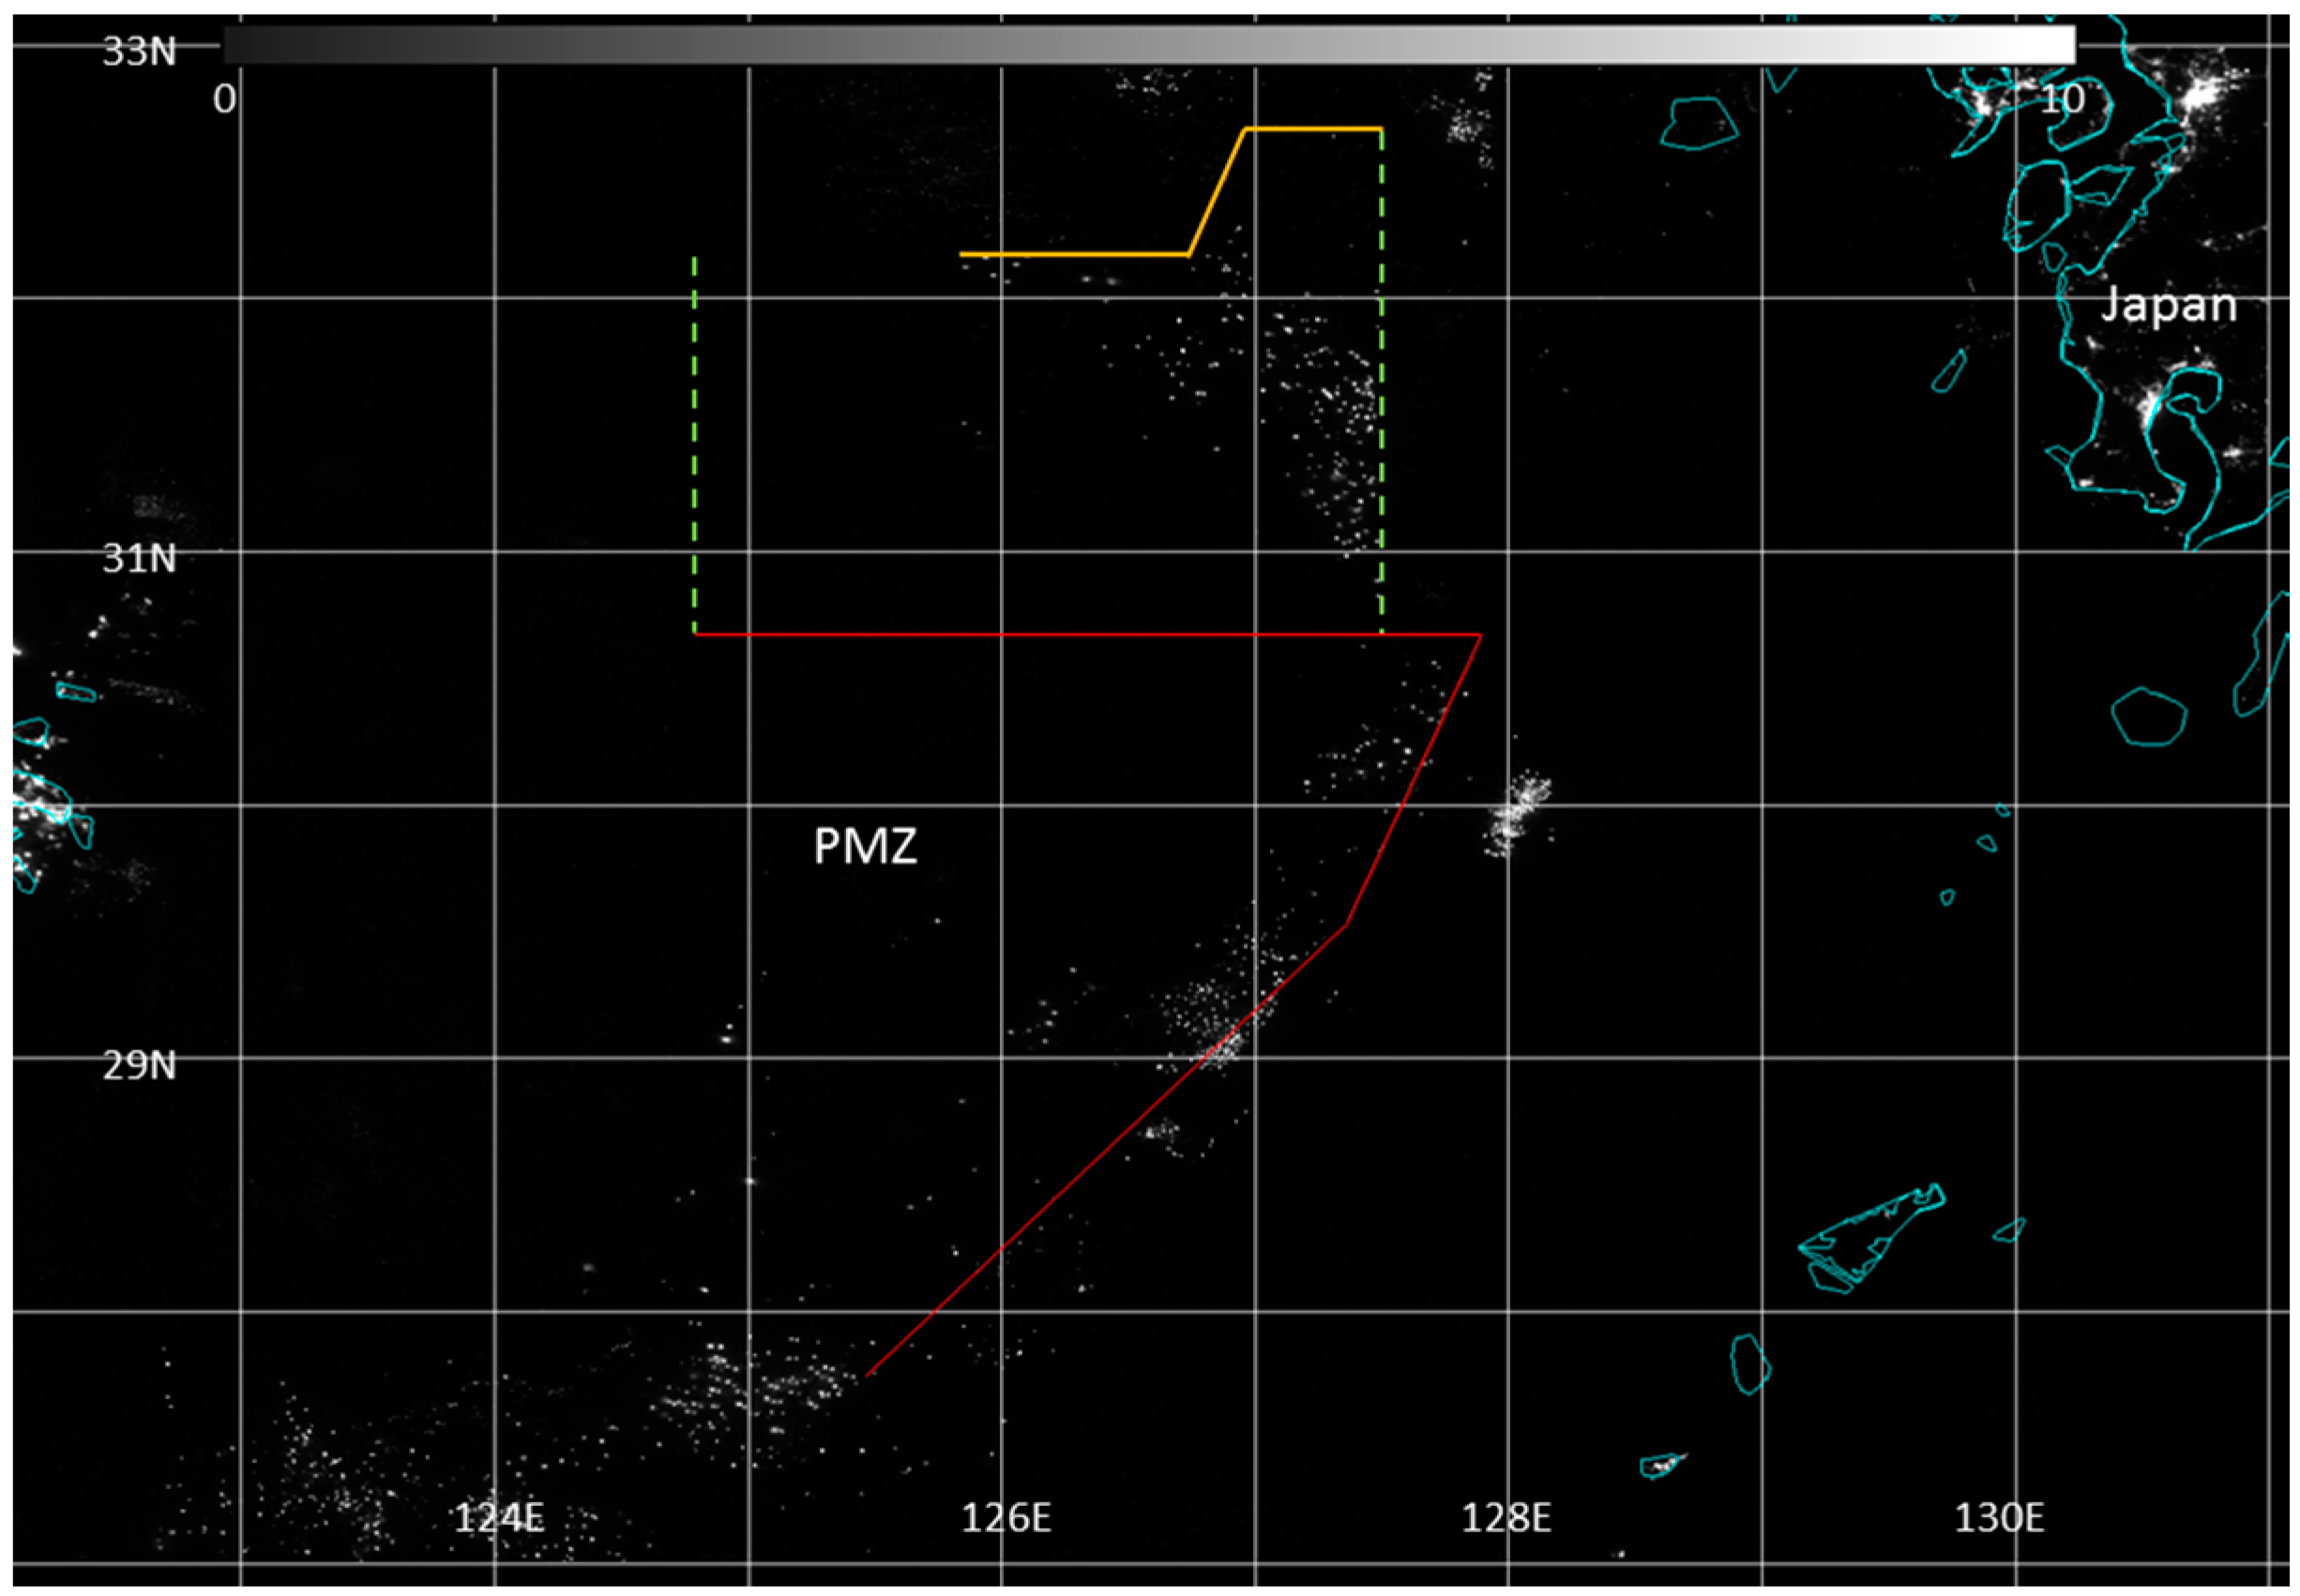
An annual composite of the region, shown in
Figure 9, reveals that there are three distinct boundaries which are denoted by the precise edge of the ship lights. The first is the eastern edge of the Sino-Japanese PMZ, shown in red. The second, denoted by a green dashed line, extends north of 30.667°N and is at 127.5°E. This is the eastern edge of the “no fishing permits” zone (NFPZ) of the Sino-Japanese Fishery Agreement of 1997. For completeness, the western edge of the NFPZ is also shown as a green dashed line at 124.75°E. The final boundary, denoted in orange, is located around the Republic of Korea island of Jeju, and appears to coincide with the northern boundary of the Korea-Japanese PMZ. It is important to note that the country of origin cannot be determined from the ship light properties. However, the orientation of these lights with respect to the PMZ and other boundaries provides insight as to the complexity of the various fishery agreements and economic zones in the East China Sea. Presumably the fact that ships are so closely aligned with respect to the various boundaries is the result of these vessels being equipped with Global Positioning Satellite (GPS) receivers.
Figure 9.
Average Day Night Band radiance for August 2013 to July 2014. Values are nanoWatts·cm−2·sr−1.
Figure 9.
Average Day Night Band radiance for August 2013 to July 2014. Values are nanoWatts·cm−2·sr−1.
Using the monthly composites of the DNB, one can also observe the changes of the fishing patterns throughout the various seasons in each of these zones.
Figure 10 shows the average DNB radiance for the month of August 2013.
Figure 10.
Average Day Night Band radiance for August 2013. Boundaries are the same as in
Figure 9. Values are nanoWatts·cm
−2·sr
−1.
Figure 10.
Average Day Night Band radiance for August 2013. Boundaries are the same as in
Figure 9. Values are nanoWatts·cm
−2·sr
−1.
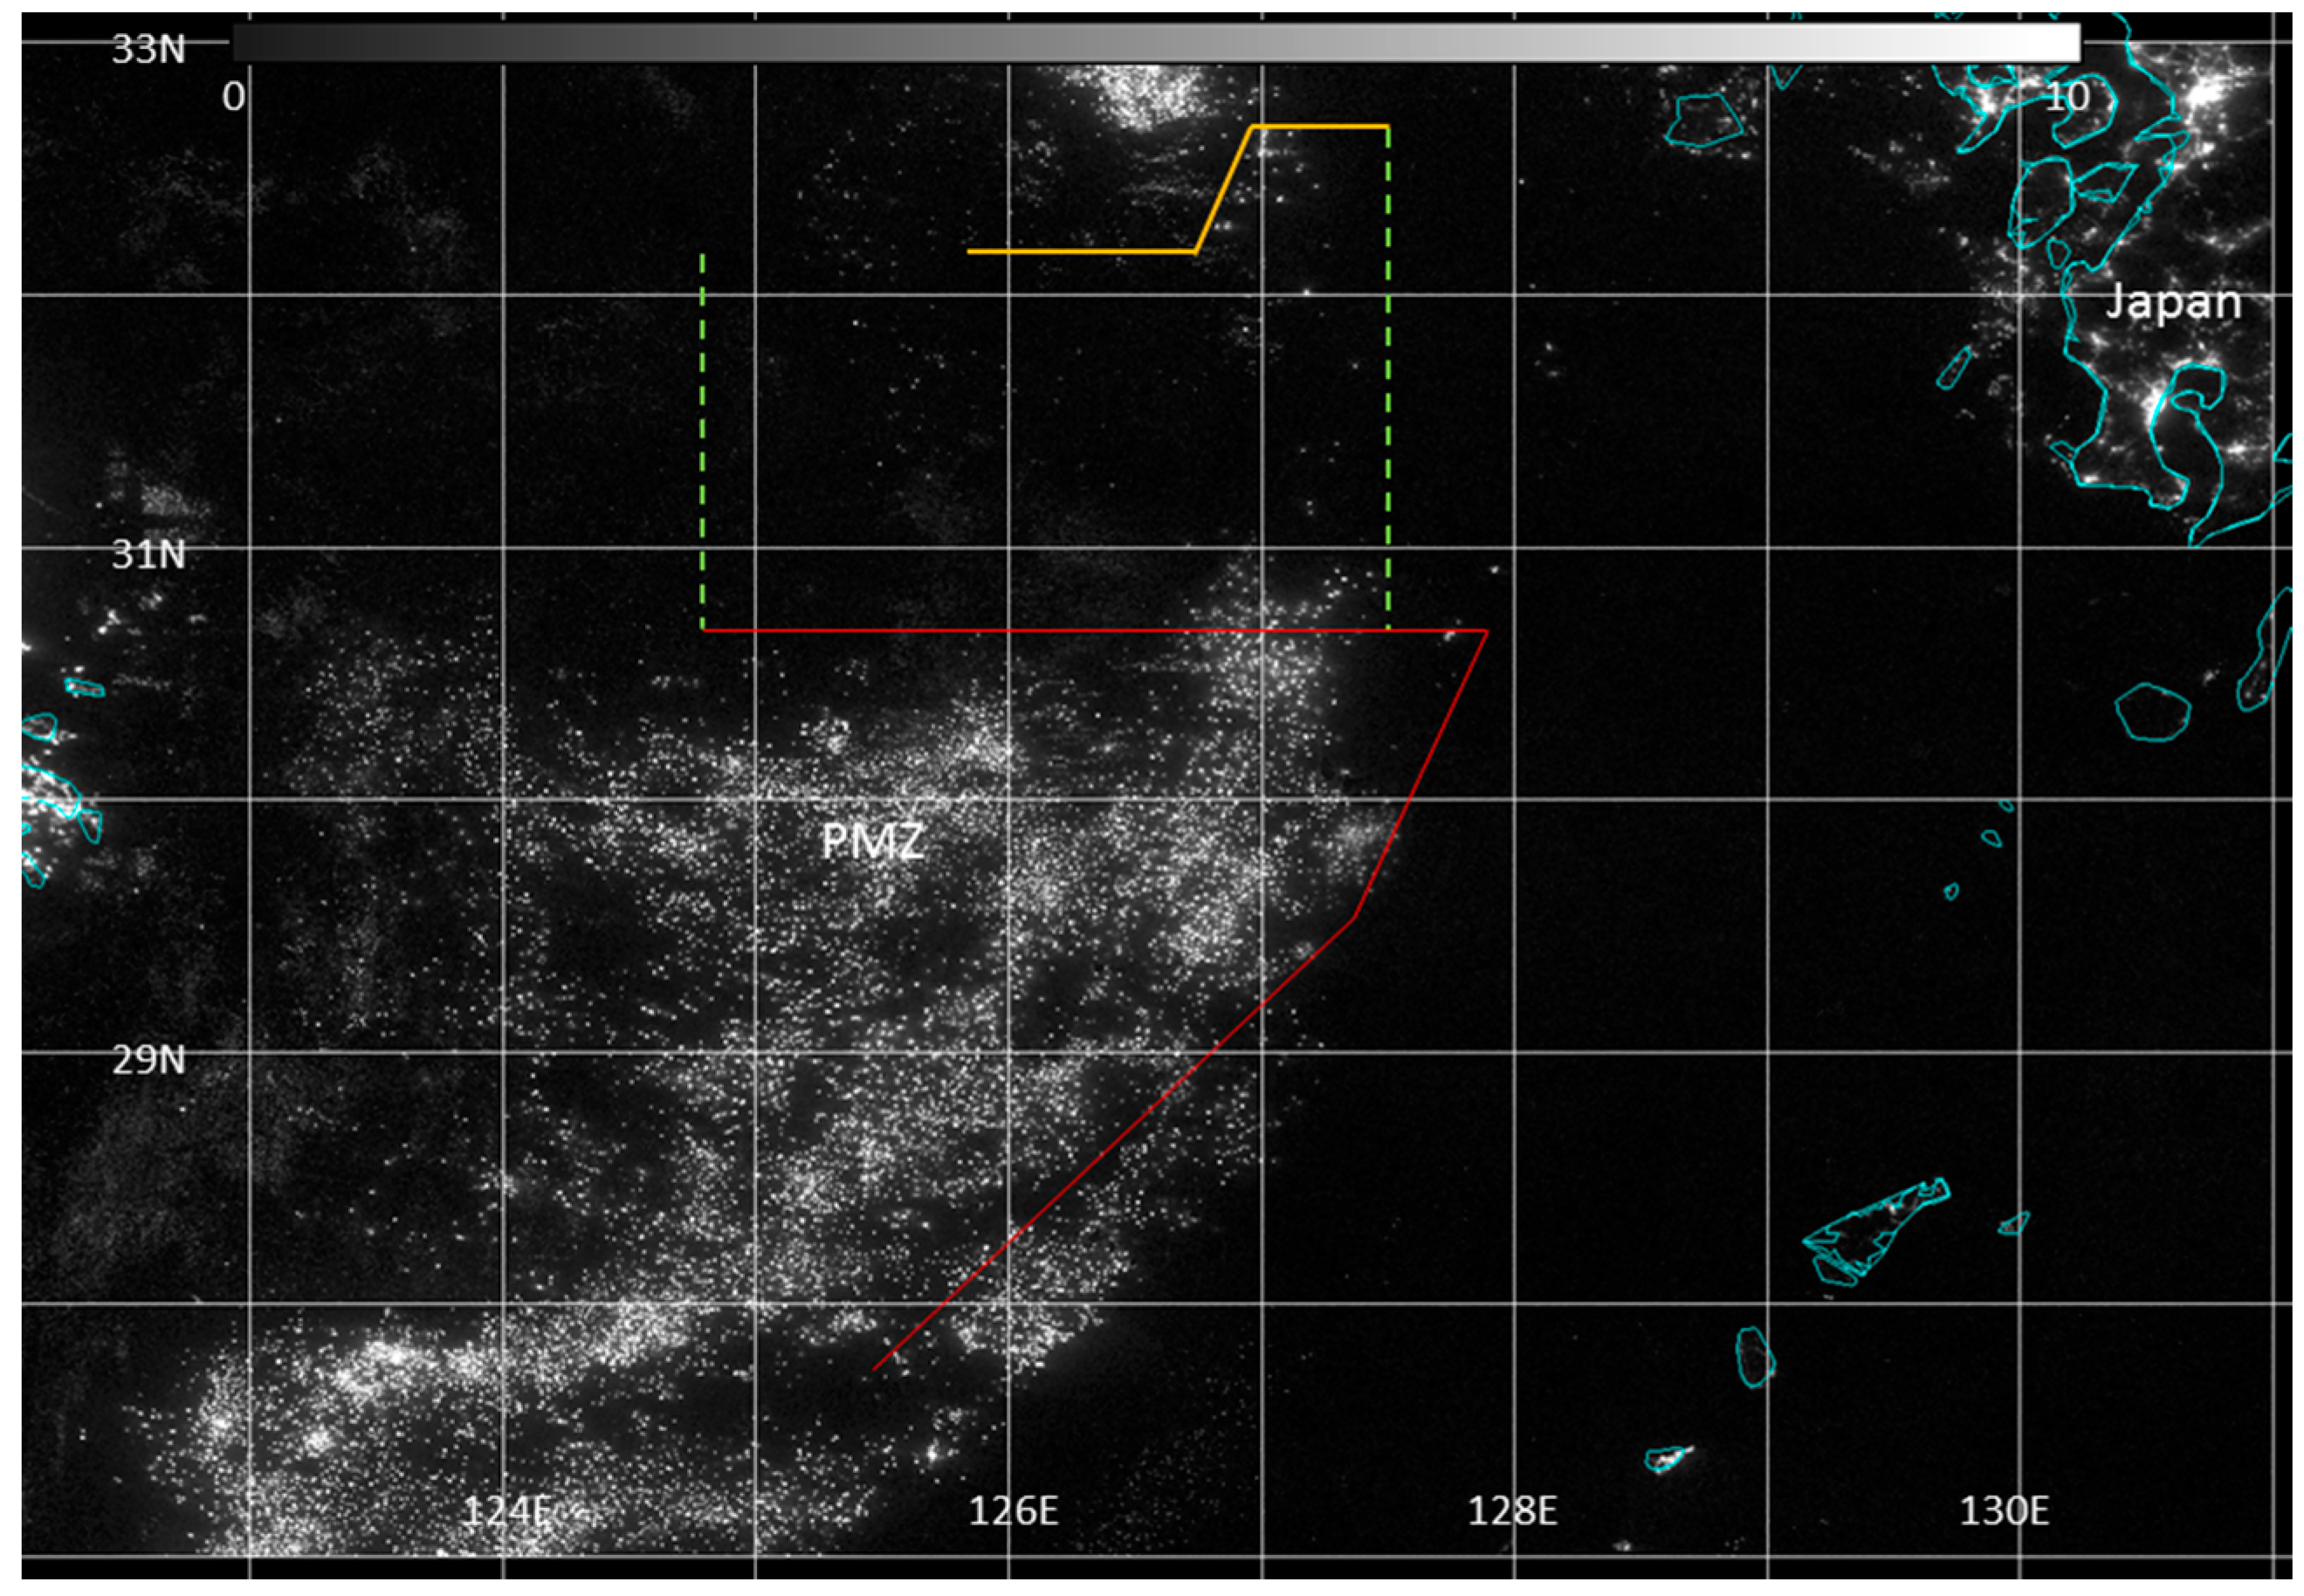
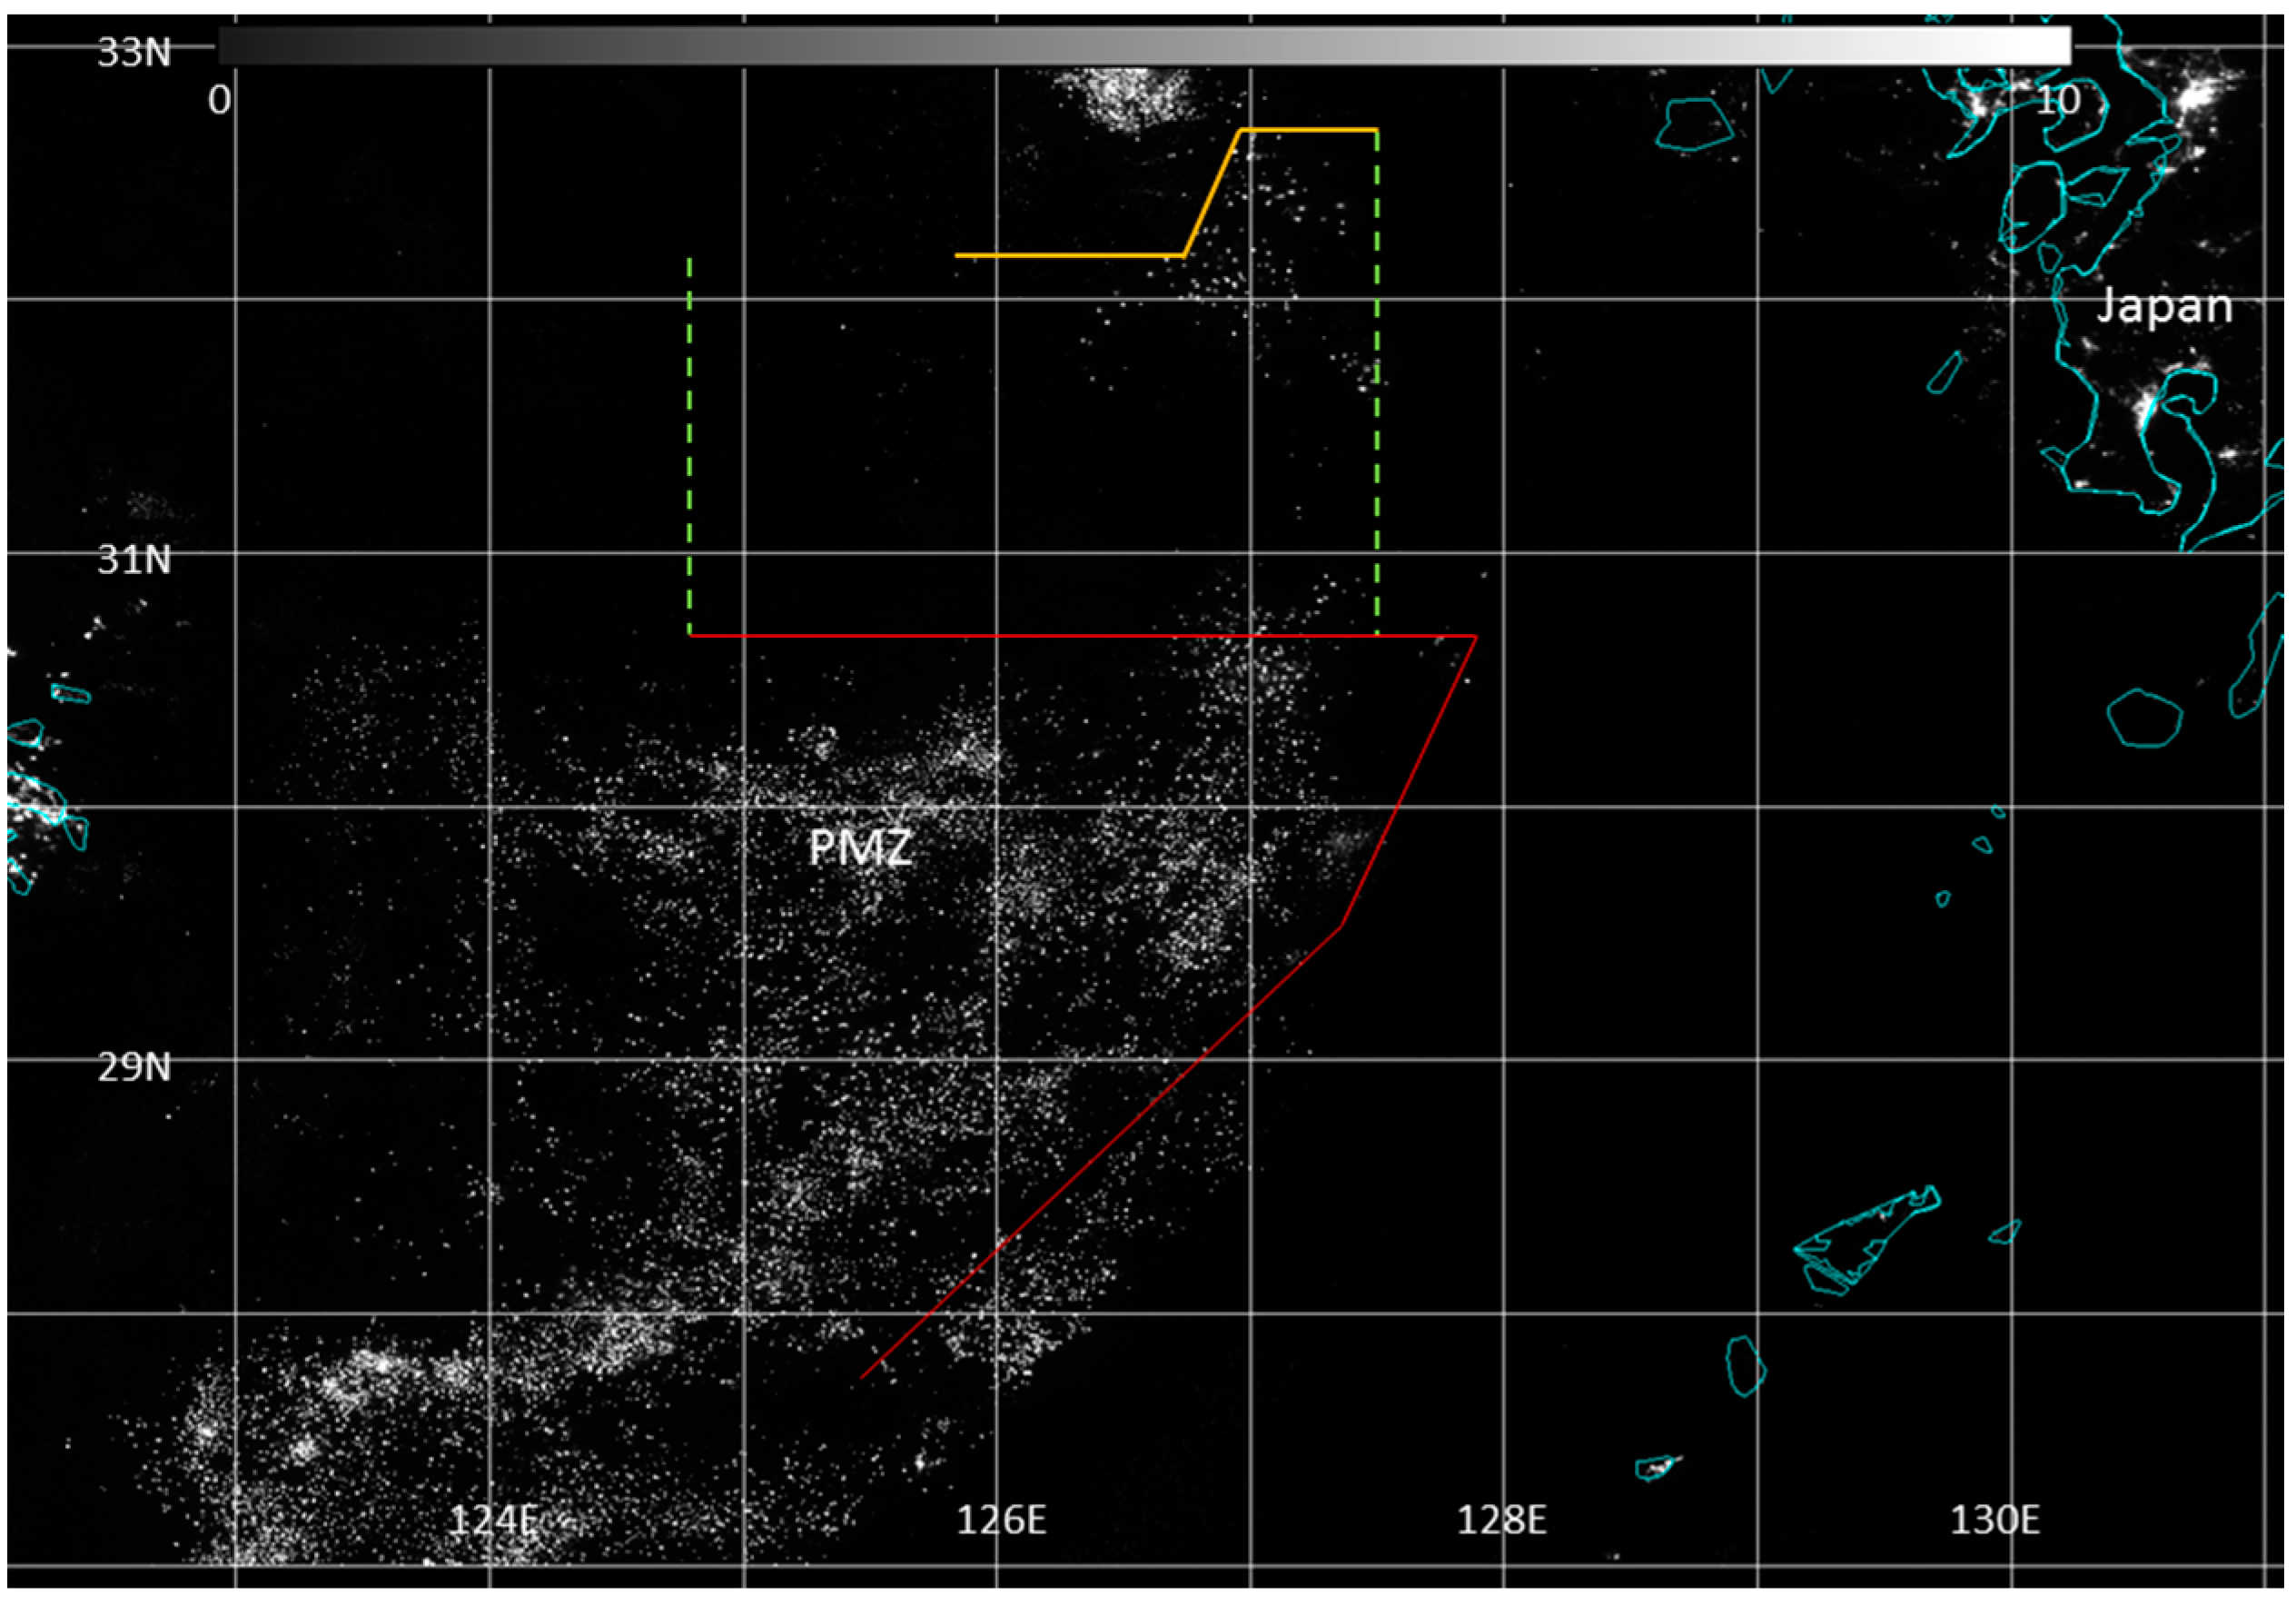
Based on the spatial extent and brightness of this composite, it is evident that fishing activity is prolific during the warm summer months. Contrasting this composite with the corresponding composite from February 2014 (
Figure 11), which is during the winter, we observed that there are far fewer ships across the entire East China Sea region, save for a strong localized cluster within the Japanese EEZ.
Figure 11.
Average Day Night Band radiance for February 2014. Boundaries are the same as in
Figure 9. Values are nanoWatts·cm
−2·sr
−1.
Figure 11.
Average Day Night Band radiance for February 2014. Boundaries are the same as in
Figure 9. Values are nanoWatts·cm
−2·sr
−1.
A seasonal trend is also apparent by comparing DNB composites made using 3 months of data, with virtually no fishing during the late winter/early spring (February through April), fishing picking up from May through the summer months, and falling off through the fall and early winter (January). This can be visualized by comparing the three month composite from March through May 2014 (
Figure 12), to other seasonal composites.
Figure 12.
Average Day Night Band radiance composite for March, April and May 2014. Boundaries are the same as in
Figure 9. Values are nanoWatts·cm
−2·sr
−1.
Figure 12.
Average Day Night Band radiance composite for March, April and May 2014. Boundaries are the same as in
Figure 9. Values are nanoWatts·cm
−2·sr
−1.
These variations in fishing lights likely correspond to the seasonal variations of nutrients in the East China Sea [
26], which drop off significantly as cold water intrudes in the East China Sea during the winter. Another interesting seasonal occurrence, which can be seen in the DNB composites, is a significant decrease in the number of ships in the NFPZ, or “no fishing permit zone” (the east and west boundaries are denoted by green dashed lines) during June through August (shown in
Figure 13), as compared to other months during the height of the fishing season.
Figure 13.
Average Day Night Band radiance composite for June, July and August. Boundaries are the same as in
Figure 9. Values are nanoWatts·cm
−2·sr
−1.
Figure 13.
Average Day Night Band radiance composite for June, July and August. Boundaries are the same as in
Figure 9. Values are nanoWatts·cm
−2·sr
−1.
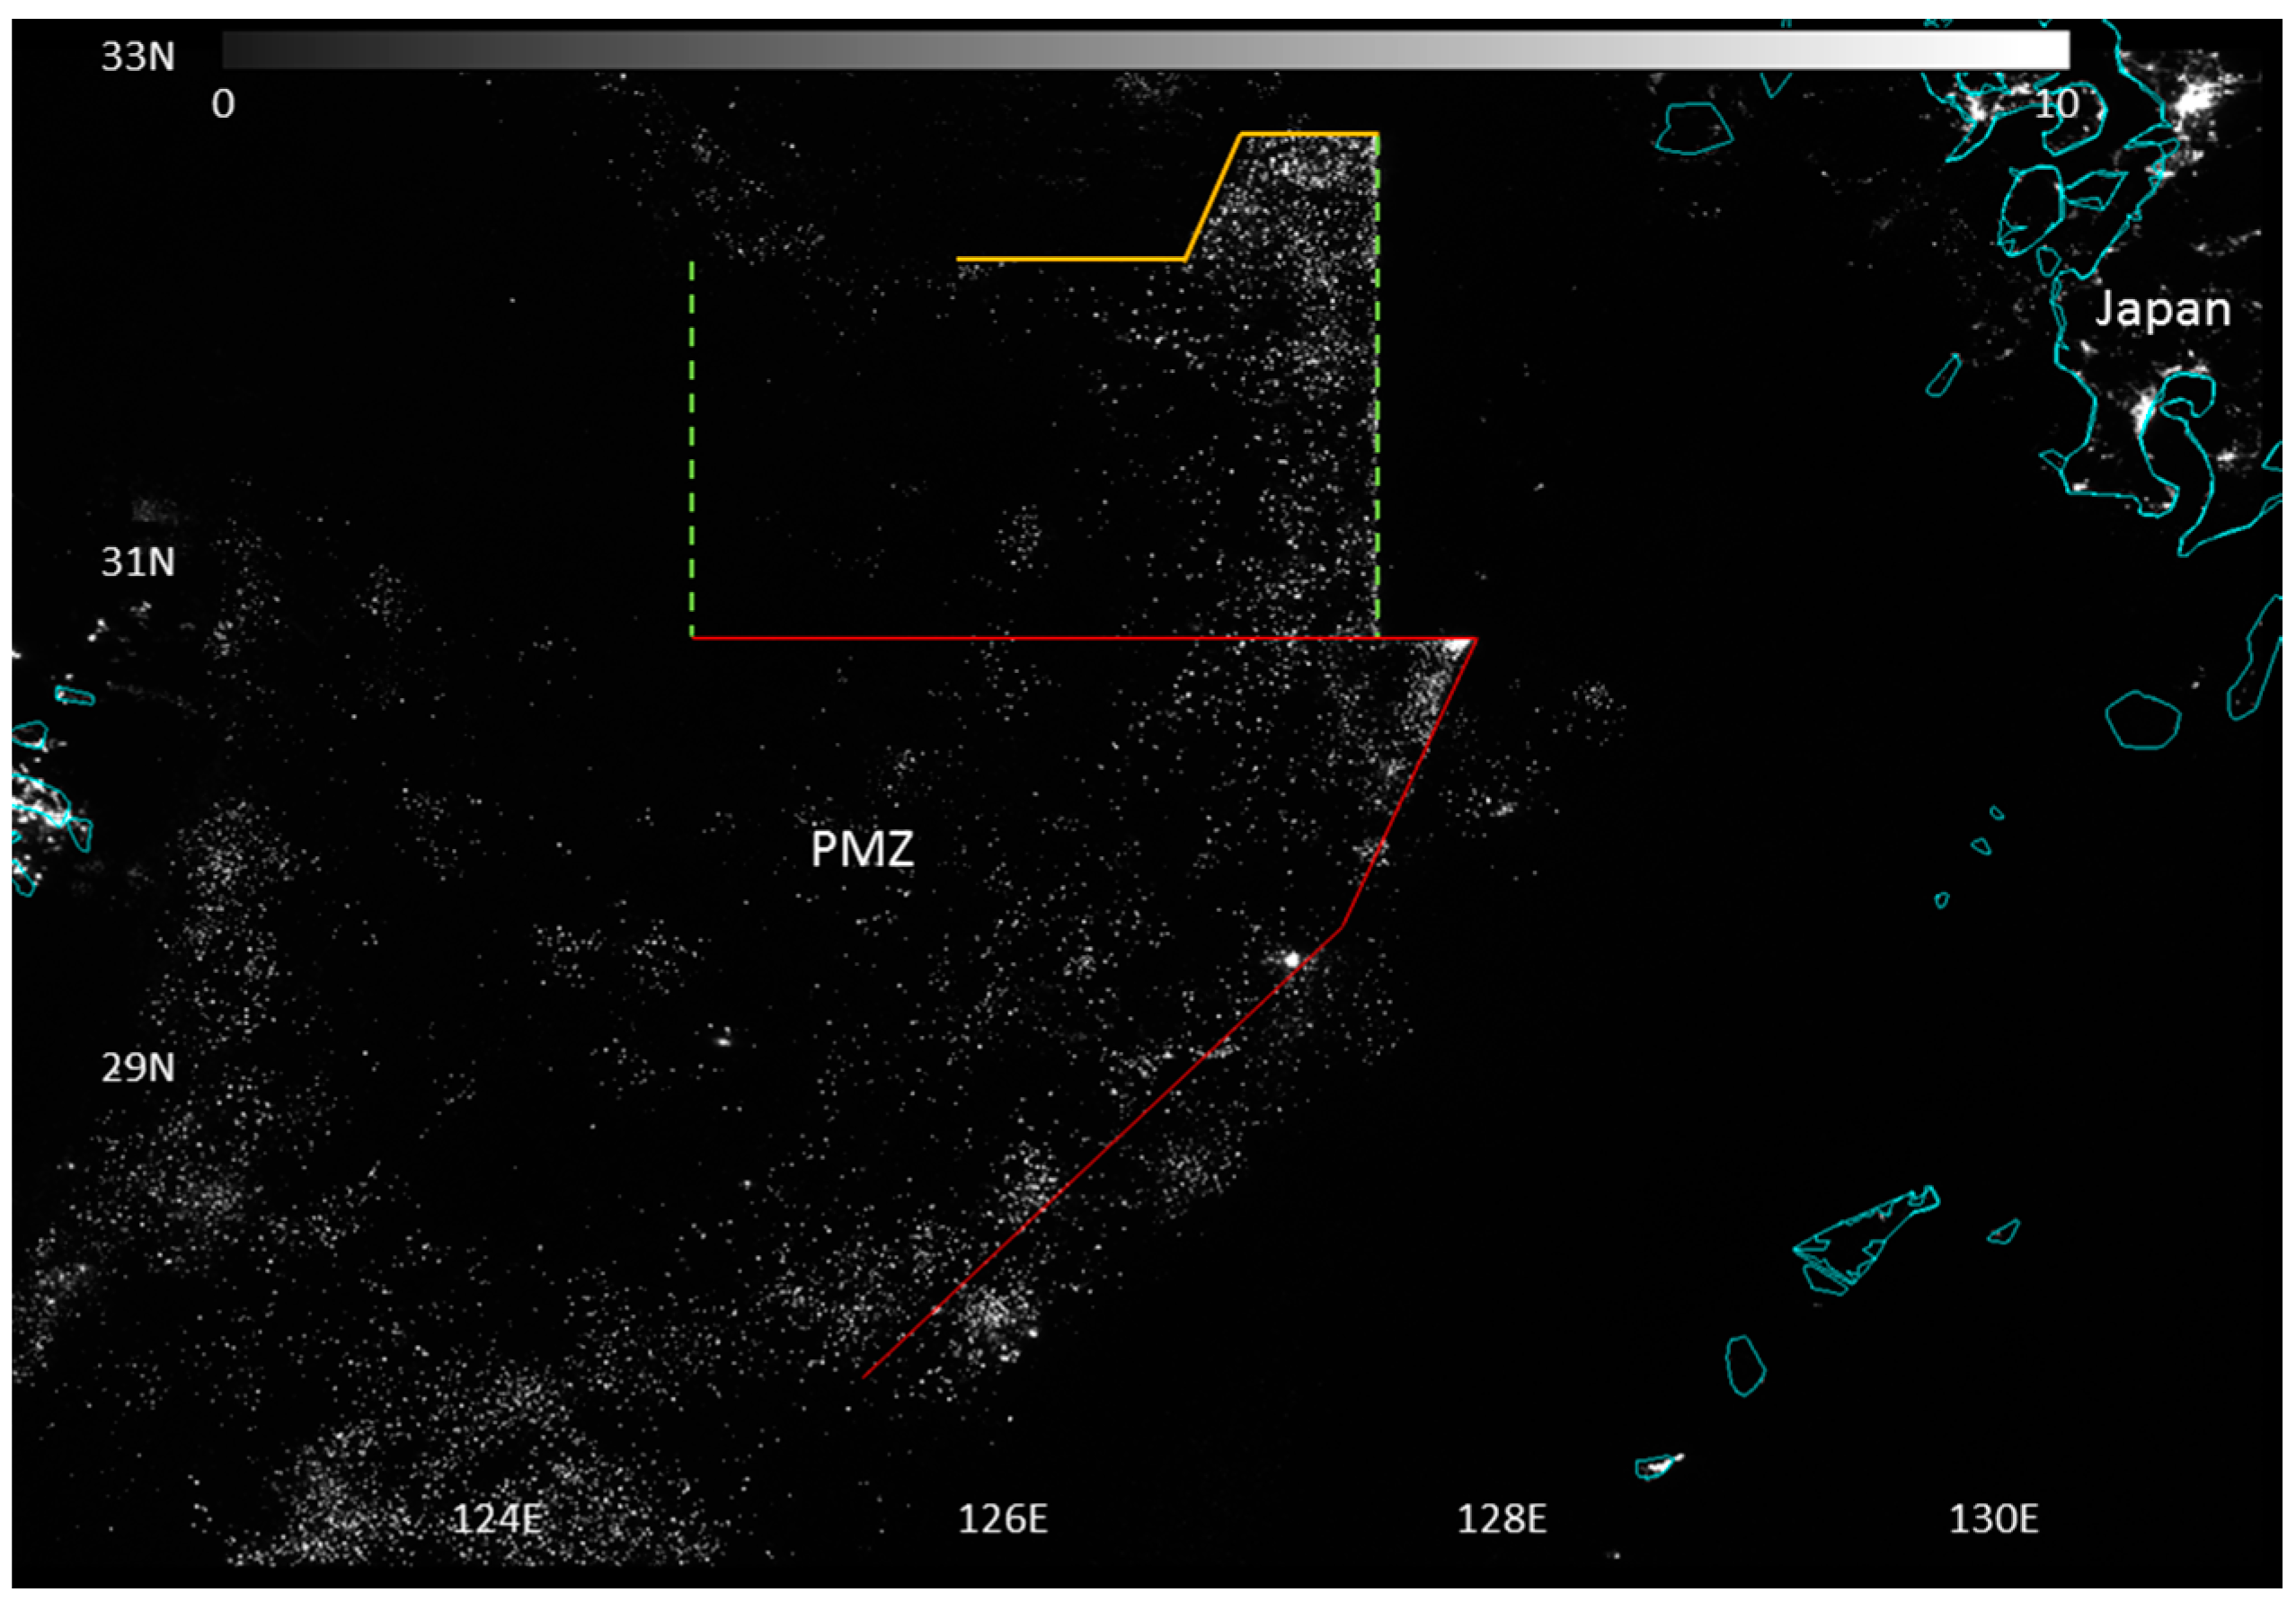
Figure 14 shows the three month composite from September through November 2013. As can be seen, there is a significant increase in the number of ships in the NFPZ, particularly on the eastern edge of the boundary.
Figure 14.
Average Day Night Band radiance composite for September, October and November 2013. Boundaries are the same as in
Figure 9. Values are nanoWatts·cm
−2·sr
−1.
Figure 14.
Average Day Night Band radiance composite for September, October and November 2013. Boundaries are the same as in
Figure 9. Values are nanoWatts·cm
−2·sr
−1.
The difference in the number of ship lights seen in the NFPZ between the June through August (
Figure 13) and the September through November (
Figure 14) composites seems to correspond to the “hot” season fishing moratorium that imposed by the Chinese government each year from 1 June through 1 September in the Yellow and East China Seas. This moratorium affects ~120,000 fishing vessels and over a million fishermen, and is aimed at preventing overfishing. Given that the Japan and the Republic of Korea do not impose a similar moratorium suggests that the difference in number of ships in the NFPZ between the two composites is due to the lack of Chinese fishing vessels during the June through August period.
5. Conclusions
We have highlighted the improved ability of the VIIRS/DNB over the OLS instruments to observe ship lights under various lunar conditions in the Polar Region and highlighted both the operational and research potential of the DNB in ship tracking in various regions. As was expected given the improved spatial and radiometric resolution (45–88 times higher and 256 times finer, respectively) and increased sensitivity (~100 times higher) of the DNB over the heritage DMSP/OLS, the DNB showed dramatically improved detail and ability to resolve anthropogenic marine light sources. This was true even under conditions when there was no lunar illumination and aggressive scaling was used to bring out features at lowest counts detectable by the OLS. While not unexpected, it was important to demonstrate given the usage of the OLS data in the Polar Regions today on a routine basis.
Both the operational and research potential of the DNB in ship tracking in the three case studies were shown. In the cases of the Taimyr and F/V Kiska Sea, it was shown that the lights from an individual ship could be monitored over the course of its voyage. In the case of the F/V Kiska Sea, this was the first documented time that satellite based visible imagery of the light on a civilian ship was used to distinguish the location of an individual ship along with the pack ice present, and guide it back to safety. The ability to track and monitor ships in those regions, especially in the polar regions where VOS or Satellite-based Automatic Identification System (S-AIS) are delayed, is of particular importance given the retreat of the sea ice as well as the increase in commercial maritime traffic in these regions. While the DNB is able to observe the Polar Regions roughly every 102 minutes, these examples speak to the growing importance of low-light visible imagery and point to the significance of such imagery were it to one day become available at higher temporal refresh. The geostationary platform highly elliptical (Molniya) orbits may one day include such capabilities and a paradigm shift to our ability to watch as ships pass in the night at all latitudes.
While past research has examined how the OLS instrument was used to look at fisheries in various locations in the world, the current research shows how the DNB is able to more accurately show the positions of various fishing fleets, right down to the individual ships along the fishery boundaries of the world. This is of particular importance in order to provide researchers the ability to study human impacts in the ecosystem of the Earth. Monthly and seasonal composites show both the seasonal variation of the fishing season in the East China Sea as well as what appears to be the effect on the fishing fleet during the “hot” season moratorium imposed by the Chinese government. As more data become available over the lifetime of the S-NPP mission and the subsequent Joint Polar Satellite System (JPSS) satellites, which will also carry the DNB on-board, more comprehensive studies on how often fishing occurs in a given region will become possible. Such information can help scientists determine which regions may be at risk for over-fishing worldwide. Government agencies could use monthly and quarterly composited DNB data to determine the effectiveness of their seasonal fishing moratoriums.


