Article

Nighttime Light Derived Assessment of Regional Inequality of Socioeconomic Development in China

1
State Key Laboratory of Resources and Environmental Information System, Institute of Geographical Sciences and Natural Resources Research, Chinese Academy of Sciences, Beijing 100101, China
2
University of Chinese Academy of Sciences, Beijing 100049, China
3
Jiangsu Center for Collaborative Innovation in Geographical Information Resource Development and Application, Nanjing 210023, China
*
Author to whom correspondence should be addressed.
Remote Sens. 2015, 7(2), 1242-1262; https://doi.org/10.3390/rs70201242
Submission received: 24 June 2014 / Accepted: 15 January 2015 / Published: 23 January 2015
(This article belongs to the Special Issue Remote Sensing with Nighttime Lights)

Abstract

:
Satellite-derived nighttime light (NTL) data have been extensively used as an efficient proxy measure for monitoring urbanization dynamics and socioeconomic activity. This is because remotely sensed NTL signals can be quantitatively connected to demographic and socioeconomic variables at regional and global scales. The recently composited cloud-free NTL imagery derived from the Visible Infrared Imaging Radiometer Suite (VIIRS) aboard the Suomi National Polar-orbiting Partnership (Suomi-NPP) satellite provides spatially detailed observations of human settlements. We quantitatively estimated socioeconomic development inequalities across 30 provinces and municipalities in mainland China using VIIRS NTL data associated with both regional gross domestic product (GDP) and population census data. We quantitatively investigated relations between NTL, GDP, and population using a linear regression model. Our results suggest that NTL radiances have significant positive correlations with GDP and population at different levels. Several inequality coefficients, commonly used in economics, were derived from VIIRS NTL data and statistical data at multiple spatial scales. Compared with the statistical data, NTL-derived inequality coefficients enabled us to elicit more detailed information on differences in regional development at multiple levels. Our study of provinces and municipalities revealed that county-level inequality was more significant than city-level inequality. The results of population-weighted NTL inequality indicate an obvious regional disparity with NTL distribution being more unequal in China’s undeveloped western regions compared with more developed eastern regions. Our findings suggest that given the timely and spatially explicit advantages of VIIRS, NTL data are capable of providing comprehensive information regarding inequality at multiple levels, which is not possible through the use of traditional statistical sources.

1. Introduction

Because of the current rapid economic growth in China, regional inequality is increasing and becoming a matter of contention that has received considerable attention from policy-makers and scholars [1]. According to previous research, China also experienced uneven economic development after economic reforms which were initiated in 1978 [2,3]. It is necessary to evaluate regional disparities of regional socioeconomic status within China because of the important effects of inequality on national development and social stability [4]. The majority of studies on socioeconomic inequality in China have focused on several prominent economic indicators such as GDP, average income, and consumption expenditure in their analyses [5,6,7]. These studies applied several measurements to assess inequality such as the Coefficient of Variation (CV) and the Gini index. They have consistently observed an increase in regional inequality since 1992 ([7]). Zhang et al. considered GDP and consumption expenditure [8]. Their results confirmed that both GDP and consumption expenditure were significantly and unequally distributed before and after China’s economic reforms. However, inequality in relation to GDP appears to have increased more quickly during the post-reform period. Moreover, there are multiple effects related to regional inequality that are attributed to China’s multiple administrative levels; a phenomenon that some economic geographers have highlighted [9,10]. An imbalance in growth patterns between China’s coastal and interior provinces has been persistently evident over the long term, attracting the attention of several scholars seeking to identify the essential factors and detailed reasons behind this imbalance [11,12].
Although widely applied in the measurement of economic development, traditional economic indicators (e.g., GDP and income) that are statistically derived suffer from limitations such as high cost, low temporal resolution, and artificial effects. Few studies that have used statistical data have specifically considered spatial scale. In this context, the emergence of remotely sensed nighttime light (NTL) data has precipitated a new avenue for explicitly exploring human activity and socioeconomic development from space. Numerous studies have indicated that satellite-derived NTL images can serve as a proxy measure of demographic and economic activity from the regional to the global scale [13,14,15,16,17]. Furthermore, because of its noteworthy advantages associated with easy access, low cost, and relative objectivity, NTL data have been regarded as an alternative that can be used in the absence of economic census variables [18]. The majority of studies in this area have been conducted using data obtained from the Defense Meteorological Satellite Program-Operational Line Scanner (DMSP-OLS), which were first published in the early 1970s. The DMSP-OLS image data have an original spatial resolution of approximately 2.7 km and are distributed at a 1 km resolution. They have proven effective for examining economic activity, urbanization [19,20,21], power and metal consumption [22,23,24,25], disaster assessment [26], and light pollution [27]. However, despite their use over several decades, the low spatial resolution, saturation of pixel values, and other drawbacks [28] associated with these data have limited their application for monitoring within the social sciences.
Because of a recognized need for dedicated NTL data, in 2013, NOAA’s National Geophysical Data Center Earth Observation Group released advanced, low light image data derived from the Visible Infrared Imaging Radiometer Suite (VIIRS) instrument aboard the Suomi National Polar-orbiting Partnership (Suomi-NPP) satellite [29]. The initial composite products of the VIIRS day/night bands (DNB) yielded high quality data in zero moonlight conditions, with a 15 arc second spatial resolution (pixel footprint at nearly 742m) [30]. However, the latest VIIRS-derived NTL data released are capable of detecting extremely low light sources from the Earth’s surface, and have been used to evaluate the responses of NTL to socioeconomic activity [31,32]. Ma et al. [31] investigated correlations of NTL radiance with GDP, population, electrical power consumption, and paved road areas. Their findings indicated that these indices had a significantly positive linear relation to NTL radiance. Recently, Shi et al. [33] evaluated the capability of VIIRS NTL data to depict GDP and electrical power consumption in China. They observed that VIIRS data were superior to DMSP-OLS data in estimating these socioeconomic parameters on multiple scales. Apart from primary research on the spatial distribution of NTL used to detect economic development patterns, some scholars have applied NTL in econometric methods and models (e.g., the Gini coefficient and the coefficient of variation). These studies have provided valuable insights into NTL’s applications within socioeconomic research [34]. Findings of spatial inequality, derived from satellite data, are hardly affected by the lack of or lag in census data, and the increasingly available images from this data enable the provision of continuous results. The objectiveness of the data and the gridded data source provide an appropriate and convenient input for quantifying inequality methods.
Based on a literature review, it is evident, nevertheless, that this form of knowledge and information merits a more thorough exploration. Conversely, traditional methods applied to census data may hide some detailed characteristics because of the limitations of that data source. Thus, an appropriate choice may be to employ the most recently released remote sensing data that can serve as an economic inequality indicator, and that have a natural spatial attribute. While there are some case studies of human activities that have used remote sensing data, only a few of these have examined or been compared at different administrative levels within one country to provide further insights. Additionally, comparison inequality indices calculated from the VIIRS light data and other inequality factors are helpful in uncovering essential relations between satellite-derived light data and common socioeconomic data. Elvidge et al. [35] used NTL imagery (DMSP/OLS) and population data to generate a global poverty map at national and sub-national levels. This work demonstrated that NTL data could be used to estimate poverty and socioeconomic disparities. Recently, researchers have applied high spatial resolution (60–300 m) NTL images to study local scale demographic and socioeconomic conditions. They have shown that these data outperformed the coarse spatial resolution DMSP-OLS data [36].
This study aims to investigate socioeconomic inequality patterns in China using VIIRS-obtained NTL radiance data. In doing so, it is expected to yield new explanations at different spatial scales. The remaining sections of this paper are organized as follows. Section 2 describes the data source and methods that were used to measure inequality conditions. Specifically, it proposes a spatial multi-scale method for depicting inequality in the distribution of NTL, GDP, and the population at county and prefecture-city levels. Section 3 presents inequality results (including the Gini coefficient, Theil index, and Lorenz asymmetry coefficient) derived from different indicators, and offers simple interpretations. Moreover, we examine correlations between some critical inequality indices of NTL radiance, GDP, and population. In Section 4, we present a detailed discussion of the results at various spatial scales to shed light on regional disparities in human activity and social wealth in China. Some reasons behind our findings are also explored. Finally, in Section 5, we draw conclusions based on our major findings.

2. Data and Methods

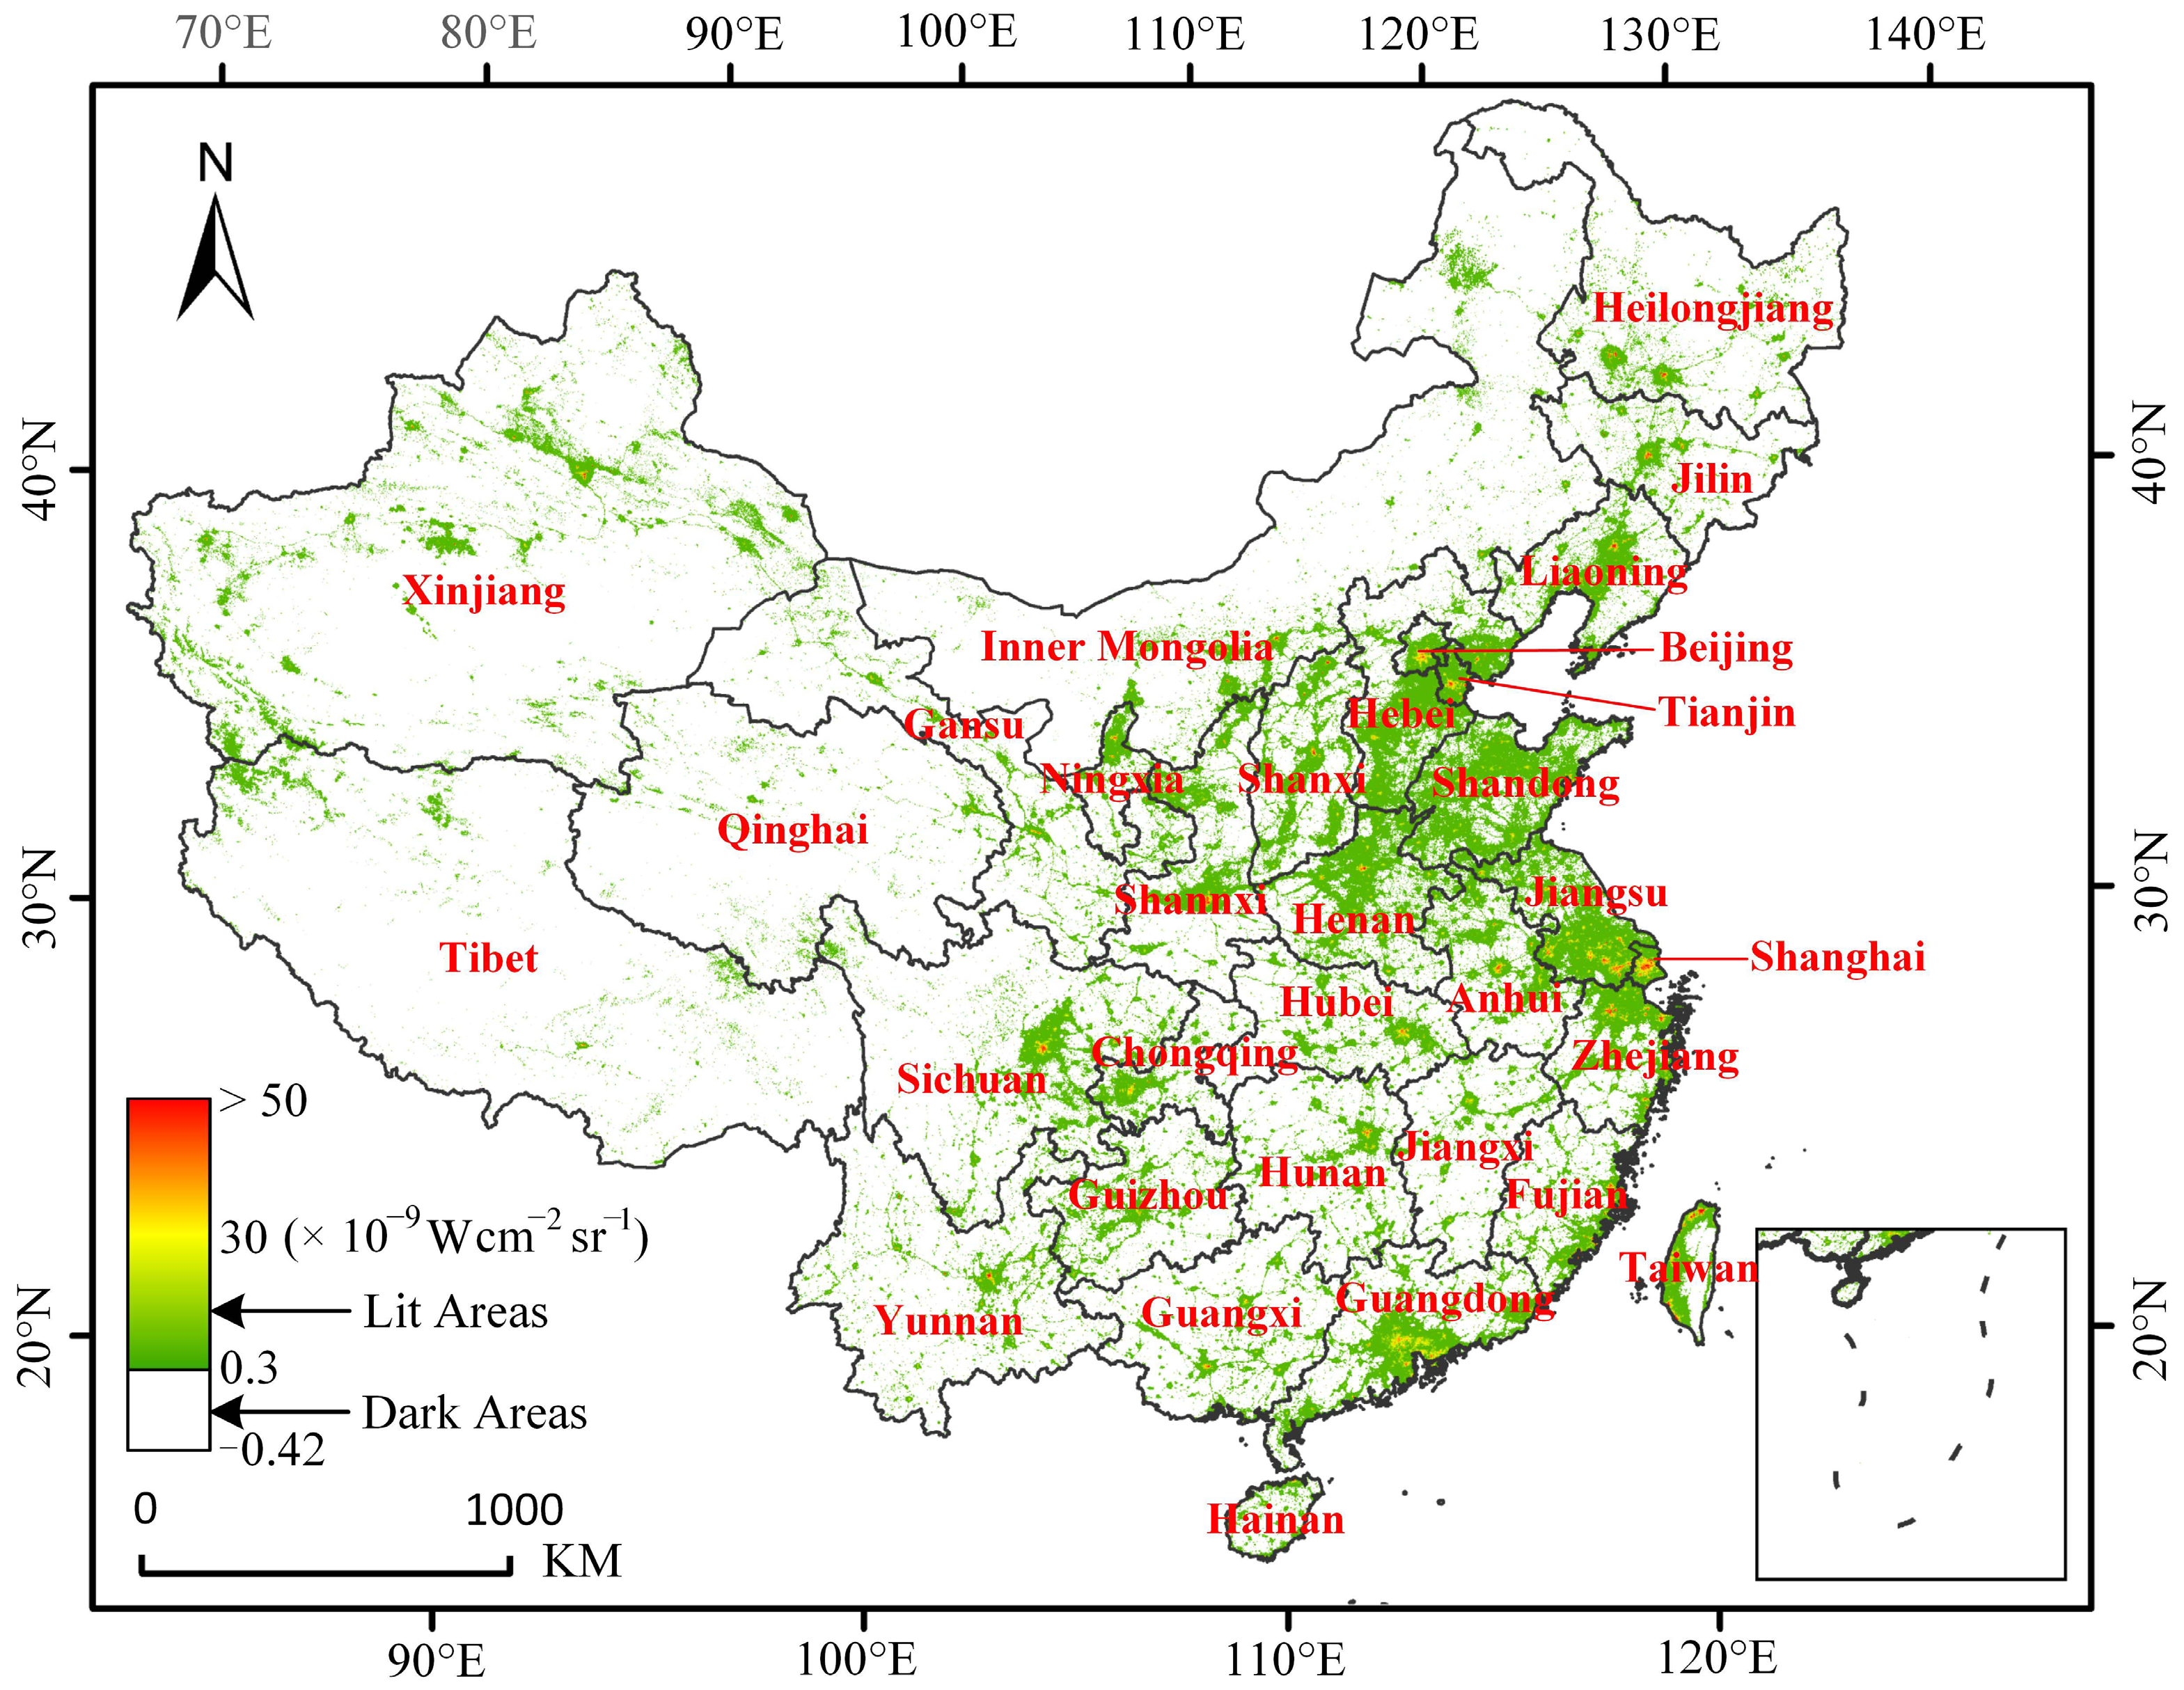
2.1. Visible Infrared Imaging Radiometer Suite (VIIRS) Nighttime Light Imagery

The NTL images used in this study were derived from the latest VIIRS data released for the year 2012 by NOAA-NGDC [37]. The cloud-free image composite, derived from the VIIRS DNB data in zero moonlight conditions, covered two periods: 18–26 May 2012 and 11–23 October 2012. Clouds were detected by the M15 band on the VIIRS and subsequently removed during the processing stage. This VIIRS product covered a spatial range of latitudes from 65°S to 75°N, with a spatial resolution of 15 arc seconds. The time delay and integration (TDI) charge coupled device (CCD) provided low light imaging capability for VIIRS DNB [38]. This meant that the product had a better spatial resolution and better sensitivity than the commonly used DMSP-OLS-derived images. We obtained the VIIRS nighttime radiance values by averaging cloud-free pixel brightness during the observation periods [30]. We then extracted the area of mainland China, as our study area, from the VIIRS eastern Asia product. This area was composed of 30 provinces and municipalities, excluding Hainan, Hong Kong, Macao, and Taiwan (Figure 1). These four administrative units were omitted to render NTL data consistent with the statistical data for each study unit. This process is described in the following subsection.
Some calibration activities conducted on the raw VIIRS data were required before these data could be directly used in the study. The VIIRS images had not been filtered to subtract background noise. We, therefore, applied a similar method to that used by Ma et al. [31] to minimize the effects of radiance noise. Following this method, we calculated the NTL radiance values of each pixel multiplied by its pixel area as a weight, referring to the WGS 84 Geographic Reference System (GRS). Using this area-weighted approach, we were able to alleviate the distortion effect when correcting the NTL images in the GRS. As an indicator of socioeconomic activities, the total summary of weighted NTL values in pixels for each study area was computed at the county level.
Figure 1. Visible Infrared Imaging Radiometer (VIIRS) nighttime light data for China in 2012.
Remotesensing 07 01242 g001

2.2. Economic and Demographic Data

Although the NTL imagery covered the entire area of China, economic data (e.g., GDP) were mainly confined to China’s mainland region because of limitations of the statistical data source. Population data at the county level was obtained from the demographic census of 2010 [39], because these data were not available for 2012. We investigated these data at the prefecture-city and county levels for the 30 provinces, which included a total of 341 prefecture-cities and 2849 counties. The population data of high-level administrative districts were obtained using the dissolve tool in GIS and by calculating the summary of the data in their sub-districts. The GDP data, which were only available for cities, were used as economic variables. These were acquired from the 2012 statistical yearbook of urban areas [40].
Additionally, we cleaned up data and adjusted some inconsistencies in the raw statistical data for the period between 2010 and 2012 that were caused by changes in the administrative regions (e.g., through merging or disintegration). Four municipalities—Beijing, Shanghai, Tianjin, and Chongqing—were treated as provinces in terms of data processing. GDP and demographic data of the corresponding administrative regions were matched as attribute fields to the vector map, which was derived from the National Geomatics Center of China. Although the population data had a two-year lag in relation to the corrected VIIRS light data and GDP, we assumed that the data remained credible and depicted correlations among the variables.

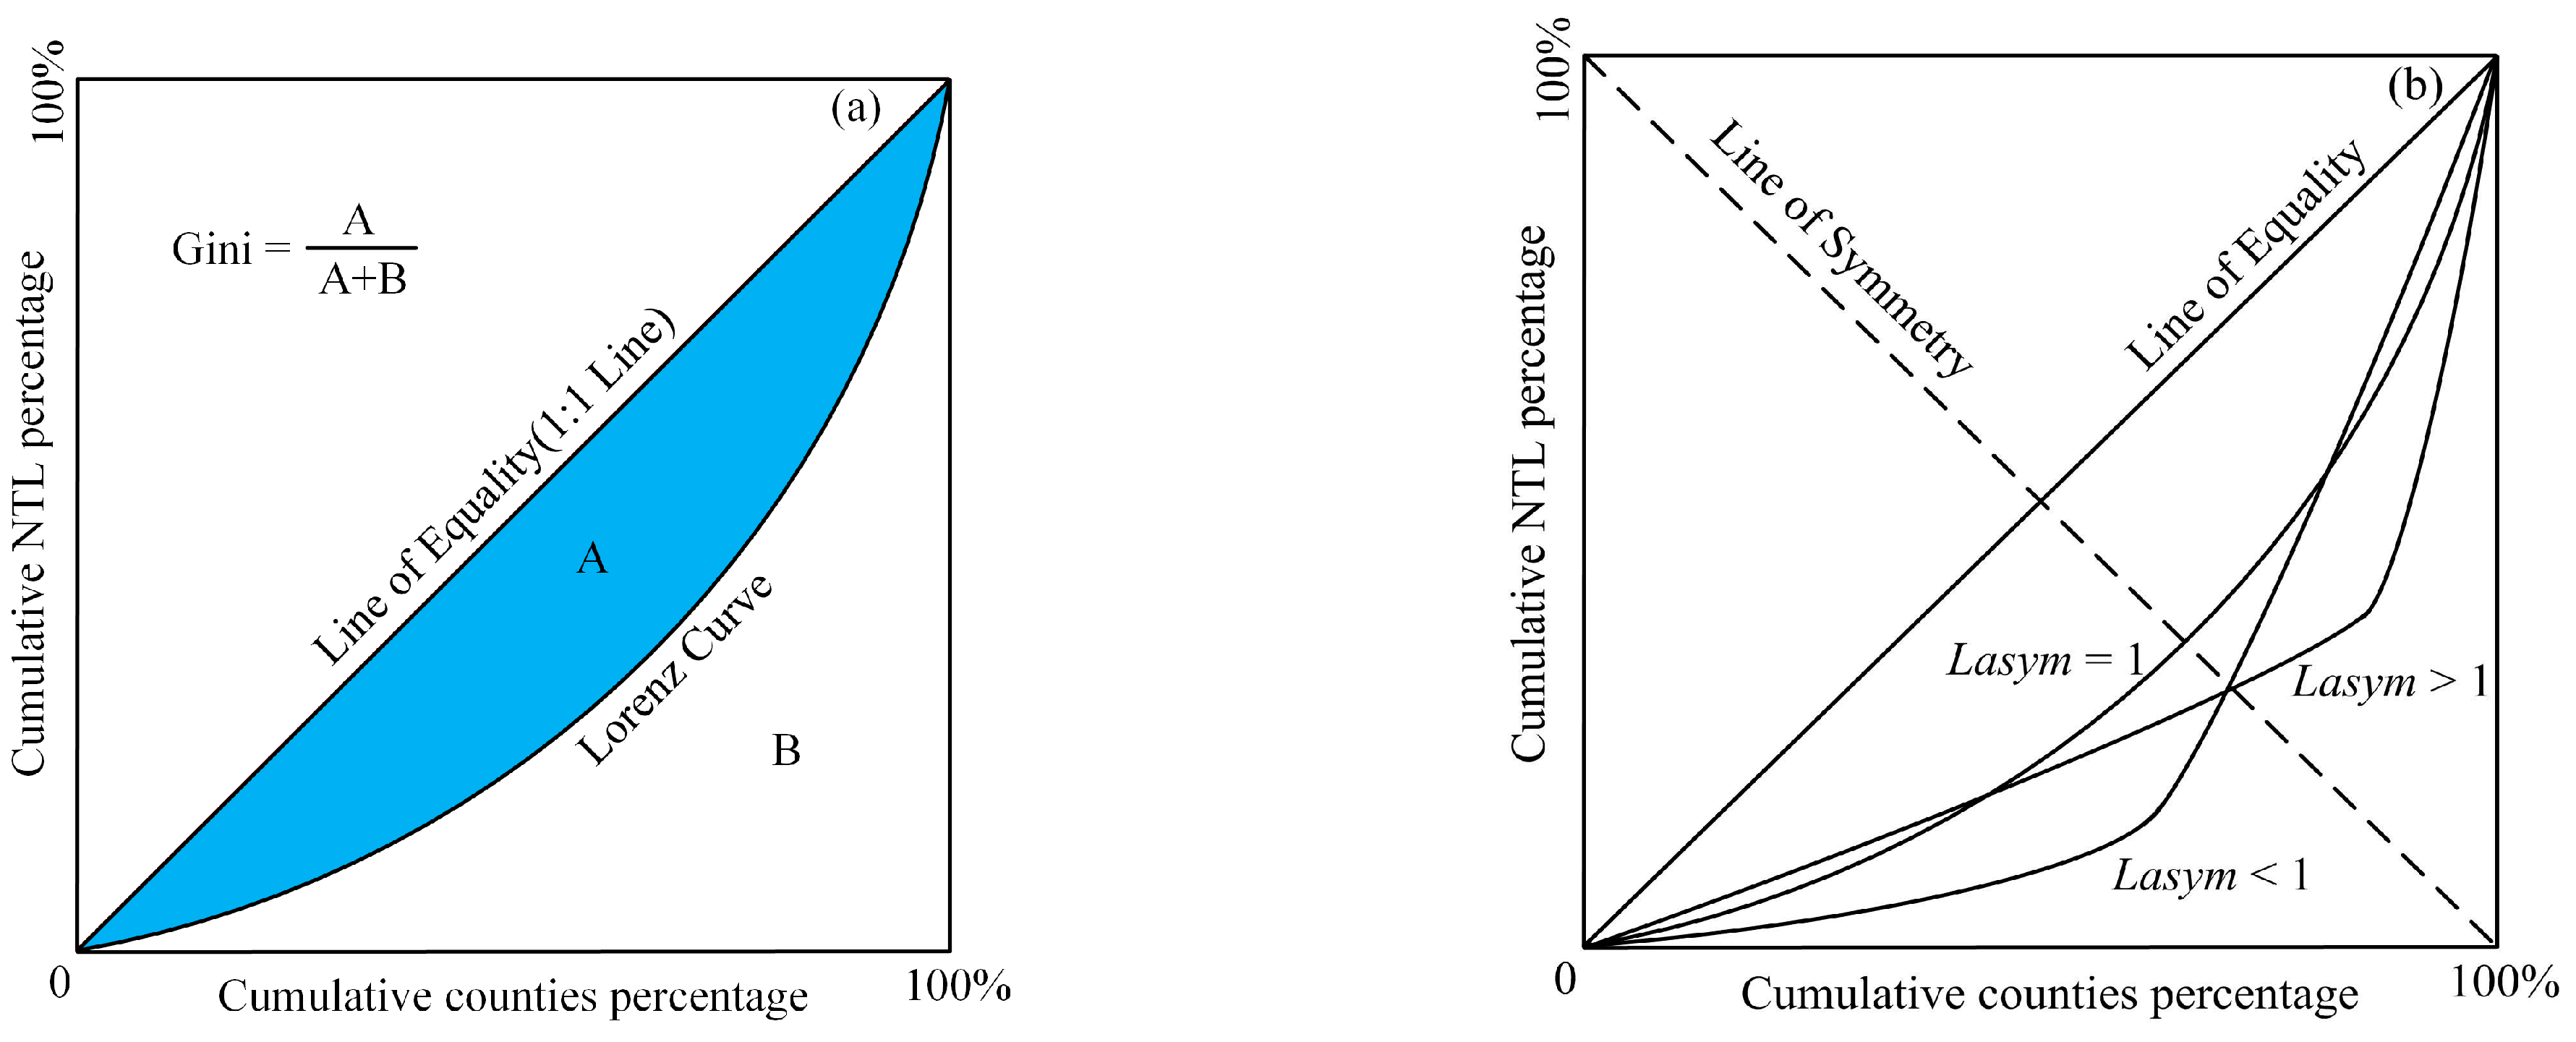
2.3. Inequality Analysis Methods at Multiple Levels

In economics, GDP and population play important roles as indicators of regional development status. In this study, satellite-derived NTL data served as a proxy variable for depicting inequality status. We analyzed the relations between the GDP, NTL, and population using the linear regression method to elicit their potential capability to respond to socioeconomic disparities. Moreover, to effectively examine the socioeconomic distribution status from various perspectives, based on previously processed materials, we examined several inequality coefficients that could provide detailed information to further our understanding of the inequality issue.
Within economics, the Gini coefficient is a measure of statistical dispersion that is intended to represent the distribution of a variable across residents, regions or nations [34]. This coefficient is derived from the Lorenz curve and has been widely used as a major index of income distribution (see Figure 2a). For this study, we employed two different types of Gini coefficients: unweighted and weighted. The unweighted Gini coefficient was computed using the formula depicted in Equation (1) [41], where y i and y j represent per capita GDP for the regions i and j, respectively; and y ¯ u is the unweighted mean of per capita GDP for the n study regions, Figure 2a depicts a graphical representation of the Gini index taking the NTL value at the county level as an example. The blue area, A, comprises the equality line and the Lorenz curve, B is the area under the Lorenz curve, and the Gini index is equal to A divided by the sum of A and B.
Figure 2. Graphical representations of the Gini index (a) and Lasym index (b).
Remotesensing 07 01242 g002
G = ( 1 2 y ¯ u ) 1 n ( n 1 ) i n j n | y i y j |
The weighted Gini coefficient was calculated by weighting each per capita GDP with its associated population proportion to obtain the effect of population on wealth distribution [41]. P is the total population of n study areas, and y ¯ is the mean of per capita GDP, as shown in Equation (2).
G w = ( 1 2 y ¯ ) i n j n | y i y j | p i p j P 2
The Theil index, which is an inequality index derived from the information entropy domain, was calculated as shown in Equation (3):
T =   1 n i n x i x ¯ log x i x ¯  
where n is the sample size, x ¯ is the mean of x, and x i is the value (e.g., GDP, NTL, or population ) of region i.
T w =   i n x i log x i q i  
The corresponding weighted Theil index was calculated, as shown in Equation (4), by adding population as a weight for each study region. As in the case of the weighted Theil index of GDP, x i is the GDP proportion contributed by region i to the total GDP, and q i represents the population share of region i [41].
Because the Gini coefficient is derived from the Lorenz Curve, a differently shaped Lorenz Curve may have had an identical Gini value (Figure 2b). To further explore the potential of the Gini coefficient, the Lorenz asymmetry coefficient (Lasym) was used [42], because it can detect asymmetric conditions of the Lorenz curve, which is useful information for the Gini index. Regarding Lasym results, a value of 1 indicates perfect symmetry. A score of less than 1 indicates that many small classes are the primary contributors to the status of inequality, and a score greater than 1 reflects the contributions of the small proportion of the individuals who are the wealthiest (Figure 2b). For this study, Equations (1)–(4) and the Lasym coefficient were applied to the GDP and NTL. The unweighted inequality formulas, i.e., Equations (1) and (3), and the Lasym coefficient, were used for population.
It is noteworthy that analysis of NTL disparity in China has been relatively limited. Detailed and specialized studies that focus on China’s NTL inequality and consider spatial scales are rare. Because of the characteristics of the data source, NTL brightness was able to explicitly depict the spatial distribution of socioeconomic activities. Based on the inequality indices shown above, we calculated the nightlight-derived inequality indices for the 30 provinces at different spatial scales. First, the province inequality indices of NTL and population were investigated at the county level. Then, identical indices of NTL, GDP, and population for the provinces were calculated at the prefecture-city level. Differences between NTL and population inequality indices obtained from these two spatial scales were analyzed by performing a t-test. In addition, relations between NTL, GDP, and population were observable at the provincial and city levels using the linear regression method.

3. Results

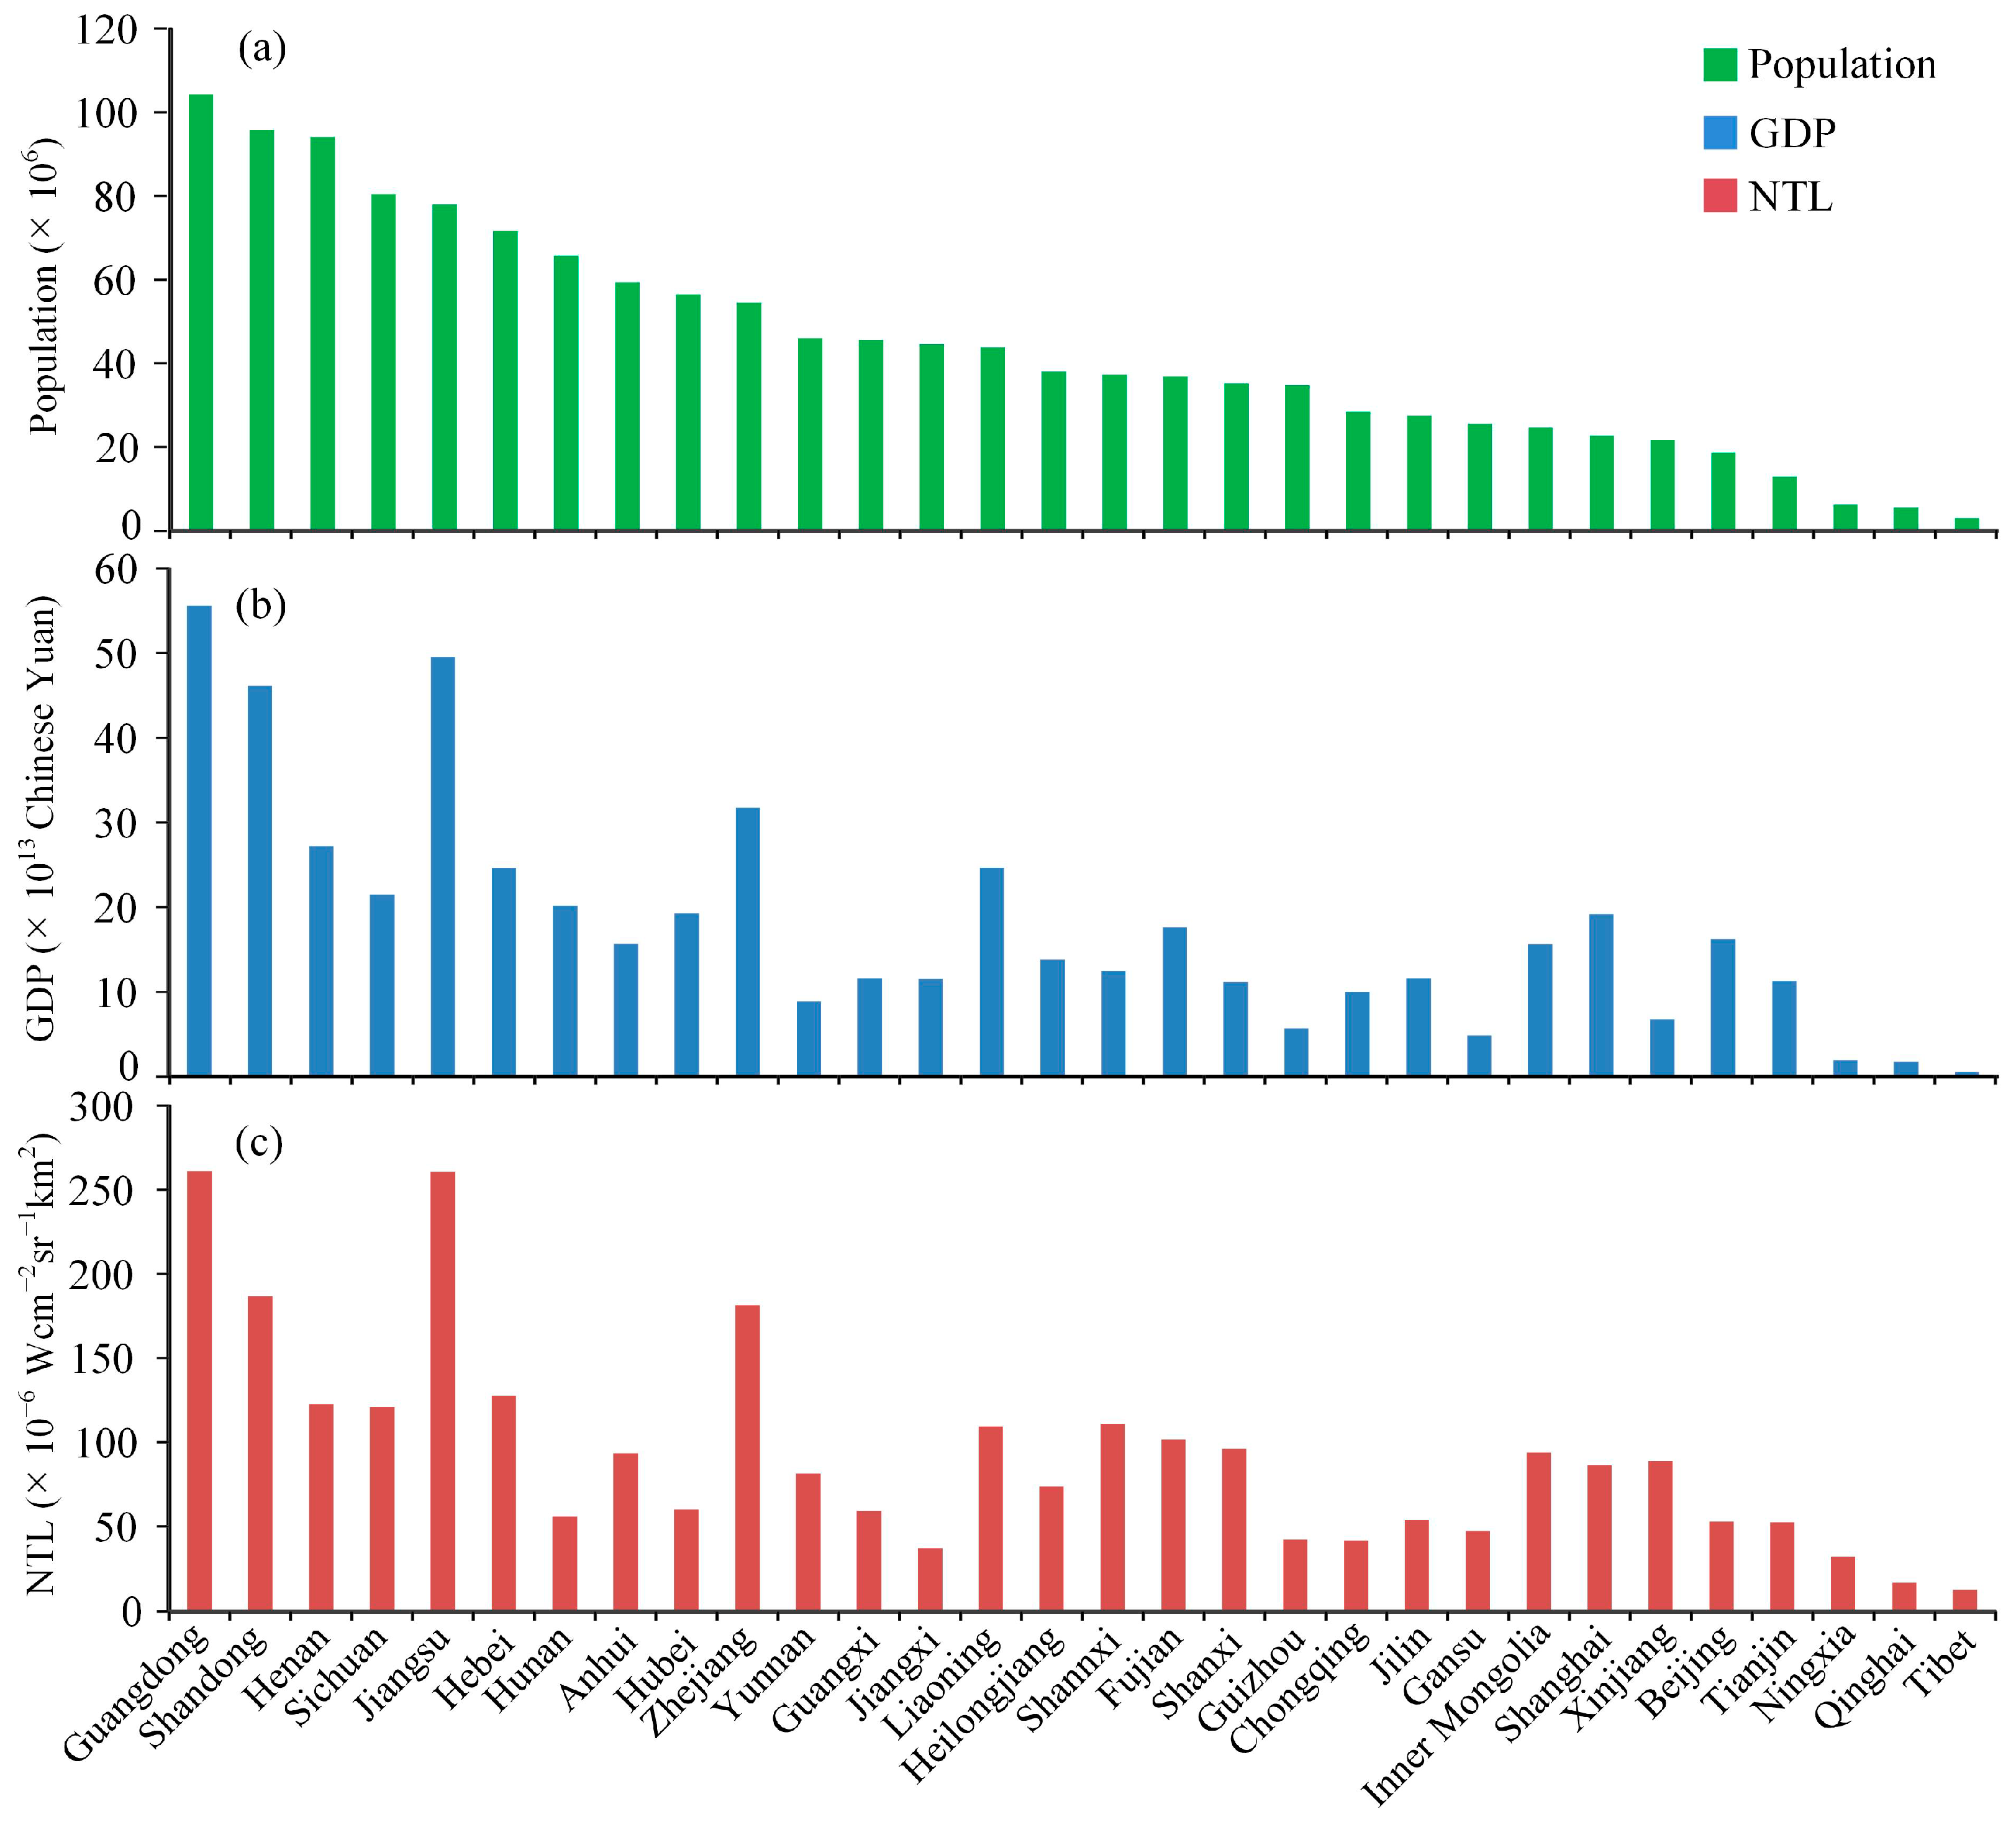
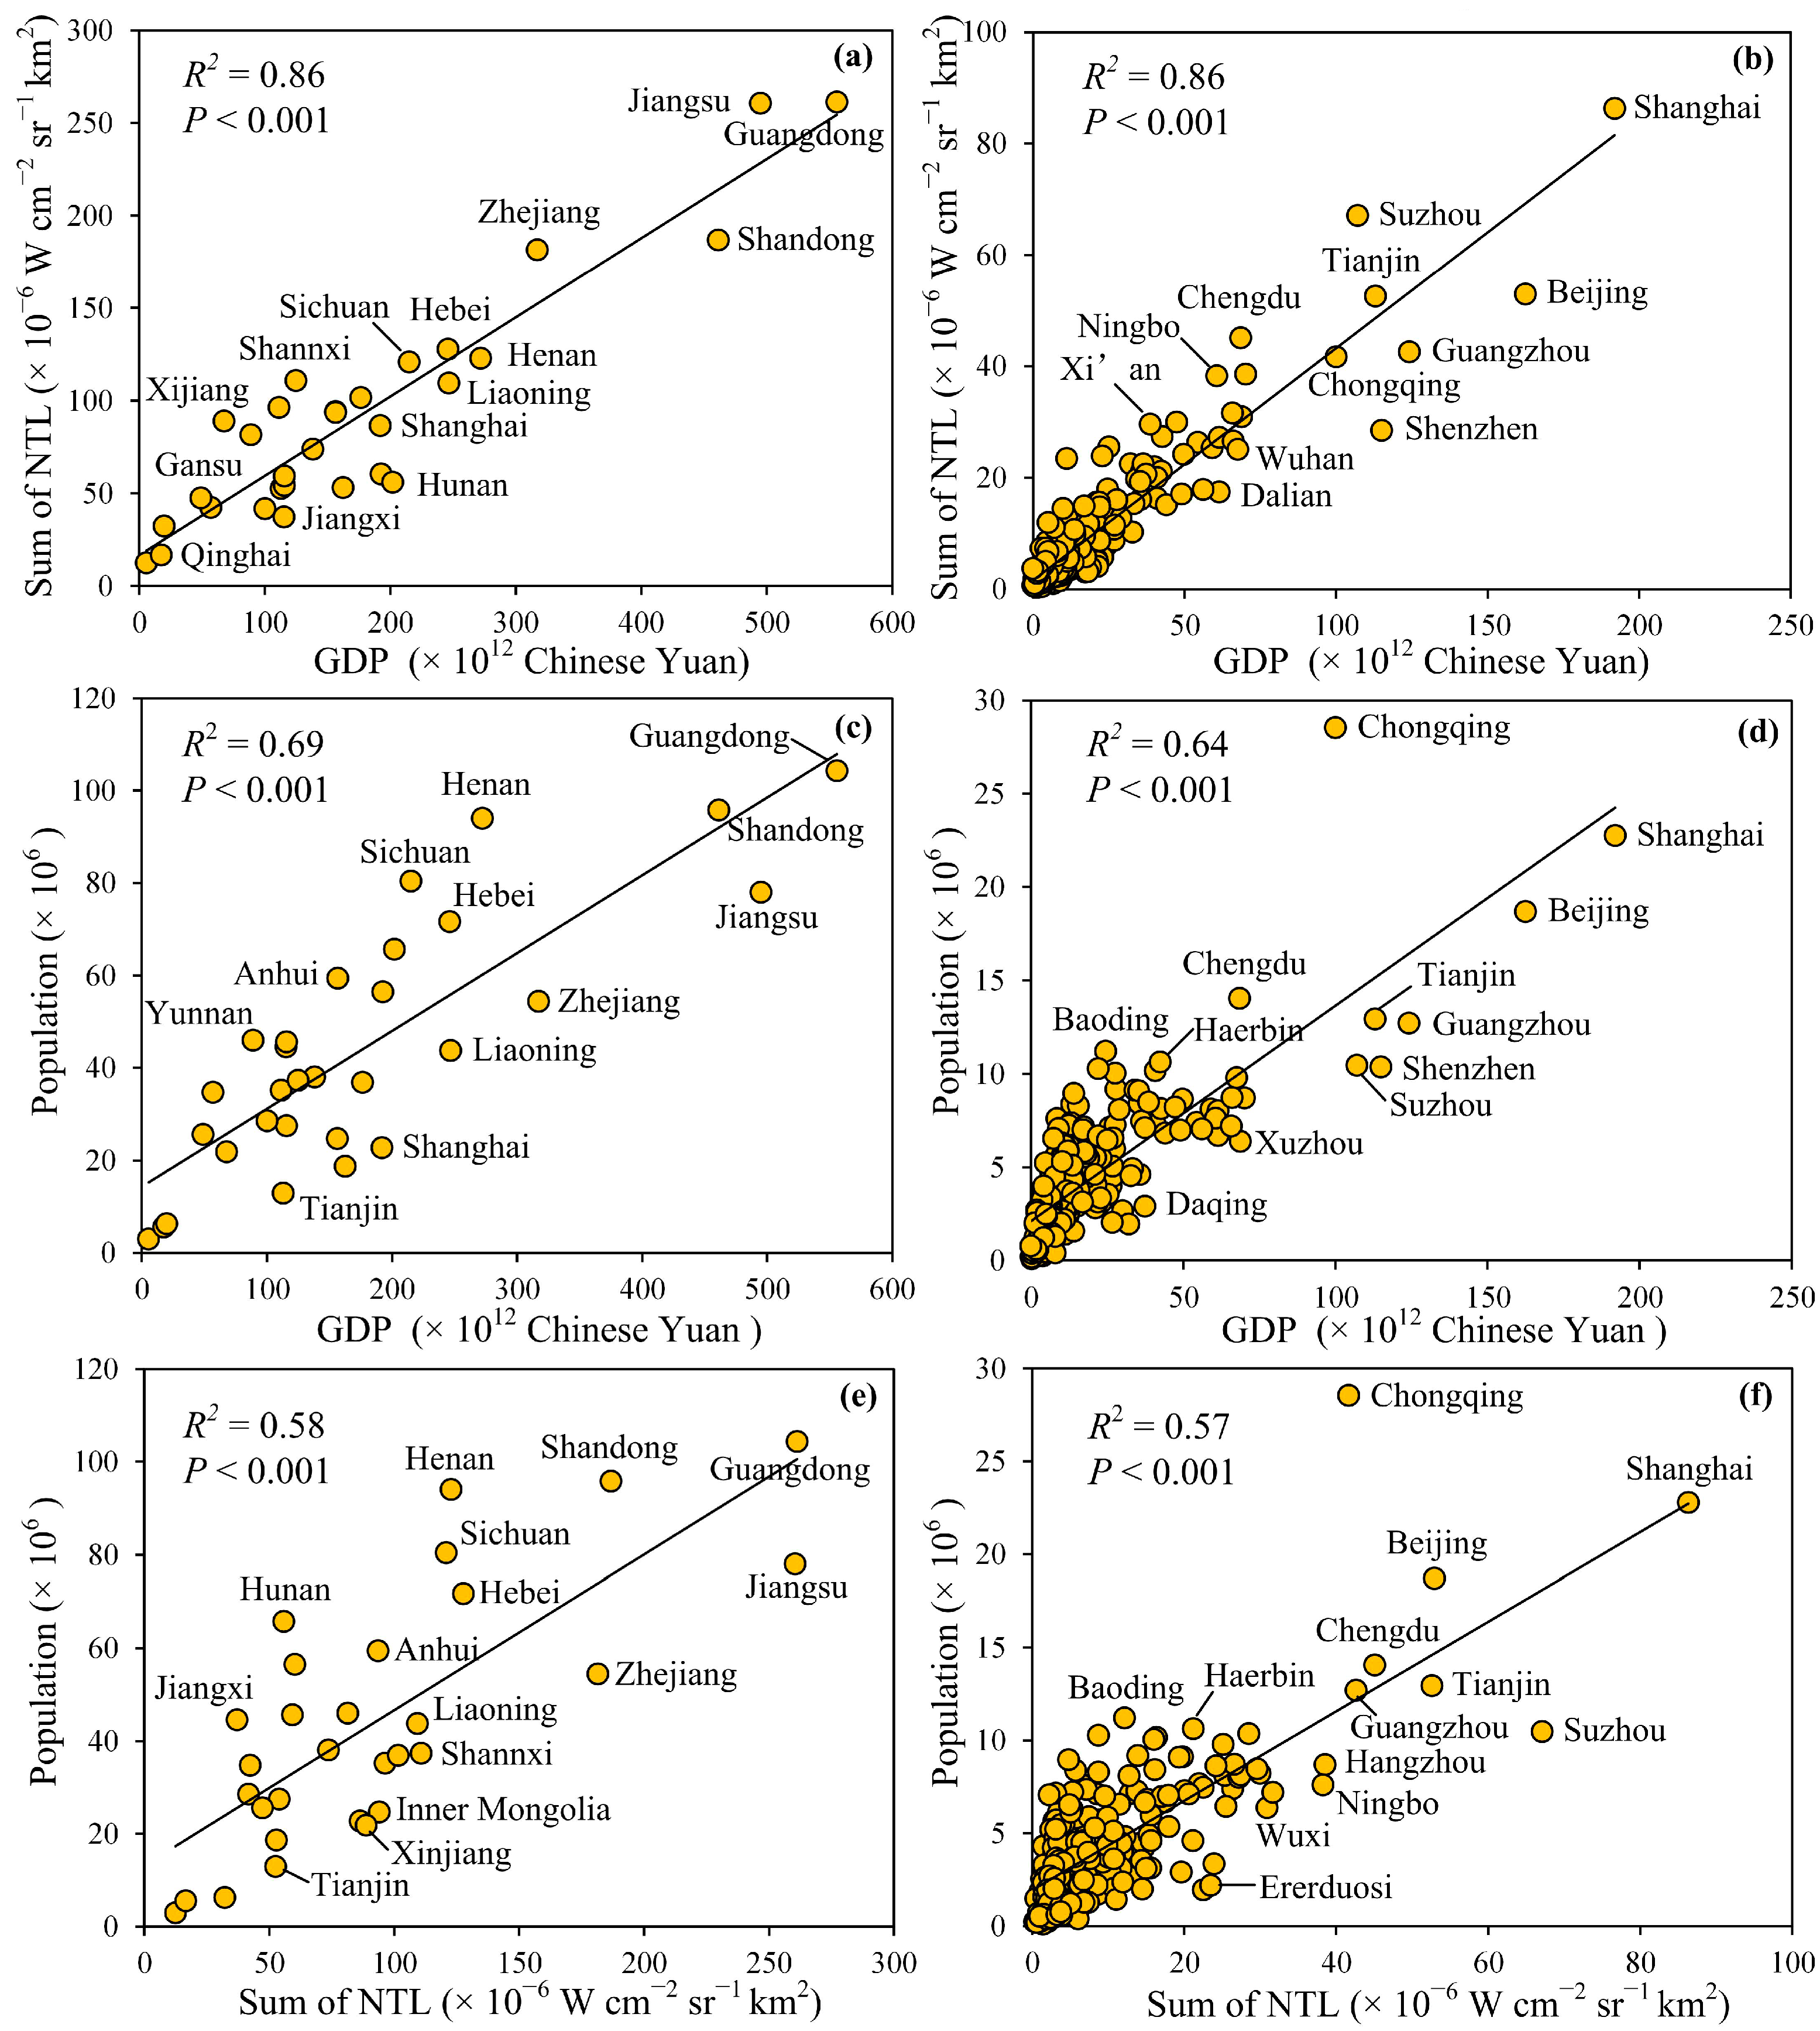
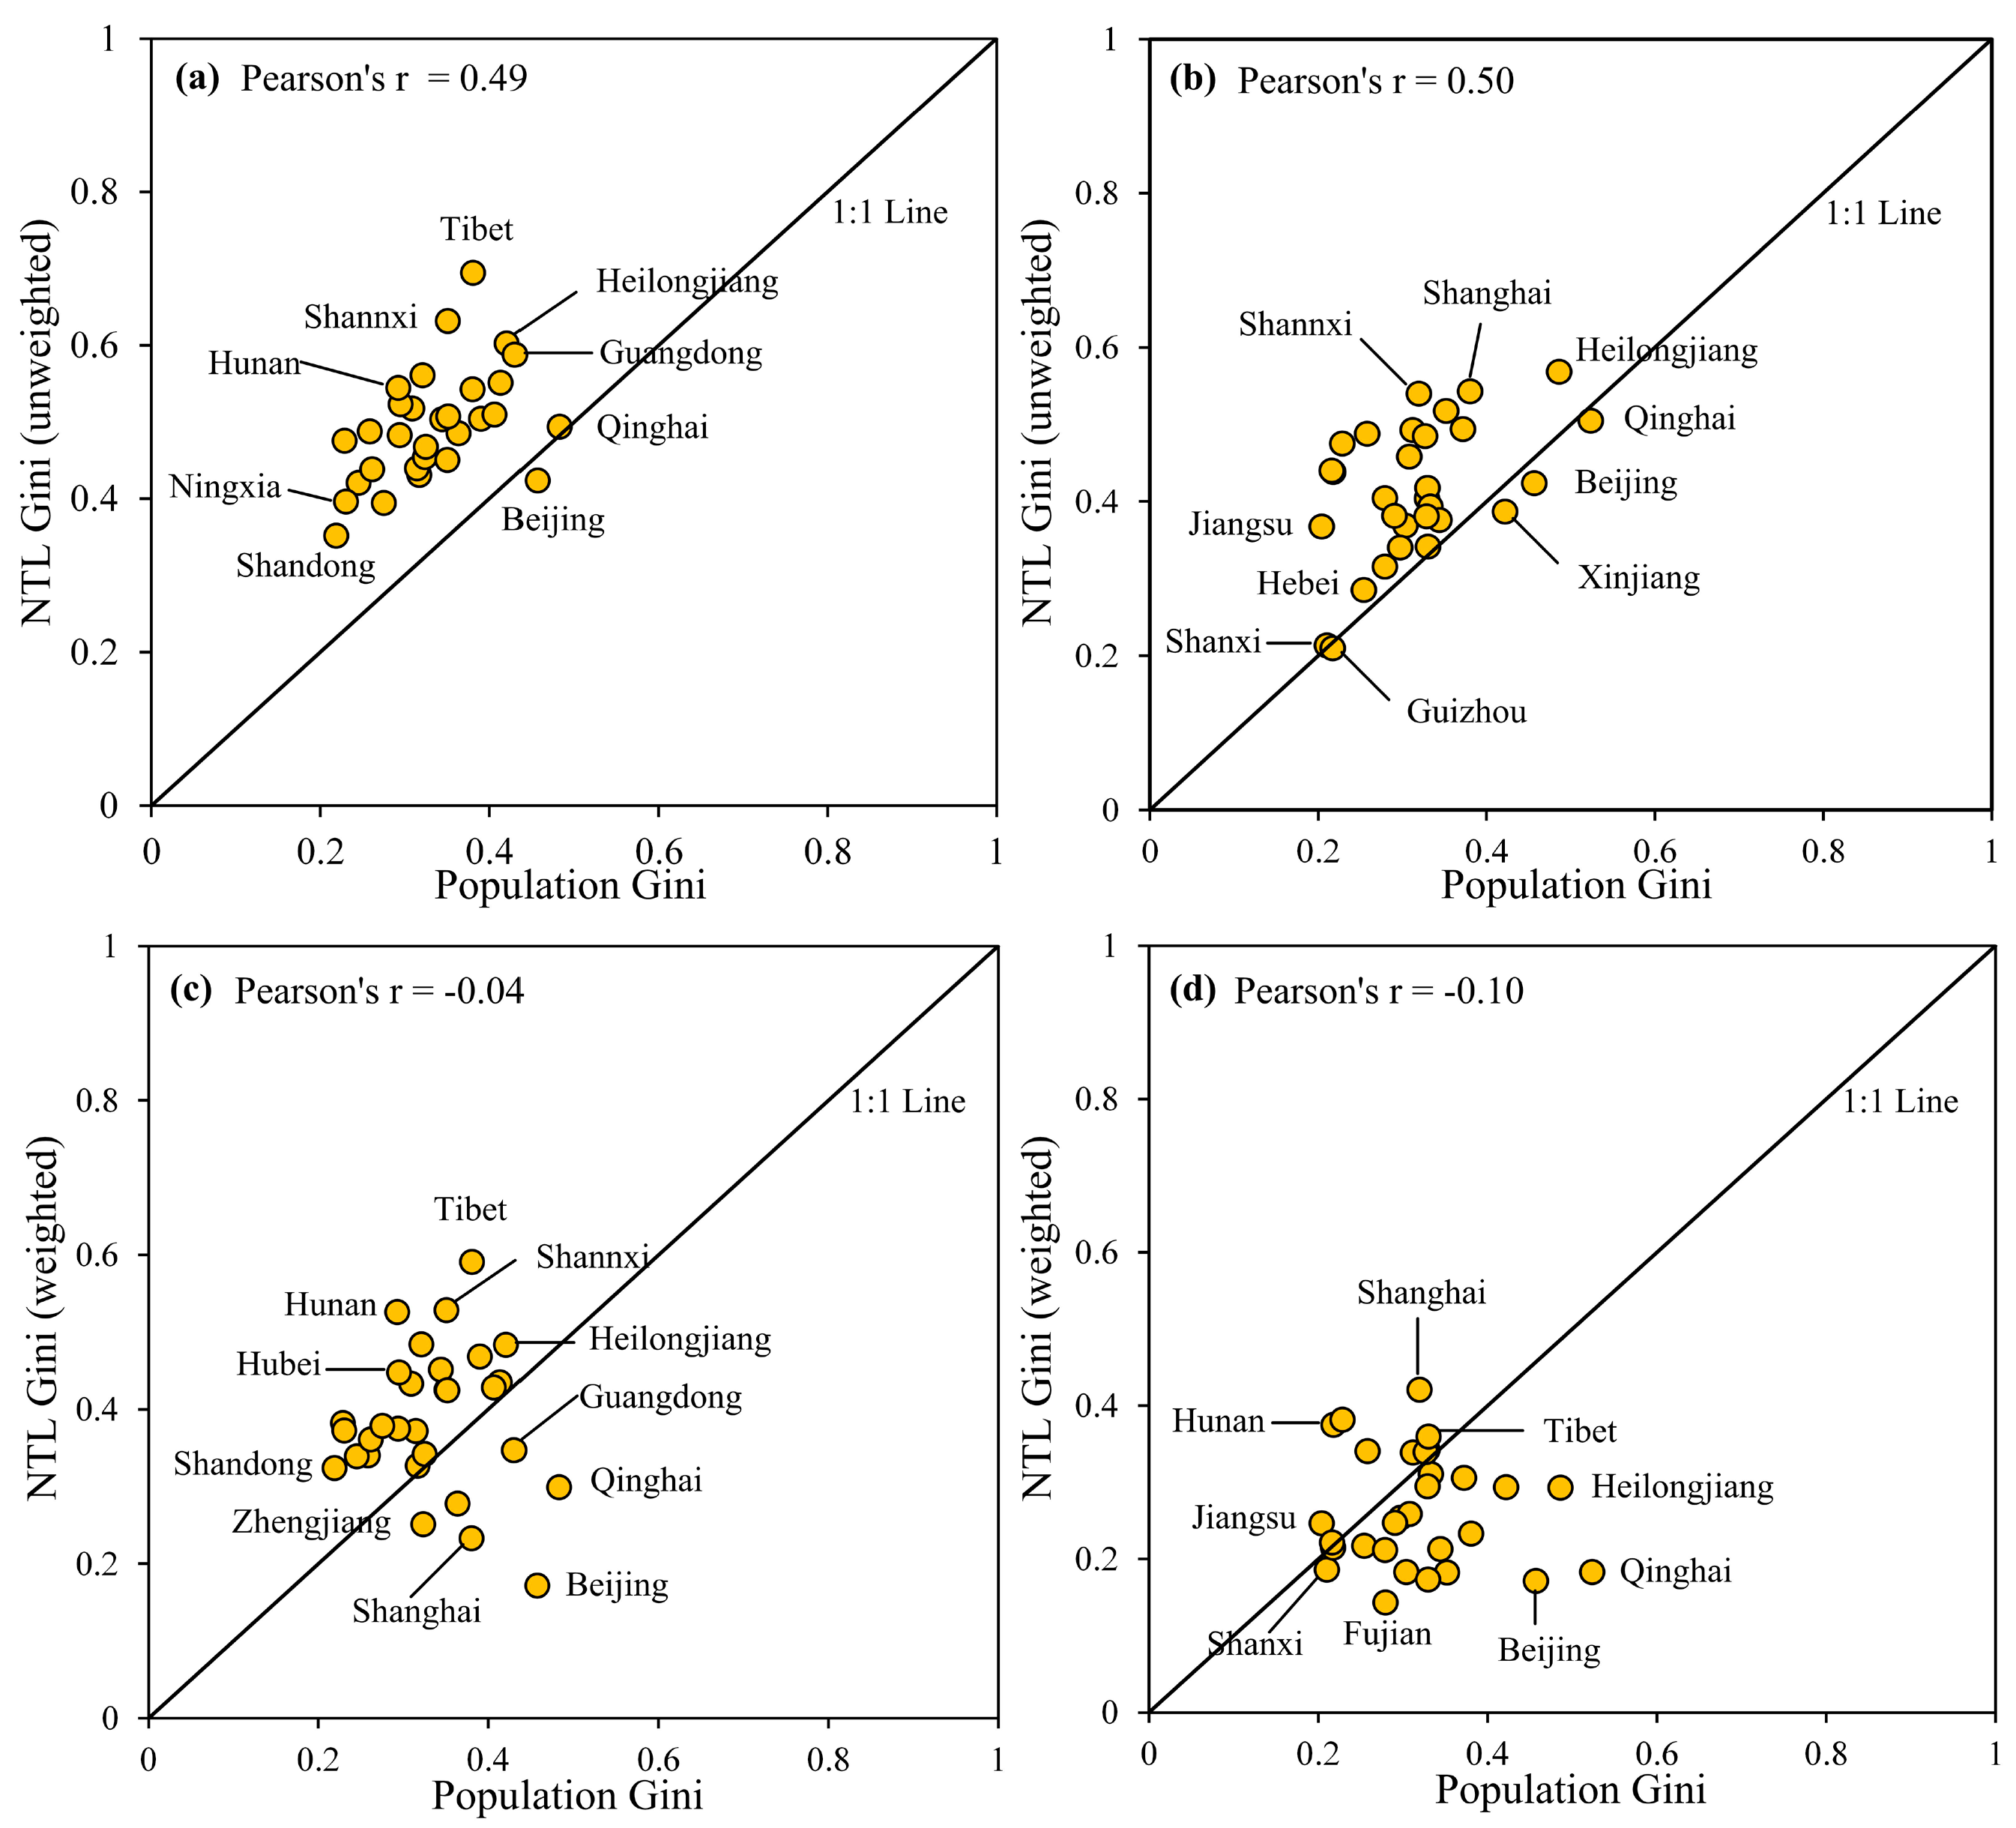
3.1. Relationships between Nighttime Light, Gross Domestic Product, and Population

Before proceeding further in our analysis, we must first develop clear insights into the relations between NTL, GDP, and population. As shown in Figure 3, the bar plots of population, GDP and NTL were shown in descending order of the population size. Comparisons of Figure 3a with Figure 3b,c indicate that provinces with larger populations had generally higher GDP and NTL indices. However, we can also observe conspicuous disparities from the rise and fall trend in both GDP and NTL (Figure 3b,c). Guangdong, Zhejiang, Jiangsu, Liaoning could generally group all provinces into four intervals. Other provinces falling into these intervals exhibit decreased trends in both indices even though there were slight fluctuations after Liaoning. Henan, Sichuan and Hunan, for instance, have relatively low GDP and NTL values in comparison with the corresponding population size. Moreover, Gansu, a northwestern province with a nearly identical population size to Shanghai, had only half of the NTL of Shanghai.
Figure 3. Population (a), GDP (gross domestic product) (b), NTL (nighttime light) (c) of 30 provinces in China.
Remotesensing 07 01242 g003
We evaluated the relationships between NTL, GDP, and population at the provincial and prefectural city levels by applying a linear regression model. The use of this multilevel approach helped to guard against overstating the real relations between these variables. It has been well documented that DMSP nighttime lights can be regarded as an indicator of socioeconomic activity at local and regional scales [18]. Our results showed that the VIIRS nightlight radiance had a significant positive correlation with GDP (coefficient of determination: R2 = 0.86, p < 0.001) as well as with population (Figure 4). Thus, the results suggest that the VIIRS data can explain 86% of the variance in GDP value. GDP was also positively correlated with population. The VIIRS data showed a higher positive response to GDP than to the population (R2 = 0.69, compared with R2 = 0.86). In the scatter plot depicted in Figure 4d, a notable outlier point at the upper end is Chongqing, a municipality that is managed directly by the central government as a province that is more populated than a common prefectural city. Data for Chongqing were thus included in the analysis at both the provincial and the prefectural levels. Additionally, because of a two-year gap between VIIRS light brightness data (available for 2012) and demographic data (available for 2010), a slightly positive linear relation was evident at the prefectural and the provincial levels (R2 = 0.58, compared with R2 = 0.57 as shown in Figure 4e,f). However, this finding confirms the timely advantage of NTL data in monitoring economic dynamics. In addition to the time gap, the inclusion of the number of people living in unlit regions in the population data may have reduced its correlation with NTL. The correlation between GDP and population was also affected by these factors.
Figure 4. Scatter plots depicting the relationship between nighttime light (NTL), gross domestic product (GDP), and population at the provincial (Left) and prefectural (Right) levels. (a) and (b): relationship between GDP and NTL; (c) and (d): relationship between GDP and population; (e) and (f): relationship between NTL and population.
Remotesensing 07 01242 g004

3.2. Inequality Estimation

In this study, four Chinese municipalities were included in the calculation at both the provincial and the prefectural levels. As shown in Table 1, Tianjin, which is a municipality adjacent to Beijing, received a higher score (0.78) on the Theil measure for GDP than nearly all of the other provinces, indicating that its sub-districts experienced high levels of inequality. In fact, Tianjin is a small city, and its core urban area has more intensive commerce and industry than other administrative districts. These factors could have produced this unequal status. The Lasym measure of population in Jiangxi Province indicates a low value of 0.70, implying that this province has a few prefectures with small populations.
To further examine the distribution of NTL and population, we estimated relations between the measures of the inequality indices for NTL and the population using a scatter plot matrix, as shown in Figure 5. We compared the weighted and unweighted Gini coefficients of provinces at the county and the prefectural city levels, respectively (Figure 5). It was apparent that weighted Gini plots (Figure 5c,d) dropped below the 1:1 line denoting equality, whereas unweighted points (Figure 5a,b) were rarely located below the diagonal line. Based on our detailed observation, we concluded that a relatively similar order existed for Beijing, Qinghai, Guangdong, and Heilongjiang in the plot after the weighted computations were done (Figure 5a,c). Additionally, at the identical level (Figure 5a,c), weighted Gini plots were more scattered than unweighted Gini plots (Pearson’s r −0.04 vs. 0.49). This could indicate the influence of the population on their co-distribution patterns. Here, we observed a slight trend, which indicated that the Gini values of NTL increased as the population Gini values rose (Figure 5a,b). Their Pearson’s correlations were 0.49 and 0.50 at county and prefectural city level, respectively, which confirmed their relationship. This result indicated that the distribution of NTL was consistent with the distribution of the population at these two levels in China. Similar weighted and unweighted NTL Gini values would imply that regions corresponding to different NTL distribution points would have similar populations. For example, the weighted and unweighted NTL Gini values of Shanxi Province were similar to those at the county level (approximately 0.2) (Figure 5b,d), indicating that the populations of the counties in this province were distributed equally.
Table 1. Inequality indices derived from the prefectural city level estimation across 30 provinces in China. For the Gini and Theil indices, higher values indicate increased inequality and lower values indicate increased equality.
ProvinceNTLPopulationGDP
GGwTTwLasymGTLasymGGwTTwLasym
Beijing0.42 0.17 0.260.050.840.460.301.040.600.380.550.270.98
Tianjin0.49 0.34 0.370.190.970.260.121.230.580.420.780.321.45
Hebei0.29 0.22 0.110.081.040.250.090.880.350.220.170.080.98
Shanxi0.21 0.19 0.070.061.010.210.060.910.210.180.070.051.13
Inner-Mongolia0.40 0.34 0.220.211.080.330.160.880.430.340.250.191.00
Liaoning0.37 0.18 0.220.051.390.300.141.360.470.230.380.091.28
Jilin0.52 0.18 0.390.051.230.350.171.180.450.130.290.031.20
Heilongjiang0.57 0.29 0.510.191.300.490.351.210.580.320.540.211.27
Shanghai0.54 0.23 0.460.100.890.380.241.180.420.240.360.111.37
Jiangsu0.37 0.25 0.210.101.130.200.061.050.370.240.190.091.20
Zhejiang0.42 0.17 0.250.051.070.330.150.890.400.160.220.041.06
Anhui0.39 0.31 0.250.161.150.330.160.960.340.300.210.151.32
Fujian0.40 0.14 0.210.031.010.280.111.230.360.120.170.031.13
Jiangxi0.38 0.21 0.190.090.960.340.170.700.300.250.130.121.05
Shandong0.32 0.21 0.140.081.080.280.110.900.300.240.130.101.02
Henan0.34 0.25 0.200.101.080.300.130.920.320.230.170.091.38
Hubei0.49 0.34 0.500.211.400.310.141.070.490.320.420.161.27
Hunan0.44 0.37 0.340.241.160.220.070.950.400.300.270.161.08
Guangdong0.46 0.26 0.320.111.110.310.141.070.570.350.550.191.20
Guangxi0.38 0.25 0.230.101.170.290.120.900.330.180.160.051.23
Chongqing0.47 0.38 0.370.230.910.230.081.050.420.290.260.140.95
Sichuan0.48 0.34 0.560.191.350.330.191.150.450.220.450.081.30
Guizhou0.21 0.21 0.070.081.310.220.061.280.330.200.150.071.14
Yunnan0.49 0.31 0.420.151.120.370.201.030.510.270.410.121.13
Tibet0.34 0.36 0.160.221.230.330.140.860.520.310.370.191.14
Shaanxi0.54 0.42 0.400.311.020.320.141.200.470.260.300.111.18
Gansu0.38 0.29 0.240.141.460.330.160.790.390.370.260.231.16
Qinghai0.50 0.18 0.330.070.980.520.381.200.650.330.570.231.03
Ningxia0.44 0.22 0.210.091.210.220.051.360.470.280.250.141.33
Xinjiang0.39 0.29 0.210.150.920.420.251.030.500.430.310.310.92
Mean0.410.260.280.131.120.320.151.050.430.270.310.141.16
To display the distribution of weighted NTL Theil and weighted NTL Gini indices for the 30 provinces, we created a boxplot to display distribution differences at the county level (pink box) and at the prefecture level (green box) (Figure 6). The Theil inequality index of provinces varied from 0.05 in Beijing to 0.7 in Tibet at the county level, and from 0.05 in Ningxia to 0.38 in Qinghai at the prefectural level. The Gini inequality index of provinces ranged from 0.17 in Beijing to 0.59 in Tibet at the county level, and from 0.14 in Fujian to 0.42 in Shannxi at the prefectural level. In the boxplot, the median lines highlight obvious disparities between the two levels. Even at identical levels, the Gini index was higher than the Theil index. This difference may be attributed to its sensitivity to high values. Moreover, there were outlier points in the interprovincial Theil and Gini indices calculated at the county level. This indicates that there may have been a more uneven distribution of NTL at the county level.
Figure 5. Relationships between nighttime light (NTL) Gini and population Gini: (a) and (b) are unweighted Gini of NTL; (c) and (d) are population weighted Gini of NTL; (left panel) the results of (a) and (c) were derived from the county level estimation; (right panel) (b) and (d) were derived from the prefectural level estimation.
Remotesensing 07 01242 g005
Figure 6. Boxplots depicting statistical distributions of nighttime light Gini and nighttime night Theil for China’s 30 provinces at the county and prefectural levels.
Remotesensing 07 01242 g006
In addition to our exploratory data analysis, we performed t-tests for Gini and Theil indices to examine differences at these two levels, as shown in Figure 6. The t-test of the two Gini index groups yielded a t-value of 5.7 and a p-value < 0.001, and the t-test of the Theil index yielded a t-value of 5.0 and a p-value < 0.001. These results indicate that the Gini and Theil indices derived at the county level differed significantly from those derived at the prefectural level, reflecting the multi-scale effect of inequality patterns in the statistical results.

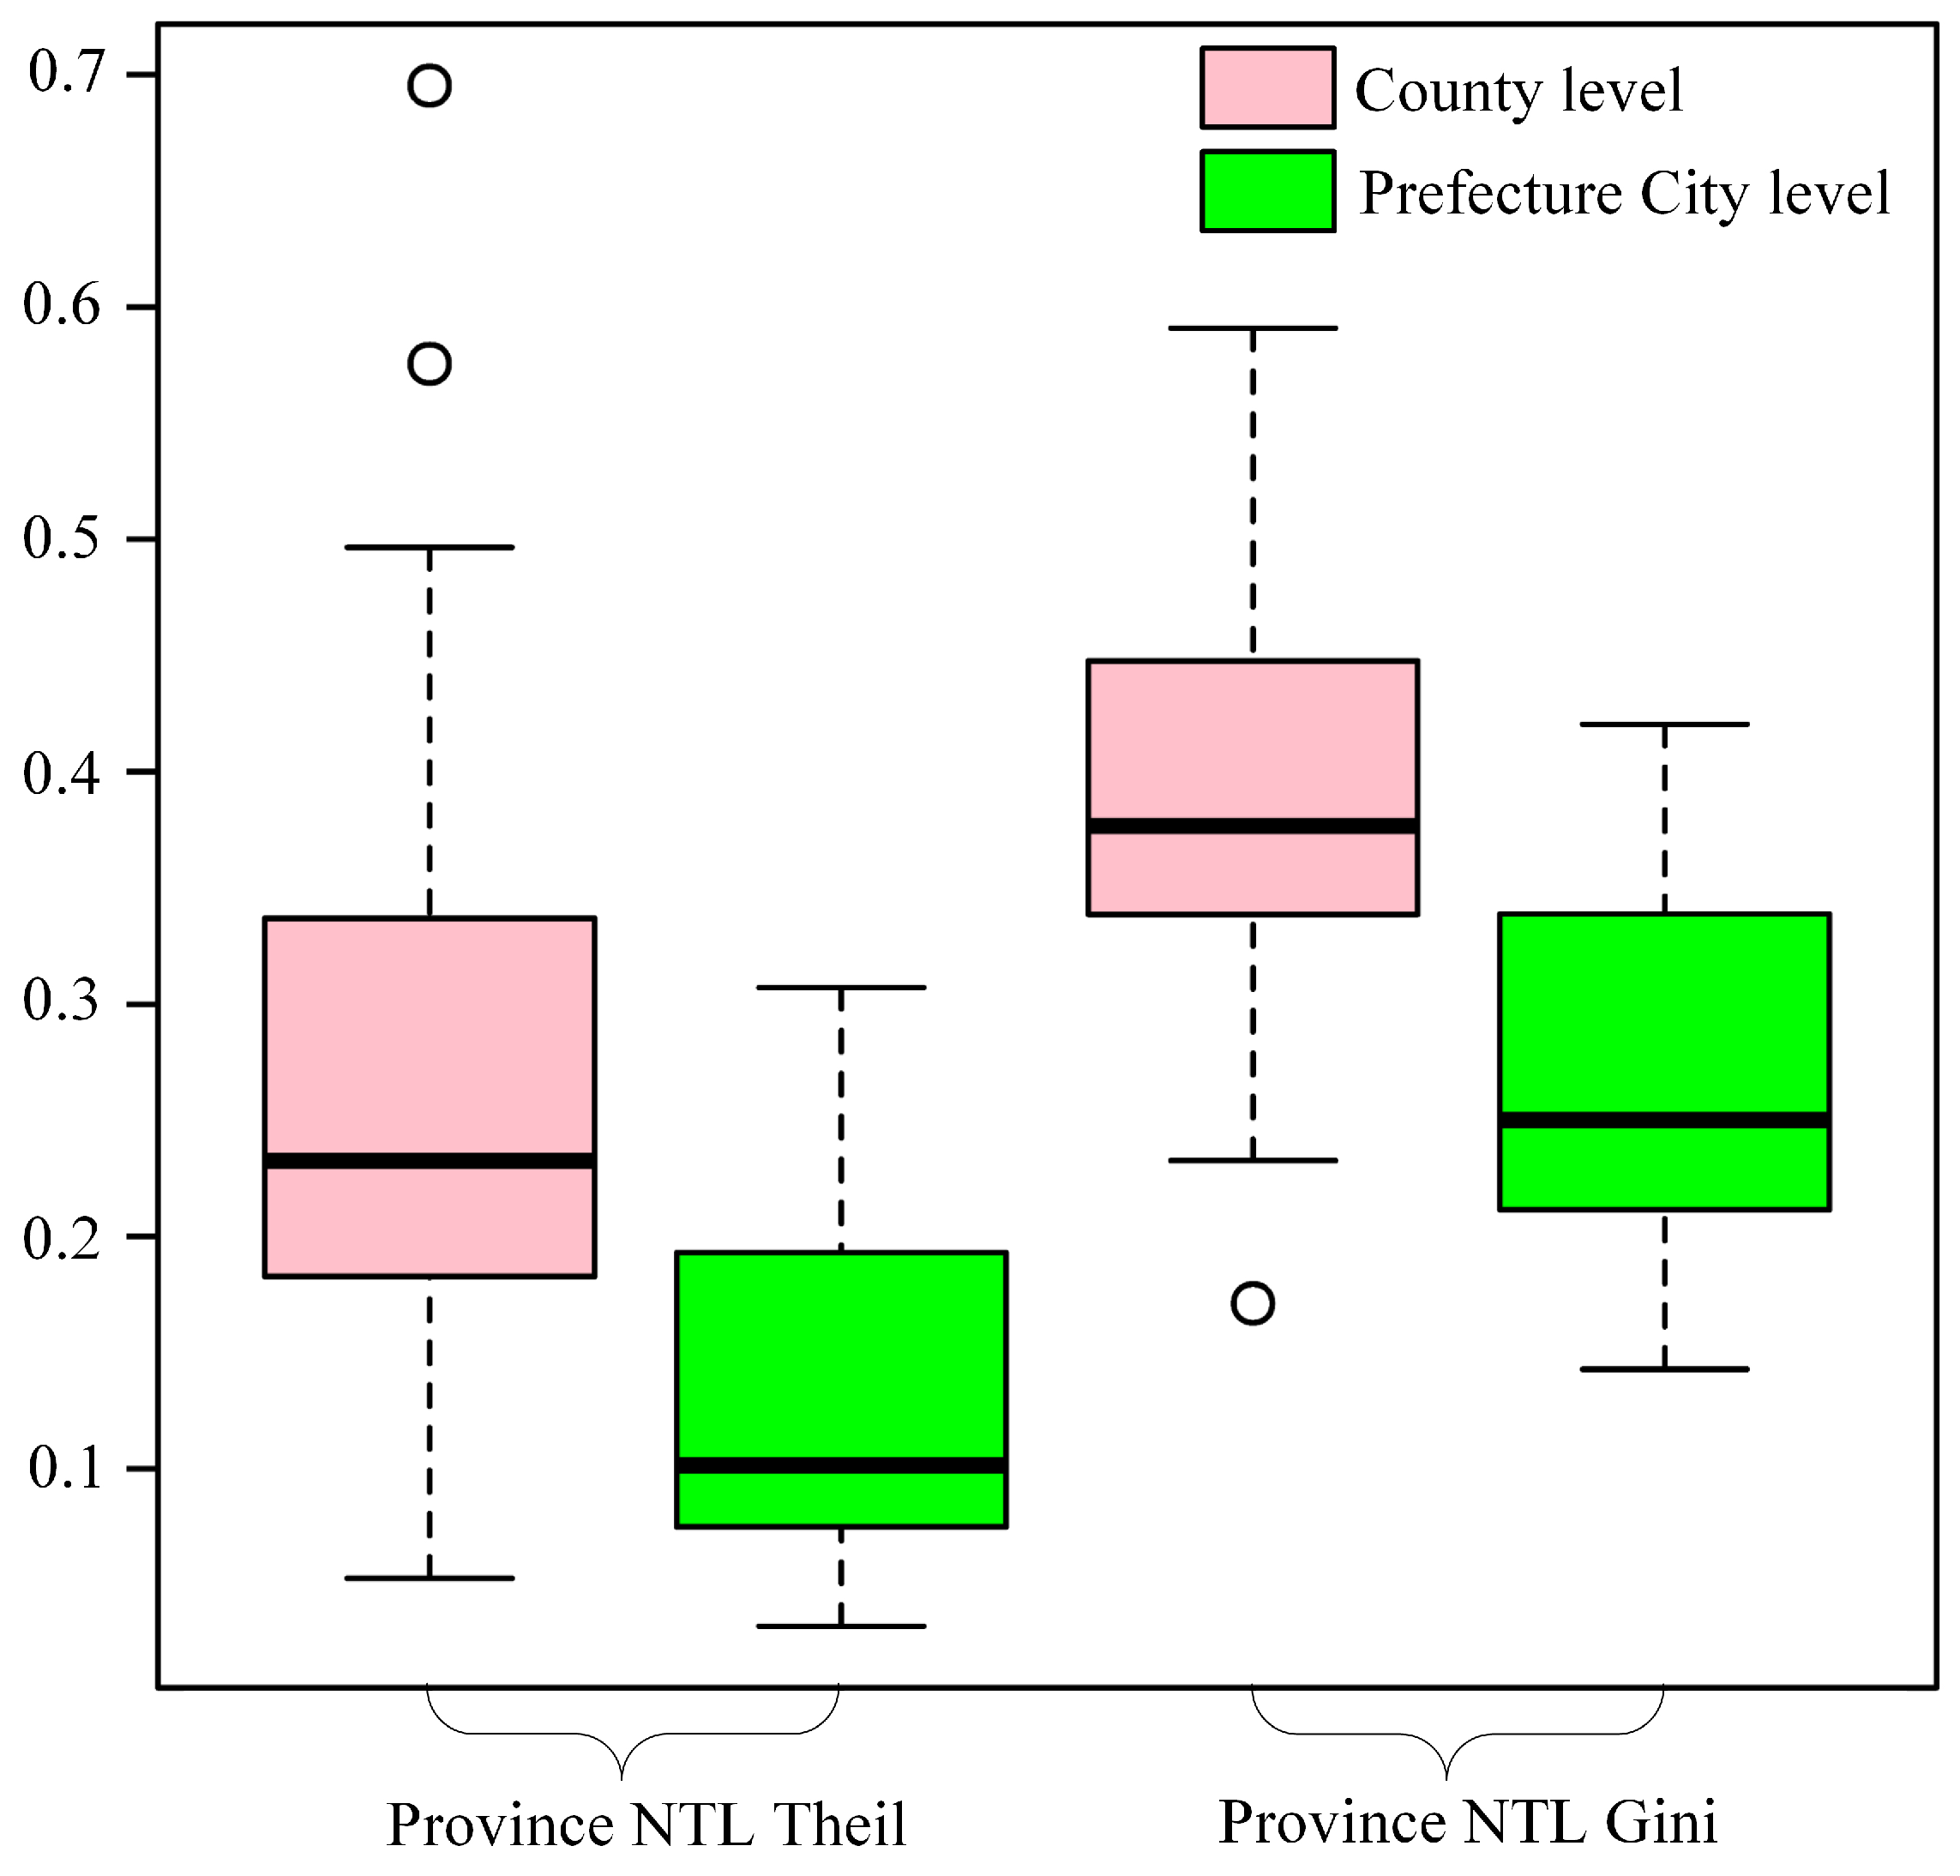
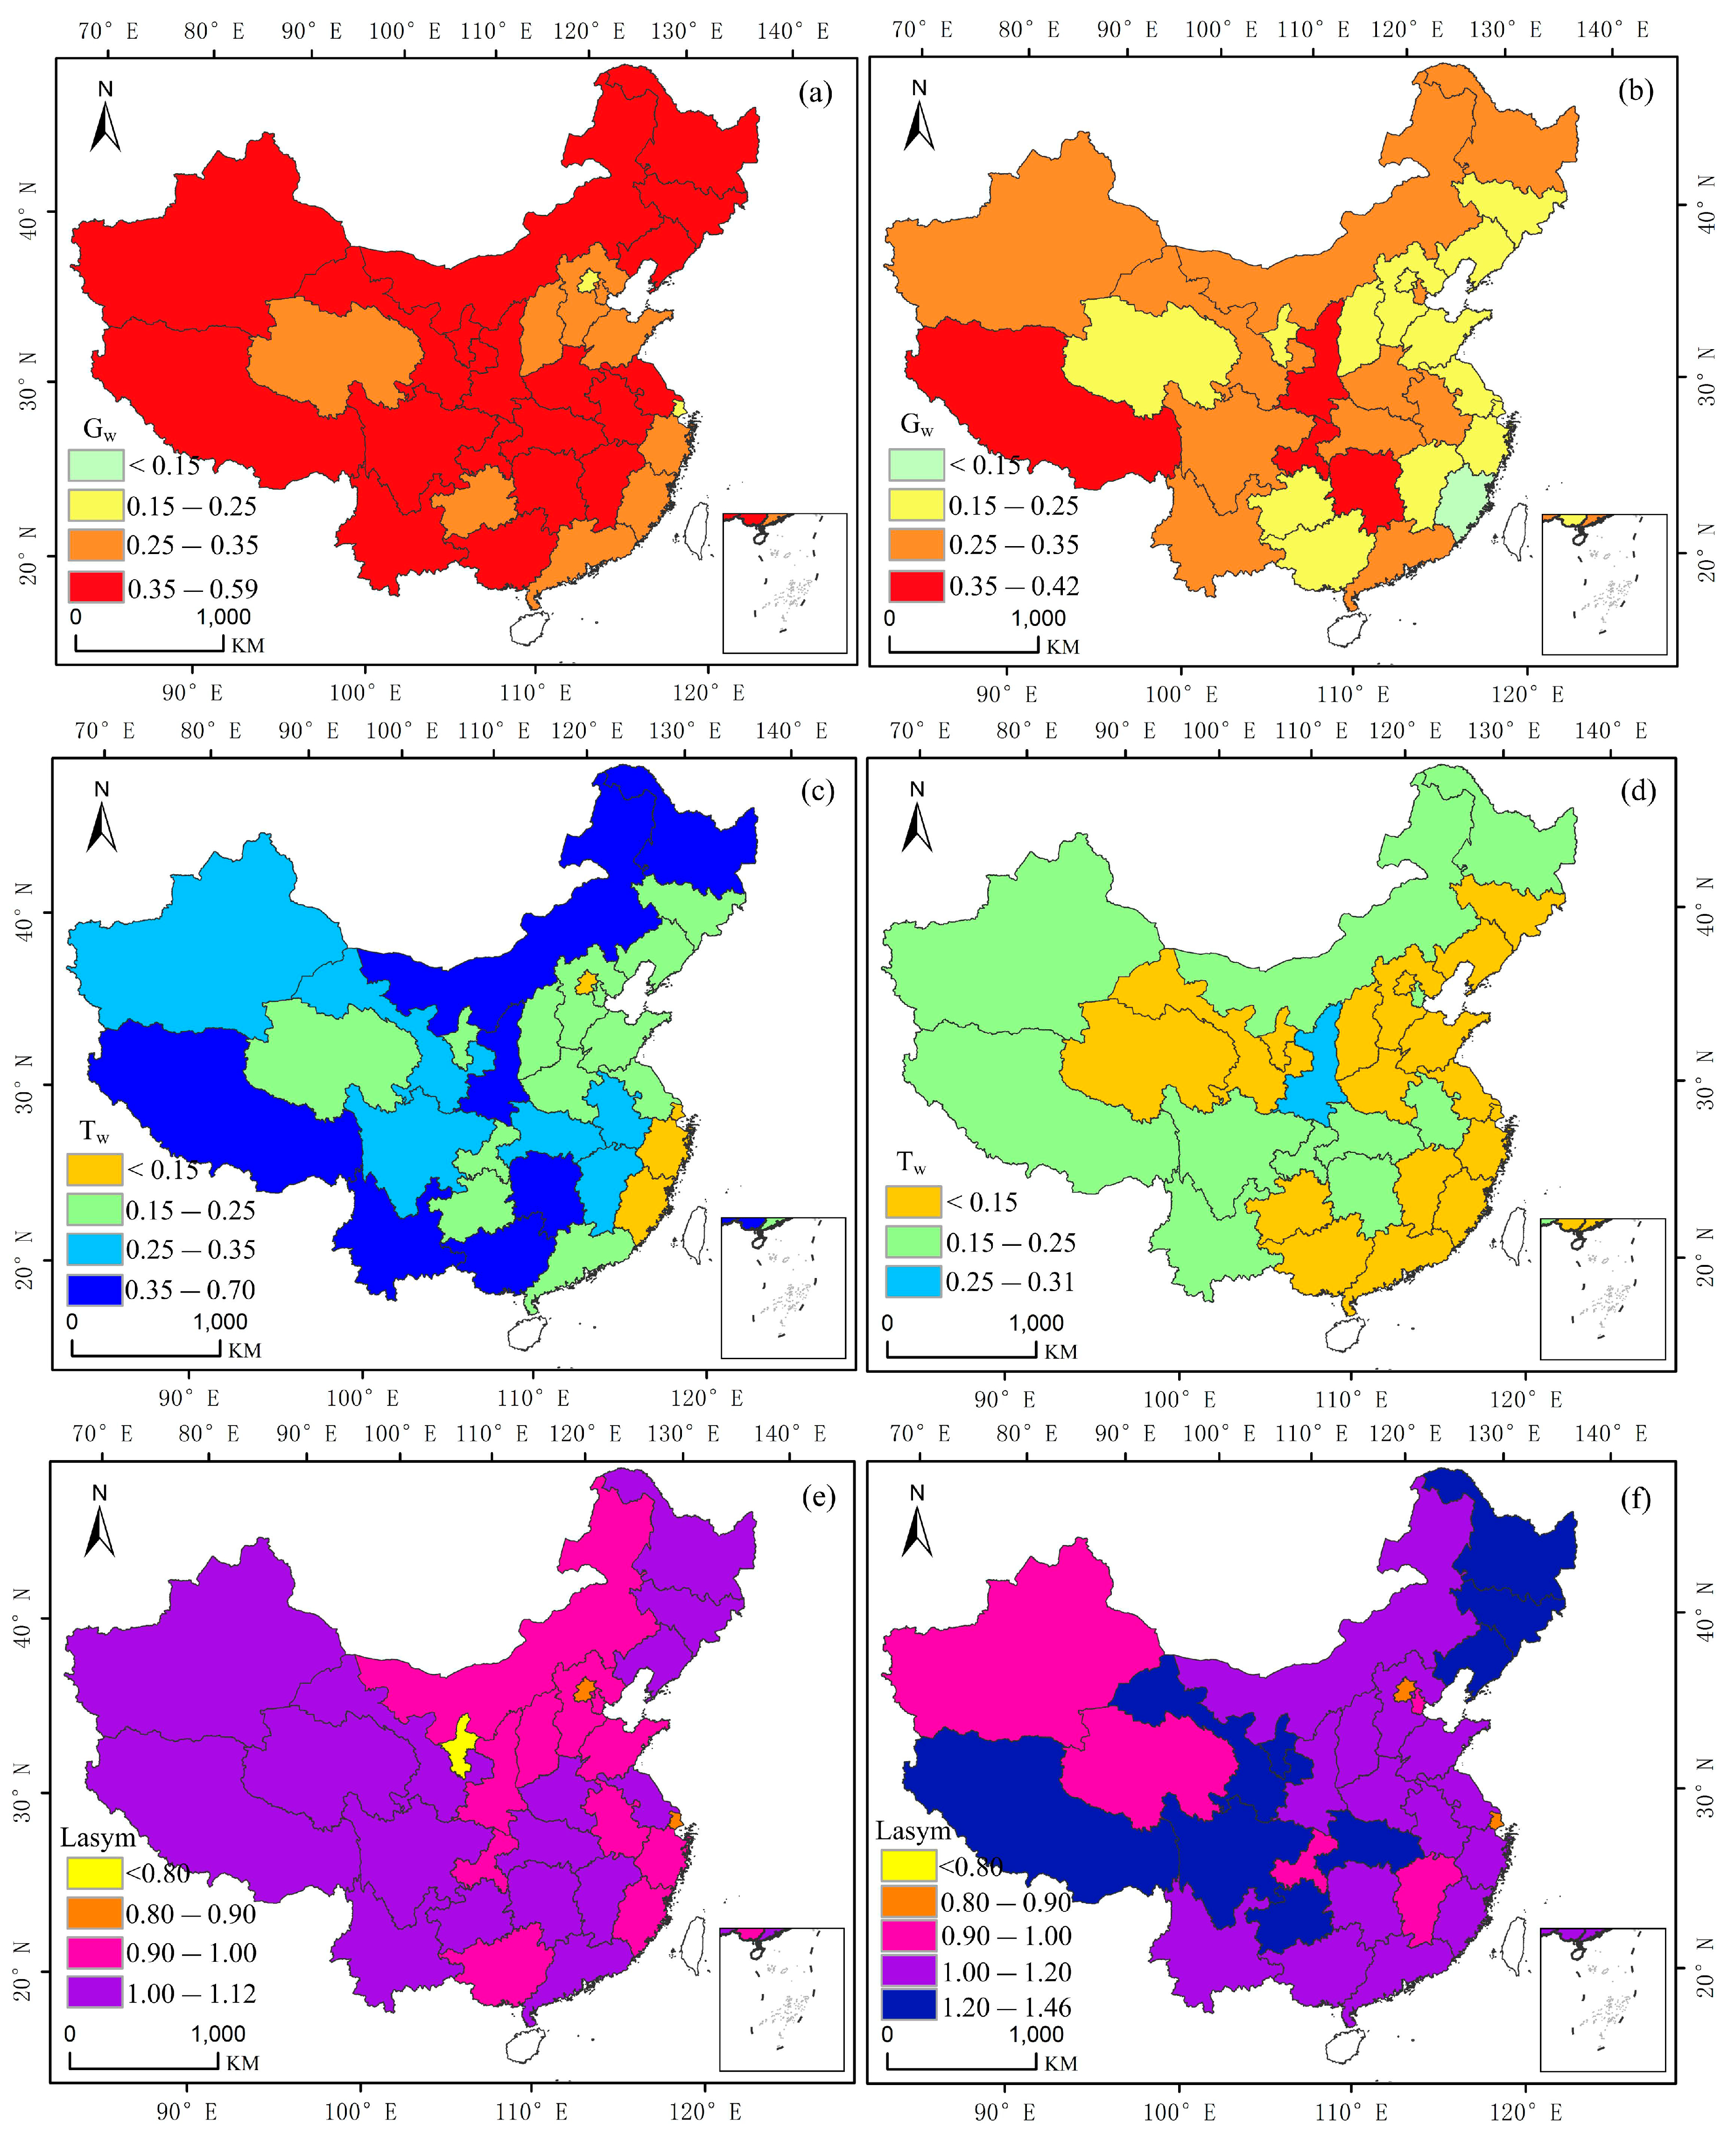
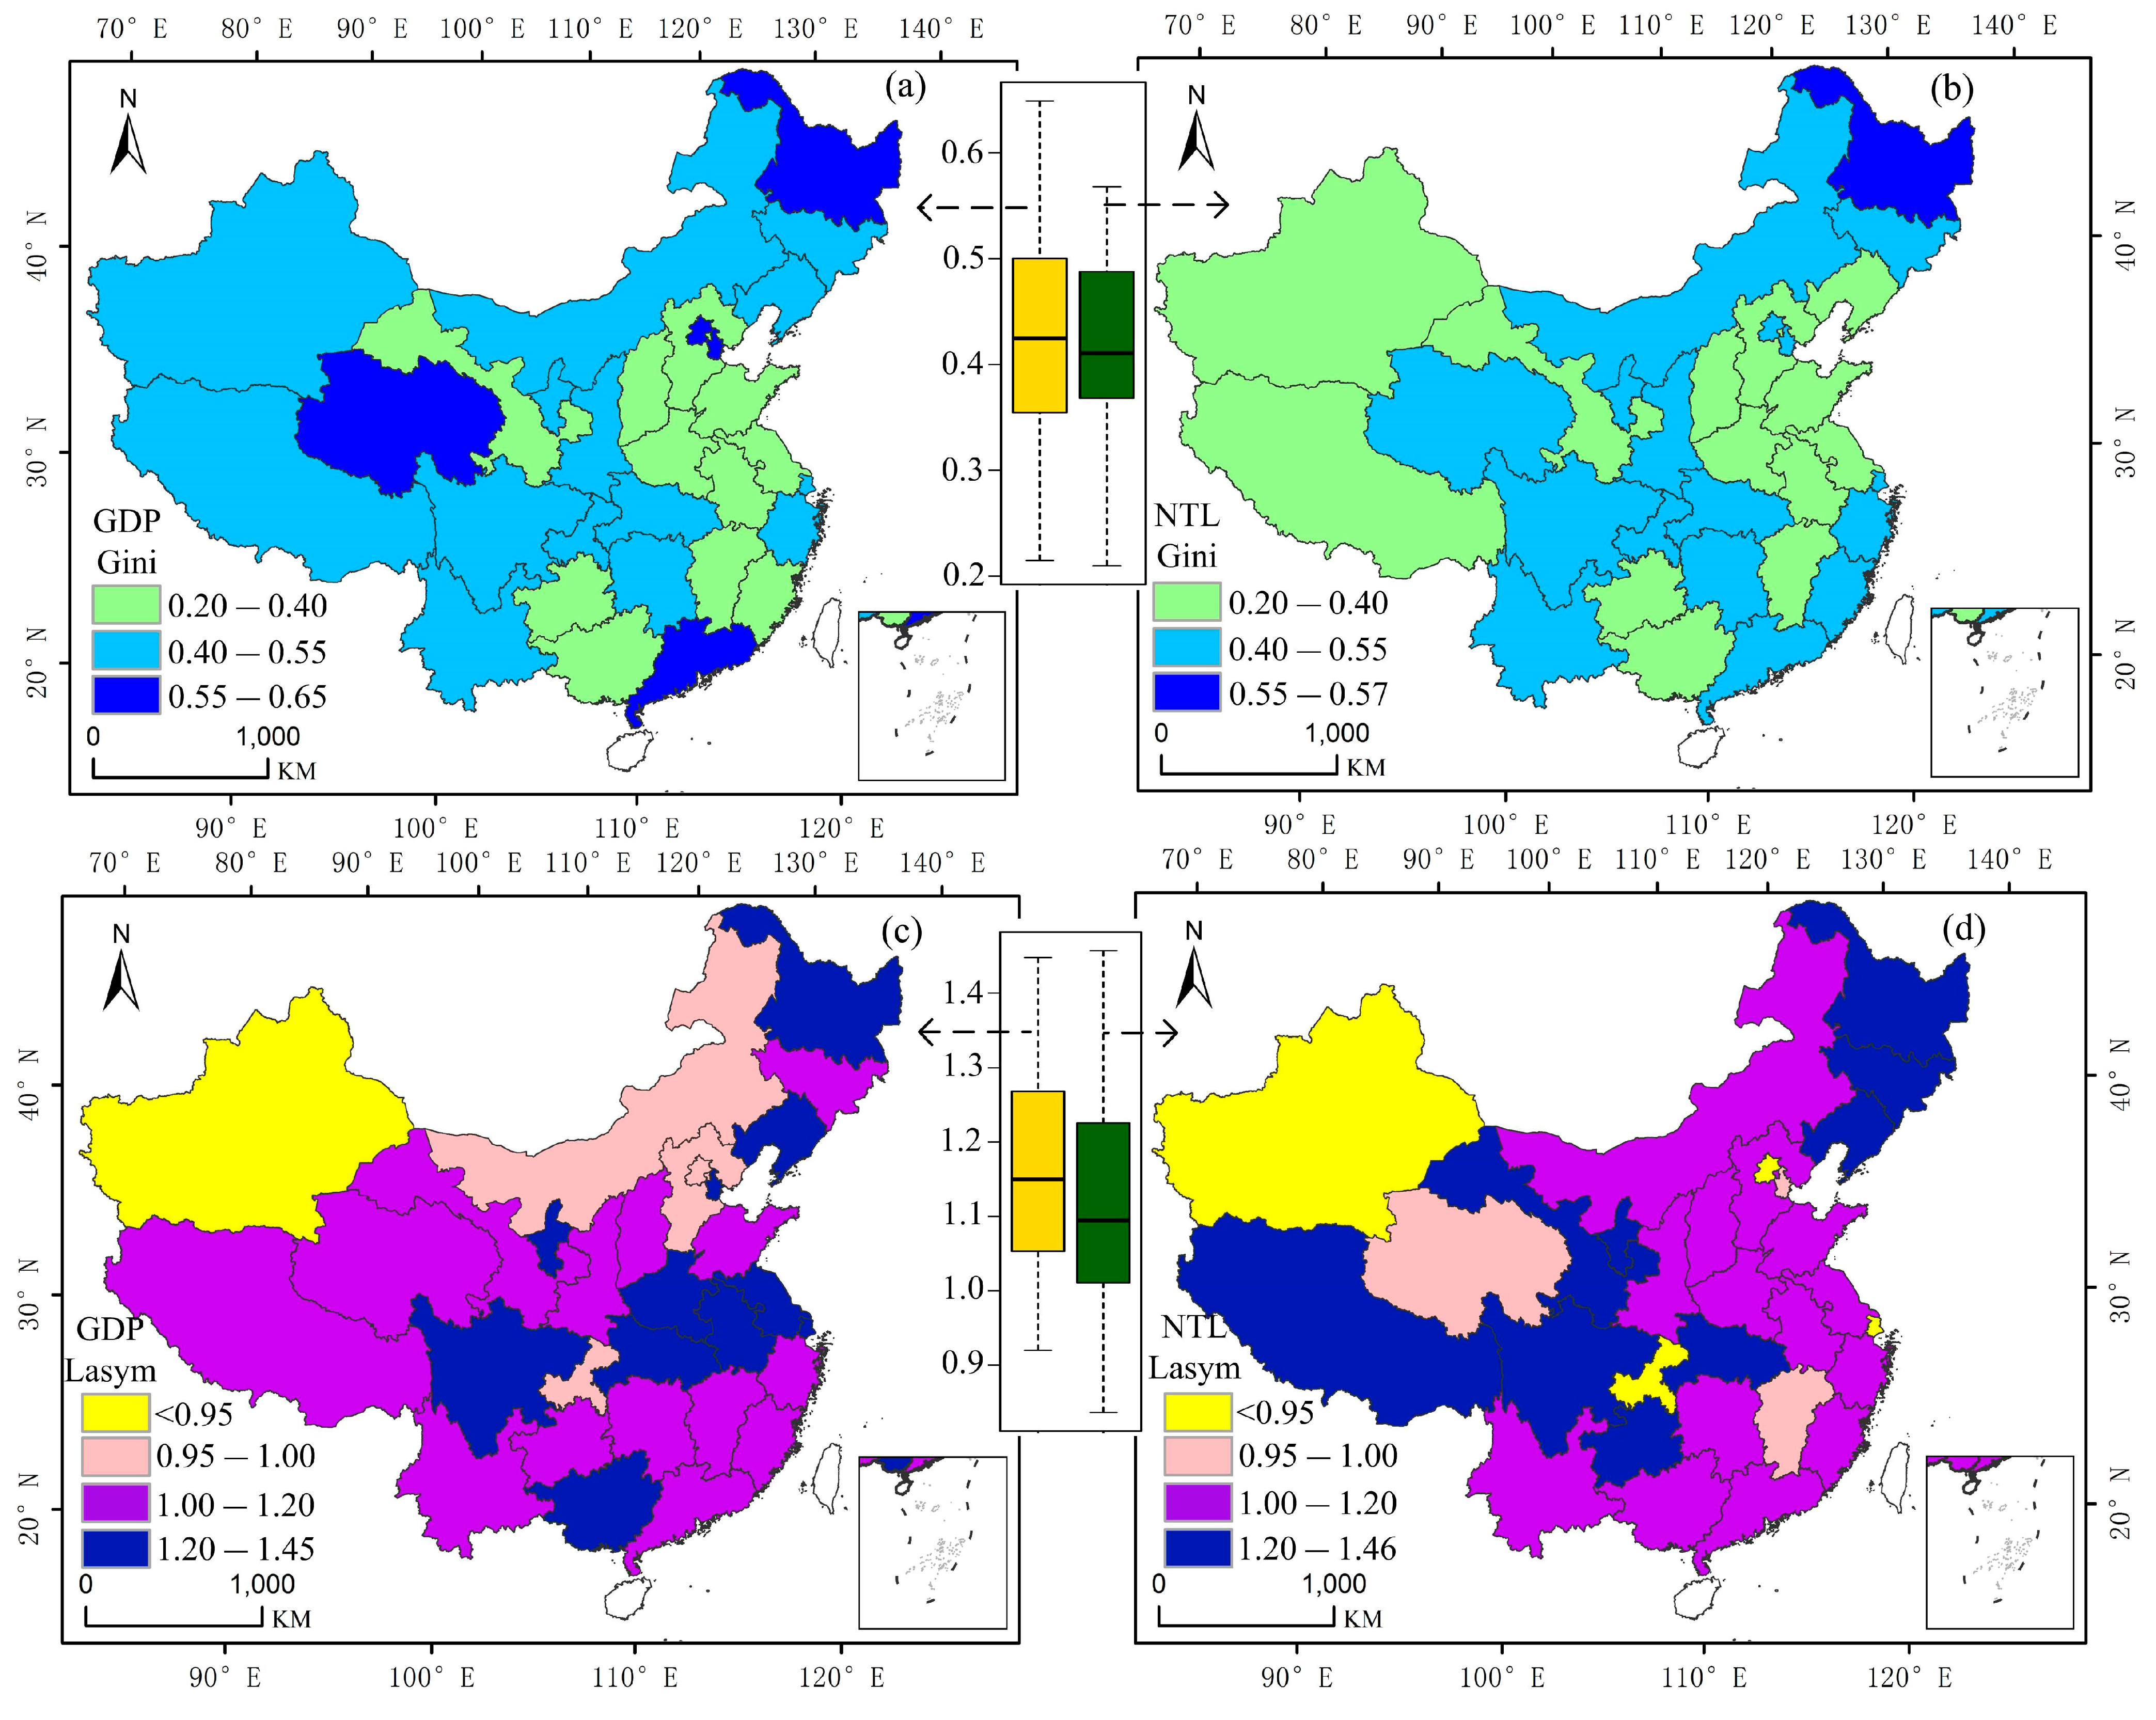
3.3. Spatial Multi-level Inequality of Nighttime Light

The preceding results, obtained using several indices that implicitly reflect effects at different levels of geographical administrative areas, demonstrated inequalities among the 30 provinces studied. To further understand these inequalities, a spatial analysis was conducted by attaching the inequality indices to the thematic maps of these provinces, as displayed in Figure 7. This plot matrix comprises six thematic maps. The first row represents the weighted Gini index, the second row represents the weighted Theil index, and the last row represents the Lasym index. The two columns show calculations of these indices for county and prefectural populations, respectively.
An examination of the spatial distribution of the inequality indices yielded the following results, as depicted in the maps. First, the Gini index, extending from eastern to western regions, revealed a pattern of disparity between these regions, which was more significant at the prefectural level, as depicted in Figure 7b,d. We found that nearly all of the eastern provinces had lower Gini and Theil values than the western provinces. Second, as described above, inequalities among provinces were affected by the spatial scale of individuals taking part in the calculations, which was reflected in the maps. The majority of provinces that included county-level individuals were at the highest ranks (0.35–0.59) of the Gini index (Figure 7a), whereas only four provinces that included prefectural-level individuals were at the highest ranks (0.35–0.42) of the Gini index. Third, as observed at the identical level, although the Gini and Theil indices displayed an approximate trend, some differences were observed in the details. For example, some northwestern provinces had a lower value on the Theil index, compared with the Gini index, at the country level (Figure 7a). The values of the northeastern regions were also low on the Theil index (Figure 7c).
As shown in Figure 7c, the Theil index revealed more diversity in spatial distribution, implying that the county-level NTL data contributed to the detection of inequality in undeveloped southwestern provinces such as Yunnan, Sichuan, and Tibet. Figure 7b,d show the most coherent pairs of Gini and Theil distributions at the prefectural city level. Lastly, to develop deeper insights into inequality status based on the Gini index, we calculated the Lasym index to examine the distribution of individuals on the Lorenz curve (Figure 7e,f). The ranges of Lasym values below 1 were divided by 0.1 to identify the differences for a few provinces with a Lasym value below 1. The ranges that were above 1 were divided by 0.2 to highlight the trend in ranks for the majority of the provinces. It is noteworthy that the Lasym index of these provinces at the level of county units was close to 1, and the majority of values ranged from 0.9–1.12. Beijing and Shanghai each had a Lasym value below 1, which means that they had few regions with extremely low nightlight brightness. Because there are developed cities that are mostly covered by bright light at night, having a few dark regions resulted in a Lasym index value that was below 1.
Among the western provinces, compared with its neighbors, Qinghai Province could be regarded as a special case with a status of relative equality based on Gini and Theil measures, as shown in Figure 7a–d. Ningxia Province was regarded as an outlier because its Lasym values were lower than those of its neighbors (Figure 7e), thus presenting a reverse trend in undeveloped western regions. The findings demonstrated that the eastern regions had lower levels of inequality than the western regions in terms of Gini and Theil indices. For these weighted indices, the multi-scale effects partially depended on how people were distributed across these regions. Additionally, with the help of the VIIRS NTL imagery, we found that geography played a significant role in shaping China’s uneven economic landscape.
As a further step in our analysis, we plotted the spatial distribution pattern of unweighted GDP Gini and GDP Lasym indices derived at the prefecture-city level, as depicted in Figure 8. The unweighted Gini indices of GDP and NTL were compared in the map with their corresponding boxplots embedded as an inset (Figure 8a,b). For provinces located in central and eastern China, the Gini indices of GDP and NTL were aggregated in a nearly identical pattern, with a few provinces such as Guangdong and Fujian deviating from this pattern. Notably, the majority of provinces in eastern China had a lower unweighted Gini index for both GDP and NTL (Figure 8a,b). By contrast, the western provinces had a relatively higher unweighted Gini index of GDP compared with NTL. The boxplot inset illustrates the distribution pattern of the numerical values of GDP Gini and NTL Gini, which had approximately equal medians (the horizontal lines in the box). These findings indicate that NTL has a similar capacity to depict inequality as GDP. Furthermore, the lower-level NTL Gini in some western provinces may have resulted from the nightlight radiance of reflected light features with bright surfaces such as mountains covered by snow and dry lake beds, increasing the sum of NTL in the undeveloped regions.

4. Discussion

Compared with the results of a poverty map study [35], our Gini and Theil indices, derived from NTL, present similar distribution trends. For instance, these indices indicate that coastal areas of China have lower poverty rates than interior areas. We observed lower Gini and Theil inequality indices in coastal China compared with western China (see Figure 7a–d). However, these inequality indices measure the distribution of wealth. Thus, poor areas may have a low level of inequality and rich areas may have a high level of inequality, which differ from the poverty index used in the poverty map study. For example, with respect to the NTL Gini index (Figure 7b and Figure 8b), Xinjiang Province, which is located in a poor area, as depicted in the poverty map, has a low inequality value.
We previously investigated evolution trends of situations of inequality using original GDP, population and DMSP-OLS NTL data for 226 Chinese cities during the period 1994–2011 [43]. The results indicated that China experienced a pattern of increasing inequality between its western and eastern cities in this time series [44,45]. This is consistent with our current findings using inequality indices derived from similar data. The previous study focused on the co-distribution of GDP, population, and NTL, and their correspondence to the urbanization trends of these cities. As a further analytical step, in this study we estimated inequality at multiple scales covering all of China’s administrative regions. The Gini and Theil indices show that in general, there is less inequality in the country’s eastern region compared with its western region. Other economic researchers who have studied China’s inequality trend have argued that this was greater in the west than in the east in this time series [46]. Our findings corroborate this finding at a new time point. Compared with the statistical data used by these earlier studies, the remotely sensed NTL data was not only more readily available for large scale study, but was also hardly affected by inflation.
Figure 7. Nighttime light derived inequality for China’s 30 provinces: (a) and (b) are weighted Gini indices; (c) and (d) are weighted Theil indices; and (e) and (f) are Lasym indices; (a), (c), and (d) (left panel) are country level; (b), (d), (f) (right panel) are city level.
Remotesensing 07 01242 g007
Figure 8. Spatial comparisons between inequalities of gross domestic product (left panel) and nighttime light (right panel) derived at the prefectural city level: (a) and (b) are unweighted Gini indices; (c) and (d) are unweighted Lasym indices.
Remotesensing 07 01242 g008
Although we exercised care in acquiring the data from a reliable source, and pre-processing the data, and although the VIIRS radiance data performed well in modeling relations with other socioeconomic variables, there are, nevertheless, some uncertainties that are of concern. First, the results of the analysis are as good as the statistical data and the VIIRS-derived light data used for the study. The remaining noise in the VIIRS data, or human-induced errors that may have occurred when the census data was pre-processed, may have affected the accuracy of the results and the regression model. Second, attempting to depict total economic inequality status using only a few proxy variables is a daunting task. Therefore, other factors that affect the accuracy of the model, or other regression methods that may improve the model, must be sought. Thus, our modeling result can only be an approximate estimation of the actual situation. Additionally, the inequality index of municipalities may have been influenced by their individual compositions of administrative regions. It is worth noting that there are limitations regarding the use of NTL to depict local socioeconomic activities in some of China’s regions. For example, as a result of rapid development of real estate, some regions may exhibit a high vacancy rate regarding housing, resulting in the creation of what are referred to as ghost cities [47]. Such regions may be illuminated by road light but have few human and socioeconomic activities taking place within them. This situation impacts on the ability of NTL to accurately reflect information on these activities. However, these cities are few in number compared with our large study regions. Moreover, as our study focused on multi-level inequality, this effect will be examined in detail in a future small-scale study.
As a further point of discussion, it is worth exploring the meanings and reasons behind our findings of inequality. According to the economic literature, widening regional inequality may lead to social and economic instability that, in turn, will affect China’s overall economic development [48]. Many factors, including central government policy, regional development strategies, and natural conditions, may have contributed to China’s regional inequality. To some degree, this inequality can be attributed to the central government’s policy of concentrating substantial resources in the coastal regions at the commencement of the economic reforms. This kind of biased policy has been largely responsible for the perpetuation of inequality between coastal and inland areas. This has also partly resulted in the large urban expanse that can be intuitively observed from the lit area in Figure 1. Geography may also be a factor that contributes to the disparity between provinces. For example, the eastern regions, which have a lot of plain areas, have an advantage in terms of building road networks. The NTL radiance data is largely attributable to the road light [49,50,51], that can reflect the transportation condition of the regions under study. This finding indicates that the eastern regions have benefited from their dense road network which is advantageous for resource allocations and reducing communication costs. The western regions, however, have been negatively affected by their disadvantageous topography that has limited the construction of road networks. This factor could consequently be an obstacle to the flow of labor resources or to attracting external investments. China’s population mobility may also have had a significant impact on the pattern of regional disparity. Based on China’s population distribution (Figure 3), we find that the eastern regions have richer human capital that can address the requirements of urbanization for labor resources compared with the western regions. There are other factors that may play a significant role in the distribution of inequality which will not be discussed in this paper.
Because regional inequality has a negative impact on future economic growth, it is reasonable to devise an appropriate development strategy to reduce this. It is noteworthy that central policymakers have placed considerable emphasis on the issue of inequality, especially in relation to the middle and western regions. Several development plans such as that for western China, the reinvigoration of northeastern China and other older industrial bases, and the emerging development strategy for central China have been implemented to improve the development of lagging regions and to reduce inequality. For example, the completion of the Qinghai–Tibet railway and various roads, as part of the western development plan, can increase the mobility of resources within and between provinces. In addition, regarding the fragility of ecosystems in the western provinces, special attention should be paid to protecting the environment when promoting economic development of these areas.

5. Conclusions

NTL data have been widely used to depict human settlements and to estimate socioeconomic activities. This study has analyzed inequality in China using advanced NTL images obtained from the VIIRS in 2012. At the city and provincial levels, we estimated associations between NTL, GDP, and the population using raw data from the VIIRS. Our results revealed that the VIIRS nighttime radiance data show a statistically positive correlation with GDP and population (R2 = 0.86, compared with R2 = 0.58, at the provincial level). In this study, several inequality indices were applied using the VIIRS nightlight data and socioeconomic data to characterize inequality patterns at the provincial level in China. The inequality indices derived from nocturnal light explicitly demonstrate spatial disparity and imbalance between China’s eastern and western regions. The findings of the Lasym index were of interest and implied that most provinces in China have few significantly developed prefectures, which leaves other prefectures in the same province with a common lower status.
With regard to the inequality coefficients at the provincial level, we observed an explicit inequality pattern at different spatial scales based on the sample individuals. The provincial Gini and Theil indices of NTL that were derived from the prefectural-level data were lower than the indices obtained at the county level. This indicates that prefectures develop according to a relatively even pattern, whereas counties demonstrate a developing pattern that entails greater imbalance. Additionally, this finding reveals the potential of VIIRS data to be an efficient tool for estimating economic activity at a small spatial scale in the absence of statistical data (an example being the county level GDP data used for this study). To alleviate the sensitivity of the inequality index for populations with large spatial areas, and to avoid the occurrence of extreme values, we applied a population-weighted approach for NTL and GDP. The weighted inequality results revealed that population contributes significantly to the spatial distribution of NTL and GDP. Overall, this case study of mainland China evaluated the ability of VIIRS data to depict features of economic inequality at multiple spatial scales.
Although some meaningful results pertaining to the application of VIIRS NTL data in modeling China’s economic inequality status were obtained in this study, future research should be conducted to create a more robust analysis from different perspectives. If a variety of data sources are used, more detailed information will become available. It should be mentioned that our analysis was based on one-year snapshot data of the VIIRS imagery and other available census materials. The detection of temporal change and the variation of inequality patterns are important for monitoring economic development, especially in China, where the economy is rapidly growing. Further studies therefore are needed to investigate the spatio-temporal changes in inequality of development patterns.

Acknowledgments

This research has been funded by the Distinguished Young Scholar Program of Institute of Geographic Sciences and Natural Resources Research, Chinese Academy of Sciences (No. 2014RC102), the National Natural Science Foundation of China (No. 41371379 and No. 41171307) and the National Key Technology Research and Development Program (No. 2011BAH24B10). We would like to gratefully thank the anonymous reviewers for their insightful and helpful comments to improve the manuscript.

Author Contributions

Yuke Zhou collected and processed the data, performed analysis and wrote the paper. Ting Ma and Chenghu Zhou conceived and designed the study and methods. Tao Xu contributed to analysis and interpretation of the data.

Conflicts of Interest

The authors declare no conflict of interest.

References

  1. Fan, C.C.; Sun, M. Regional inequality in China, 1978–2006. Eurasian Geogr. Econ. 2008, 49, 1–18. [Google Scholar] [CrossRef]
  2. Pedroni, P.; Yao, J.Y. Regional income divergence in China. J. Asian Econ. 2006, 17, 294–315. [Google Scholar] [CrossRef]
  3. Li, Y.; Wei, Y.D. Multidimensional inequalities in health care distribution in provincial China: A case study of Henan Province. Tijdschr. Econo. Soc. Geogr. 2014, 105, 91–106. [Google Scholar] [CrossRef]
  4. Liao, F.H.; Wei, Y.D. Dynamics, space, and regional inequality in provincial China: A case study of Guangdong Province. Appl. Geogr. 2012, 35, 71–83. [Google Scholar] [CrossRef]
  5. Roberts, M.; Deichmann, U.; Fingleton, B.; Shi, T. Evaluating China’s road to prosperity: A new economic geography approach. Reg. Sci. Urban Econo. 2012, 42, 580–594. [Google Scholar] [CrossRef]
  6. Zhou, X. Economic transformation and income inequality in urban China: Evidence from panel data. Am. J. Soc. 2000, 105, 1135–1174. [Google Scholar] [CrossRef]
  7. Qin, D.; Cagas, M.A.; Ducanes, G.; He, X.; Liu, R.; Liu, S. Effects of income inequality on China’s economic growth. J. Policy Model. 2009, 31, 69–86. [Google Scholar] [CrossRef]
  8. Zhang, Z.; Yao, S. Regional inequalities in contemporary China measured by GDP and consumption. Econ. Issues-stoke trent 2001, 6, 13–30. [Google Scholar]
  9. Wei, Y.D. Multiscale and multimechanisms of regional inequality in China: Implications for regional policy. J. Contemp. China 2002, 11, 109–124. [Google Scholar] [CrossRef]
  10. Li, Y.; Wei, Y. The spatial-temporal hierarchy of regional inequality of China. Appl. Geogr. 2010, 30, 303–316. [Google Scholar] [CrossRef]
  11. Fleisher, B.M.; Chen, J. The coast–noncoast income gap, productivity, and regional economic policy in China. J. Comp. Econ. 1997, 25, 220–236. [Google Scholar] [CrossRef]
  12. Hare, D.; West, L.A. Spatial patterns in China’s rural industrial growth and prospects for the alleviation of regional income inequality. J. Comp. Econ. 1999, 27, 475–497. [Google Scholar] [CrossRef]
  13. Sutton, P.; Roberts, D.; Elvidge, C.; Baugh, K. Census from Heaven: An estimate of the global human population using night-time satellite imagery. Int. J. Remote Sens. 2001, 22, 3061–3076. [Google Scholar] [CrossRef]
  14. Sutton, P.C.; Elvidge, C.D.; Ghosh, T. Estimation of gross domestic product at sub-national scales using nighttime satellite imagery. Int. J. Ecol. Econ. Stat. 2007, 8, 5–21. [Google Scholar]
  15. Henderson, J.V.; Storeygard, A.; Weil, D.N. Measuring Economic Growth from Outer Space; National Bureau of Economic Research: Providence, RI, USA, 2009. [Google Scholar]
  16. Doll, C.H.; Muller, J.-P.; Elvidge, C.D. Night-time imagery as a tool for global mapping of socioeconomic parameters and greenhouse gas emissions. AMBIO 2000, 29, 157–162. [Google Scholar]
  17. Doll, C.N.H.; Muller, J.-P.; Morley, J.G. Mapping regional economic activity from night-time light satellite imagery. Ecol. Econ. 2006, 57, 75–92. [Google Scholar] [CrossRef]
  18. Ghosh, T.; Powell, R.L.; Elvidge, C.D.; Baugh, K.E.; Sutton, P.C.; Anderson, S. Shedding light on the global distribution of economic activity. Open Geogr. J. 2010, 3, 148–161. [Google Scholar]
  19. Small, C.; Pozzi, F.; Elvidge, C.D. Spatial analysis of global urban extent from DMSP-OLS night lights. Remote Sens. Environ. 2005, 96, 277–291. [Google Scholar] [CrossRef]
  20. Ma, T.; Zhou, C.; Pei, T.; Haynie, S.; Fan, J. Quantitative estimation of urbanization dynamics using time series of DMSP/OLS nighttime light data: A comparative case study from China’s cities. Remote Sens. Environ. 2012, 124, 99–107. [Google Scholar] [CrossRef]
  21. Zhang, Q.; Seto, K.C. Mapping urbanization dynamics at regional and global scales using multi-temporal DMSP/OLS nighttime light data. Remote Sens. Environ. 2011, 115, 2320–2329. [Google Scholar] [CrossRef]
  22. Elvidge, C.D.; Baugh, K.E.; Kihn, E.A.; Kroehl, H.W.; Davis, E.R.; Davis, C.W. Relation between satellite observed visible-near infrared emissions, population, economic activity and electric power consumption. Int. J. Remote Sens. 1997, 18, 1373–1379. [Google Scholar] [CrossRef]
  23. Chand, T.K.; Badarinath, K.; Elvidge, C.; Tuttle, B. Spatial characterization of electrical power consumption patterns over India using temporal DMSP-OLS night-time satellite data. Int. J. Remote Sens. 2009, 30, 647–661. [Google Scholar] [CrossRef]
  24. Liang, H.; Tanikawa, H.; Matsuno, Y.; Dong, L. Modeling in-use steel stock in China’s buildings and civil engineering infrastructure using time-series of DMSP/OLS nighttime lights. Remote Sens. 2014, 6, 4780–4800. [Google Scholar] [CrossRef]
  25. Hsu, F.-C.; Elvidge, C.D.; Matsuno, Y. Exploring and estimating in-use steel stocks in civil engineering and buildings from night-time lights. Int. J. Remote Sens. 2013, 34, 490–504. [Google Scholar] [CrossRef]
  26. Takashima, M.; Hayashi, H. Damage Inventory Estimation for Large Scale Earthquake Disaster Assessment Using Night Time City Light. In Proceedings of the 13th world conference of earthquake engineering, Vancouver, Canada, August 1–6, 2004; pp. 1–6.
  27. Han, P.; Huang, J.; Li, R.; Wang, L.; Hu, Y.; Wang, J.; Huang, W. Monitoring trends in light pollution in China based on nighttime satellite imagery. Remote Sens. 2014, 6, 5541–5558. [Google Scholar] [CrossRef]
  28. Doll, C.N. CIESIN Thematic Guide to Night-Time Light Remote Sensing and Its Applications; Center for International Earth Science, Information Network of Columbia University: Palisades, NY, USA, 2008. [Google Scholar]
  29. Elvidge, C.D.; Baugh, K.E.; Zhizhin, M.; Hsu, F.C. Why VIIRS data are superior to DMSP for mapping nighttime lights. Proc. Asia-Pac. Adv. Netw. 2013, 35, 62–69. [Google Scholar] [CrossRef]
  30. Baugh, K.; Hsu, F.C.; Elvidge, C.D.; Zhizhin, M. Nighttime lights compositing using the VIIRS day-night band: Preliminary results. Proc. Asia-Pac. Adv. Netw. 2013, 35, 70–86. [Google Scholar] [CrossRef]
  31. Ma, T.; Zhou, C.; Pei, T.; Haynie, S.; Fan, J. Responses of Suomi-NPP VIIRS-derived nighttime lights to socioeconomic activity in China’s cities. Remote Sens. Lett. 2014, 5, 165–174. [Google Scholar] [CrossRef]
  32. Li, X.; Xu, H.; Chen, X.; Li, C. Potential of NPP-VIIRS nighttime light imagery for modeling the regional economy of China. Remote Sens. 2013, 5, 3057–3081. [Google Scholar] [CrossRef]
  33. Shi, K.; Yu, B.; Huang, Y.; Hu, Y.; Yin, B.; Chen, Z.; Chen, L.; Wu, J. Evaluating the ability of NPP-VIIRS nighttime light data to estimate the gross domestic product and the electric power consumption of China at multiple scales: A comparison with DMSP-OLS data. Remote Sens. 2014, 6, 1705–1724. [Google Scholar] [CrossRef]
  34. Elvidge, C.; Baugh, K.; Anderson, S.; Sutton, P.; Ghosh, T. The night light development index (NLDI): A spatially explicit measure of human development from satellite data. Soc. Geogr. 2012, 7, 23–35. [Google Scholar] [CrossRef]
  35. Elvidge, C.D.; Sutton, P.C.; Ghosh, T.; Tuttle, B.T.; Baugh, K.E.; Bhaduri, B.; Bright, E. A global poverty map derived from satellite data. Comput. Geosci. 2009, 35, 1652–1660. [Google Scholar] [CrossRef]
  36. Levin, N.; Duke, Y. High spatial resolution night-time light images for demographic and socio-economic studies. Remote Sens. Environ. 2012, 119, 1–10. [Google Scholar] [CrossRef]
  37. Earth Observation Group, NOAA National Geophysical Data Center. Available online: http://ngdc.noaa.gov/eog/viirs/download_viirs_ntl.html (accessed on 14 April 2014).
  38. Elvidge, C.D.; Baugh, K.E.; Zhizhin, M.; Hsu, F.-C. Why VIIRS data are superior to DMSP for mapping nighttime lights. Proc. Asia-Pac. Adv. Netw. 2013, 35, 62–69. [Google Scholar] [CrossRef]
  39. National Bureau of Statistics of China. Tabulation on the 2010 Population Census of China by County; China Statistical Press: Beijing, China, 2011. (In Chinese) [Google Scholar]
  40. National Bureau of Statistics of China. Urban Statistical Yearbook of China 2012; China Statistical Press: Beijing, China, 2013. (In Chinese) [Google Scholar]
  41. Shankar, R.; Shah, A. Bridging the economic divide within countries: A scorecard on the performance of regional policies in reducing regional income disparities. World Dev. 2003, 31, 1421–1441. [Google Scholar] [CrossRef]
  42. Damgaard, C.; Weiner, J. Describing inequality in plant size or fecundity. Ecology 2000, 81, 1139–1142. [Google Scholar] [CrossRef]
  43. Fan, J.; Ma, T.; Zhou, C.; Zhou, Y.; Xu, T. Comparative estimation of urban development in China’s cities using socioeconomic and DMSP/OLS night light data. Remote Sens. 2014, 6, 7840–7856. [Google Scholar] [CrossRef]
  44. Fleisher, B.; Li, H.; Zhao, M.Q. Human capital, economic growth, and regional inequality in China. J. Dev. Econo. 2010, 92, 215–231. [Google Scholar] [CrossRef]
  45. Song, S.; Chu, G.S.-F.; Chao, R. Intercity regional disparity in China. China econo. Rev. 2001, 11, 246–261. [Google Scholar] [CrossRef]
  46. Li, S.; Xu, Z. The Trend Of Regional Income Disparity In The People’s Republic of China; Asian Development Bank Institute Discussion Papers: Tokyo, Japan, 2008. [Google Scholar]
  47. Fawley, B.W.; Wen, Y. The great Chinese housing boom. Econ. Synop. 2013. [Google Scholar]
  48. Yang, D.T. What has caused regional inequality in China? China Econ. Rev. 2002, 13, 331–334. [Google Scholar] [CrossRef]
  49. Sánchez de Miguel, A.; Zamorano, J.; Gómez Castaño, J.; Pascual, S. Evolution of the energy consumed by street lighting in Spain estimated with DMSP-OLS data. J. Quant. Spectrosc. Ra. 2014, 139, 109–117. [Google Scholar] [CrossRef] [Green Version]
  50. Elvidge, C.D.; Cinzano, P.; Pettit, D.; Arvesen, J.; Sutton, P.; Small, C.; Nemani, R.; Longcore, T.; Rich, C.; Safran, J. The nightsat mission concept. Int. J. Remote Sens. 2007, 28, 2645–2670. [Google Scholar] [CrossRef]
  51. Kuechly, H.U.; Kyba, C.; Ruhtz, T.; Lindemann, C.; Wolter, C.; Fischer, J.; Hölker, F. Aerial survey and spatial analysis of sources of light pollution in Berlin, Germany. Remote Sens. Environ. 2012, 126, 39–50. [Google Scholar] [CrossRef]

