Article

Prompt Proxy Mapping of Flood Damaged Rice Fields Using MODIS-Derived Indices

1
International Centre for Water Hazard and Risk Management (ICHARM) under the auspices of UNESCO, 1-6 Minamihara, Tsukuba 305-8516, Japan
2
Flood Forecasting & Warning Center, Bangladesh Water Development Board, Dhaka 1000, Bangladesh
*
Author to whom correspondence should be addressed.
Remote Sens. 2015, 7(12), 15969-15988; https://doi.org/10.3390/rs71215805
Submission received: 22 June 2015 / Revised: 16 November 2015 / Accepted: 17 November 2015 / Published: 30 November 2015
(This article belongs to the Special Issue Remote Sensing in Flood Monitoring and Management)

Abstract

:
Flood mapping, particularly hazard and risk mapping, is an imperative process and a fundamental part of emergency response and risk management. This paper aims to produce a flood risk proxy map of damaged rice fields over the whole of Bangladesh, where monsoon river floods are dominant and frequent, affecting over 80% of the total population. This proxy risk map was developed to meet the request of the government on a national level. This study represents a rapid, straightforward methodology for estimating rice-crop damage in flood areas of Bangladesh during the large flood from July to September 2007, despite the lack of primary data. We improved a water detection algorithm to achieve a better discrimination capacity to discern flood areas by using a modified land surface water index (MLSWI). Then, rice fields were estimated utilizing a hybrid rice field map from land-cover classification and MODIS-derived indices, such as the normalized difference vegetation index (NDVI) and enhanced vegetation index (EVI). The results showed that the developed method is capable of providing instant, comprehensive, nationwide mapping of flood risks, such as rice field damage. The detected flood areas and damaged rice fields during the 2007 flood were verified by comparing them with the Advanced Land Observing Satellite (ALOS) AVNIR-2 images (a 10 m spatial resolution) and in situ field survey data with moderate agreement (K = 0.57).

Graphical Abstract

1. Introduction

Floods are the most frequent among all natural disasters, causing widespread devastation, economic damage and loss of human lives. Flood disasters hamper economic growth and accelerate poverty in most developing countries [1,2,3]. Over the last decades, the number of people affected and the scale of economic damage caused by inland flood disasters have increased considerably. Globally, this trend will likely continue due to the increase in flood magnitude and the lack of preparedness for extreme events [4]. Therefore, the risk reduction of water-related disasters has been globally recognized as a common goal. For the last 20 years, international development agendas have been established and have repeatedly declared the necessity for practical, policy-neutral risk assessment. One of the main streams is the eight Millennium Development Goals (MDGs), a parallel concept to Sustainable Development Goals (SDGs), which are closely related to Goal 11.5. Goal 11.5 aims to significantly reduce the number of deaths and the number of people affected and decrease, by a certain percentage (the numerical target to be determined by each country), the economic losses relative to gross domestic product caused by disasters, including water-related disasters, with a focus on protecting the poor and also the people in vulnerable situations [5,6].
The Asia and Pacific regions are disproportionally influenced by the impacts of flood disasters [7]. Many flood plains in this region have been experiencing a rising number of flood disasters. Kwak et al. demonstrated that the Asia-Pacific region will be exposed to a higher flood risk throughout the 21st century than ever before, because more extreme rainfall will lead to greater flood inundation depths in many areas [8]. In Bangladesh, for example, floods have been increasingly frequent during the monsoon season, and large-scale floods have occurred every five to ten years during the last 25 years (1988, 1998, 2004 and 2007) [9,10]. However, Bangladesh has only a few flood hazard maps available with low accuracy at the national or local level because of the absence of hydrological data from the riparian countries in the Ganges River basin. The Flood Forecasting and Warning Center (FFWC), a national agency under the Bangladesh Water Development Board (BWDB), produces a model-based inundation map with a coarse spatial resolution (300 m × 300 m) on a daily basis during the monsoon period (Figure in Section 4.1) [11], but this is not practical due to lack of observed flood information, e.g., discharge, flood areas, water depth, and field verification.
Flood detection and mapping are one of the traditional themes of satellite-based remote sensing using optical images and synthetic aperture radar (SAR) images. The selection of suitable sensors that are both cost-effective and efficient in the development of flood inundation maps is a major challenge in this field [12]. Since its launch in December 1999, the Moderate Resolution Imaging Spectroradiometer (MODIS) has been one of the main contributors to progress in real-time mapping. One of the greatest benefits of the MODIS instrument is its capability to broadcast raw data directly throughout the world. In addition, it stores raw data for later download and has a wide swath range (approx. 2330 km) with good temporal and moderate spatial resolution (250 m, 500 m, and 1000 m) [13]. Flood mapping systems utilizing MODIS multispectral sensors are now able to generate near-real-time flood maps with a global coverage on a daily basis. NASA created online flood mapping systems, which not only provide fundamental observational information, but also produce such maps with a rapid mapping technique [14,15]. These online data are downloadable for monitoring nation-wide flood disasters all over the world with high spatial and temporal resolution. Therefore, disaster managers and other end users will be able to monitor floods and evaluate larger-scale flood risk by accessing these flood maps and related products.
The detection of water-body boundaries in large flood areas is a more specific area of challenge in relation to the selection of suitable sensors, and many methods have been developed [16,17,18]. NASA and Dartmouth Flood Observatory use a water detection algorithm based on a reflectance ratio of MODIS bands 1 and 2, and a threshold on band 7 to provisionally identify pixels as water [14,19]. Remote sensing-based index algorithms have been designed to detect surface water in a conceptually simple way, relying mainly on spectral indices, such as the Normalized Difference Water Index (NDWI) [20,21] and the Land Surface Water Index (LSWI) [22,23]. With worldwide applicability, the MODIS sensor has three spectral bands that are sensitive to leaf water and soil moisture: near infrared (NIR, band 2: 841–876 nm) and shortwave infrared (SWIR, band 6: 1628–1652 nm, and SWIR, band 7: 2105–2155 nm). In order to acquire a better detection capability, spectral indices are necessary to detect surface water in a spectrally-normalized way; for example, the modified land surface water index (MLSWI), which was a new index developed from LSWI and NDWI specifically for floodwater detection [24].
Flood damage assessment is an essential part of flood risk assessment for decision-making processes and potential risk reduction in flood-prone river basins [25]. In contrast to hazard mapping, however, the assessment of damage and risk mapping is still far from being common practice [26,27]. Risk and damage information can be mapped with representative parameters with regard to flood risk: affected people, potential economic loss, i.e., building damage and crop damage. In order to estimate crop damage, damaged crop fields should be identified and classified automatically and accurately, incorporating crop phenology information. To this end, multi-spectral remote sensing-based indices have been developed and used to monitor vegetation structures and functions, including crop classification. To estimate crop biophysical parameters (CBP), such as the leaf area index (LAI), vegetation cover, and gross primary production, vegetation indices (VI) were utilized in empirical measurements of vegetation activity on the land surface, such as the normalized difference vegetation index (NDVI) and the enhanced vegetation index (EVI) [28,29,30,31]. Huete et al. introduced the enhanced vegetation index (EVI), which has an improved sensitivity to moderate-to-high vegetation biomass. MODIS-derived EVI is also widely used and designed to minimize the effects of the atmosphere and canopy background that contaminate NDVI and to enhance the green vegetation signal [32,33,34,35].
An improved up-to-date rice damage (risk) map is particularly in demand by ministries of agriculture in developing countries. Although they collect damage information from local offices, it is obviously hard to identify the distribution and location of damaged rice fields in temporal and spatial distribution after flooding. In this paper, we propose a nationwide risk mapping framework for near-real-time flood damage assessment immediately after a disaster, specifically focusing on the estimation of rice field damage areas affected by floodwaters, based on integrated GIS data from crop-related land-cover classification and MODIS-derived indices such as MLSWI, NDVI, and EVI. The ultimate goals of this study are (1) to instantly produce a nationwide flood map while maximizing the utility of MODIS time series data for the spatial and temporal dynamics of inundation areas; and (2) to create a rice crop damage proxy map covering the whole of the Bangladesh floodplain based on flood stage-damage curves of rice crops. It should be considered, as a best case study, that this information is absolutely important to better understand actual risks and the indispensable role of flood monitoring for water resources management, and disaster risk reduction in relation to critical issues in the long- or short-term sustainability of major agriculture-producing areas.

2. Study Area and Data Used
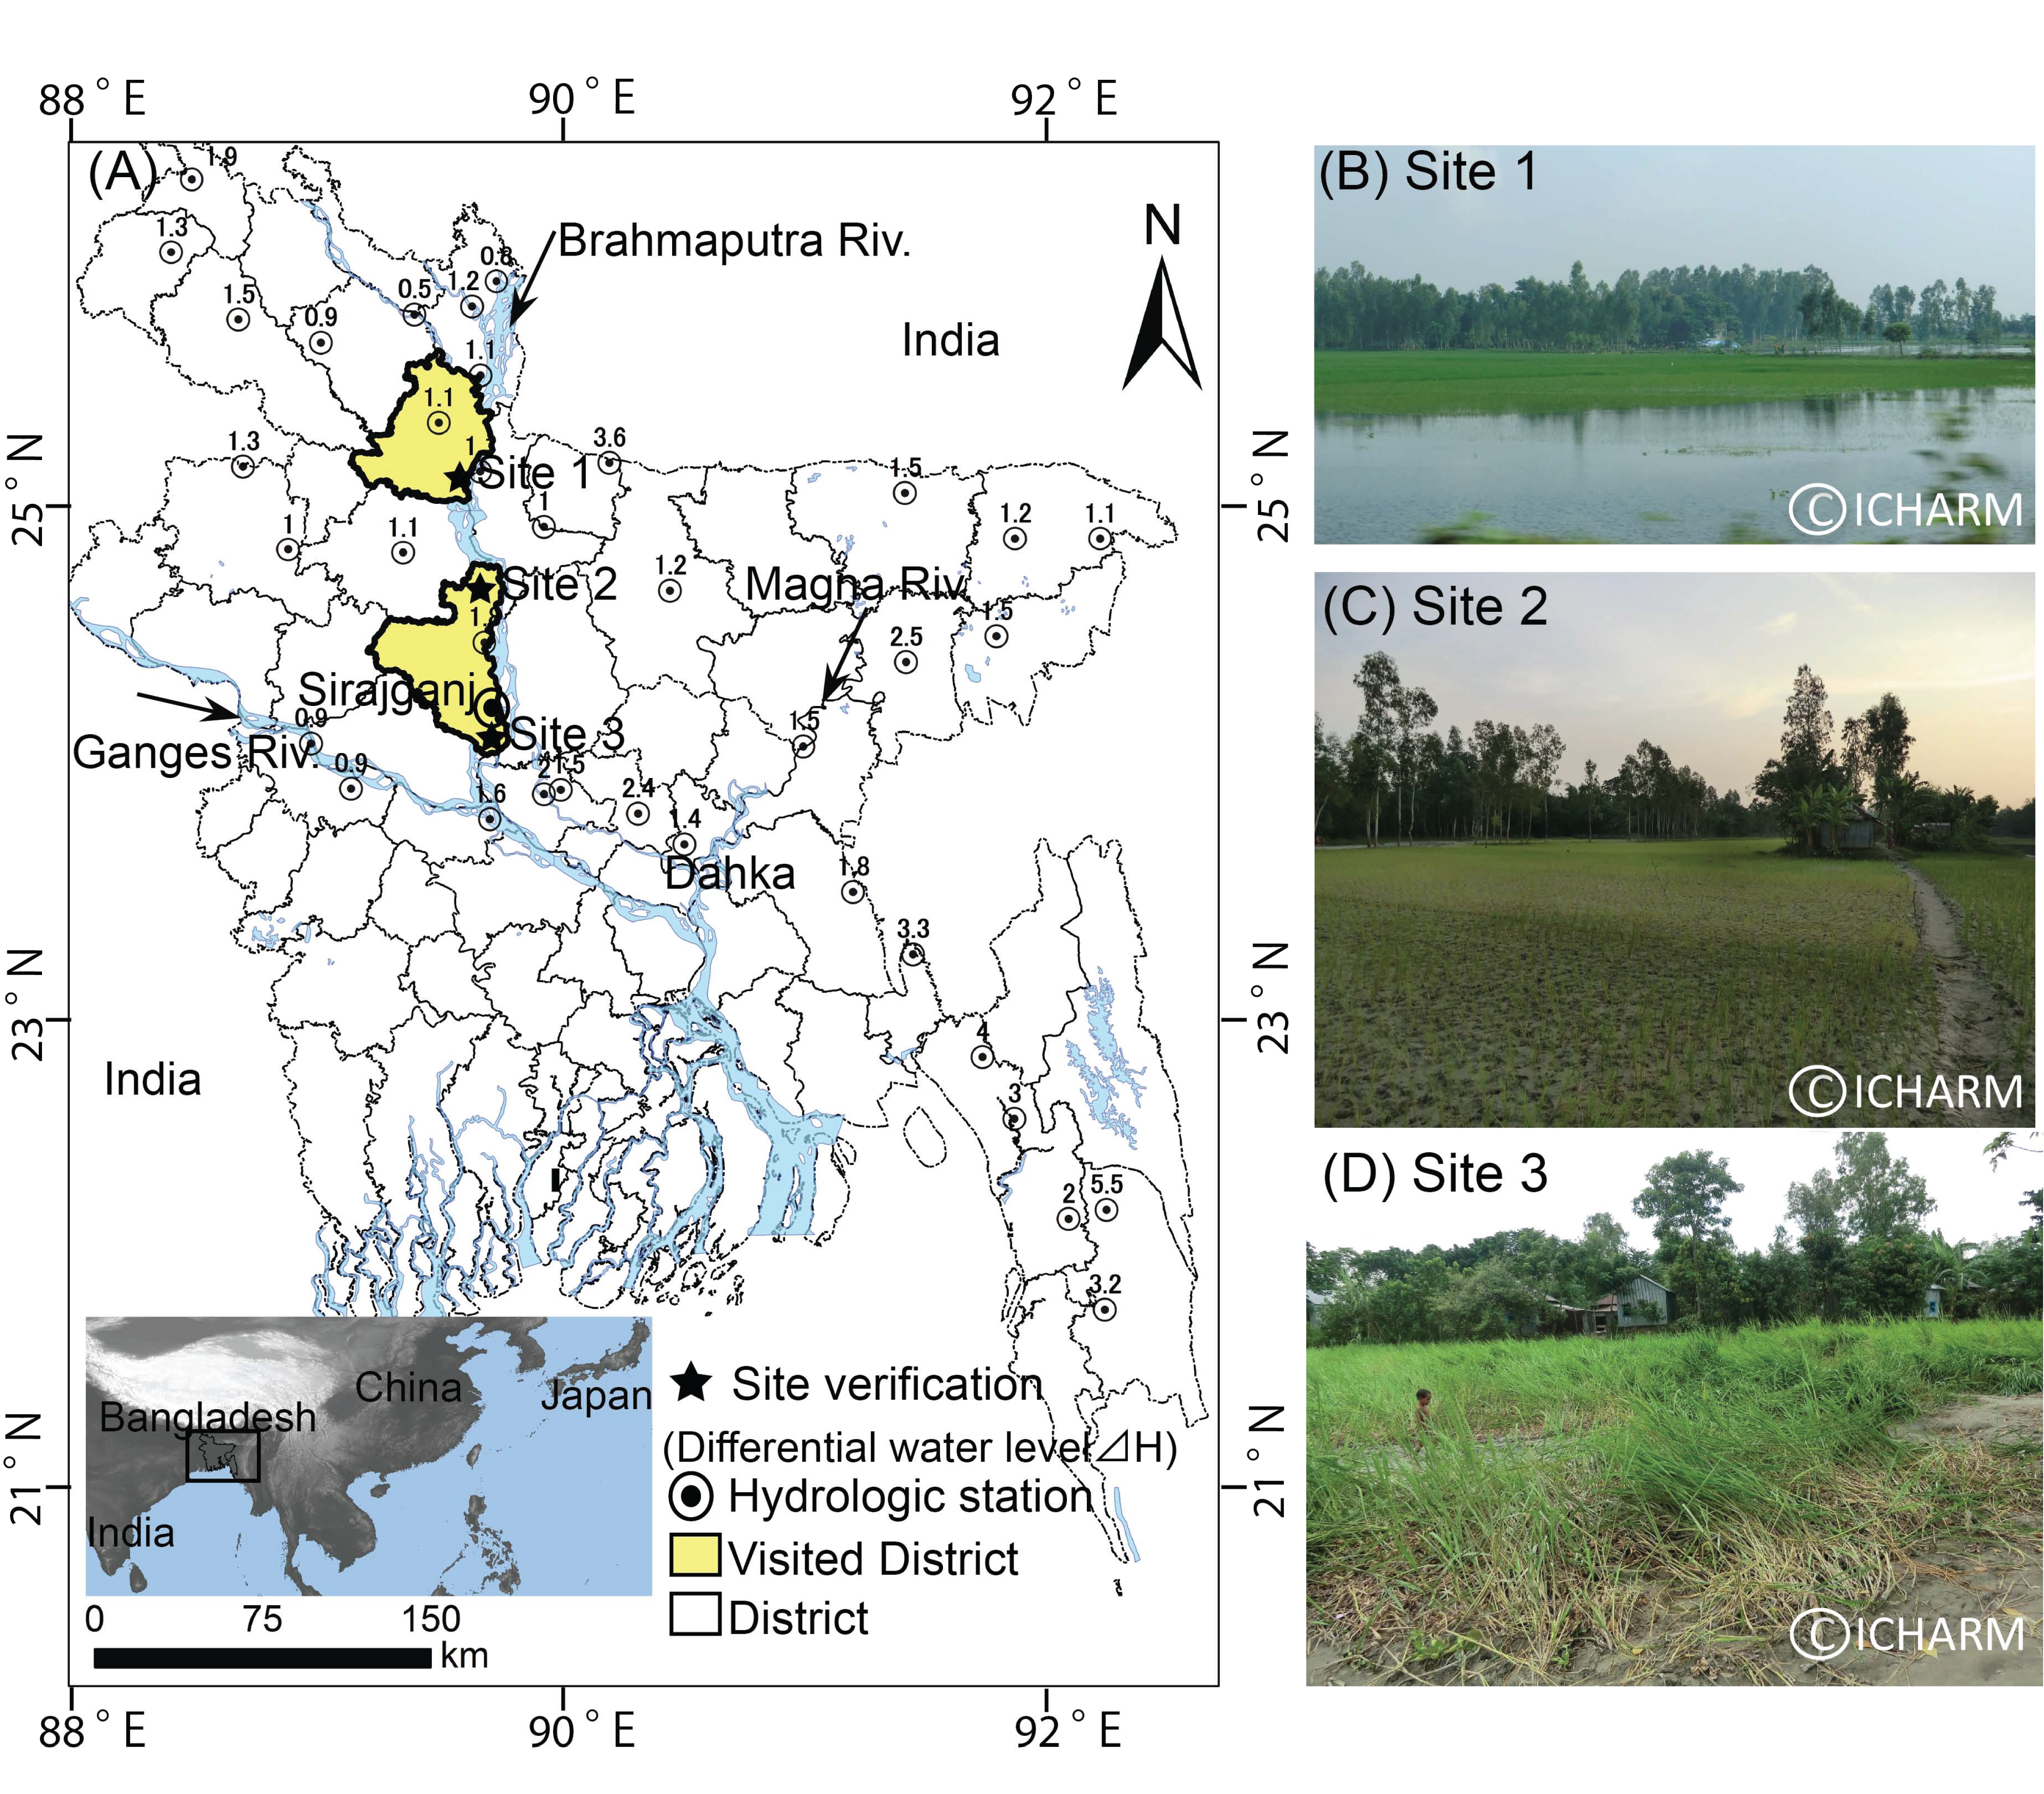
2.1. Study Area

The study area is the entire Bangladesh, which is located at the downstream end of the floodplain delta formed by three major rivers, i.e., the Ganges, Brahmaputra, and Meghna (GBM), lying between latitude 20°–27°N and longitude 88°–93°E. Every year one-fourth to one-third of the country is inundated during the monsoon season due to overflowing rivers. Monsoon floods are mainly caused by huge inflows from the upper GBM basins due to intense rainfall during the monsoon period from June to October. Bangladesh faces flood disasters every year due to extreme rainfall and its geographical location. More than 160 million people live in the country, and most of them are directly exposed to floods [36,37]. Among historical extremely large floods, four floods were recorded as the most devastating after 1950: the flood in 1988 affected approximately 89,970 km2, or about 63.1%, of the total area of the country, the flood in 1998 affected 100,200 km2, or about 67.9%, the flood in 2004 affected approximately 55,000 km2, or about 37.2%, and the flood in 2007 affected approximately 52,600 km2, or about 40%. Such floods have a significant negative impact on the country. The agricultural sector accounts for a 30% share of the gross domestic product and employs about 65% of the nation’s workforce. In Bangladesh, the rice crop accounts for 94% of the total crop production and has a rice area of about 105,000 km2. According to the Bangladesh Bureau of Statistics [36,37], the country harvests mainly three types of rice crop each year; Boro rice is the highest-yielding rice crop, which grows during the winter season, and is cultivated from January to May. Its production can only be threatened by pre-monsoon flash floods in April and May, which are not frequent. Aman rice is the second-highest yielding, occupying 50% of the total rice area and contributing 40% of the total rice yield in Bangladesh [36]. Aus rice is the third-highest yielding, scattered over most of the districts. Late harvesting of Aus rice and seedlings of Aman rice are subject to early flood risk [38]. Aman rice is the most prone to monsoon floods among the major crops because floods occur regularly during its harvesting season between June and November (Figure in Section 3.2.3) [39]. Aman rice is commonly grown in the north to central regions of Bangladesh near the natural levees of the Brahmaputra River. This study focused on damage to single-cropped rain-fed Aman rice to identify proxy risk within inundation areas during a major 10-year cyclic flood event, in 2007. The damage was verified through interviews and watermarks found along the natural levees of the Brahmaputra River in the Sirajganj district, the representative district of 2480 km2, which experienced the 2007 flood. Extensive field surveys were conducted at the representative sites in Figure 1 (site one, two, and three) and ground truth samplings were selected and investigated for inundated and rice damaged areas in order to compare with 10 m high spatial resolution images (ALOS AVNIR-2).
Figure 1. (a) Hydrological stations with an overflow water level and selected representative sites; (b) site one in Gaibandha district in September 2014; (c) site two in Majibari Union, Sirajganj district in September 2013; and (d) site three in Kaijuri Union, Sirajganj district in September 2013.
Remotesensing 07 15805 g001

2.2. Data Used

2.2.1. MODIS Data

MODIS data used in this study are derived from both the MOD09A1 (Terra) and MYD09A1 (Aqua) instruments with differences in Terra’s and Aqua’s orbits resulting in different viewing and cloud-cover conditions. The Aqua and Terra, level-three eight-day composite surface reflectance products in the sinusoidal projection (MYD09A1 and MOD09A1, respectively), contain the best observations during an eight-day period, as selected on the basis of high observation coverage, low view angle, the absence of clouds or cloud shadow, and aerosol loading at 500 m [40]. The frequent acquisition of remote sensing data from the MODIS aboard the Aqua and Terra satellite platforms enables efficient monitoring of the seasonal change of water bodies, the growing season, and phenological development of vegetation.
For flood mapping, we used eight composite images from MYD09A1 and eight composite images from MOD09A1 to analyze the sensitivity of water indices to spectral characteristics. The images were acquired from 12–19 July (Julian day of the year 193–200) and 14–21 September (Julian day of the year 257–264) in 2007 (path/row: tile number h26/v06). Their bands were suitable to detect floodwater in Bangladesh during the actual flood event in 2007, a cyclic 10-year flood lasting for 15 days [10]. We used the SRTM Water Body Data (SWBD) for confirming the detected major river [41].
For rice field mapping, we used 22 composite images from two standard VI products of MODIS (MOD13A1), the NDVI, and the EVI in 2007 (h26/v06). These images were provided every 16 days at 500 m spatial resolution as a gridded level-three product in the sinusoidal projection. In addition, a MOD09A1 composite image, acquired on 12–19 July 2007, was mainly used for identifying rice fields before flooding. The MODIS NDVI and EVI products were computed from atmospherically-corrected bi-directional surface reflectance that is masked for water, clouds, heavy aerosols, and cloud shadows. The quality of the MOD13A1 products was checked for cloud cover in reference to the quality layer of the Quality Assessment (QA) Science Datasets (SDS) as VI quality indicators. As a ratio to effectively characterize vegetated surfaces, NDVI has the advantage of minimizing certain types of band-correlated noise, and EVI minimizes canopy background variations and maintains sensitivity over dense vegetation conditions [40].

2.2.2. Land Cover Data

The Global Land Cover dataset by National Mapping Organizations (GLCNMO 2008) [42] and Global Map of Irrigation Areas (GMIA ver.5) [43] were selected to identify a rice field area. In order to extract rice field class from the existing global land cover products, two products can be overlaid to recreate a new map despite the difference in their production years and spatial resolutions. The primary source data of GLCNMO 2008 were produced by the Global Mapping Project organized by the International Steering Committee for Global Mapping (ISCGM) using MODIS data observed in 23-period, 16-day composite, seven-band, 500 m MODIS data of 2008. Rice fields with 91% of the user’s accuracy are extracted from 20 classes, which is 77.9% of the overall accuracy in terms of validation selected by random global sampling [42]. The GMIA ver.5 data indicated the amount of area equipped for irrigation around 2005 as a percentage of the global area on a raster with a resolution of 5 min, approx. 10 km [43]. Although the quality mark of GMIA ver.5 (2.05) is evaluated as “good” at a global scale, which ranges from zero (excellent) to five (very poor), quality marks are different for each specific country, depending on the country size [44]. In the case of Bangladesh, the area equipped with irrigation per region was derived from statistics reported in 1998 and 2007 based on the maximum number of the irrigated areas, and its overall quality was rated as 2.0 (“good” at a country scale). The irrigated area was then applied to rice crop 2007 flood risk mapping.

2.2.3. ALOS AVNIR-2

The Advanced Land Observing Satellite (ALOS) was launched by the Japan Aerospace Exploration Agency (JAXA) in 2006, and carries three remote sensing instruments: an L-band Polarimetric Synthetic Aperture Radar (PALSAR), an along-track 2.5 m Panchromatic Resolution Stereo Mapper (PRISM), and an Advanced Visible and Near Infrared Radiometer type 2 (AVNIR-2). ALOS AVNIR-2 is a visible and near infrared radiometer for observing land and coastal zones with a four-band and 10 m spatial resolution. The data type of AVNIR-2 is 8-bit unsigned integer and has 7000 pixels per row with a 70 km swath width at nadir [45]. Images from ALOS AVNIR-2 in this study were employed in order to verify the detection of surface-water products, including floodwater from MODIS-derived MLSWI. The ALOS AVNIR-2 images in this study were captured over the Sirajganj district (approx. 2480 km2) during the pre- and flood-time conditions on 23 December 2006 and 10 August 2007.

2.2.4. Water Level and Elevation Data

The BWDB has a nationwide hydrological network, which regularly measures surface water levels and water discharges year-round. In this network (Figure 1), the FFWC under BWDB is in charge of flood monitoring and forecasting for flood damage reduction. As flood monitoring was a prime concern of the initial activities of the hydrological network, monitoring gauging stations along main rivers and tributaries are being installed to identify the progress of flooding. River water levels have been regularly measured five times a day (Bangladesh standard time at 6 a.m., 9 a.m., 12 p.m., 3 p.m., and 6 p.m.; 6 h ahead of Universal Time Coordinated (UTC/GMT)). We used the water level data of 2007 collected from 84 stations to validate MODIS detected flood areas in this study. The gauging station records indicated the overflow was reaching very close to the dangerous level, i.e., over the maximum water level in the river. The Shuttle Radar Topography Mission (SRTM) digital elevation data (DEM 15 s with a 450 m spatial resolution and a 1 m vertical resolution) were acquired from HydroSHEDS (hydrological data and maps based on the SHuttle Elevation Derivatives at multiple Scale) [46].

3. Methodology

3.1. Nationwide Risk Mapping Framework

The risk is characterized and measured by a combination of exposure and vulnerability to a hazard based on areas where a hazard is posing an immediate threat to human lives, property, or the environment [1,47]. Hazard and exposure are identified by tangible factors using topographic and demographic distribution data. Vulnerability, though intangible, is measured as a characteristic of the elements of interest (i.e., assets, agricultural products) [48]. In this paper, risk is defined as potential damage areas focusing on the rice fields of the annual largest flood risk associated with hazard and exposure, in order to estimate the rice field proxy risk. This study applied the concept of flood risk to the 2007 floods of Bangladesh in the case of the cyclic 10-year flood event. Figure 2 shows three procedures for the assessment of areas of direct monetary damage: (a) hazard, (b) exposure, and (c) risk, respectively.
(a)
Hazard (H) is defined as a potentially harmful situation that poses a level of threat to the environment and to humans. In this study, satellite images correlated with actual ground data are used to detect and identify floodwater and then to produce a hazard map focusing on inundation (see Section 3.2.1).
(b)
Exposure (E) is a condition of being affected by particular events with the possibility of loss, injury, or some real estates related to human activity. In this study, irrigated rice field areas (m2) are estimated as risk exposure areas within the hazard area before the 2007 flood of Bangladesh (see Section 3.2.3).
(c)
Risk (R) is the probability of harmful consequences, i.e., casualties, damaged property, lost livelihoods, disrupted economic activity, and damage to the environment [49]. Risk is considered in relation to regional vulnerability (V); that is subject to potential factors which cause exacerbation of the risk. For producing the rice field damage proxy map by identifying pixels which were directly exposed to the 2007 flood, risk is calculated by using exposed areas and stage-damage curves to represent regional vulnerability (see Section 3.2.4).
Figure 2. Conceptual framework of nationwide rice field damage mapping.
Remotesensing 07 15805 g002
This conceptual framework provides a technical approach that is a robust numerical risk calculation which is widely applicable to create a rice field damage proxy (risk) map to eliminate complexity and ambiguity of vulnerability for decision-makers of national and local governments, so they will be able to obtain hazard mapping capabilities to differentiate flooded from non-flooded areas. Damage data for these three risk components in this methodology are limited to the national level, lacking the latest data from experiments and observations. Even the simplification of national-level data should be related to the adoption of the methodology to fit the availability of any data. For nationwide flood mapping and risk proxy mapping, the risk components need to be estimated at an optimal scale with a sufficient resolution in order for the components to be compatible with each other, and with a spatial scale at any flood event. Multiple datasets with different resolutions were integrated by resampling (resizing) with nearest-neighbor interpolation to achieve the same spatial resolution (500 m) in order for the datasets to produce better results with consistency in spatial distribution.

3.2. Data Processing

3.2.1. Floodwater Detection

Following the significant 2007 flood in Bangladesh, it became necessary to improve a surface water detection method to identify flood areas by using water indices. For flood mapping in a nationwide, comprehensive approach, it is important to determine floodwater pixels more accurately through the development of a floodwater index. The MODIS time series data were processed in four different patterns to compare the three water indices of NDWI, LSWI, MLSWI combining bands 2 and 6 (MLSWI 2 and 6), and MLSWI combining bands 2 and 7 (MLSWI 2 and 7). The equations used to derive NDWI, LSWI, and MLSWI from MODIS bands are as follows:
NDWI 1 , 6 =   ρ Red ρ SWIR ρ Red + ρ SWIR
LSWI 2 , 6 =   ρ NIR ρ SWIR ρ NIR + ρ SWIR
MLSWI 2 , 6  and  2 , 7 =   1 ρ NIR ρ SWIR 1 ρ NIR + ρ SWIR
where ρ Red , ρ NIR and ρ SWIR are atmospherically corrected surface reflectance for their respective MODIS bands: band 1 (red: 620–670 nm), band 2 (NIR: 841–876 nm), and bands 6 and 7 (SWIR: 1628–1652 nm and 2105–2155 nm, respectively).
Three spectral indices, NDWI, LSWI, and MLSWI, were designed to be correlated to surface wetness, focusing on the sensitivity of water indices to floodwater detection over the whole of Bangladesh, where monsoon river floods are dominant and frequent, causing the maximum inundation extent. Figure 3 shows the different water indices: MLSWI 2 and 6 (Figure 3b,g), MLSWI 2 and 7 (Figure 3c,h), LSWI (Figure 3d,i), and NDWI (Figure 3e,j), all of which use data from MOD09A1 (Terra) acquired in the morning and MYD09A1 (Aqua) acquired in the afternoon.
Figure 3. Composite surface reflectance RGB images (R: band 7 = 2105–2155 nm, G: band 2 = 841–876 nm, B: band 4 = 545–565 nm) from (ae) MODIS Terra (MOD) and (fj) Aqua (MYD) acquired between 5 and 12 August 2007, and eight results from four different water indices of (b,g) MLSWI 2 and 6; (c,h) MLSWI 2 and 7; (d,i) LSWI 2 and 6; and (e,j) NDWI 1 and 6.
Remotesensing 07 15805 g003
After MLSWI was compared with NDWI and LSWI, the most optimized index was selected as a floodwater index that was considered effective in detecting water bodies. An optimal threshold of each water index needs to be established to separate water bodies from other land-cover features based on the spectral characteristics. The sample areas were selected by supervised classification at sites two and three in the Sirajganj district. The training sites were sorted into five classes: permanent waters, floodwater, urban, cloud, and vegetation areas. Representative areas of each class were sampled to check the range of MLSWI, NDWI and LSWI to detect the floodwater of Figure 3. Figure 4 shows that MLSWI (A. threshold = 0.85) indicated the sample’s superiority over NDWI (B. minimum value = −0.62) and LSWI (C. minimum value = −0.79) in distinguishing floodwater from non-flood areas during 5–12 August 2007 near the peak inundation, as well as by visual interpretation as shown in Figure 3. Since the training sample was supervised in each class, the threshold of MLSWI was particularly valuable to distinguish floodwater and cloud from flood areas. The threshold values were calculated by the mean and standard deviation. On the contrary, the index values of floodwater from LSWI and NDWI do not show such a distinguishing power since they are totally within the range of cloud (grayed solid bar in Figure 4).
Figure 4. Comparison of MLSWI (red line) to LSWI (blue line) and NDWI (black line) from five classes in the selected site of the Sirajganj district during 5–12 August 2007 near the peak inundation.
Remotesensing 07 15805 g004
We evaluated and analyzed the performance of MLSWI, considering NIR (841–876 nm) and SWIR (1628–1652 nm and 2105–2155 nm) spectral reflectances coupled with simple index methods. When comparing MOD09A1 and MYD09A1 images, we found that MLSWI 2 and 6 and MLSWI 2 and 7 from MOD and MYD had very similar values ranging from 0.5 to 1.0 with small variations. These images represent nearly the same performance of MLSWI 2 and 6 and MLSWI 2 and 7, except for the ambiguity between cloud, shadow, a variety of vegetated wetlands and their boundary along with permanent water bodies, i.e., pond, lake, and river. For example, the average value of the variety of vegetated areas detected from MLSWI 2 and 6 was 0.02 lower than MLSWI 2 and 7 (in Figure 3b,c,g and h), and the flood areas also show a similar pattern for estimation. That means MLSWI 2 and 7 is slightly more sensitive to those types of pixels and thus more suitable for determining the critical threshold for accurate flood areas in consideration of vegetated wetlands. Resulting from the comparison, we selected MLSWI 2 and 7 in order to detect all inundated flood areas due to the large-scale flood in 2007.

3.2.2. Verification of Floodwater

Several zones were selected at sites two and three for verification of the existence of floodwater (i.e., site two: Majibari Union = 18.8 km2, and site three: Koijuri Union = 28.8 km2 in Figure 1). Over 100 ground truth sample points were obtained from the field survey in each Union to distinguish floodwater and non-flooded areas. The stratified random sample points were all located in the area of 30%–100% damage level in the Sirajganj district along the Brahmaputra River. Floodwater and non-flooded areas in the Sirajganj district were verified by the high-spatial-resolution (10 m) ALOS AVNIR-2 images. The water-related pixels of MLSWI were confirmed by a comparison with the water pixels from NDVI threshold classification and differential NDVI, focusing on NIR (Band 4: 760–890 nm) of AVNIR-2 in the Sirajganj district. Kappa (K), an index that estimates the agreement between two rasters, was used for comparison of inundated areas. K > 0.8 represents strong agreement, 0.6 < K ≤ 0.8 represents substantial agreement, 0.4 < K ≤ 0.6 represents moderate agreement, and a value K ≤ 0.4 represents poor agreement [50].
K = P 0   P e 1   P e
P e = ( a 1 × b 1 +   a 0 × b 0 ) n × n
where P0 is the overall accuracy which is the ratio of matched pixels, Pe stands for the probability of random agreement, including both inundated (a1 and b1) and non-inundated (a0 and b0) pixels in MODIS-derived MLSWI and ALOS AVNIR-2 data, respectively; and the total number of compared pixels (n).

3.2.3. Floodwater Depth and Duration

To determine the floodwater depth (FD), firstly the differential water level (ΔH, Figure 1a) for river channel pixels was obtained by subtracting the observed danger level (HDL, the river water level above which a flood may cause damage to nearby crops and homesteads [11]) from the recorded highest water level (HRHL): ΔH = HRHL − HDL. The floodwater depth was then calculated for each pixel near the river channel using the following simple algorithm between the differential water level (ΔH) and the differential elevation (ΔDEM) of each of the neighboring pixels in the eight directions: FDij = ΔHij − ΔDEMij, i and j are the number of rows and lines, respectively. The algorithm assumes that the floodwater will flow from river pixels into neighboring pixels with the lowest differential elevation when the river water level exceeds the danger level. Figure 5a shows the relationship between the hydrograph and the crop calendar at the Sirajganj stage gauge; HRHL is 15.12 m and HDL is 13.35 m. The floodwater of the differential water level (ΔH = 1.73 m) overflows into the surrounding lowlands.
According to the in situ hydrograph created from the river water level as an indicator, we determined the flood duration, not only by the eight- and 16-day MODIS data, but also by observing the in situ flood hydrograph five times a day. Daily MODIS and eight-day composite data provide a reasonable estimate of the dynamic extent of floodplain inundation at the regional scale. The MODIS eight-day composite data can be used as a surrogate for daily images to determine the flood duration. Though not suited to capture flash floods, MODIS eight-day composite data captured the 2007 floods in Bangladesh that lasted for 14 days (see Figure 3a). We confirmed the eight- and 16-day flood durations derived from MODIS eight-day composite data by checking daily surface reflectance (MOD09GA and MYD09GA) during the peak flood period.
Figure 5. (a) The relationship of flood characteristics between the hydrograph and crop calendar due to monsoon flooding from July to September at the Sirajganj stage gauge [51]; and (b) simplified rice damage curves.
Remotesensing 07 15805 g005

3.2.4. Exposed Rice Field

To estimate the exposure area of rice fields, a hybrid approach was applied to identify irrigated paddy fields before the flooding of 2007, by combining data between existing paddy fields from MODIS-derived VI products with a quality check (MODIS-EVI and NDVI) and extracted paddy fields from two land cover data; GLCNMO 2008 and GMIA ver.5. For extracting and combining two rice products, the rice fields from GLCNMO 2008 are recalculated for all input pixels containing over 10% of rice croplands from GMIA ver.5 data products by using the block statistic function in the same boundary rectangle (approx. 10 km spatial resolution). Since there is no reliable evidence-based map of national land-use and cropland in Bangladesh, we adopted this hybrid approach to minimize the ambiguity of identifying rice fields despite the difference in their production years and spatial resolutions. MODIS-EVI can provide estimates of the spatial distribution of rice phenology, the amount of rice crop per year, and the cropping pattern [52]. With MODIS-EVI alone, however, it is difficult to determine areas of existing rice fields because EVI detects all vegetation. GMIA/GLCNMO was then used with EVI to identify existing irrigated paddy fields with improved accuracy. EVI was calculated as in the following equation,
EVI = ρ NIR ρ red ρ NIR +  C 1 × ρ red  C 2 × ρ blue +  L
where L is the canopy background adjustment that addresses nonlinear, differential NIR and red radiant transfer through a canopy, and C1 and C2 are the coefficients of the aerosol resistance term, which uses the blue band to correct for aerosol influences in the red band. The coefficients adopted in the EVI algorithm are L = 1, C1 = 6, C2 = 7.5, and G (gain factor) = 2.5 [30].
Similar to NDVI, EVI has been shown to be well correlated with LAI, biomass, canopy cover, and the fraction of absorbed photosynthetically-active radiation [29]. To evaluate the performance of the hybrid approach, we compared rice-crop statistics [36] and in situ field data collected over three validation test sites in two districts (see Figure 1) representing a variety of land-surface types and a high risk of flood damage.

3.2.5. Risk Area Estimation

Nationwide flood risk was estimated for damage assessment in terms of flood hazard (i.e., inundation area, depth, duration and frequency), exposure (i.e., agricultural estates) and vulnerability (i.e., sensitivity to economic damage). A proxy map is an alternative risk map for identifying and quantifying risk at a macro level. In this study, the risk proxy map of the rice fields is characterized as a result of the combination of hazard and exposure in rice fields based on the 2007 flood conditions. Mainly, a large flood causes significant damage to rice at the transplanting and pre-growing stages during June to August in Bangladesh. On a large scale in this study, economic damage evaluation in agriculture is performed only for Aman rice, focusing on rapid flood risk assessment by using a simple remote sensing-based approach and moderate estimates (i.e., approx. 500 m spatial resolution). To estimate the risk area affected by a hazard, flood stage-damage curves of rice crops were applied to the floodwater depth and duration, using temporal and spatial dynamics for nationwide flood risk instead of inadequate information of actual risk phenomena.
The points in Figure 5b were created from local data collected by farmers and local offices (i.e., districts) in several flood-prone regions in the 2014 household survey of BWDB; the regions suffered from the 2007, 2012, 2013, and 2014 floods in the Brahmaputra River basin, which occur at average intervals of one to 10 years. Flood risk was identified at a 500 m spatial resolution based on the hypothesis that rice damage will occur when the river water level exceeds the danger level. The simplified stage-damage curves in Figure 5b were modified corresponding to the representative points. According to the simplified stage-damage curves, the level of relative damage (damage ratio = the area of rice damage/total area of rice fields, %) corresponds to the flood duration, and damage to rice crop begins when the floodwater depth in the rice field reaches 0.3 m. We categorized three proxy risk areas (Figure 5b) according to the two simplified maximum damage curves based on exposed rice fields identified in the 2007 flood of this study: the high-risk area (100% damage in the case of 16 days flood duration over 1 m FD), the medium-risk area (60% damage in the case of 16 days flood duration under 1 m FD or eight days flood duration over 1 m FD), and the low-risk area (30% damage in the case of eight days flood duration under 1 m FD). Finally, an integrated risk proxy map was produced, and it can be used to estimate relative damage according to the maximum damage curves based on exposed rice fields identified in the 2007 flood of this study.

4. Results

4.1. Nationwide Hazard Mapping

4.1.1. Inundated Areas

On the national scale, inundated areas were detected and analyzed during the 2007 floods with a cyclic 10-year pattern over the whole country of Bangladesh from July to August 2007. Figure 6 shows inundation extent maps with a peak flood and spatial distribution for the duration and extent of the flooding over the period 5–20 August 2007, generated by a combination of Terra and Aqua MODIS images from MLSWI 2 and 7 (Figure 6b). The inundation map in Figure 6b was produced with MLSWI 2 and 7, in which the red pixels represent the floodwaters during 5–12 August 2007 (enlarged to Figure 6d), the blue pixels represent the floodwaters during 13–20 August 2007, and the cyan pixels represent the permanent water bodies captured before flooding during 22–29 March 2007 (enlarged to Figure 6c). Figure 6e and 6f show the NDVI threshold classification and differential NDVI of ALOS AVNIR-2, the cyan pixels represent the river waters before flooding, and the blue pixels represent the floodwaters captured on 10 August 2007. Figure 6g,h show a spatial flood change during the pre- and flood-time conditions in site three, Sirajganj district, from ALOS AVNIR-2 composite RGB images (R: band 4 = 760–890 nm, G: band 2 = 520–600 nm, B: band 1 = 420–500 nm). These examples appear consistently in flood detection by MLSWI, and show the universal superiority of floodwater detection by MODIS-derived MLSWI. The combination of Terra and Aqua MODIS showed that 42% of the total country area was inundated during the 16 days in 2007. This result was highly correlated with the record flood in 1987 and also the flood in 2007. The total flood-affected areas were about 40% (approx. 52,600 km2) in Bangladesh [9,51]. According to the cyclic periods of different floods over 115 years in Bangladesh, the 2007 flood in this study may have a cyclic period of between 10 and 20 years, because the affected area corresponds to the historically-affected area of between 37% and 43% of the country [9,10].

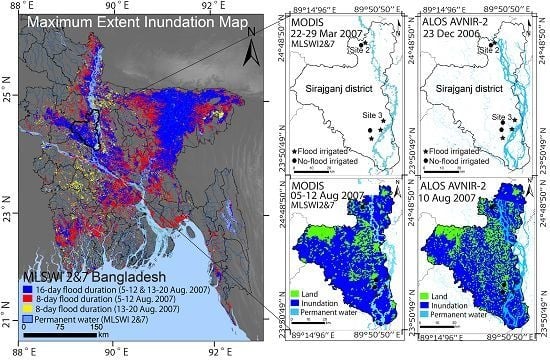
4.1.2. Cross-Validation of Flood Areas

Flood areas were verified by comparing MODIS-derived results with ALOS AVNIR-2 data (10 m spatial resolution) in cross validation by ground truthing the study area along the major rivers in Sirajganj and Gaibandha districts. Although flood areas smaller than a resolution of 500 m were not detected accurately in the case of MODIS, the plotted permanent water bodies detected from MODIS (Figure 6b) are in moderate agreement with the high-spatial-resolution (10 m) ALOS AVNIR-2 images (Figure 6f) for estimating the most vulnerable areas near the major river (e.g., the Sirajganj district). MLSWI 2 and 7 in Figure 6e identified some parts as flooded even if not flooded or vice versa. The water-related pixels of MLSWI were confirmed by comparison with AVNIR2-derived NDVI in the selected areas of the Sirajganj district (2480 km2) along the Brahmaputra River. The total inundated areas from MODIS-derived MLSWI and AVNIR2-derived NDVI were 79% (Figure 6e) and 76% (Figure 6f), respectively, by the pixel-based classification. The overall accuracy of 78% was achieved with a Kappa (K) coefficient of 0.57, representing moderate agreement. The inundated areas of the Sirajganj district show the suitability of MLSWI 2 and 7 to detect floodwater, although there was inconsistent flood detection in some places due to a reducing effect on the accuracy from the class number and the observed satellite images captured on different dates. A larger number of land cover types and ground sampling points from homogeneous test sites may increase estimation accuracy.
In Bangladesh, satellite-based measurement is the main data source on flood status at a given point. In addition, hydrological gauging stations, which record current maximum water levels and flood stages for monitored rivers, played an important role in flood forecasting because there was a remarkable change in the extent of detected floodwater from the time when the flood reached the danger level (Figure 3a) on 19 July 2007 [11]. Figure 5a confirms that the flood propagation was in good agreement with the flood starting date and the timing of the water level exceeding the water danger level.
As a result of the validation of rapid flood inundation mapping, the ambiguities from satellite-derived products for the Brahmaputra River were verified by using high-resolution images, water gauge stages, and ground truths. Extensive field surveys were conducted to obtain total ground truth samples from 300 points at sites one (Saghata Subdistrict = 255 km2), two (Majibari Union = 18.8 km2), and three (Koijuri Union = 28.8 km2) in Figure 1, which were selected from flood-prone and agriculture-dominant areas located in the area of 60%–100% damage level that represent the whole of the Brahmaputra flood plain of Bangladesh. In risk areas, we found that roads became a temporary shelter-in-place if they were over 1 m higher than the neighboring land. On the other hand, from evidence-based watermarks, household surveys, and interviews, we discovered that paddy fields were easily submerged in the case of over 1 m floodwater depth.
Figure 6. (a) Simulated inundation map on 18 September 2013 from BWDB FFWC; (b) maximum extent inundation map from a combination of Terra and Aqua MODIS images during 16 days (5–20 August 2007), and a comparison of MLSWI with ALOS AVNIR-2, the permanent water (cyan pixels) of the Brahmaputra River from (c) MLSWI and (d) NDVI threshold classification of ALOS AVNIR-2 in the Sirajganj district, respectively. Sites represent inundation extent of (c,d) pre- and (e,f) flood-time conditions (floodwater is blue pixels). Site three is enlarged to show the (g) pre- and (h) flood-time conditions using AVNIR-2 composite RGB images (R: band 4 = 760–890 nm, G: band 2 = 520–600 nm, B: band 1 = 420–500 nm).
Remotesensing 07 15805 g006

4.2. Nationwide Exposure Mapping

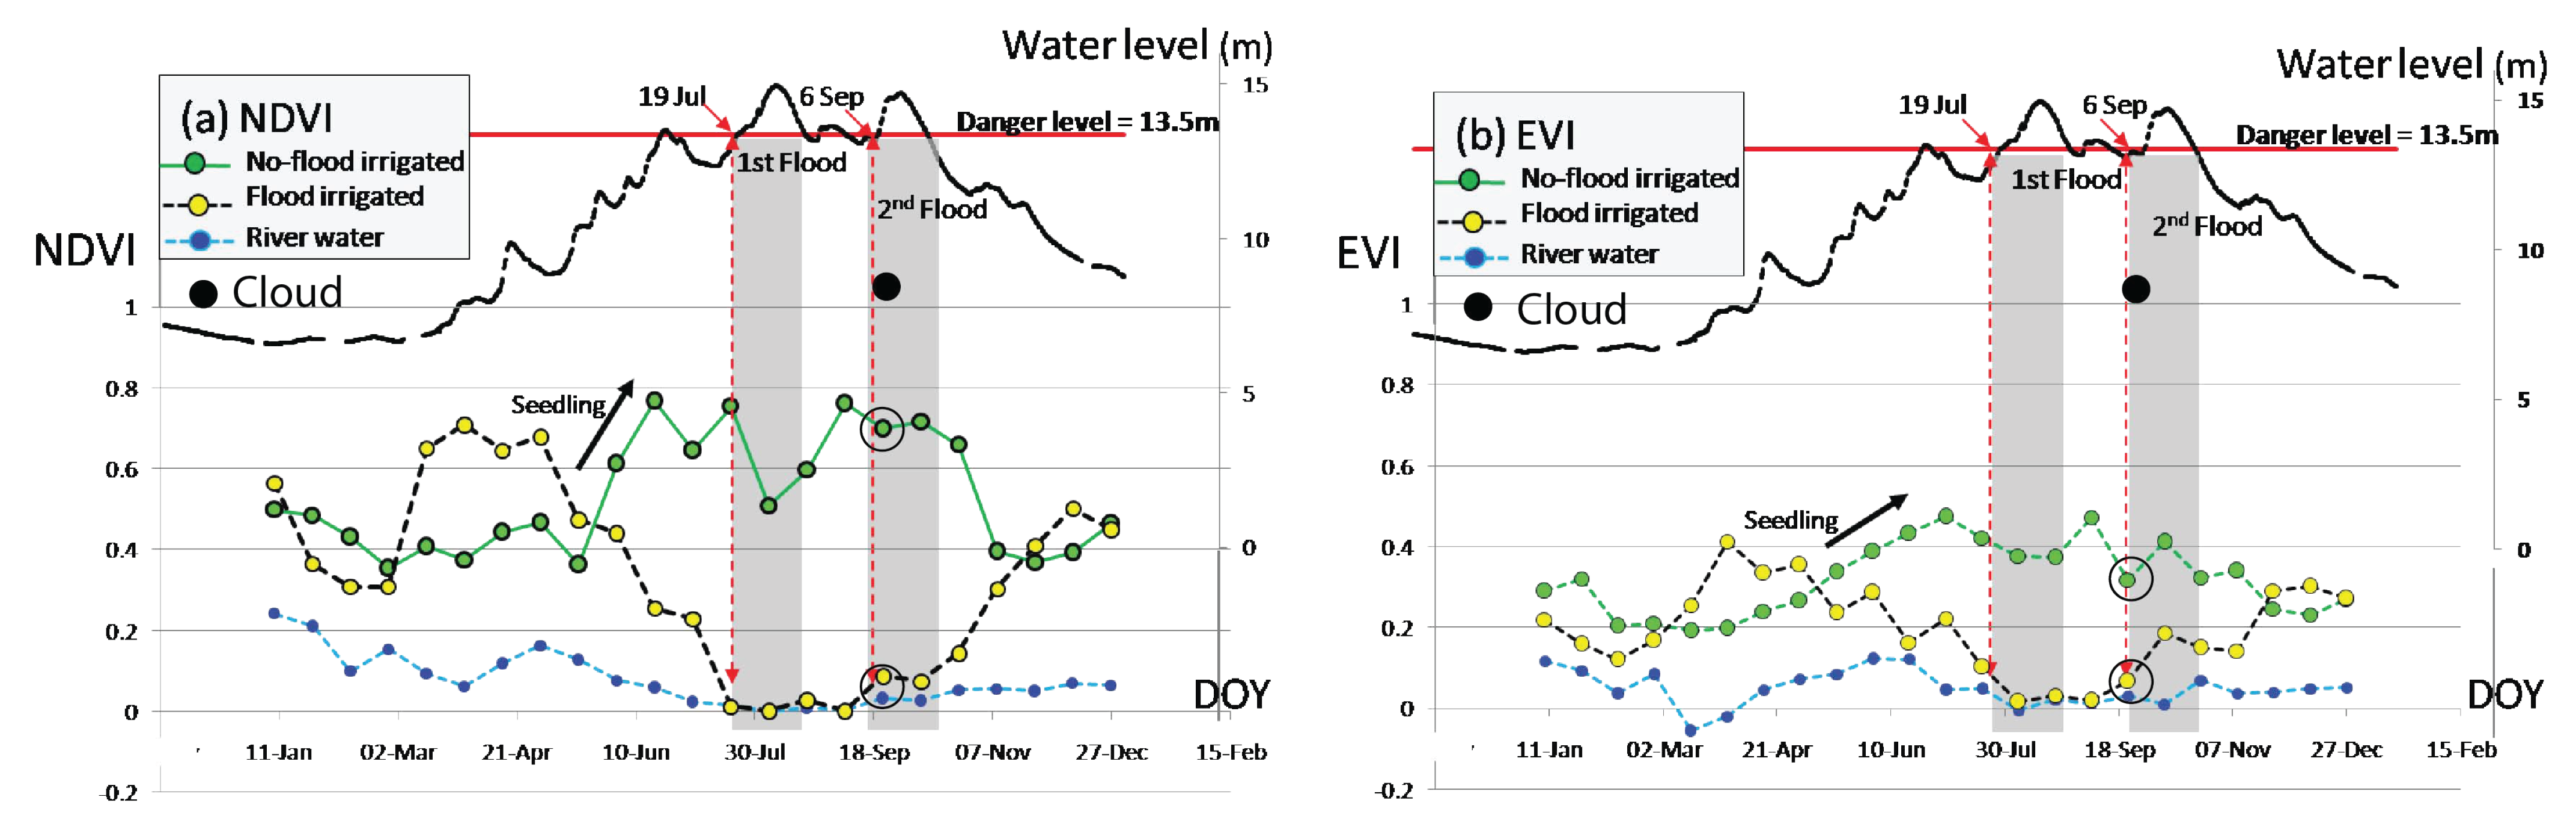
4.2.1. Temporal Vegetation Profiles

To determine rice fields, unique spectral-temporal responses were detected at the pixel level in the time-series MODIS VI data. The multi-temporal VI profile of rice crops is expected to reflect the crop’s general phenological characteristics, e.g., timing of green-up and peak greenness according to the crop calendar. The multi-temporal EVI and NDVI profiles were visually evaluated for irrigated rice crops according to their respective responses. In Figure 6, the temporal behavior of VI is shown by three representative classes: flooded rice fields, non-flooded rice fields, and water of the Brahmaputra River at site three. The temporal resolution is a 16-day composite period (rice fields from MOD13Q1, green line in Figure 7). MODIS EVI represented significant changes especially during the vegetative and flood stages in 2007 in terms of average values in the three classes. The multi-temporal EVI and NDVI were highly correlated with seasonal patterns in river water levels. Flood duration from the water level is represented by grayed solid bars, while the water bodies detected from MOD09A1 product are represented by the blue dashed line. The flooded rice fields detected from MOD13Q1 are represented by the yellow solid line, while non-flood irrigated rice fields from MOD13Q1 products are represented by the green solid points at site three. With MODIS-EVI values ranging from −1.0 to +1.0, negative values indicate the presence of cloud (black dot in Figure 7) or water, and the positive values are correlated with green vegetation according to decision tree classification. The MODIS-EVI values are identified in the range between around 0.2 and 0.8, indicating actual irrigated rice fields. The lowest MODIS-EVI from July to September after flooding indicated the non-vegetated status as the fields were covered by water. The decrease in MODIS-EVI response detected in July was associated with the emergence of floodwater in rice fields. The actual flood started on 19 July 2007, then peaked on 2 Aug, and lasted for a total of 14 days. During the first and second flood on 19 July and 22 September 2007, the image quality decreased due mainly to cloud cover. Therefore, the produced pixels from MOD13Q1 were difficult to interpret and might not be correct for EVI, whereas a MODIS-EVI from MOD09A1 composite image, acquired on 12–19 July 2007, was useful and mainly used for identifying actual irrigated rice fields before flooding by a visual inspection of cloud QA.
Figure 7. (a) Temporal NDVI and (b) EVI profile of the three representative classifications; flooded rice fields (yellow points), non-flooded rice fields (green points), and Brahmaputra River water (blue points) at site three, with hydrograph (black points) of Sirajganj station in 2007.
Remotesensing 07 15805 g007

4.2.2. Hybrid Rice Field Mapping

The next phase was to produce a hybrid rice field map (Figure 8a) by integrating the rice fields from GLCNMO 2008 (Figure 8b) and GMIA ver.5 (Figure 8c) data, and the actual irrigated rice fields in 2007 from MODIS-derived VI for agricultural exposure, in order to interpret global rice field data so as to modify regional rice field data, because better rice field information is needed for more accurate cropland distribution. The integrated rice fields were considered as irrigated ones when detected with the pre-harvest EVI value of over 0.25 before the 2007 flood in Bangladesh. In the hybrid rice field map, the irrigated rice fields are indicated as green pixels, while abandoned fields are shown as gray pixels.
In Bangladesh, the rice crop accounts for 94% of the total crop production and a rice field area of about 105,000 km2, about 50% of which is used for Aman rice [36,50]. The total area of the rice fields in this study was estimated at about 26,144 km2, and the actual total crop damage area was estimated at about 9500 km2, which is consistent with the historical damage area of about 7000 km2 [50]. Hybrid rice field mapping can reasonably estimate the total damage area of Aman rice based on the relationship between a hybrid map and historical data.
Figure 8. (a) Hybrid rice field map considered actual condition; (b) distributed rice field areas from GLCNMO2008; and (c) percentage of rice crop areas from GMIA ver.5.
Remotesensing 07 15805 g008

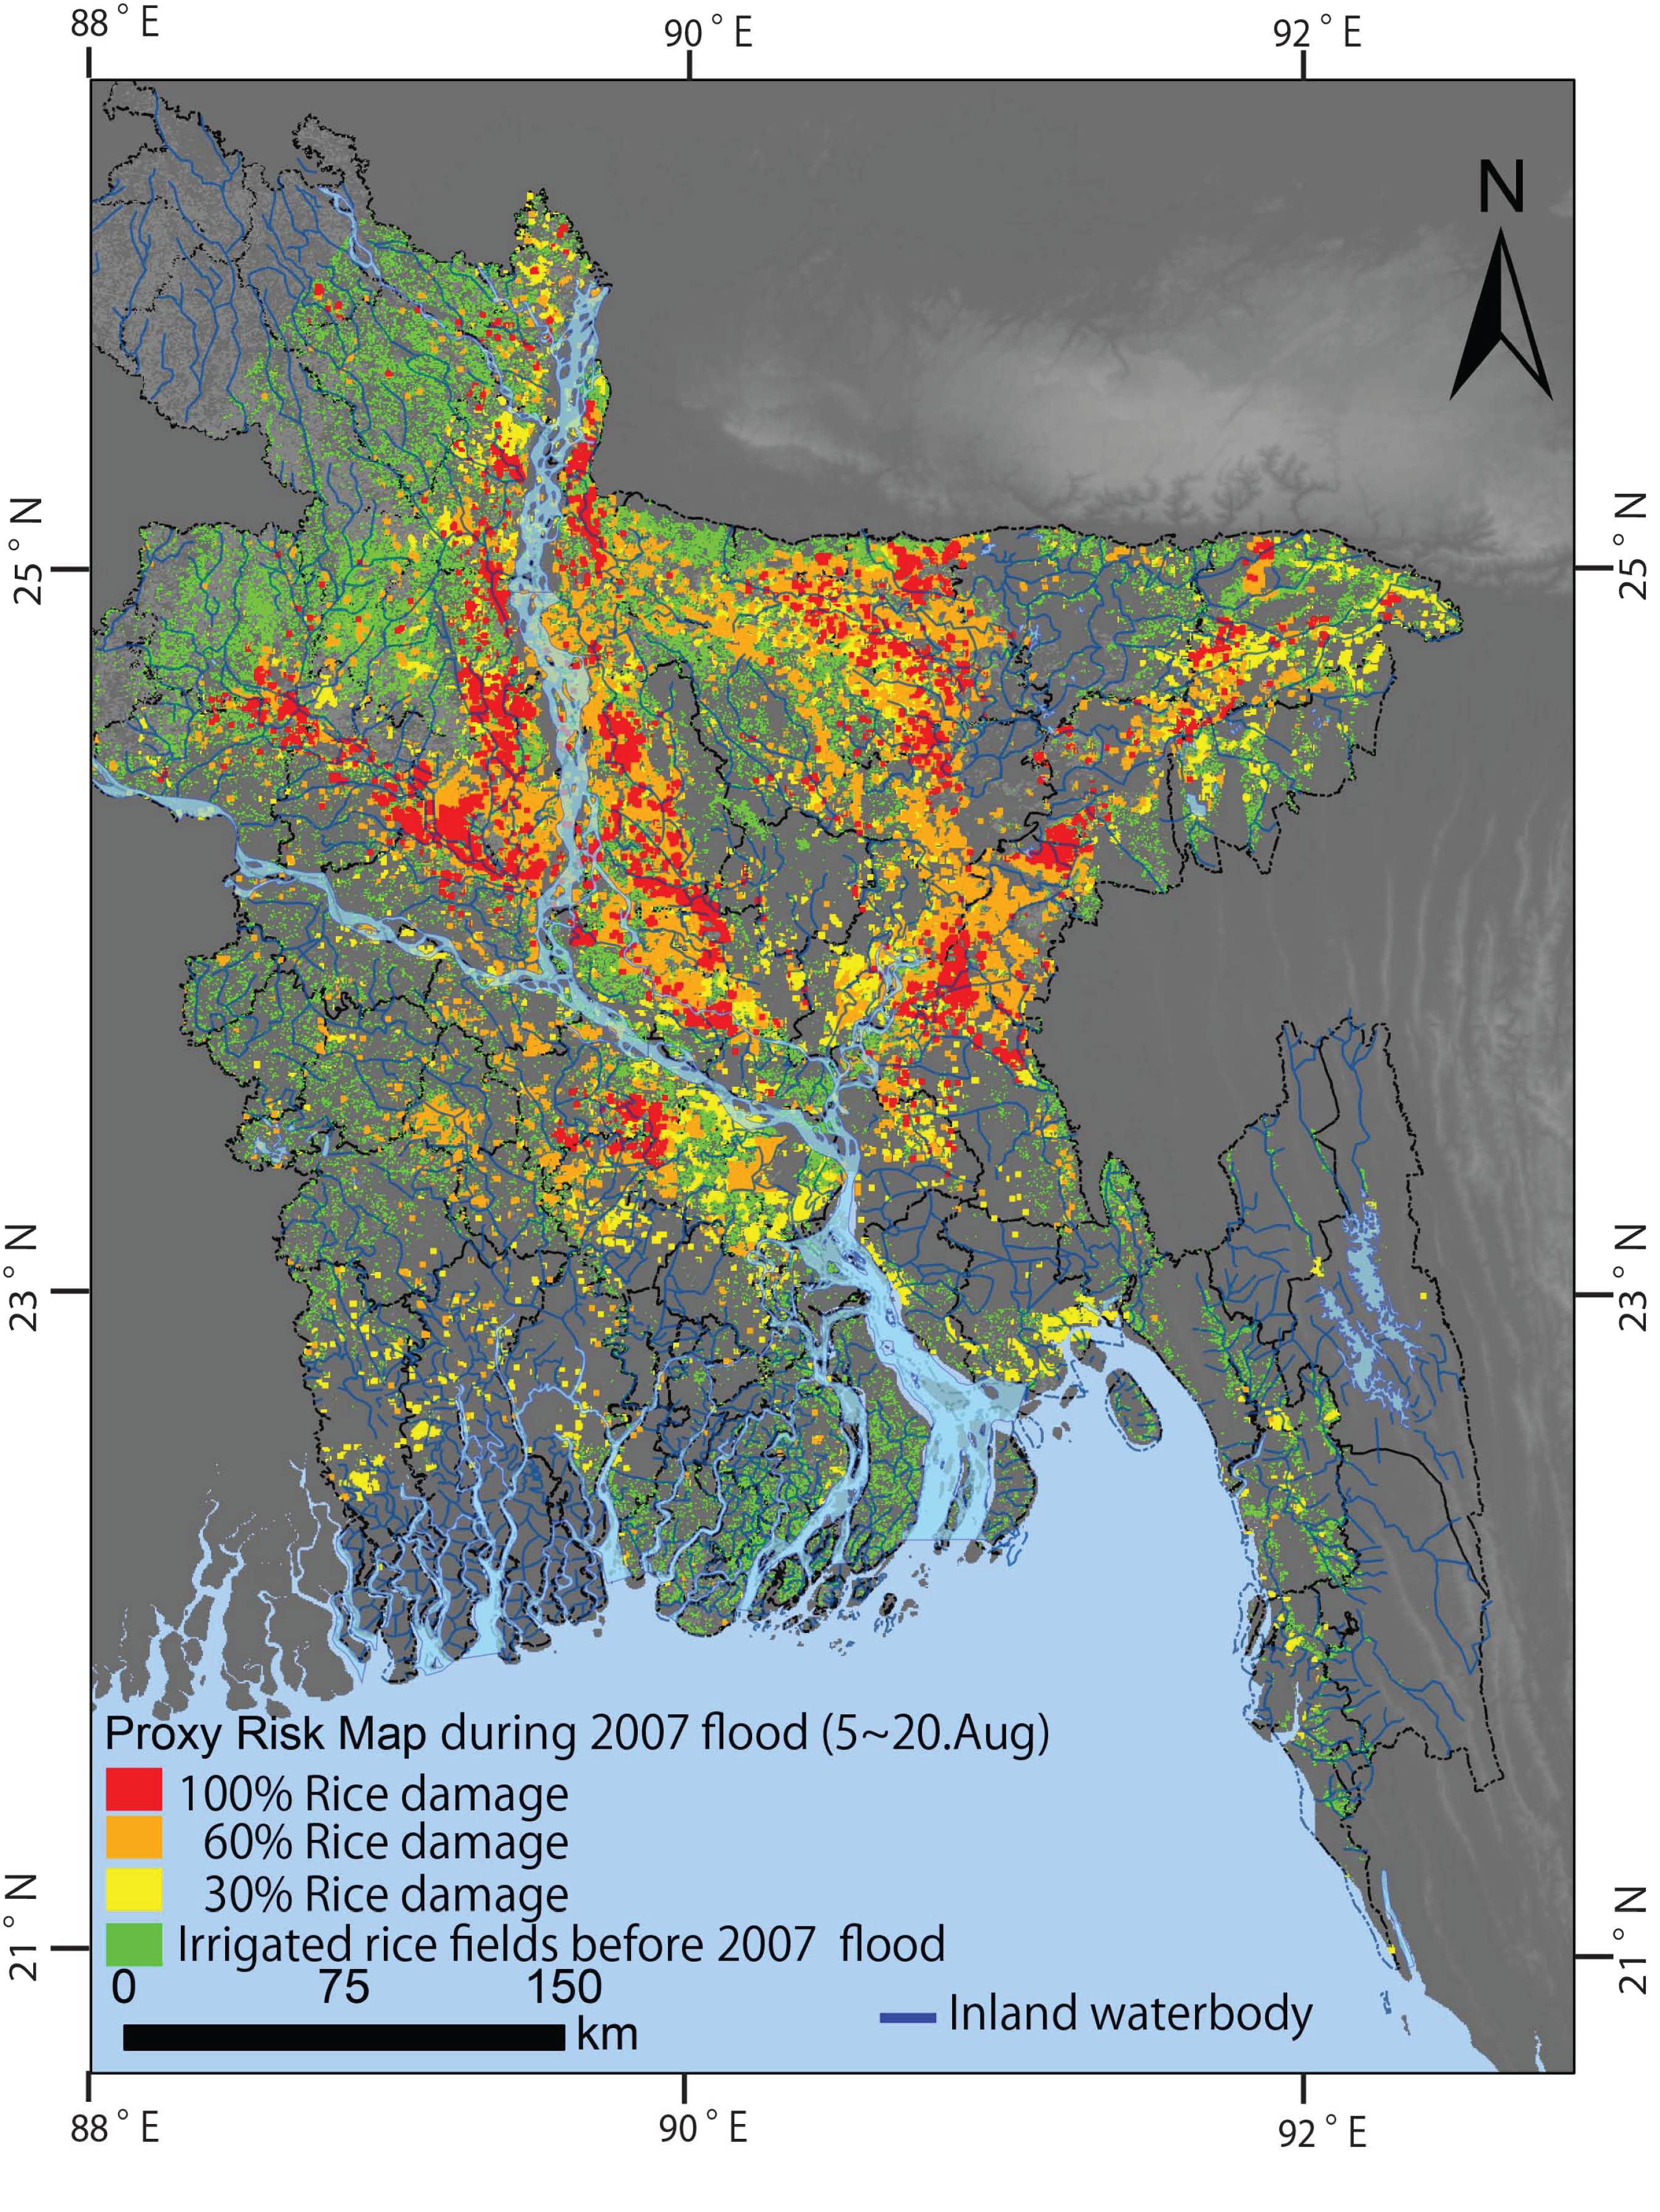
4.3. Nationwide Risk Proxy Mapping

The damaged rice field mapping shows the possibility of producing large-scale distribution maps from hazard and exposure mapping for the straightforward and instantaneous estimation of rice field damaged areas by using the MODIS-derived MLSWI and EVI data before and after flooding. A GIS-based distribution calculation was completed to estimate damaged areas over the whole country. The rice field damage started on July 19 and propagated due to emerging floodwater (Figure 9). In the case of the 2007 flood in Bangladesh, the boundary of the irrigated rice fields detected by the pre-harvest EVI value was larger than the maximum flood area. The output map is represented in Figure 9 with two different levels of rice field damage areas in the 2007 flood in the eight-day and 16-day products of MLSWI based on the flood stage-damage curves. The rice field damaged areas were calculated by counting the damaged areas according to different lengths of flood duration. The yellow pixels (approx. 5400 km2) were categorized as under 30% damaged from the eight-day flood duration, the orange pixels as over 60% damaged from eight-day and 16-day flood duration (approx. 3000 km2), the red pixels (approx. 1300 km2) as 100% damaged from the 16-day flood duration, and the green pixels (approximately 16,500 km2) as non-flooded damage areas. The area of rice crop damage was estimated at about 20% (approx. 10,000 km2) of the total rice field area, although it may be an over-estimation as the study assumes the maximum hazard and exposure areas in the 2007 flood. We found that the rice field areas near the Brahmaputra and Meghna Rivers are the most vulnerable to flood risk in Bangladesh; for example, a floodwater depth of over 1.0 m in the rice field was found mostly near those rivers (red color indicates 100% damage).
Figure 9. Nationwide flood risk proxy map at a 500 m spatial resolution according to an evidence-based scenario.
Remotesensing 07 15805 g009

5. Conclusions

In this paper we explored the use of satellite data (MODIS) for the purpose of producing a flood risk proxy map covering all of Bangladesh. According to the framework for nationwide damaged rice field mapping, such data and their analytical methods used to identify large flood risk areas will be valuable to risk managers and decision makers, despite the limitation of data availability. The results from this study suggest that it is possible to identify hazard areas from MODIS-driven water index (MLSWI) products and to highlight floodwaters and exposure to existing rice fields at multiple spatial resolutions and thematic scales of land cover. We integrated data resources at different resolutions to produce better results with consistency of spatial distribution. From this study, we established several selected points regarding the suitability of the data used for this specific application.
First, we proposed a new water index to detect a large flood from MODIS data over Bangladesh. This straightforward methodology with improved MLSWI is applicable to any inundation area and reduces ambiguity in detecting floodwaters. Moreover, we confirmed that MLSWI can directly detect floodwaters from the reflectance of multi-temporal MODIS during flood events, with the starting and ending dates, maximum extent, peak flood, etc. The preliminary results of the physical nationwide flood mapping were validated with observed high spatial resolution satellite images (10 m), historical data, and field survey results, which were collected from flood-prone and agriculture-dominant areas that represent the whole of the Brahmaputra flood plain of Bangladesh.
Second, we found that historical MODIS-derived vegetation index records can be used to characterize rice crop conditions in order to estimate physical exposure. Since relevant information is not currently available, it is necessary to produce a hybrid rice field map. The use of hybrid and integrated rice field maps should be expanded to monitor regional crop conditions. Then, crop-related land-cover classification is possible, which will lead to near-real-time crop mapping over large areas, prompt identification of damaged agro-regions, and constant updating of flood exposure data.
Third, we confirmed that risk mapping is extremely important for the development of planning, cost-effective analysis, and low-cost solutions in various agro-sectors. The preliminary results can be quickly provided to stakeholders, districts, and administrative agencies in their country. Proxy risk was represented by the damage map of the 2007 flood, including potential damage areas, which showed a clear relation between water level and detected damage-rice fields in Bangladesh. We validated and confirmed that these results were reasonable and acceptable as a proxy risk map after comparing them with the results of the field survey.
Fourth, the combination of remote-sensing and geographic information system has been proven to be of great importance for nationwide flood risk management due to different resolutions, such as the temporal, spatial, and structure of data. A nationwide flood mapping, and also appropriate local mapping, are fundamental preconditions for flood disaster risk management and risk reduction. Results from this study are also related to critical and urgent issues throughout risk-based monitoring, focusing on world food shortages at global and regional levels. This integrated approach allows a rapid assessment of areas in order to detect levels of damage by not only flood disasters, but also other water-related disasters such as drought, landslides, and tsunami.
Lastly, although there were no other validating data, the preliminary results were discussed in depth with Bangladesh government agencies. The rice-crop risk proxy map was strongly influenced by floodwater depth and duration. Damage curves should be developed through extensive field surveys of damaged rice fields and interviews with farmers. Presently, this is the best way to practically develop crop damage curves. It was difficult to determine the level of accuracy of the results from end to end. The results can be indirectly compared with the crop damage statistics of the Disaster Management Office of Bangladesh. We concluded that this proxy risk map will have practical influence on the reduction of rice field damage due to floods at the national as well as local level. Governments at all levels, policy makers, topmost stakeholders and farmers will find appropriate solutions to save rice crops, which are the main staple food of Bangladesh, by using this proxy risk map. This proxy risk map was developed to meet the demands of the government on a national level; at the same time it should further contribute to the provision of detailed information for the users at the regional and local administrative levels.
The next challenge is to extend the study to a broader scale, while overcoming the lack of data and limitations, such as optical image resolution, weather problems, and evidence-based comparable damage data. For example, the fusion of moderate- and high-resolution images, including radar (SAR) data, needs to be considered to improve the accuracy of flood detection obtained by high temporal, spatial, and spectral information. At the same time, damage assessment in dynamic flood phenomena needs to be reproduced more accurately with evidence-based flood depth, duration, and location. In this respect, this study can contribute to global flood monitoring, as well as to near-real-time flood damage proxy mapping, for better emergency responses and economic development as a sustainable solution to food deficiency.

Acknowledgments

This work was supported by the Japan Society for the Promotion of Science (JSPS) KAKENHI Grant-in-Aid for Scientific Research B: 15H05136 and 24710211. We thank Md. Amirul Hossain, executive engineer of FFWC, for cooperation in collecting data and our study activities. We would also like to thank Masahiko Okubo at ICHARM for his editorial support in finalizing this manuscript.

Author Contributions

Youngjoo Kwak, the principal investigator, led this research of JSPS KAKENHI Grant B: 15H05136 and 24710211. He designed it with Yoichi Iwami, and with Bhuyan Arifuzzanman conducted the field survey and analyzed the data.

Conflicts of Interest

The authors declare no conflict of interest.

References

  1. United Nations Office for Disaster Risk Reduction (UNISDR). Living with Risk: A Global Review of Disaster Reduction; UNISDR: New York, NY, USA; Geneva, Switzerland, 2004. [Google Scholar]
  2. International Federation of Red Cross (IFRC). World Disaster Report 2014-Data: Focus on Culture and Risk; IFRC: Geneva, Switzerland, 2014. [Google Scholar]
  3. World Bank. World Development Report 2014: Risk and Opportunity, Managing Risk for Development; World Bank: Washington, DC, USA, 2013. [Google Scholar]
  4. Bates, B.C.; Kundzewicz, Z.W.; Wu, S.; Palutikof, J.P. Climate Change and Water; Technical Paper of the Intergovernmental Panel on Climate Change; IPCC Secretariat: Geneva, Switzerland, 2008. [Google Scholar]
  5. UN General Assembly. Report of the Open Working Group of the General Assembly on Sustainable Development Goals. A/68/970. 12 August 2014. Available online: http://undocs.org/A/68/970/ (accessed on 10 January 2015).
  6. UN General Assembly. United Nations Millennium Declaration, Resolution Adopted by the General Assembly. A/55/L.2. 18 September 2000. Available online: http://www.un.org/millennium/declaration/ares552e.htm (accessed on 2 November 2014).
  7. World Water Assessment Programme (WWAP). The United Nations World Water Development Report 3: Water in a Changing World; UNESCO Publishing: Paris, France; Earth Scan: London, UK, 2009; Available online: http://www.unesco.org/water/wwap/wwdr/wwdr3/ (accessed on 20 October 2014).
  8. Kwak, Y.; Takeuchi, K.; Fukami, J.; Magome, J. A new approach to flood risk assessment in Asia-Pacific region based on MRI-AGCM outputs. Hydrol. Res. Lett. 2012, 6, 55–60. [Google Scholar] [CrossRef]
  9. Hofer, T.; Messerli, B. Floods in Bangladesh: History, Dynamics and Rethinking the Role of the Himalayas; United Nations University Press: Tokyo, Japan, 2006. [Google Scholar]
  10. Bangladesh Water Development Board (BWDB). Observed River Data and Reports of 1988, 1998, and 2004 Floods; BWDB: Dhaka, Bangladesh, 2014. Available online: http://www.bwdb.gov.bd (accessed on 1 September 2014).
  11. Bangladesh Water Development Board (BWDB), Flood Forecasting & Warning Centre (FFWC), 2014. Available online: http://www.ffwc.gov.bd (accessed on 20 September 2011).
  12. Islam, A.S.; Bala, S.K.; Haque, M.A. Flood inundation map of Bangladesh using MODIS time-series image. J. Flood Risk Manag. 2010, 99, 333–339. [Google Scholar] [CrossRef]
  13. Pinheiro, A.C.T.; Descloitres, J.; Privette, J.L.; Susskind, J.; Iredell, L.; Schmaltz, J. Near-real time retrievals of land surface temperature within the MODIS rapid response system. Remote Sens. Environ. 2007, 106, 326–336. [Google Scholar] [CrossRef]
  14. National Aeronautics and Space Administration (NASA). Near Real-Time (NRT) Global MODIS Flood Mapping. January 2015. Available online: http://oas.gsfc.nasa.gov/floodmap/ (accessed on 3 January 2015). [Google Scholar]
  15. National Aeronautics and Space Administration (NASA). Flooding in Bangladesh from the MODIS Rapid Response System. 2007. Available online: http://earthobservatory.nasa.gov/NaturalHazards/view.php?id=18492&eocn=image&eoci=related_image (accessed on 10 January 2014). [Google Scholar]
  16. Alsdorf, D.; Lettenmaier, D.; Vorosmarty, C. The need for global, satellite based observations of terrestrial surface waters. Eos Trans. Am. Geophys. Union 2003, 84, 275–276. [Google Scholar] [CrossRef]
  17. Brakenridge, G.R.; Syvitski, J.P.M.; Overeem, I.; Stewart-Moore, J.A.; Kettner, A.J.; Westerhoff, R. Global mapping of storm surges, 2002-present and the assessment of coastal vulnerability. Nat. Hazards 2012, 66, 1295–1312. [Google Scholar] [CrossRef]
  18. Verbesselt, J.; Zeileis, A.; Herold, M. Near real-time disturbance detection using satellite image time series. Remote Sens. Environ. 2012, 123, 98–108. [Google Scholar] [CrossRef]
  19. Dartmouth Flood Observatory (DFO). Dartmouth Atlas of Global Flood Hazard. 2008. Available online: http://www.dartmouth.edu/~floods/index.html (accessed on 15 April 2012).
  20. McFeeters, S.K. The use of the Normalized Difference Water Index (NDWI) in the delineation of open water features. Int. J. Remote Sens. 1996, 17, 1425–1432. [Google Scholar] [CrossRef]
  21. Gao, B. NDWI—A normalized difference water index for remote sensing of vegetation liquid water from space. Remote Sens. Environ. 1996, 58, 257–266. [Google Scholar] [CrossRef]
  22. Xiao, X.; Hollinger, D.; Aber, J.D.; Goltz, M.; Davidson, E.A.; Zhang, Q.Y. Satellite-based modeling of gross primary production in an evergreen needle leaf forest. Remote Sens. Environ. 2004, 89, 519–534. [Google Scholar] [CrossRef]
  23. Chandrasekar, K.; Sesha Sai, M.; Roy, P.; Dwevedi, R. Land Surface Water Index (LSWI) response to rainfall and NDVI using the MODIS Vegetation Index product. Int. J. Remote Sens. 2010, 31, 3987–4005. [Google Scholar] [CrossRef]
  24. Kwak, Y.J.; Park, K.; Fukami, J. Near real-time flood volume estimating from MODIS time-series imagery in the Indus River basin. IEEE J. Sel. Top. Appl. Earth Obs. Remote Sens. 2014, 7, 578–586. [Google Scholar] [CrossRef]
  25. Merz, B.; Kreibich, H.; Thieken, A.H.; Schmidtke, R. Estimation uncertainty of direct monetary flood damage to buildings. Nat. Hazards Earth Syst. Sci. 2004, 4, 153–163. [Google Scholar] [CrossRef]
  26. Büchele, B.; Kreibich, H.; Kron, A.; Thieken, A.; Ihringer, J.; Oberle, P.; Merz, B.; Nestmann, F. Flood-risk mapping: Contributions towards an enhanced assessment of extreme events and associated risks. Nat. Hazards Earth Syst. Sci. 2006, 6, 485–503. [Google Scholar] [CrossRef]
  27. Brémond, B.P.; Grelot, F.; Agenais, A.L. Review Article: Economic evaluation of flood damage to agriculture-review and analysis of existing methods. Nat. Hazards Earth Syst. Sci. 2013, 13, 2493–2512. [Google Scholar] [CrossRef] [Green Version]
  28. Rouse, J.W.; Haas, R.H.; Schell, J.A.; Deering, D.W. Monitoring vegetation systems in the Great Plains with ERTS. In Proceedings of the Third ERTS Symposium, NASA SP-351 I, Washington, DC, USA, 10–14 December 1973; pp. 309–317.
  29. Gao, X.; Huete, A.R.; Ni, W.; Miura, T. Optical–biophysical relationships of vegetation spectra without background contamination. Remote Sens. Environ. 2000, 74, 609–620. [Google Scholar] [CrossRef]
  30. Huete, A.; Justice, C.; Liu, H. Development of vegetation and soil indices for MODIS-EOS. Remote Sens. Environ. 1994, 49, 224–234. [Google Scholar] [CrossRef]
  31. Guindin-Garcia, N.; Gitelson, A.A.; Arkebauer, T.J.; Shanahan, J.; Weiss, A. An evaluation of MODIS 8- and 16-day composite products for monitoring maize green leaf area index. Agric. For. Meteorol. 2012, 161, 15–25. [Google Scholar] [CrossRef]
  32. Huete, A.; Didan, K.; Miura, T.; Rodriguez, E.P.; Gao, X.; Ferreira, L.G. Overview of the radiometric and biophysical performance of the MODIS vegetation indices. Remote Sens. Environ. 2002, 83, 195–213. [Google Scholar] [CrossRef]
  33. Ji, L.; Zhang, L.; Wylie, B. Analysis of dynamic thresholds for the normalized difference water index. Photogramm. Eng. Remote Sens. 2009, 75, 1307–1317. [Google Scholar] [CrossRef]
  34. Hatfield, J.L.; Prueger, J.H. Value of using different vegetative indices to quantify agricultural crop characteristics at different growth stages under varying management practices. Remote Sens. 2010, 2, 562–578. [Google Scholar] [CrossRef]
  35. Peng, D.; Huete, A.R.; Huang, J.; Wang, F.; Sun, H. Detection and estimation of mixed paddy rice cropping patterns with MODIS data. Int. J. Appl. Earth Obs. Geoinf. 2011, 13, 13–23. [Google Scholar] [CrossRef]
  36. Bangladesh Bureau of Statistics (BBS). Agriculture Wing; Annual Report; Government of the People’s Republic of Bangladesh: Dhaka, Bangladesh, 2011.
  37. Bangladesh Bureau of Statistics (BBS). Yearbook of Agricultural Statistics; Statistics and Informatics Division (SID), Ministry of Planning, Government of the People’s Republic of Bangladesh: Dhaka, Bangladesh, 2012.
  38. Shankar, B.; Halls, A.; Barr, J. The effects of surface water abstraction for rice irrigation on floodplain fish production in Bangladesh. Int. J. Water 2005, 3, 61–83. [Google Scholar] [CrossRef]
  39. World Food Program (WFP). Bangladesh Food Security Monitoring Bulletin; Issue No. 2; WFP: Rome, Italy, 2010. [Google Scholar]
  40. Land Processes Distributed Active Archive Center. US Geological Survey Land Processes Distributed Active Archive Center. Available online: https://lpdaac.usgs.gov/ (accessed on 30 July 2012).
  41. Carroll, M.; Townshend, J.; DiMiceli, C.; Noojipady, P.; Sohlberg, R. A New Global Raster Water Mask at 250 Meter Resolution. Int. J. Digit. Earth 2009, 2, 291–308. [Google Scholar] [CrossRef]
  42. Tateishi, N.; Hoan, N.; Kobayashi, T.; Alsaaideh, B.; Tana, G.; Phong, D. Production of global land cover data—GLCNMO2008. J. Geogr. Geol. 2014, 6, 99–122. [Google Scholar] [CrossRef]
  43. Siebert, S.; Henrich, V.; Frenken, K.; Burke, J. Global Map of Irrigation Areas Version 5; Rheinische Friedrich-Wilhelms-University: Bonn, Germany; Food and Agriculture Organization (FAO) of the United Nations: Rome, Italy, 2013; Available online: http://www.fao.org/nr/water/aquastat/irrigationmap/index10.stm (accessed on 3 December 2014).
  44. Siebert, S.; Doll, P.; Hoogeveen, J.; Faures, J.; Frenken, K.; Feick, S. Development and validation of the global map of irrigation areas. Hydrol. Earth Syst. Sci. 2005, 9, 535–547. [Google Scholar] [CrossRef]
  45. Japan Aerospace Exploration Agency (JAXA). The Advanced Land Observing Satellite “DAICHI” (ALOS). Tokyo, Japan, 2011. Available online: http://global.jaxa.jp/projects/sat/alos/ (accessed on 20 December 2014).
  46. Lehner, B.; Verdin, K.; Jarvis, A. HydroSHEDS, Technical Documentation V1.0, World Wildlife Fund US, 2006. Available online: http://hydrosheds.cr.usgs.gov/ (accessed on 15 December 2012).
  47. Wisner, B.; Blaikie, P.; Cannon, T.; Davis, I. At Risk: Natural Hazards, Peoples Vulnerability and Disasters; Routledge, Tayslor & Francis books: London, UK, 1994. [Google Scholar]
  48. Peduzzi, P.; Dao, H.; Herold, C.; Mouton, F. Assessing global exposure and vulnerability to-wards natural hazards: The disaster risk index. Nat. Hydrol. Earth Syst. Sci. 2009, 9, 1149–1159. [Google Scholar] [CrossRef]
  49. United Nations Development Programme (UNDP). Reducing Disaster Risk: A Challenge for Development; A Global Report; Bureau for Crisis Prevention and Recovery: New York, NY, USA, 2004. [Google Scholar]
  50. Landis, J.; Koch, G. The measurement of observer agreement for categorical data. Biometrics 1977, 33, 159–174. [Google Scholar] [CrossRef] [PubMed]
  51. Food and Agriculture Organization (FAO); World Food Program (WFP). Crop and Food Supply Assessemnt Mission to Bangladesh; Special Report; FAO: Rome, Italy, 2008. [Google Scholar]
  52. Sakamoto, T.; Nguyen, V.; Ohno, H.; Ishitsuka, N.; Yokozawa, M. Spatio–temporal distribution of rice phenology and cropping systems in the Mekong Delta with special reference to the seasonal water flow of the Mekong and Bassac rivers. Remote Sens. Environ. 2006, 100, 1–16. [Google Scholar] [CrossRef]

