Article

Evaluation of Six High-Resolution Satellite and Ground-Based Precipitation Products over Malaysia

1
Institute of Geospatial Science and Technology (INSTeG), Universiti Teknologi Malaysia, 81310 UTM Skudai, Johor Bahru, Malaysia
2
Delft University of Technology, Stevinweg 1, 2628 CN Delft, The Netherlands
3
School of Engineering, Physics and Mathematics, University of Dundee, Dundee DDI 4HN, UK
4
Laboratoire d'Océanographie et du Climat (LOCEAN), UMR 7159 CNRS/IRD/UPMC/MNHN, boîte 100, 4, place Jussieu, 75252 Paris Cedex 05, France
*
Authors to whom correspondence should be addressed.
Remote Sens. 2015, 7(2), 1504-1528; https://doi.org/10.3390/rs70201504
Submission received: 9 October 2014 / Accepted: 16 January 2015 / Published: 29 January 2015

Abstract

:
Satellite precipitation products (SPPs) potentially constitute an alternative to sparse rain gauge networks for assessing the spatial distribution of precipitation. However, applications of these products are still limited due to the lack of robust quality assessment. This study compares daily, monthly, seasonal, and annual rainfall amount at 342 rain gauges over Malaysia to estimations using five SPPs (3B42RT, 3B42V7, GPCP-1DD, PERSIANN-CDR, and CMORPH) and a ground-based precipitation product (APHRODITE). The performance of the precipitation products was evaluated from 2003 to 2007 using continuous (RMSE, R2, ME, MAE, and RB) and categorical (ACC, POD, FAR, CSI, and HSS) statistical approaches. Overall, 3B42V7 and APHRODITE performed the best, while the worst performance was shown by GPCP-1DD. 3B42RT, 3B42V7, and PERSIANN-CDR slightly overestimated observed precipitation by 2%, 4.7%, and 2.1%, respectively. By contrast, APHRODITE and CMORPH significantly underestimated precipitations by 19.7% and 13.2%, respectively, whereas GPCP-1DD only slightly underestimated by 2.8%. All six precipitation products performed better in the northeast monsoon than in the southwest monsoon. The better performances occurred in eastern and southern Peninsular Malaysia and in the north of East Malaysia, which receives higher rainfall during the northeast monsoon, whereas poor performances occurred in the western and dryer Peninsular Malaysia. All precipitation products underestimated the no/tiny (<1 mm/day) and extreme (≥20 mm/day) rainfall events, while they overestimated low (1–20 mm/day) rainfall events. 3B42RT and 3B42V7 showed the best ability to detect precipitation amounts with the highest HSS value (0.36). Precipitations during flood events such as those which occurred in late 2006 and early 2007 were estimated the best by 3B42RT and 3B42V7, as shown by an R2 value ranging from 0.49 to 0.88 and 0.52 to 0.86, respectively. These results on SPPs’ uncertainties and their potential controls might allow sensor and algorithm developers to deliver better products for improved rainfall estimation and thus improved water management.

Graphical Abstract

1. Introduction

Precipitation is an important input of water in the hydrological cycle and is the main source of catchment water [1]. Accurate and reliable precipitation information is therefore necessary to ensure better water resource management and decision-making in the various areas using water, such as agriculture, industries, and cities. Besides that, precipitation datasets are also vital in meteorology, especially for weather forecasting and prediction of water-related hazards such as floods and droughts [2,3,4,5,6].
Traditionally, precipitation data within the catchment area come from direct measurement at gauges. Apart from this, precipitation is also recorded using other ground-based observations such as weather radars and disdrometers, and these techniques are often cited as the most reliable sources of precipitation information [7]. Precipitation data obtained using ground-based observations can be very accurate; however, there are some limitations associated with their cost and the insufficient density of ground stations, especially in the less accessible mountain regions of the world [8].
Satellite precipitation products (SPPs) are widely accepted as an alternative source to overcome the limitations of ground techniques [9]. Recently, satellite information has become available at high spatial (up to 0.25°) and temporal (near real time) resolutions and over large areas (near global). However, estimations using SPPs are subjected to bias and stochastic errors, which depend highly on the hydro-climatic characteristics of a region [10,11]. Therefore, performance evaluation of SPPs in different regions is essential to enable users and algorithm developers to better understand and quantify such errors. Many studies have been conducted to evaluate SPPs at a regional scale [12,13,14]. Shen et al. [15] found the Climate Prediction Center Morphing Technique (CMORPH) performed better at depicting the spatial and temporal patterns of precipitation over China compared to the Tropical Rainfall Measuring Mission (TRMM) 3B42 products and Precipitation Estimation from Remotely Sensed Information Using Artificial Neural Network (PERSIANN). By contrast, CMORPH was the worst estimator of precipitation patterns over Indonesia [16]. Yong et al. [17], in a previous study in Malaysia, found that TRMM 3B42RT yielded overestimations and gauge-adjusted 3B42V7 effectively reduced the overestimations, but the study is a global scale assessment.
Malaysia is a typical tropical country with a mean annual precipitation greater than 2500 mm/yr and a mean monthly temperature range from 23 to 32 °C. The country crucially needs reliable spatial information on precipitation as it mainly relies on agriculture and is subject to frequent floods. It is, for instance, one of the main oil-palm-producing countries, with palm oil productivity highly affected by water availability [18]. This is one reason why adequate monitoring of precipitation over the country is essential. The other reason is that floods are the main natural disaster in Malaysia, with 9% of the total land area and 22% of the population directly affected by floods. One of the worst flooding recorded in the history of Malaysia occurred during the 2006–2007 rainy season; it was responsible for a total economic loss of about $500 million, caused 16 deaths, and resulted in the evacuation of nearly 200,000 people [19,20]. The years that followed these particular catastrophic events were characterized by a search for near real time and high temporal precipitation information tools that would be adapted to the country for improved flood forecasts.
Studies about the evaluation of SPPs in Malaysia appear to be limited. Varikoden et al. [21] evaluated the daily precipitation from TRMM 3B42V6 data in Peninsular Malaysia, which covers only about 40% of the total area of Malaysia, using for validation only four precipitation gauges. Semire et al. [22] validated the TRMM Microwave Imager (TMI) 2A12, 3B42V6, 3B43V6, and Global Precipitation Climatology Center (GPCC) with the monthly precipitation data collected over 10 years (2001–2010) from 22 precipitation gauges distributed over Malaysia. Both studies showed that 3B43V6 performs well over Malaysia, with a ±15% error bias at monthly scale. However, these studies have compared only one or two SPPs, thus limiting their conclusions. There are several other available SPPs that need to be tested such as Global Precipitation Climatology Project (GPCP), PERSIANN, and CMORPH. Moreover, the accuracy assessment of these SPPs is also required at daily time steps. More comprehensive comparisons of various SPPs can not only provide guides on the selection of better products over Malaysia for local application, but also offer insight into the strengths and weakness of different satellite products over this typical tropical climate zone, enabling further improvement of satellite products.
The objective of this study was to evaluate the performance of five different SPPs: TRMM Near-Real Time (3B42RT), TRMM 3B42 version 7 (3B42V7), GPCP 1 Degree Daily (GPCP-1DD), CMORPH, PERSIANN-Climate Data Record (PERSIANN-CDR) (which was only released in Jun 2014) [23], and a ground-based precipitation product (GPP), the Asian Precipitation – Highly-Resolved Observational Data Integration towards Evaluation of Water Resources (APHRODITE). The accuracy of these products was evaluated by using 342 rain gauges at daily, monthly, seasonal, and annual scale from 2003 to 2007, which included the 2006–2007 flood. To our knowledge, this study presents a more comprehensive evaluation across Malaysia than was previously available in terms of the numbers of gauge stations, evaluated satellite products, and the evaluated aspects. Moreover, this study presents the first attempt to evaluate the rain-detection ability of each of the SPPs over Malaysia.

2. Materials and Methods
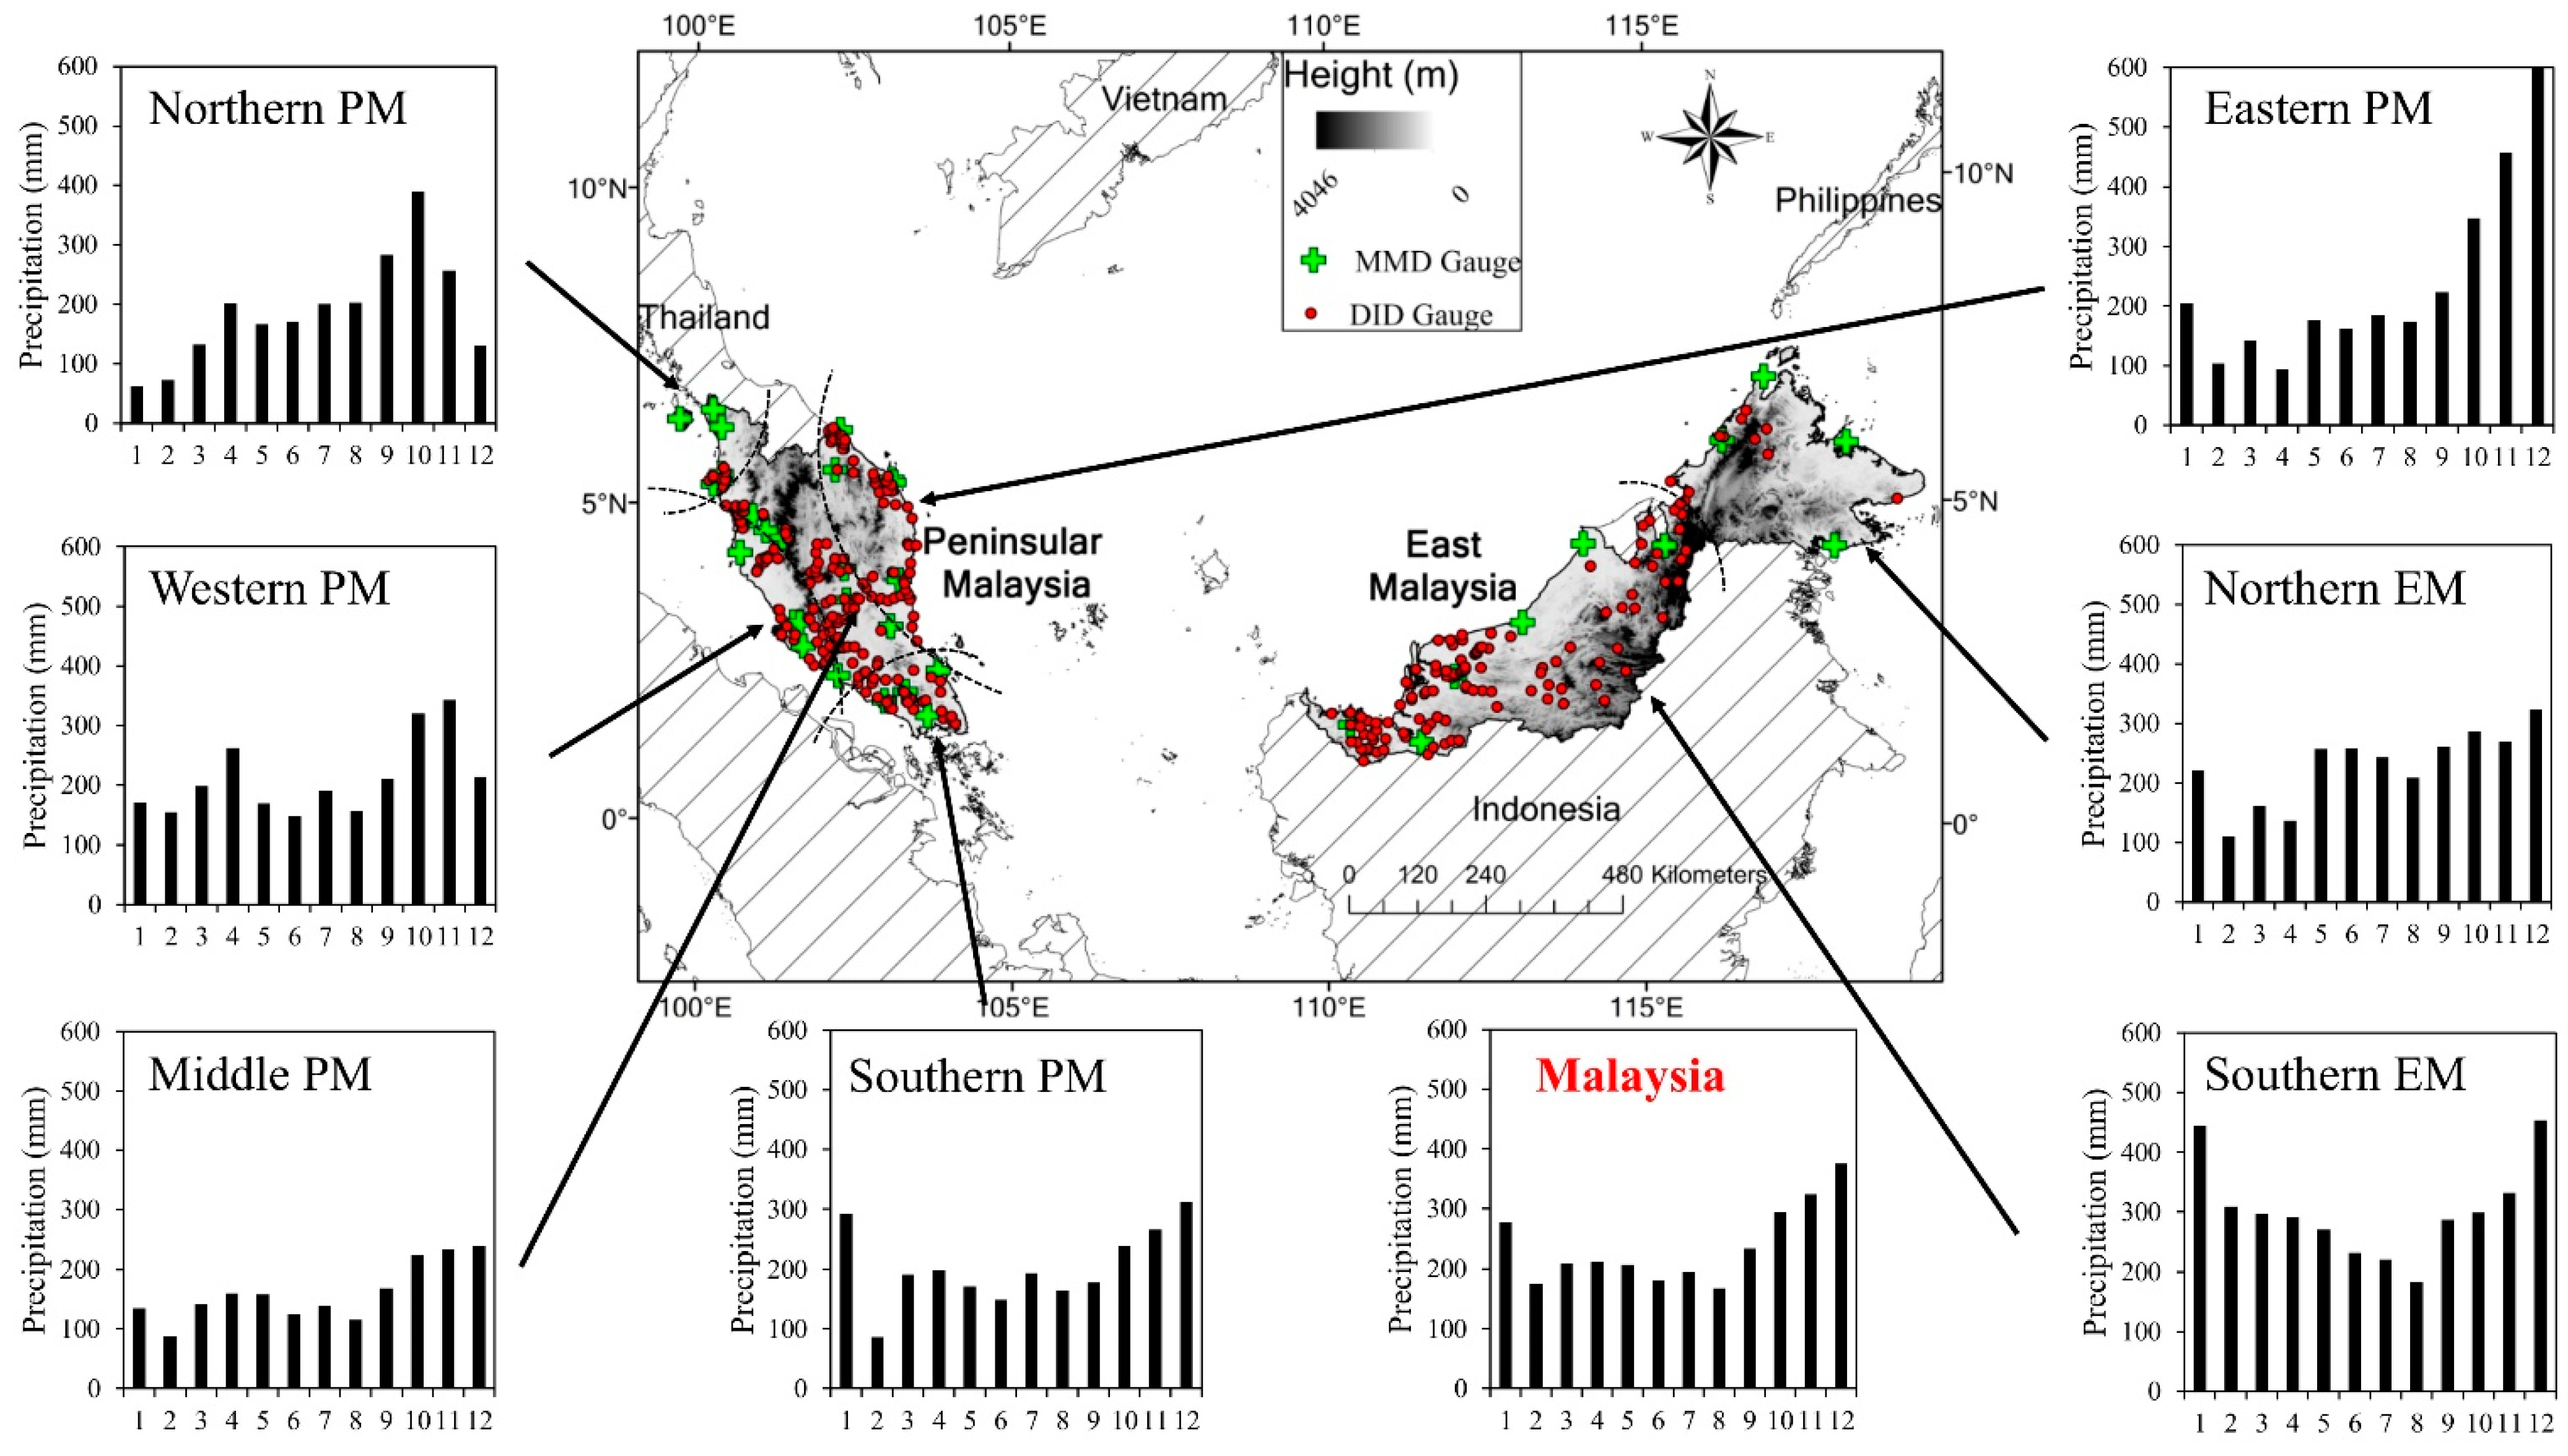
2.1. Study Area

Malaysia is located in Southeast Asia and lies near the Equator, between 1°–8°N latitude and 99°–120°E longitude (Figure 1). Malaysia has a total land area of 329,758 km2, which is divided into two main parts: (1) Peninsular Malaysia (PM) (131,598 km2), located in the south of continental Eurasia; and (2) East Malaysia (EM) (198,160 km2) in the northwestern coastal area of the island of Borneo. The two areas are 531 km apart, separated by the South China Sea. The population of Malaysia was estimated at 28.33 million in 2010, 80% of it (i.e., 22.6 million) living in the PM. The tallest mountain in Malaysia is Mount Kinabalu (4095 m.a.s.l.), which lies on the Borneo Cracker Range, located in northern EM. Altitudes above 1500 m.a.s.l. are also found in PM in the Titiwangsa Range, which stretches 480 km from north to south with a maximum elevation of 2183 m.a.s.l.
Figure 1. Distribution of rain gauges (MMD = Malaysia Meteorological Department; DID = Department of Irrigation and Drainage Malaysia) and topography of Malaysia (bar graphs show the mean monthly precipitation, from 2003 to 2007, of 342 rain gauges).
Remotesensing 07 01504 g001
The climate of Malaysia is subject to the Southeast Asia Maritime Continent monsoon, which is part of the larger Asian–Australian monsoon system [24]. Precipitation from the northeast monsoon (NEM) starts in November and ends in February, while the southwest monsoon (SWM) brings rain from May to August. The NEM brings heavy precipitation in the east coast of PM and in the northeast of the EM region as a result of orography, while the SWM brings relatively less precipitation, particularly in the west coast of PM because of the shield provided by Indonesia. By contrast, the two inter-monsoon seasons, i.e., from March to April and from September to October, bring heavy precipitation that normally occurs as convective rain. The mean monthly precipitation obtained from 342 rain gauges in different regions of Malaysia is shown in Figure 1.

2.2. Rain Gauges

Daily precipitation from 38 principal rain gauges from the Malaysia Meteorological Department (MMD) was selected for this study because of the continuity of the recording from 2003 to 2007 and high confidence in the data [25] (Figure 1 and Table 1). These specific rain gauges are calibrated every six months and any breakdown is fixed within 7 days. Previous investigations showed the error for daily precipitation is below 5% [22]. In addition, 304 additional rain gauges from the Department of Irrigation and Drainage (DID) Malaysia with no missing data from 2003 to 2007 were considered. The daily rainfall values for MMD and DID rain gauges were taken at 08:00 a.m. local time [26], which is the same as 00:00 UTC time. Since most satellite precipitation products estimated daily precipitation at 00:00 UTC, the observed daily rainfall values collected from rain gauges were directly compared to the precipitation products.
Table 1. Thirty-eight principal rain gauges across Malaysia, from the Malaysia Meteorological Department.
NoIDStation NameLongitude (°)Latitude (°)Height (m)
Zone A (Northern Peninsular Malaysia)
141529Perai100.405.351.5
248600Pulau Langkawi99.736.336.4
348601Bayan Lepas100.275.302.8
448602Butterworth100.405.472.8
548603Alor Setar100.406.203.9
648604Chuping100.276.4821.7
Zone B (Eastern Peninsular Malaysia)
748615Kota Bharu102.286.174.6
848616Kuala Krai102.205.5368.3
948618K. Terengganu Airport103.105.385.2
1048619Kajiklim K. Terengganu103.135.3335.1
1148657Kuantan103.223.7815.3
Zone C (Middle Peninsular Malaysia)
1248631K.Tanah Ratah101.384.471471.6
1348632Cameron Highlands101.374.471545.0
1448642Batu Embun102.353.9759.5
1548649Muadzam Shah103.083.0533.3
1648653Temerloh102.383.4739.1
Zone D (Western Peninsular Malaysia)
1748307Universiti Malaya101.653.12104.0
1848620Sitiawan100.704.227.0
1948623Lubok Merbau100.904.8077.5
2048625Ipoh101.104.5740.1
2148647Subang101.553.1216.5
2248648Petaling Jaya101.653.1060.8
2348650KLIA Sepang101.702.7316.3
2448665Melaka102.252.278.5
Zone E (Southern Peninsular Malaysia)
2548670Batu Pahat102.981.876.3
2648672Kluang103.322.0288.1
2748674Mersing103.832.3543.6
2848679Senai103.671.6337.8
Zone F (Southern East Malaysia)
2996413Kuching110.331.4821.7
3096418Sri Aman111.451.229.6
3196421Sibu111.972.2530.9
3296441Bintulu113.033.1023.1
3396449Miri113.984.3317.0
3496465Labuan115.254.3029.3
Zone G (Northern East Malaysia)
3596471Kota Kinabalu116.155.932.3
3696477Kudat116.86.923.5
3796481Tawau117.884.3017.0
3896491Sandakan118.075.9010.3
Since the TRMM 3B42V7 used the Global Precipitation Climatology Centre (GPCC) gauge-based gridded monthly precipitation to perform the month-to-month gauge adjustment [27] and the APHRODITE applied the MMD rain gauges to produce the rainfall product [28], comparison of both products with the MMD observations inevitably leads to a better performance compared to other precipitation products. Rain gauge information such as the number and locations of stations applied in the GPCC production is not available to the public, according to international agreement [29]. However, the DID rain gauges were not used to construct the APHRODITE and Malaysia only supplied 37 rain gauges’ monthly precipitation for the GPCC product development [30,31,32]. Therefore, these observations (342 rain gauges) can be considered as independent from gauge-adjusted precipitation products.
For evaluation, the daily precipitation values of the pixels where rain gauges are located were extracted from various precipitation products and then aggregated to monthly and annual precipitation values. The mean annual precipitation (MAP) of each rain gauge was interpolated using the inverse distance weighting (IDW) technique with a 0.01° grid mesh for visualization purposes (Figure 2). This technique was selected as it is widely used because of its simplicity and reliability [33,34].

2.3. Precipitation Products

Five high-resolution SPPs—3B42RT, 3B42V7, GPCP-1DD, PERSIANN-CDR, and CMORPH—and a GPP, APHRODITE, were evaluated. Table 2 presents basic information about the spatial resolution, coverage, and available periods for all six products.
Figure 2. Spatial distribution of mean annual precipitation for the period 2003–2007 estimated from (a) 3B42RT, (b) 3B42V7, (c) GPCP-1DD, (d) PERSIANN-CDR, (e) CMORPH, (f) APHRODITE, and (g) 342 rain gauges.
Remotesensing 07 01504 g002

2.3.1. TRMM 3B42RT and 3B42V7s

The TRMM is a joint mission between the National Aeronautics and Space Administration (NASA) and the Japan Aerospace Exploration Agency (JAXA) to monitor tropical precipitation. The 3B42RT (near real time) and the 3B42V7 (post-real time) are products from the TRMM Multi-satellite Precipitation Analysis (TMPA) [35]. The TMPA-3B42 algorithm calibrates and combines microwave (MW) precipitation estimates, then creates thermal infrared (IR) estimates by calibrating the IR with the MW precipitation estimates, and finally combines both MW and IR estimates to generate TMPA precipitation estimates. The 3B42RT data are available approximately nine hours after real-time estimations, which makes this product compatible with flood prediction studies. The 3B42V7 product incorporates the Global Precipitation Climatology Centre (GPCC) monthly precipitation for bias correction, but data are only available 10–15 days after the end of each month. The 3B42RT product uses TRMM Microwave Imager (TMI) for calibration, while TRMM Combined Instrument (TCI) precipitation products are used in 3B42V7. The TRMM 3B42V7 daily precipitation was estimated by summing up 8 sets of 3-hourly precipitations for a given day at 00:00 UTC. Evaluation of the latest version of the TMPA products (version 7) using rain gauges data is still limited in South Asian regions [36] like Malaysia. The TRMM 3B42RT and 3B42V7 data used in this study were acquired using the GES-DISX Interactive Online Visualization and analysis Infrastructure (Giovanni) as part of the NASA’s Goddard Earth Sciences (GES) Data and Information Services Center (DISC) [37].

2.3.2. GPCP-1DD

The GPCP was established under the World Climate Research Programme (WCRP) and is available in monthly, pentad, and daily form. The GPCP-1DD provides precipitation on a 1° grid and daily scale starting from 1996 to the present. It uses the threshold-matched precipitation index (TMPI) to measure precipitation from IR, passive MW (PMW) rain estimates, and rain gauge analysis [38]. Similar to other SPPs, the 3-hourly images in each day (00:00, 03:00, 06:00, 09:00, 12:00, 15:00, 18:00, and 21:00 UTC) were summed to generate daily precipitation value [38]. The GPCP-1DD version 1.2 used in this study was provided by the NASA/Goddard Space Flight Center’s Mesoscale Atmospheric Processes Laboratory, which develops and computes the 1DD as a contribution to the GEWEX GPCP [39].

2.3.3. PERSIANN-CDR

The PERSIANN applies an artificial neural network model to measure rainfall rate using IR brightness temperature data from geostationary satellites and updating its parameter using PMW observations from low-orbital satellites [40]. The PERSIANN-CDR was developed from the PERSIANN algorithm using Gridded Satellite Infrared Data (GridSat-B1) and adjusted by the GPCP monthly products [23]. The PERSIANN-CDR daily grids were estimated at 00:00 UTC [23]. The PERSIANN-CDR used in this study was acquired from NOAA’s National Climatic Data Center and this CDR was originally developed by Sorooshian and colleagues [41] for NOAA’s CDR Program.

2.3.4. CMORPH

In the CMORPH technique, the half-hour precipitation estimates from PMW sensors are propagated using motion vectors derived from geostationary satellite IR data. Moreover, the shape and intensity of the precipitation features are modified (morphed) during the gap between PMW sensor overpass by exploiting time-weighted linear interpolation [42]. The CMORPH version evaluated is generated by satellite data sets only [43]. In this study, the 3-hourly CMORPH data (corresponding to the eight synoptic times in a UTC day, 00:00–21:00 UTC) were aggregated into daily data (00:00 UTC) to compare with the other SPPs. The new version of CMORPH v1.0 includes a precipitation product, which is bias-corrected (satellite-only estimates, calibrated against rain gauge analysis for removing bias) and a product that is “gauge-satellite blended” (a merging of CMORPH bias-corrected and gauge observations). This study considers the satellite-based version of CMORPH only, which has not yet been evaluated over Malaysia.

2.3.5. APHRODITE

The APHRODITE provides daily gridded precipitation data over Asia, which is generated from rain gauge data obtained from the national hydrological and meteorological departments [28]. The APHRODITE products are being developed by the APHRODITE’s water resources project in collaboration with the Research Institute for Humanity and Nature and the Meteorological Research Institute of the Japan Meteorological Agency. Rain gauge data were interpolated using the first six harmonics (0.05° resolution) of Fourier interpolation, which takes topography into account. The APHRODITE products are available in 0.25° and 0.5° resolution, and the APHRODITE V1101 with a 0.25° resolution was selected for this study [28].
Table 2. Information on SPPs used in this study.
NoNameSpatial/Temporal ResolutionCoveragePeriodData Reference
13B42RT0.25°/dailyglobal (50°N–S)2002–present[37]
23B42V70.25°/dailyglobal (50°N–S)1998–present[37]
3GPCP-1DD1°/dailyglobal (50°N–S)1996–present[39]
4PERSIANN-CDR0.25°/dailyglobal (60°N–S)1983–present[41]
5CMORPH0.25°/3-hourlyglobal (50°N–S)2002–2013[43]
6APHRODITE0.25°/dailyEurasia (84°N–15°S)1950–2007[28]

2.4. Methodologies for the Assessment of Precipitation Products

The accuracy of each precipitation product was assessed at daily, monthly, seasonal, and annual time scales by comparing precipitation estimates with observations at the 342 rain gauges. Based on the availability of the different products with CMORPH only available from December 2002 and APHRODITE to December 2007, the comparison was performed from January 2003 to December 2007. Point-to-pixel assessment was used to avoid additional errors when interpolating between the gauges [44]. All precipitation values are pooled together for the period 2003–2007 to find the overall performance of precipitation products [45]. In addition, NEM (November–February) and SWM (May–August) seasonal evaluations were conducted by using monthly precipitation (i.e., four months for five years = 20 months, 6840 precipitation values for 342 stations). A Student’s t-test was applied to evaluate the level of significance of the differences between observations and estimations at the selected time steps. A typical significance level of 0.05 was used.
For assessing the spatial variations in estimation error, the 38 MMD principal rain gauges with better quality were attributed to seven sub-regions in Malaysia, with each showing different precipitation patterns (Figure 1 and Table 1): (1) the northern PM (zone A); (2) the eastern PM (zone B); (3) the middle PM (zone C); (4) the western PM (zone D); (5) the southern PM (zone E); (6) the southern EM (zone F); and (7) the northern EM (zone G). Most of the regions received higher precipitation in December and January due to the Northeast monsoon, except for the northern and western regions of PM, which are sheltered by the Titiwangsa Range. By contrast, the middle PM described complex topography but included only two rain gauges (ID 48631 and 48631), located at altitudes of about 1500 m.a.s.l.
We used various statistical measures to evaluate the performance of the various SPPs against the data from the rain gauges. The coefficient of determination (R2) is widely used as a means to quantify the correlation between two data sets (in this case one of the SPPs and the rain gauge data); the value of R2 ranges between 0 (no correlation) and 1 (perfect correlation). The root mean square error (RMSE) and the mean absolute error (MAE) are different measures of the magnitude of the difference between two datasets, while the mean error (ME) allows us to study the bias between the two datasets. Finally, the relative bias (RB) estimates the systematic bias of satellite precipitation in percentage (%). A well performing product should have low ME, RMSE, and MAE values and a low value of the absolute magnitude of the RB. The equations for evaluating all these statistical indicators are given, for instance, by Hu et al. [14].
A probability distribution function (PDF) was computed to evaluate the frequency of different rainfall intensities. Such information is important because the same amount of rainfall occurring over two different durations will lead to different flood patterns [44]. The daily precipitation classes followed the World Meteorological Organization (WMO) standard [46] as follows: (1) rain < 1 mm (no/tiny rain); (2) 1 mm ≤ rain < 2 mm (light rain); (3) 2 mm ≤ rain < 5 mm (low moderate rain); (4) 5 mm ≤ rain < 10 mm (high moderate rain); (5) 10 mm ≤ rain < 20 mm (low heavy rain); (6) 20 mm ≤ rain < 50 mm (high heavy rain); and (7) rain ≥ 50 mm (violent rain).
The ability of each precipitation product to discriminate between rain/no-rain events (days) can be evaluated using several categorical statistics. The accuracy (ACC) represents the level of agreement between the satellite estimate and the rain gauge precipitation data, the probability of detection (POD) measures how well SPPs correctly detected rainfall for all the actual occurrences of rainfall detected by the rain gauges, the false alarm ratio (FAR) measures how often SPPs detected rainfall when actually there was no rainfall, the critical success index (CSI) measures the fraction of a gauge’s precipitation that was correctly detected by the SPPs, and the Heidke skill score (HSS) measures the fraction of correct SPP estimates without considering random matches. The equations used to calculate these quantities have all been given by Mashingia et al. [47]. ACC, POD, FAR, and CSI range from 0 to 1, with 1 being the perfect score for ACC, POD, and CSI and 0 being the perfect score for FAR. The HSS ranges from −∞ to 1, with 1 being a perfect score. All statistical equations used in this study are provided in the Supplementary Information.

3. Results and Discussion

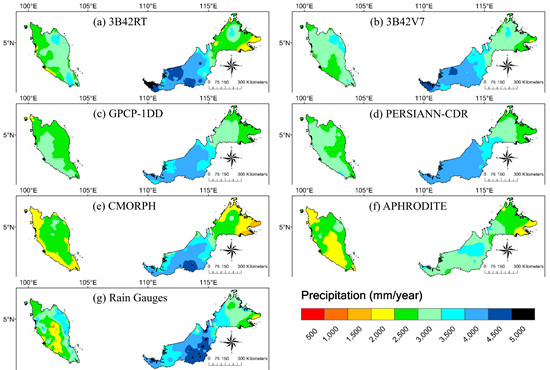
3.1. Mean Annual Precipitation

The interpolated maps of mean annual precipitation (MAP), using gauge observations and estimates from the different precipitation products, are displayed in Figure 2. The observed MAP for Malaysia was 2852 mm/year, with a maximum value of more than 4800 mm/year recorded by a rain gauge in southern EM and a minimum of about 500 mm/year in middle PM (Figure 2g). PM exhibited a trend for MAP to decrease from the east coast to the southwest. High precipitation (1300 to 4500 mm/year) was also found in the eastern and western PM.
Table 3. Student’s t-test analysis of observed and estimated precipitations. P is the significant level, * represents significance at 0.05.
Time Scale3B42RT3B42V7GPCP-1DDPERSIANN-CDRCMORPHAPHRODITE
t statpt statpt statpt statpt statpt statp
Annual−1.84 −4.61*2.91*−2.21*12.15*20.92*
NEM−0.09 −3.62*8.63*4.31*22.02*20.03*
SWM−0.42 −6.98*−4.01*−10.51*3.78*20.97*
Monthly−3.06*−7.45*4.87*−3.66*21.66*34.58*
Daily−5.41*−12.25*8.60*−6.68*38.43*62.69*
Table 3 presents the Student’s t-test analysis of the daily, monthly, seasonal, and annual precipitation (2003–2007) between precipitation products and 342 rain gauges. All precipitation products exhibited significant differences with observations at p < 0.05, except the 3B42RT. APHRODITE showed the best performance for annual precipitations with a value of R2 = 0.46, followed by the 3B42V7 (R2 = 0.45), CMORPH (R2 = 0.33), 3B42RT (R2 = 0.32), PERSIANN-CDR (R2 = 0.31), and GPCP-1DD (R2 = 0.25) (Table 4). The 3B42RT, 3B42V7, and PERSIANN-CDR slightly overestimated MAP, while GPCP-1DD showed slight underestimations. By contrast, APHRODITE and CMORPH were characterized by large underestimation of annual precipitation, by 19.7% and 13.2%, respectively.
Over the study period, 3B32V7 performed the best, while GPCP-1DD performed the worst (Figure 2). Moreover, a MAP underestimation was observed along the coastline regions for most of the SPPs, with the exception of 3B42V7. This might be due to the poor performance of precipitation detection over water/land mixed cells as previously pointed out by Huffman et al. [35].
Table 4. Statistical analysis of the annual, seasonal, monthly, and daily precipitation (2003–2007) between precipitation products and rain gauges.
Time Scale3B42RT3B42V7GPCP-1DDPERSIANN-CDRCMORPHAPHRODITE
AnnualRMSE (mm)857.04732.80843.31808.70922.44908.67
R20.320.450.250.310.330.46
ME (mm)57.67132.96−79.6460.77−376.94−561.98
MAE (mm)651.39540.48640.40618.65689.60684.54
RB (%)2.024.65−2.792.13−13.18−19.65
Northeast monsoonRMSE (mm)158.42138.90168.81158.76175.34160.40
R20.510.600.420.480.460.55
ME (mm)0.3412.41−26.34−13.38−70.76−62.21
MAE (mm)107.1794.00112.05108.34115.14101.47
RB (%)0.124.29−9.10−4.62−24.45−21.50
Southwest monsoonRMSE (mm)98.8584.4792.3393.7097.0389.15
R20.230.370.250.250.270.36
ME (mm)0.6910.786.0616.10−6.32−30.52
MAE (mm)75.1065.0571.3673.0773.0665.16
RB (%)0.375.743.228.56−3.36−16.23
MonthlyRMSE (mm)130.31111.53130.35125.60134.48126.26
R20.450.560.390.430.400.52
ME (mm)4.8111.08−6.645.06−31.41−46.83
MAE91.8678.3089.9089.0491.3183.33
RB (%)2.024.65−2.792.13−13.18−19.65
DailyRMSE (mm)18.1118.3517.2516.6816.7716.55
R20.150.150.090.110.160.12
ME (mm)0.160.36−0.220.17−1.03−1.54
MAE (mm)8.918.999.189.158.148.29
RB (%)2.024.65−2.792.13−13.18−19.65

3.2. Evaluation of Seasonal Precipitation

The climate system in Malaysia is largely affected by the southwest (SWM) and northeast (NEM) monsoons, with the latter bringing the heaviest rain, so separate evaluation of the two monsoons is important in order to explore the mechanism of precipitation products. For the NEM, the best performances were found by using 3B42RT, 3B42V7, and APHRODITE, with R2 values greater than 0.5. The 3B42RT and 3B42V7 slightly overestimated precipitation, while the remaining products underestimated it by 4.6%–24.5% (Table 4). For the SWM, the 3B42V7 showed the best performance with R2 and RMSE of 0.37 and 84.47 mm/month, respectively. By contrast, APHRODITE underestimated the precipitations by an average of 16%.
Overall, the SPPs showed better estimations for the NEM compared to the SWM. These results differ from the findings of Jamandre and Narisma [48] in the Philippines, who found that SPPs (in their case CMORPH and TRMM) performed better during the SWM. By contrast, Mishra et al. [49], in India, showed that TRMM 3B42V6 had a lower RMSE, bias, and FAR for NEM compared to SWM. These differences may be explained by the origin of precipitation with convective weather systems (which dominate during the NEM) being more accurately detected by satellite sensors [50].

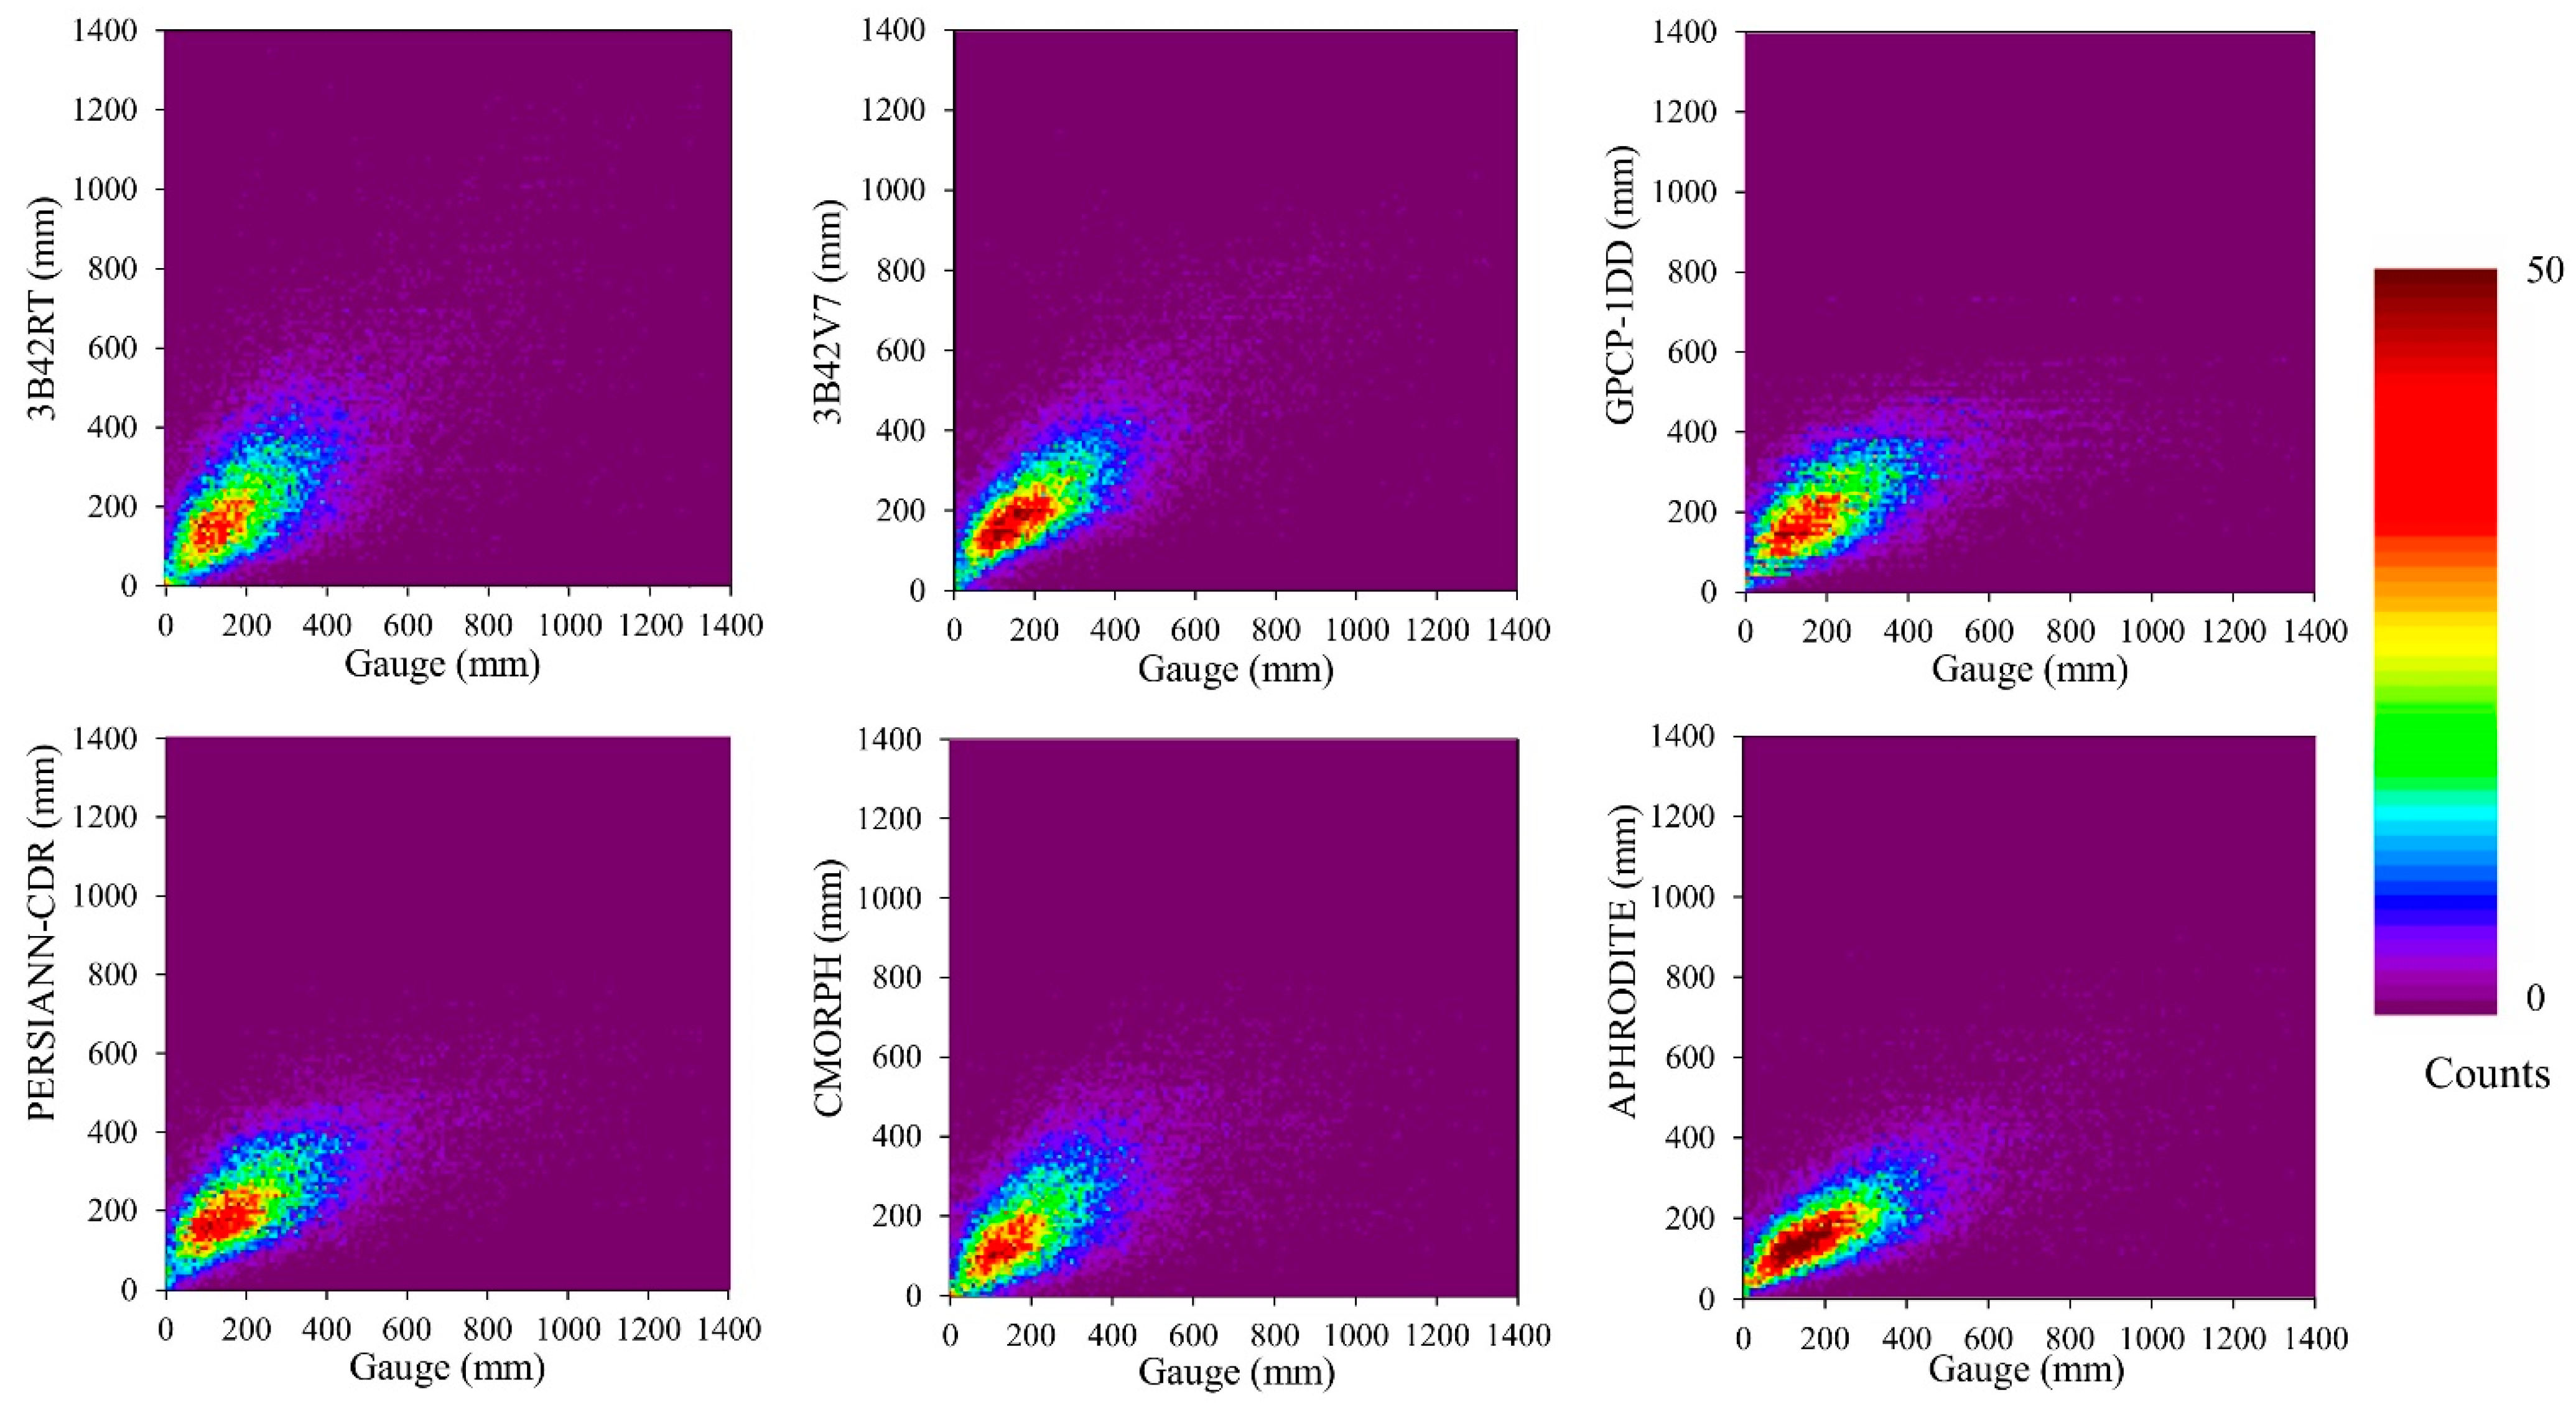
3.3. Evaluation of Monthly Precipitation

Overall, the selected SPPs performed better on the monthly time scale compared to the daily one, a known effect where the performance of SPPs improves substantially as the time scale increases. Lo Conti et al. [51] found, however, that the performance of SPPs tends to increase from one to five days and to remain stable at higher temporal aggregation. Estimations from all SPPs were significantly different from observations, at p < 0.05 (Table 3). A two-dimensional histogram of mean monthly precipitation between rain gauges and each precipitation product is shown in Figure 3. The best monthly precipitation estimates were obtained by using 3B42V7, with an R2 value of 0.56. This was consistent with the findings of Chiu et al. [52] using 3B42V6 over New Mexico over a period of four years. APHRODITE had the second highest R2 value (0.52), followed by the 3B42RT (R2 = 0.45), PERSIANN-CDR (R2 = 0.43), CMORPH (R2 = 0.4), and GPCP-1DD (R2 = 0.39) (Table 4).
CMORPH and GPCP-1DD showed poor performance, which was consistent with the findings of Jamandre and Narisma [48] in the Philippines. Such a poor accuracy of CMORPH and GPCP-1DD might come from the inability of these techniques to differentiate between radiative properties of the ocean and the land [53]. Most of the MW techniques rely indeed on high frequencies (≥85 GHz), which are more adapted to ice particle detection than to liquid water over a land area, thus explaining why MW satellites miss most of the warm and light precipitation events [54]. Moreover, the poor performance of GPCP-1DD might also be due to the inherently large spatial resolution (1° degree) of the product. In the case of CMORPH, high estimation errors can come from the absence of gauge calibration.
When looking at estimation errors by the best SPPs, we find that a slight overestimation of the observed monthly precipitations was observed for the 3B42RT (2%), 3B42V7 (4.7%), and PERSIANN-CDR (2.1%), while an underestimation occurred for the GPCP-1DD (2.8%). By contrast, dramatic underestimations occurred for CMORPH and APHRODITE: 13.2 and 19.7%, respectively. The significant underestimation by CMORPH might be due to a poor ability in estimating heavy rainfall (>10 mm/day), as shown in Section 3.7, which confirms previous observations [55]. With a RMSE of 111.53 mm/month, 3B42V7 was the best performing SPP for monthly precipitations over Malaysia, a finding agreeing with other previous studies reporting better performances of TRMM products [22].
Figure 3. Two-dimensional histogram of mean monthly precipitation between precipitation products with the rain gauges for the period 2003–2007.
Remotesensing 07 01504 g003

3.4. Evaluation of Daily Precipitation

All precipitation products exhibited low accuracies with respect to daily precipitation, as shown by significant differences between observations and estimations at p < 0.05 (Table 3). Estimations by CMORPH and TRMM exhibited, however, the best linear correlations with rain gauge data (R2 = 0.16 and 0.15, respectively) and were followed by APHRODITE (R2 = 0.12), PERSIANN-CDR (R2 = 0.11), and GPCP-1DD (R2 = 0.09). Besides exhibiting a relatively low R2 value, the APHRODITE presented (with 16.55 mm/day) the lowest RMSE, followed by the PERSIANN-CDR (16.68 mm/day), CMORPH (16.77 mm/day), GPCP-1DD (17.25 mm/day), 3B42RT (18.11 mm/day), and 3B42V7 (18.35 mm/day). By contrast, GPCP-1DD had the lowest R2 and the largest RMSE value. The poor performance of GPCP-1DD was expected, as this had previously been reported in other studies. For example, Feidas [56], using 76 rain gauges over Greece, found that the poorest performance occurred when using GPCP-1DD, with a bias and RMSE of 28.7% and 52.2%, respectively. Along the heavy-rainfall regions over India, Joshi et al. [57] found the average bias using GPCP-1DD to be −8.29 mm/day, which was bigger than when using TMPA (−8.03 mm/day). Moreover, McPhee and Margulis [58] reported that GPCP-1DD performed well over most of the contiguous United States, except for the humid northwest region with its average precipitation of over 3.47 mm/day. These authors concluded that GPCP-1DD had a poor ability to estimate heavy precipitation, which is common in tropical regions such as Malaysia.
With positive RB and ME values, 3B42RT, 3B42V7, and PERSIANN-CDR systematically overestimated observed daily precipitation. By contrast, the other three precipitation products systematically underestimated the observed daily precipitation, as indicated by negative RB and ME; for example, CMORPH underestimated daily precipitation by 13.2%. Similar results were reported by Derin and Yilmaz [13], where CMORPH showed significant precipitation underestimation over the western Black Sea region of Turkey compared to other SPPs. The origin of such underestimates might come partially from the complex topography in the study region, with the presence of orographic rain and the elevation ranging from 0 to more than 2000 m and up to 4046 m.a.s.l. over relatively short distances (Figure 1). The most likely hypothesis for explaining the estimation drifts is the inability of the IR sensor to properly consider warm cloud top temperatures and of the PMW sensor to detect warm orographic clouds without ice particles [59]. In addition, the low-orbit satellites are unable to monitor the rain intensities of a storm continuously [60]; this fact could also contribute to underestimation of the CMORPH.
Figure 4. Coefficient of determination (R2) of daily precipitation between rain gauges and (a) 3B42RT, (b) 3B42V7, (c) GPCP-1DD, (d) PERSIANN-CDR, (e) CMORPH and (f) APHRODITE over Malaysia.
Remotesensing 07 01504 g004

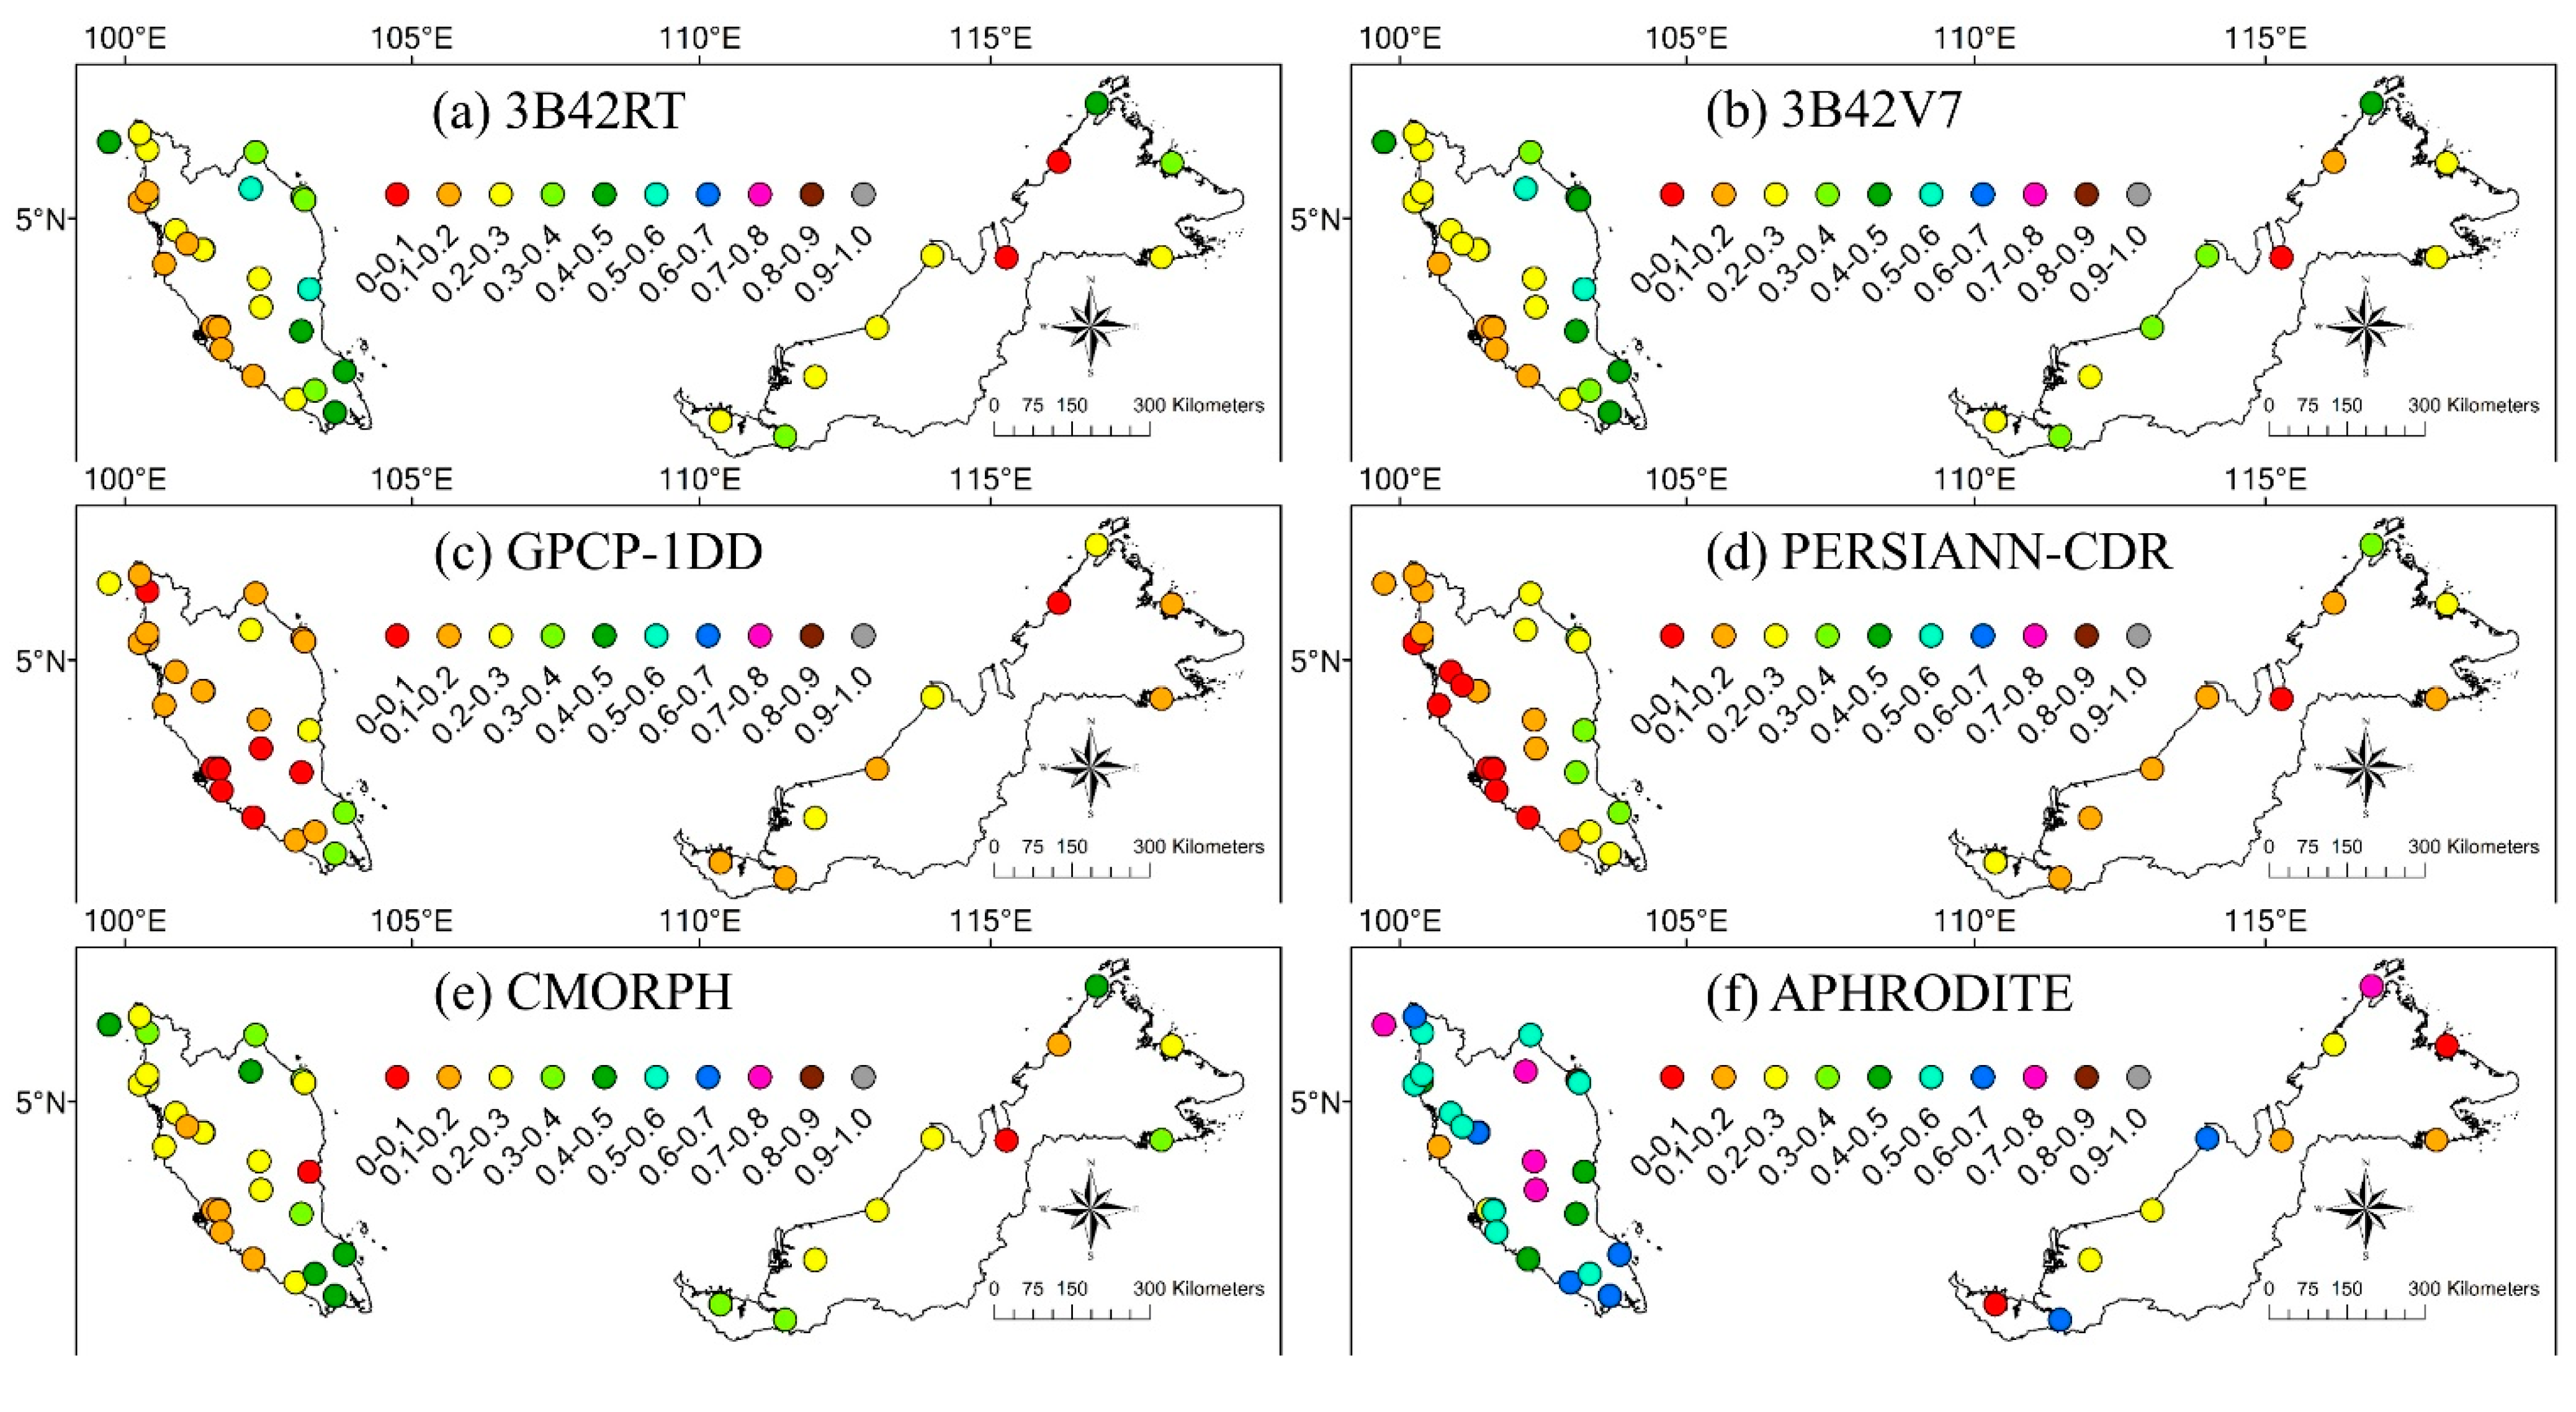
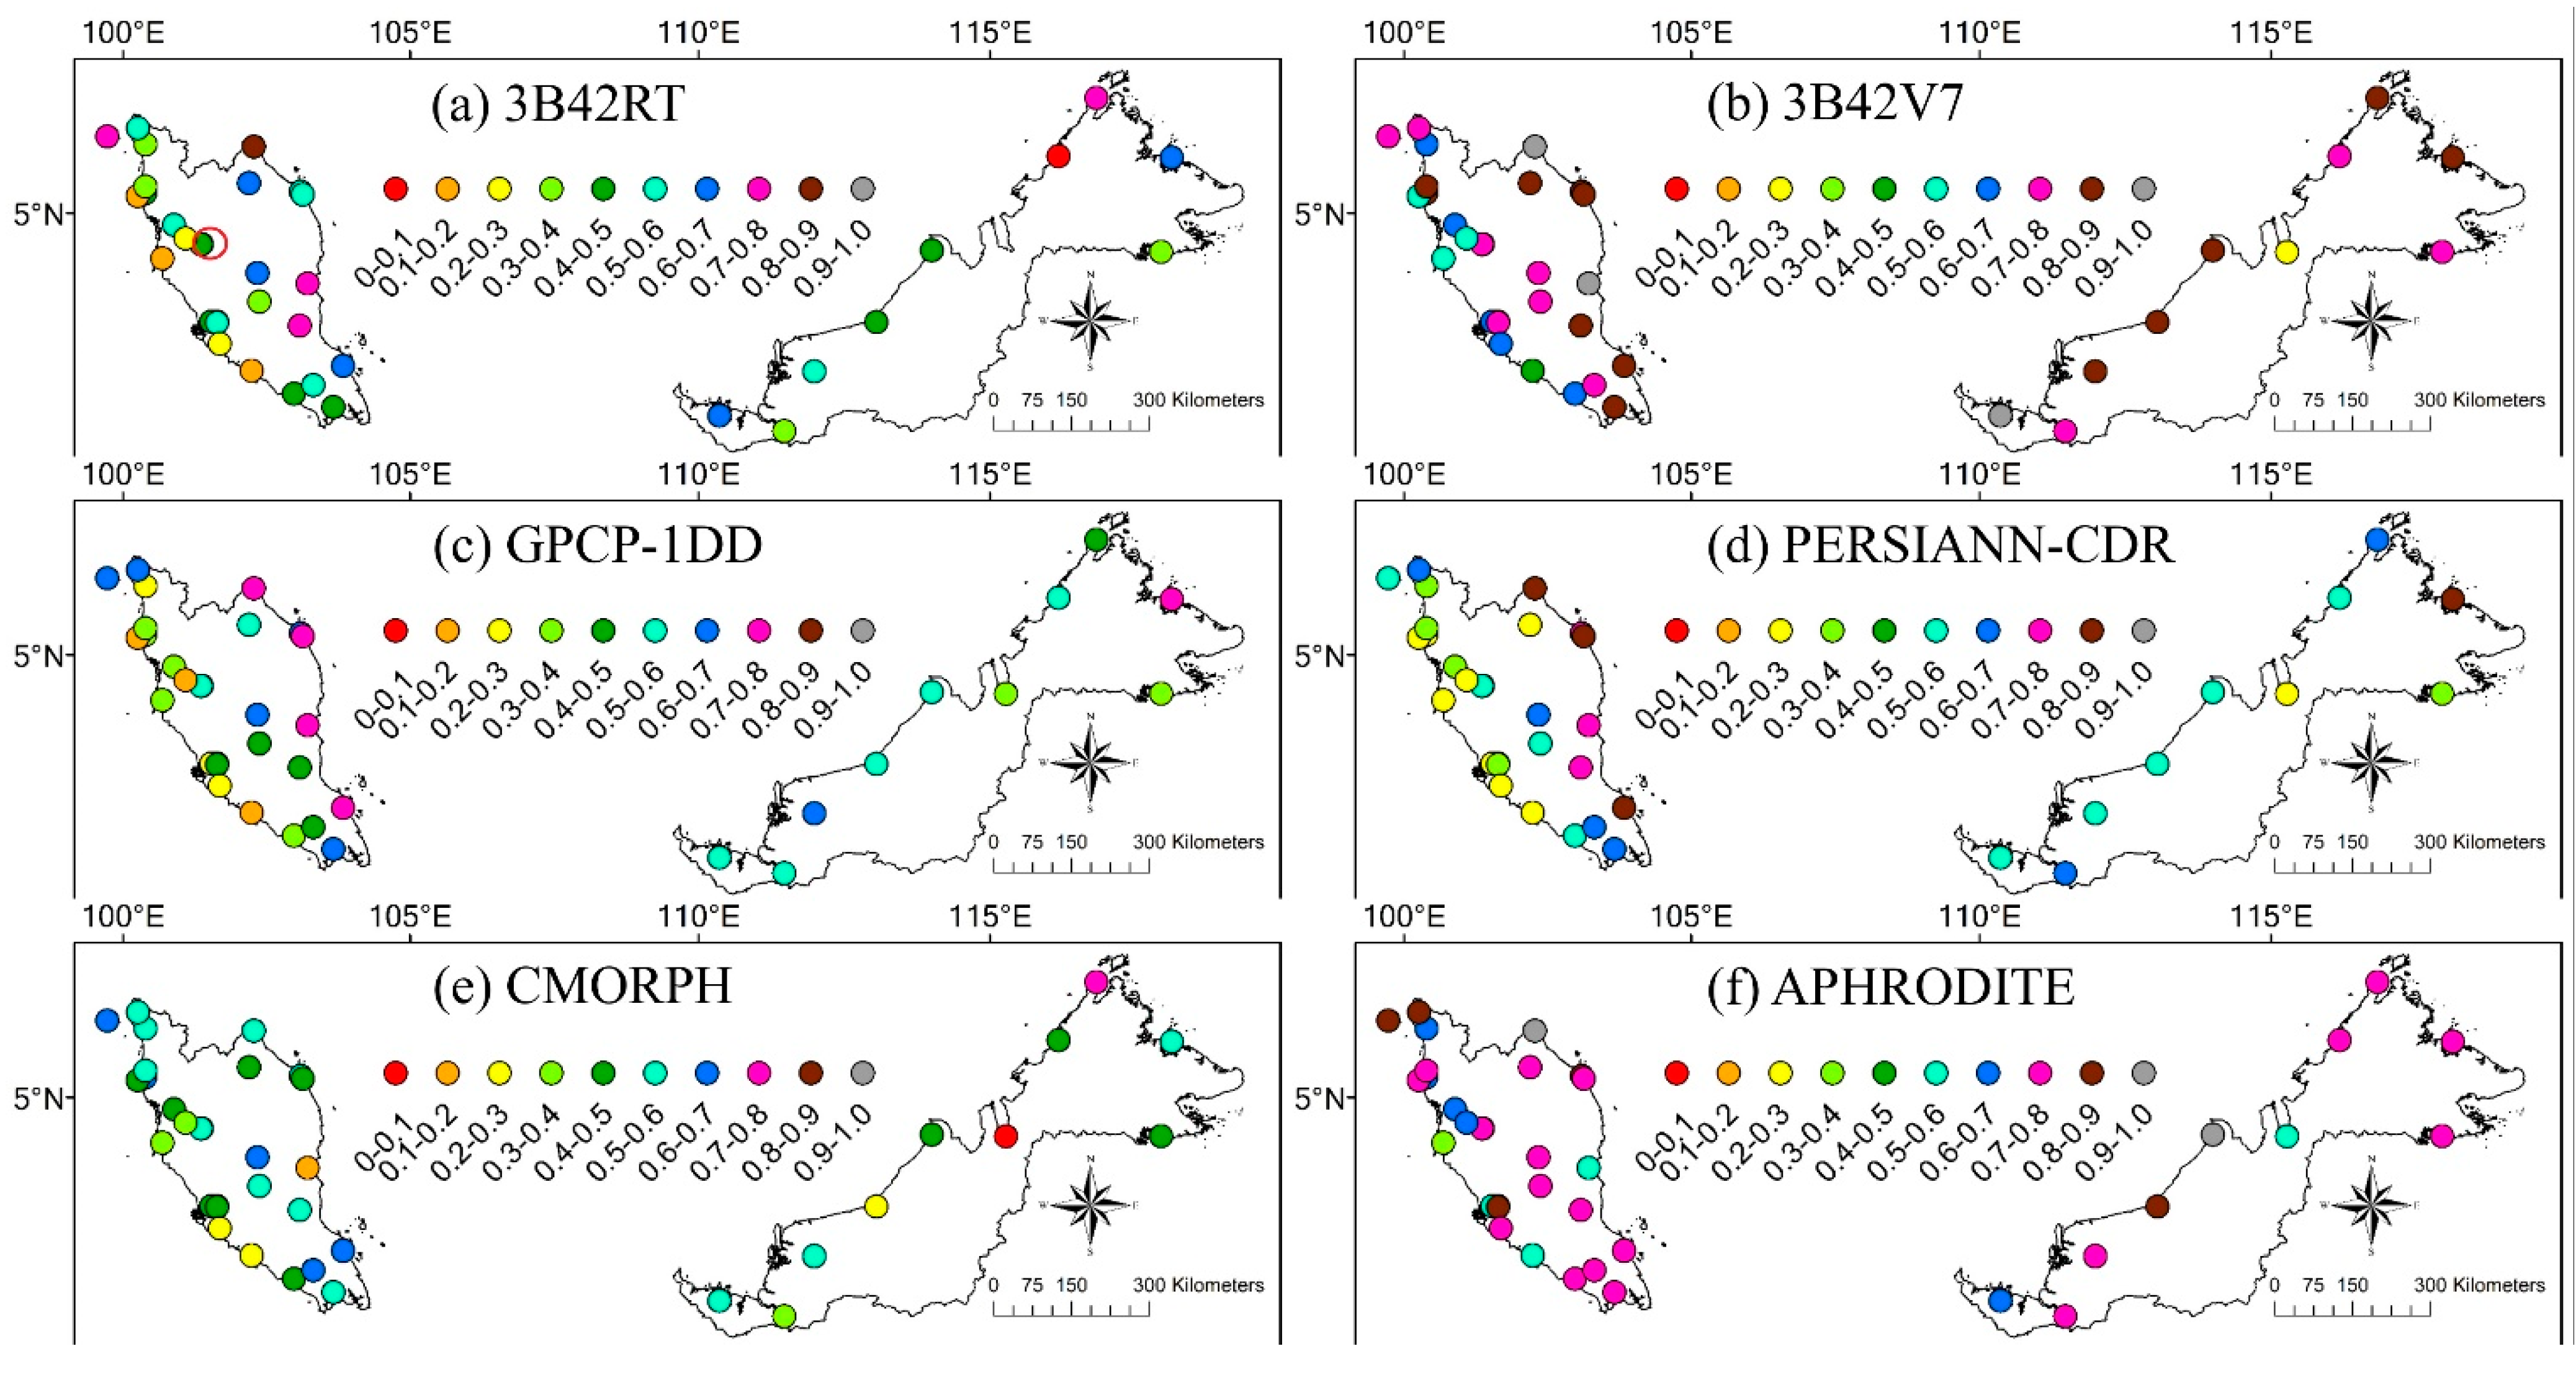
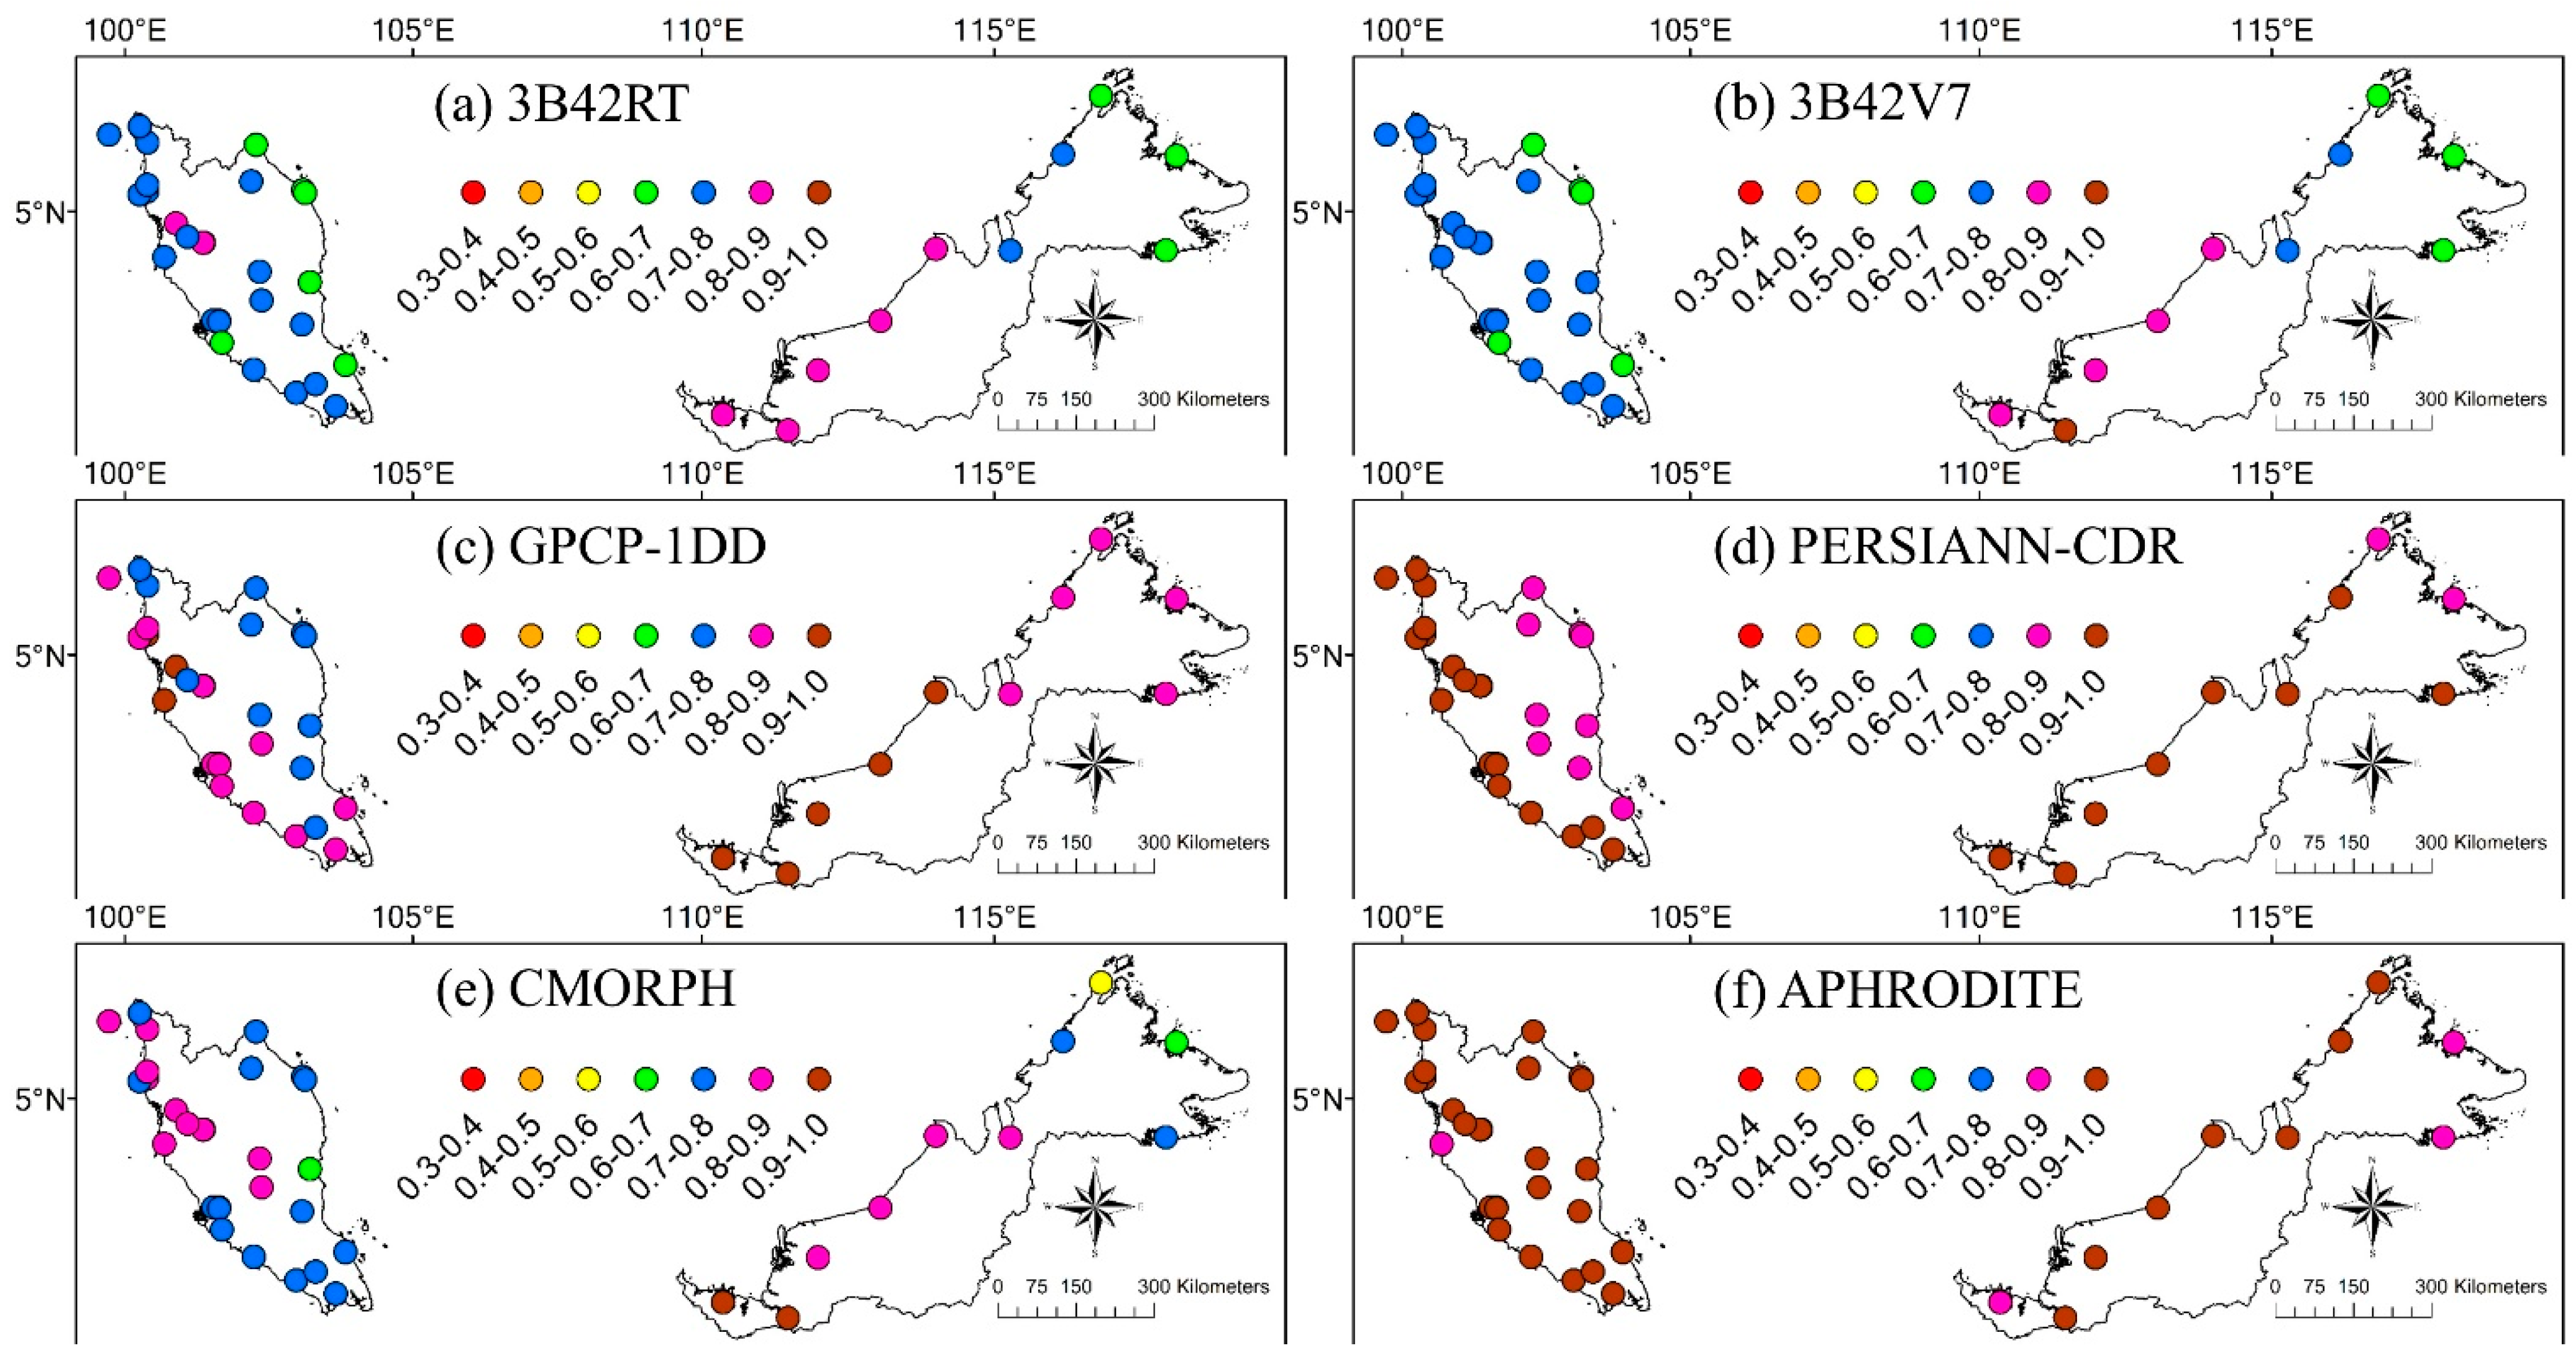
3.5. Spatial Variability Assessment

The estimation accuracy of the evaluated precipitation products over seven regions of Malaysia that differed in their precipitation regime and topography, with information on the spatial distribution of R2 for daily and monthly precipitation, is presented in Figure 4 and Figure 5, respectively. At the daily scale, 3B42V7 and APHRODITE were in best agreement with the rain gauges, with the highest R2 recorded of 0.57 (station 48616) and 0.82 (station 48618), respectively. At the monthly scale, good performance of R2 was found for 3B42V7 and APHRODITE, which varied from 0.3 to 0.94 and 0.3 to 0.91, respectively. Interestingly, the highest R2 values for all products were generally found in the eastern and southern PM and the northern EM, all characterized by high rainfall amounts because of the NEM. Similar findings, i.e., better SPP performance in wetter regions than dry ones, were previously reported by Khan et al. [45].
Figure 5. Coefficient of determination (R2) of monthly precipitation between rain gauges and (a) 3B42RT, (b) 3B42V7, (c) GPCP-1DD, (d) PERSIANN-CDR, (e) CMORPH and (f) APHRODITE over Malaysia (red circle in Figure 5a represents the locations of two mountainous stations).
Remotesensing 07 01504 g005
The poorest daily and monthly performance was observed in the western PM at low terrain. This finding contradicted previous studies [13,61], showing that SPPs are generally more reliable in smooth terrain compared to mountainous terrain. A possible reason for the trend observed in the present study is that the heavy rain brought in by the Southwest and Northeast monsoon is dramatically reduced by the Sumatra mainland and Titiwangsa Range before reaching the western PM. This indicated that SPPs have difficulty in estimating the convective precipitation that occurred during the inter-monsoon periods. Surprisingly, for two rain gauges (station 48631 and 48632) located in high mountainous regions, all precipitation products showed a moderate R2 value (0.48–0.83) for a monthly timescale. The fact that the SPPs could not achieve very good performances over mountainous regions might be due to the strong scattering of the microwave signal by mountains [35] and miss the discrimination of warm clouds by IR sensors that commonly appear on the top of mountainous regions [11].

3.6. Rain Detection Ability Assessment

The precipitation products under study showed an overall good performance with the PERSIANN-CDR showing the best performance with POD of 0.91, followed by the APHRODITE (POD = 0.88), GPCP-1DD (POD = 0.84), CMORPH (POD = 0.79), 3B42RT (POD = 0.76), and 3B42V7 (POD = 0.76) (Table 5). This result is similar to that found by Moazami et al. [62] over Iran, where PERSIANN had a POD value of 0.93. The APHRODITE showed a good performance, most likely because of the use of field observations from the local government agency, namely the Malaysia Meteorological Department (MMD), in the interpolation process. The regional POD analysis of precipitation products against 38 principal rain gauges is shown in Figure 6. The PERSIANN-CDR showed the best performance with POD ranging from 0.81 to 0.98. As seen in Figure 6, major SPPs obtained better PODs in the western PM and southern EM regions, but showed a poor POD value in the eastern PM. This is because the POD value was higher in drier regions and lower in wetter regions [63].
In general, the SPPs had high performance of ACC, with values ranging from 0.58 to 0.72. The capability of SPPs to correctly estimate overall rain and no-rain events was quite high, especially in the northern PM. TRMM products (3B42RT and 3B42V7) were marked by higher ACC values compared to the other products. The 3B42V7 showed the lowest FAR compared to other precipitation products by 0.41, indicating about 40% of estimated precipitation, but actually there is no rainfall from rain gauges. All precipitation products had a moderate CSI ranging from 0.46 to 0.49, indicating that about half of the precipitations were correctly estimated. The HSS analysis showed a moderate performance of SPPs on precipitation detection over Malaysia, although better HSS performance was found in the northern PM.
Table 5. Overall rain-detection capability of each precipitation product over Malaysia.
3B42RT3B42V7GPCP-1DDPERSIANN-CDRCMORPHAPHRODITE
ACC0.670.680.610.550.660.60
POD0.760.760.840.910.790.88
FAR0.420.410.480.520.430.49
CSI0.490.490.470.460.490.48
HSS0.360.360.270.190.350.25
Figure 6. The probability of detection (POD) of daily precipitation between rain gauges and (a) 3B42RT, (b) 3B42V7, (c) GPCP-1DD, (d) PERSIANN-CDR, (e) CMORPH and (f) APHRODITE over Malaysia.
Remotesensing 07 01504 g006

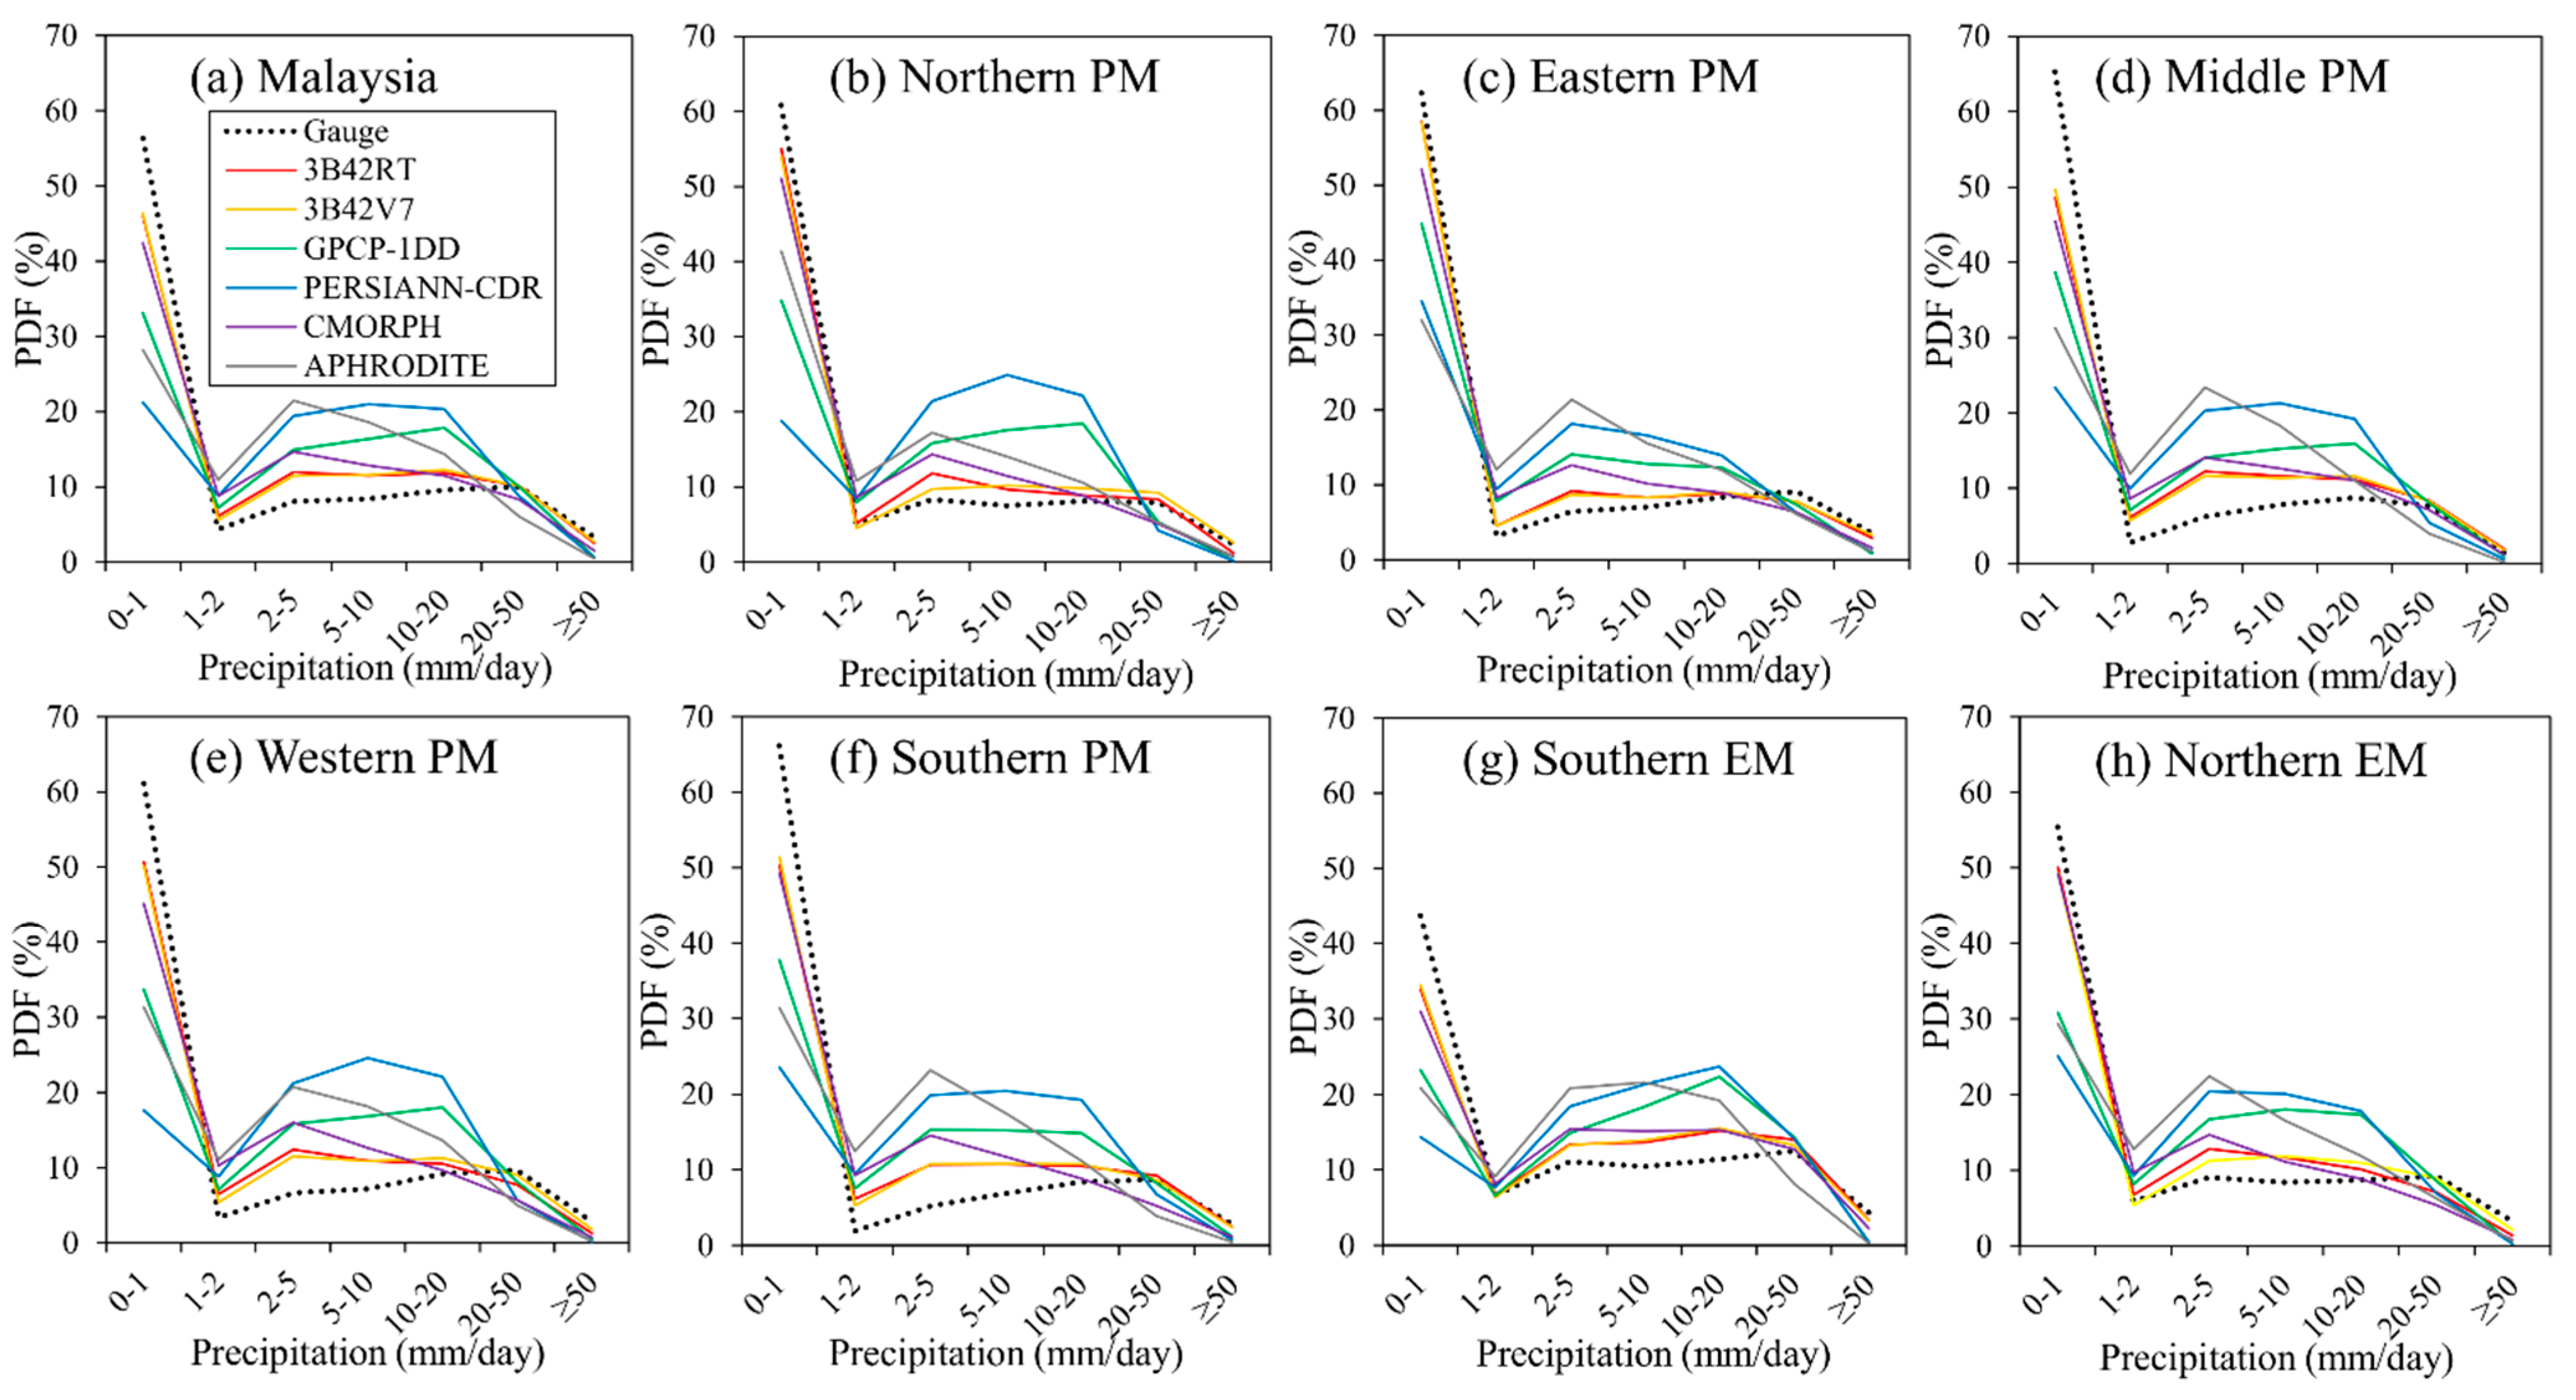
3.7. Rain Intensity Assessment

Figure 7 shows the probability distribution function (PDF) of rainfall intensity for the selected regions in Malaysia. Based on the 342 rain gauges, the occurrence of precipitation sharply decreased from 56.4% at 0–1 mm/day to 4.4% at 1–2 mm/day and reached a plateau from 8.1% to 10% at 2–50 mm/day, to subsequently decrease to 3.3% at ≥50 mm/day (Figure 7a). The 3B42V7 and 3B42RT showed slight underestimation in no/tiny rainfall (0–1 mm/day), by 17.7% and 18.3%, respectively, while the PERSIANN-CDR showed a dramatic underestimation of 62.3%. The underestimation of PERSIANN-CDR in the no/tiny rainfall class was also found over the contiguous United States [23]. The difference between precipitation products and gauge measurement in the no/tiny rainfall class was quite large. This differs from the findings of Li et al. [64], which evaluated TRMM 3B42 and PERSIANN performance at Poyang Lake Basin, China. The main reasons for such differences could be due to differences in climate and geographical conditions, the Poyang Lake Basin being relatively far from the ocean.
Figure 7. The occurrence probability distribution functions (PDF) of daily precipitation (2003–2007) aggregated from 342 rain gauges (a) over Malaysia as a whole and (bh) in different regions of Malaysia.
Remotesensing 07 01504 g007
The 3B42RT and 3B42V7 showed slight overestimation at 1–2 mm/day rain class, of 39.7% and 27.8%, respectively, while APHRODITE showed significant overestimation of 150.6%. All precipitation products showed overestimates at 2 to 20 mm/day, ranging from 20.2% to 166.1%. These overestimations at moderate daily rainfall intensity are consistent with other studies [45]. In addition, precipitation products showed large underestimation on the 0–1 mm/day rain amounts, whereas slightly underestimation was found at the ≥50 mm/day rainfall ones. As indicated by Figure 7, both 3B42RT and 3B42V7 showed good performance during high heavy and violent rains, most likely because of the high signal-to-noise ratio of PMW-based precipitation sensors [61]. Accurate estimates of high daily precipitation amounts are vital for flood analysis, and therefore the 3B42RT and 3B42V7 products are suitable for this purpose over Malaysia.

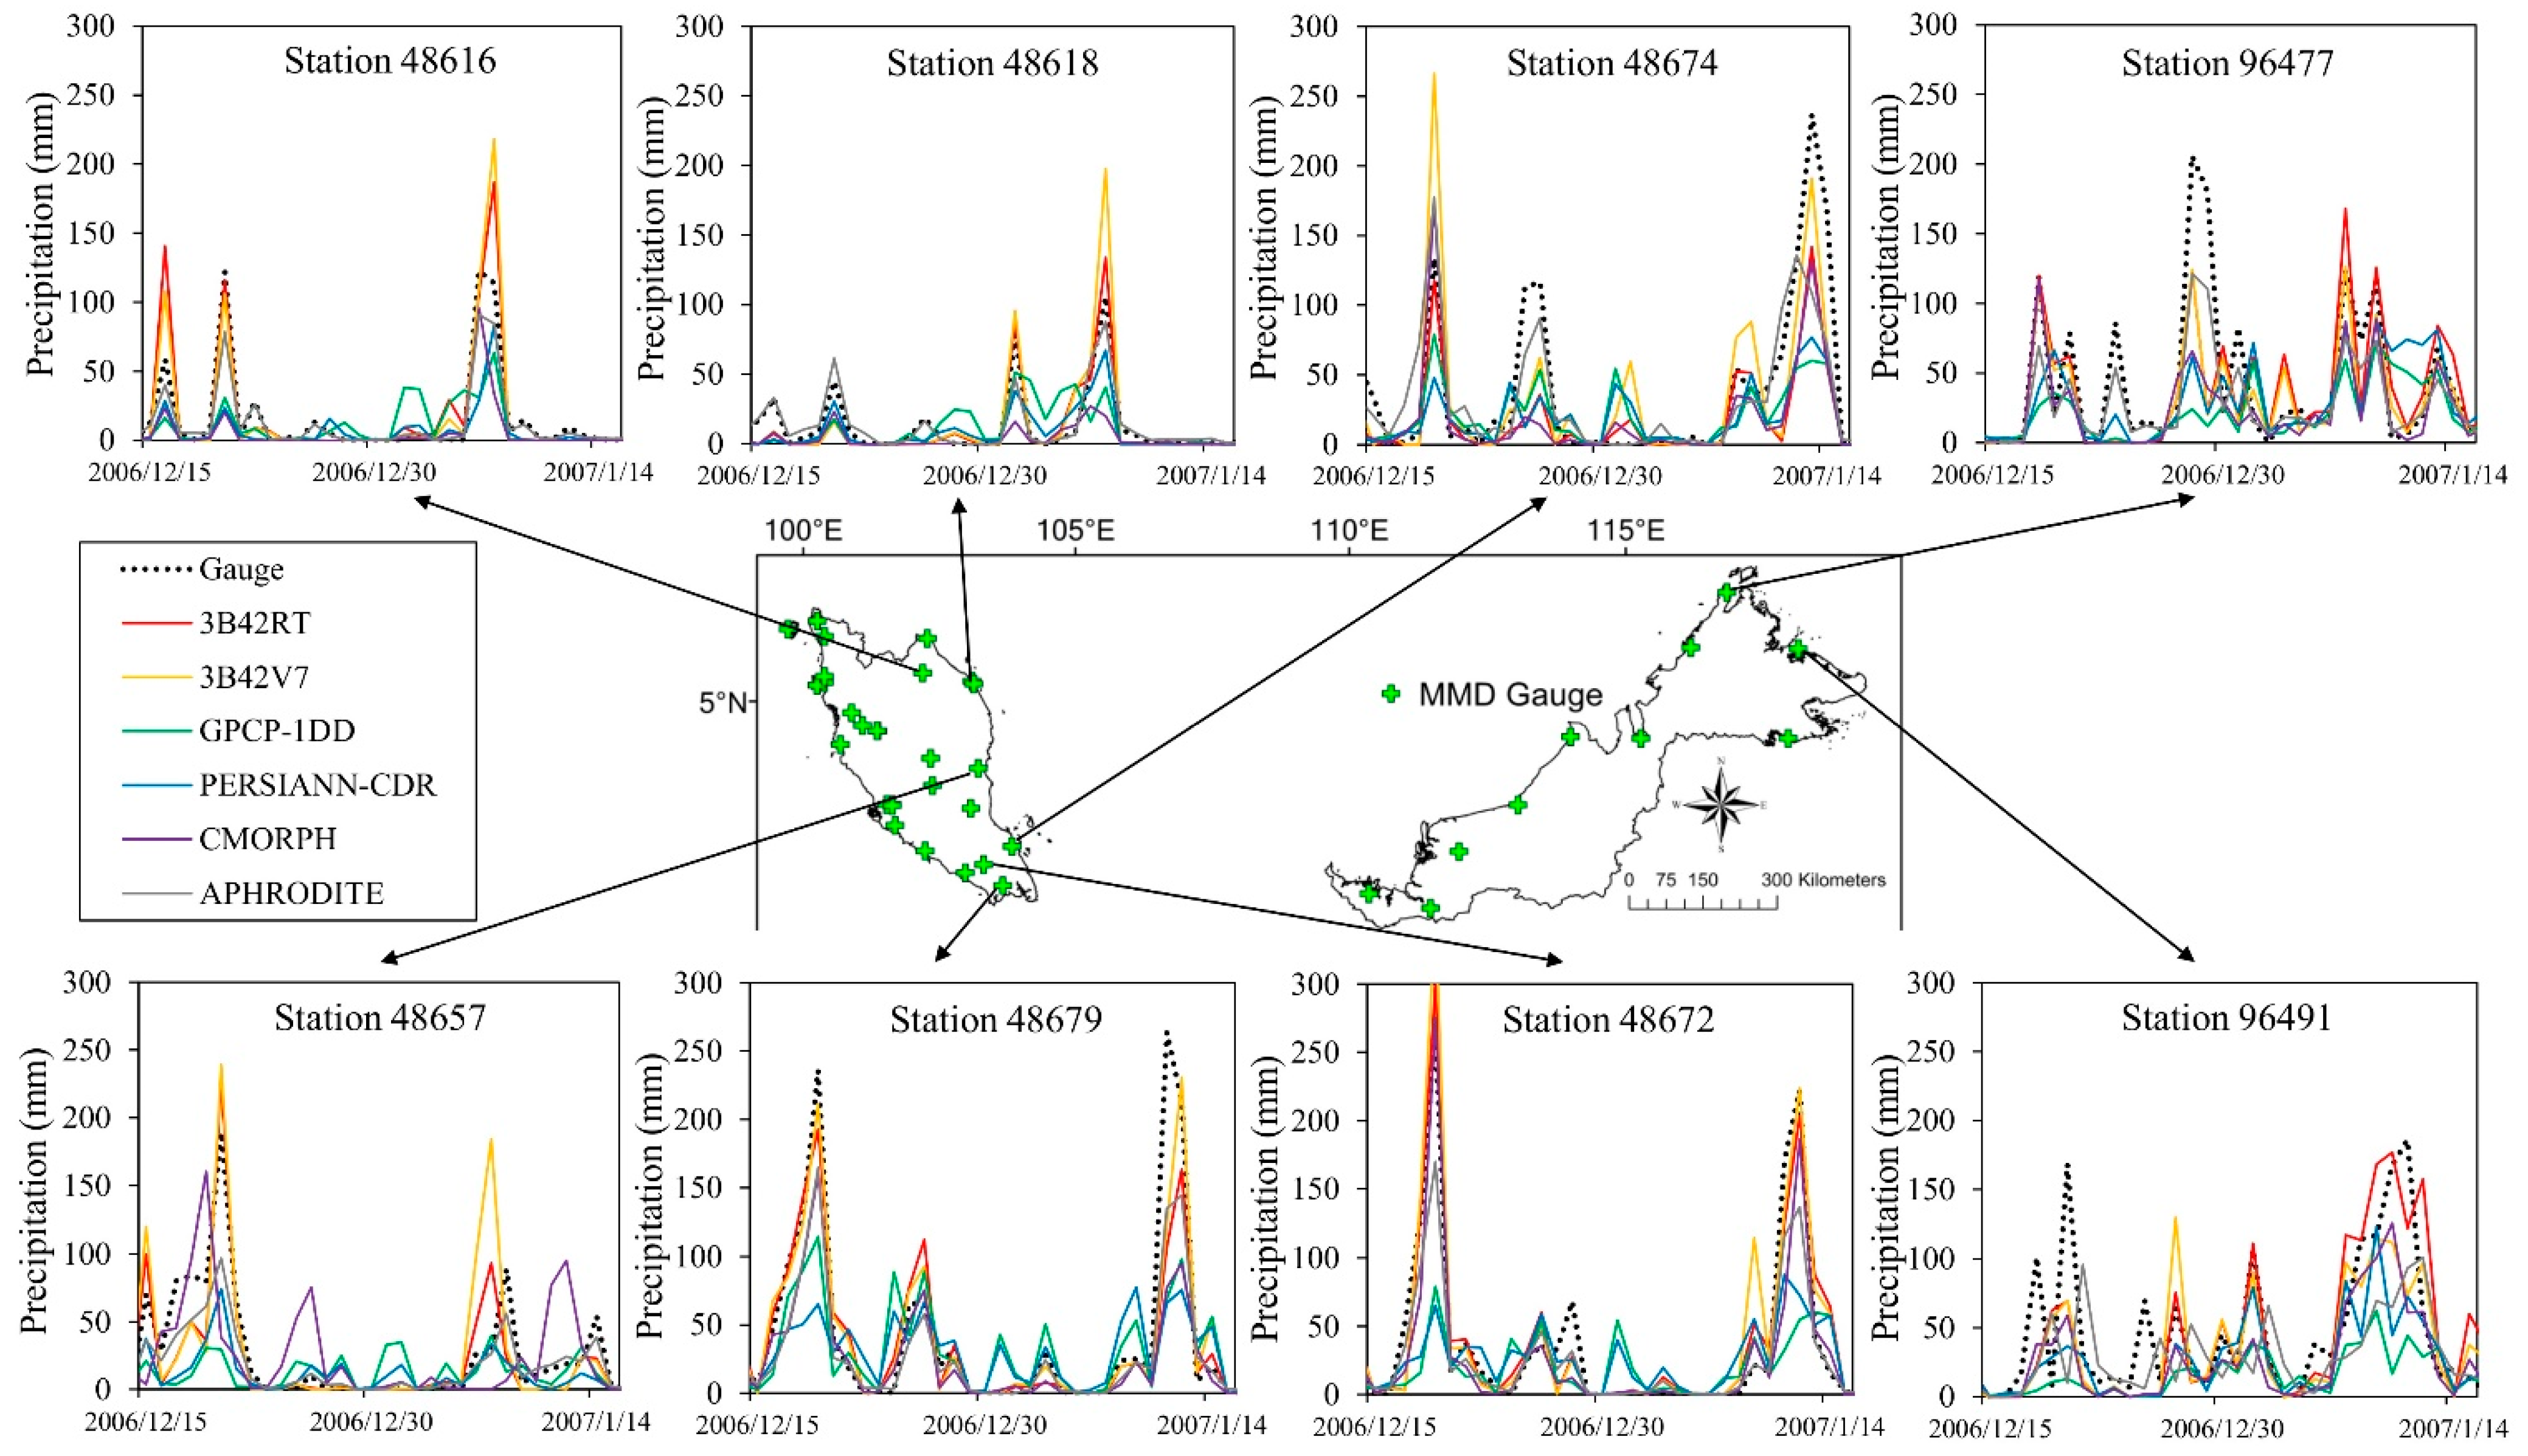
3.8. 2006/2007 Flood Event Assessment

The 2006/07 flood was caused by three violent precipitation events on (1) 17–20 December 2006; (2) 24–28 December 2006; and (3) 11–14 January 2007. These violent precipitation events were brought about by the strong northeasterly winds that interacted with the Madden–Julian Oscillation [19]. The highest total amount of rain during these 13 rainy days was recorded at station 48679 as 1187 mm, with a maximum amount of 264 mm on 11 January 2007. The capability of the different SPPs was assessed from 1 December 2006 to 31 January 2007 and for eight rain gauges, which received a daily rainfall amount of more than 100 mm/day (Table 6).
Table 6. Statistical analysis of SPPs versus rain gauges for the 2006/07 flood event at highly affected regions from December 2006 to January 2007.
ID3B42RT3B42V7GPCP-1DDPERSIANN-CDRCMORPHAPHRODITE
48616RMSE (mm)16.5716.7022.3719.3018.628.43
R20.790.800.280.630.650.98
RB (%)13.737.60−19.48−59.68−62.19−15.59
48618RMSE (mm)14.1019.1718.9214.1417.556.91
R20.740.740.270.580.490.92
RB (%)−4.2911.76−24.26−22.71−58.86−4.26
48657RMSE (mm)19.5528.8831.9125.8533.2716.08
R20.700.530.090.580.180.94
RB (%)−22.09−7.11−45.87−48.44−10.09−24.39
48672RMSE (mm)18.1422.3842.8439.1420.1619.66
R20.880.860.330.470.850.98
RB (%)9.1112.97−36.95−16.99−21.91−23.36
48674RMSE (mm)30.7633.5435.6736.4931.1425.58
R20.650.540.570.550.640.70
RB (%)−41.17−2.54−41.46−44.11−47.70−9.37
48679RMSE (mm)27.1824.2539.7944.6233.7124.18
R20.770.810.510.390.770.95
RB (%)−7.67−4.46−19.07−18.62−38.68−30.12
96477RMSE (mm)31.9830.2141.0537.7531.8419.37
R20.490.540.180.270.580.99
RB (%)−10.49−27.62−45.27−22.57−47.16−25.99
96491RMSE (mm)30.2031.0841.9434.5429.6339.87
R20.590.520.340.460.670.22
RB (%)−5.62−21.49−63.62−39.33−44.17−31.11
The temporal evolution of the observed and estimated daily precipitation from December 2006 to January 2007 is shown in Figure 8. Most of the products performed well over the period under study, with the best performances occurring in southern PM, where most of the intense precipitation occurred. For example, the daily precipitation R2 validation of the 3B42V7 for the station 48616 improved from 0.57 for the entire period (January 2003 to December 2007) to 0.8 for the 2006/2007 flood event (December 2006 to January 2007). This result is similar to that of Khan et al. [45], where R2 increased from 0.5 (2005 to 2010) to 0.7 (2010 flood period). Overall, for the different regions and throughout the study duration, APHRODITE, 3B42RT, and 3B42V7 showed the best performance, as suggested by higher R2 and lower RB values (Table 6).
Figure 8. Comparison of daily precipitation series between precipitation products and selected rain gauges (highly affected area) for the 2006/2007 flood event.
Remotesensing 07 01504 g008
A systematic underestimation of the highest daily volumes occurred for most of the SPPs, except TRMM. GPCP-1DD and CMORPH performed the worst, with underestimations up to 60% (Table 6). This might be due to the SPPs’ weakness for point-to-grid comparisons, because SPPs provide area rainfall (grid cell) while rain gauges provide point-based rainfall [60]. With a maximum R2 of 0.86 and 0.88, respectively, the 3B42RT and 3B42V7 appeared to have the best potential for analyzing abnormal precipitation events over Malaysia. Moreover, our results are in agreement with the findings of Varikoden et al. [21], who evaluated the performance of previous version (V6) TRMM products at four rain gauges over south, east, west and highland areas of PM with R2 ranging from 0.63 to 0.96, but better performances of version 7 than version 6 had been previously reported [65]. Our findings confirm that the 3B42V7 and 3B42RT are reliable and suitable for heavy precipitation estimation and monitoring (3B42RT is a real-time product) in Malaysia.

4. Conclusions

Nowadays, satellite precipitation products (SPPs) are widely applied in meteorology, hydrology, and ecology research fields. In this study of six major precipitation products, namely 3B42RT, 3B42V7, GPCP-1DD, PERSIANN-CDR, CMORPH, and APHRODITE, our objective was to evaluate their ability to accurately assess the daily, monthly, seasonal, and annual rainfalls over Malaysia. The main conclusions obtained by using 342 rain gauges surveyed during 2003–2007 are as follows:
(1)
There was a tendency for 3B42V7 and APHRODITE to yield accurate and unbiased estimations and for GPCP-1D to perform the worst. In addition, while APHRODITE and CMORPH dramatically underestimated precipitation, GPCP-1DD exhibited slight underestimations and 3B42RT, 3B42V7, and PERSIANN-CDR showed slight overestimations. TRMM products (3B42RT and 3B42V7) showed better estimation of seasonal precipitation. The SPPs performed better in the northeast monsoon than in the southwest monsoon.
(2)
The SPPs’ performance was the best in the regions receiving higher annual precipitation, such as eastern and southern Peninsular Malaysia and northern East Malaysia. By contrast, poor SPP performance occurred over western Peninsular Malaysia, which is characterized by low rainfall amounts since it is sheltered from the monsoons by the Titiwangsa Range and Sumatra.
(3)
In terms of rain-detection ability, the precipitation products had a high accuracy (ACC) and probability of detection (POD) performance and moderate false alarm ratio (FAR), critical success index (CSI), and Heidke skill score (HSS) performance. PERSIANN-CDR received the highest POD value, but its HSS value was also the lowest in all six products. Overall, 3B42RT and 3B42V7 performed better in rain-detection ability as they had better ACC, CSI, FAR, and HSS values.
(4)
Most of the SPPs showed best performance during flood events, but had the tendency to underestimate the tiny to heavy rain amount (rain < 1 mm/day; rain ≥ 20 mm/day) and to overestimate the moderate ones (1 ≤ rain < 20 mm/day). This was with the exception of 3B42RT and 3B42V7, which were accurate across the whole range of event sizes.
These results demonstrate the large discrepancies in the quality of available precipitation products for daily to monthly time scales. The spatial-temporal assessment of the products performed in the present study allowed us to identify some of the sources of errors such as the effect of various sensors, topography, and the retrieval algorithm [66,67]. Future studies should evaluate whether SPPs could provide reliable enough input information to hydrological models for simulating water movements and floods in river basins over Malaysia. Besides that, the TRMM products could be used through hydrological modeling [68] to analyze the causes of the flood events that hit Malaysia recently (December 2006 to January 2007; December 2014 to January 2015), the latter of which has affected more than 230,000 people, killing 23 and costing $560 million.

Supplementary Files

Supplementary File 1Supplementary File 2

Acknowledgments

We gratefully acknowledge the Ministry of Higher Education (MOHE) Malaysia and Universiti Teknologi Malaysia (UTM) for the financial support (VOT No. R.J130000.7827.4F213). We acknowledge the Malaysia Meteorological Department and Department of Irrigation and Drainage Malaysia for providing the daily precipitation data. Special thanks to the original producers of all six evaluated precipitation products for providing free downloadable precipitation products. We would also like to thank LiangWei Wong and LeeSiang Tan for their assistance in gauges data pre-processing. Finally, special thanks to the four anonymous reviewers and the two editors for their valuable comments, which helped to improve the quality of the manuscript.

Author Contributions

MouLeong Tan and Ab Latif Ibrahim conceived and designed the framework of the study. MouLeong Tan completed the data collection, processing and analysis, and led the manuscript writing with contributions by Zheng Duan, Arthur P Cracknell and Vincent Chaplot.

Conflicts of Interest

The authors declare no conflict of interest.

References

  1. Kidd, C.; Levizzani, V. Status of satellite precipitation retrievals. Hydrol. Earth Syst. Sci. 2011, 15, 1109–1116. [Google Scholar] [CrossRef]
  2. Larson, L.W.; Peck, E.L. Accuracy of precipitation measurements for hydrologic modeling. Water Resour. Res. 1974, 10, 857–863. [Google Scholar] [CrossRef]
  3. Strauch, M.; Bernhofer, C.; Koide, S.; Volk, M.; Lorz, C.; Makeschin, F. Using precipitation data ensemble for uncertainty analysis in SWAT streamflow simulation. J. Hydrol. 2012, 414–415, 413–424. [Google Scholar] [CrossRef]
  4. Bitew, M.M.; Gebremichael, M. Evaluation of satellite rainfall products through hydrologic simulation in a fully distributed hydrologic model. Water Resour. Res. 2011, 47, W06526. [Google Scholar] [CrossRef]
  5. Yong, B.; Ren, L.L.; Hong, Y.; Wang, J.H.; Gourley, J.J.; Jiang, S.H.; Chen, X.; Wang, W. Hydrologic evaluation of Multisatellite Precipitation Analysis standard precipitation products in basins beyond its inclined latitude band: A case study in Laohahe basin, China. Water Resour. Res. 2010, 46, W07542. [Google Scholar] [CrossRef]
  6. Wu, H.; Adler, R.F.; Hong, Y.; Tian, Y.; Policelli, F. Evaluation of global flood detection using satellite-based rainfall and a hydrologic model. J. Hydrometeorol. 2012, 13, 1268–1284. [Google Scholar] [CrossRef]
  7. Tapiador, F.J.; Turk, F.J.; Petersen, W.; Hou, A.Y.; García-Ortega, E.; Machado, L.A.T.; Angelis, C.F.; Salio, P.; Kidd, C.; Huffman, G.J.; Castro, M.D. Global precipitation measurement: Methods, datasets and applications. Atmos. Res. 2012, 104–105, 70–97. [Google Scholar] [CrossRef]
  8. Stokstad, E. Hydrology—Scarcity of rain, stream gages threatens forecasts. Science 1999, 285, 1199–1200. [Google Scholar] [CrossRef]
  9. Pan, X.; Li, X.; Yang, K.; He, J.; Zhang, Y.; Han, X. Comparison of downscaled precipitation data over a mountainous watershed: A case study in the Heihe River Basin. J. Hydrometeorol. 2014, 15, 1560–1574. [Google Scholar] [CrossRef]
  10. Barrett, E.C. Precipitation measurement by satellites: Towards community algorithms. Adv. Space Res. 1993, 13, 119–136. [Google Scholar] [CrossRef]
  11. Yilmaz, K.K.; Hogue, T.S.; Hsu, K.L.; Sorooshian, S.; Gupta, H.V.; Wagener, T. Intercomparison of rain gauge, radar, and satellite-based precipitation estimates with emphasis on hydrologic forecasting. J. Hydrometeorol. 2005, 6, 497–517. [Google Scholar] [CrossRef]
  12. Krakauer, N.; Pradhanang, S.; Lakhankar, T.; Jha, A. Evaluating satellite products for precipitation estimation in mountain regions: A case study for Nepal. Remote Sens. 2013, 5, 4107–4123. [Google Scholar] [CrossRef]
  13. Derin, Y.; Yilmaz, K.K. Evaluation of multiple satellite-based precipitation products over complex topography. J. Hydrometeorol. 2014, 15, 1498–1516. [Google Scholar] [CrossRef]
  14. Hu, Q.; Yang, D.; Li, Z.; Mishra, A.K.; Wang, Y.; Yang, H. Multi-scale evaluation of six high-resolution satellite monthly rainfall estimates over a humid region in China with dense rain gauges. Int. J. Remote Sens. 2014, 35, 1272–1294. [Google Scholar] [CrossRef]
  15. Shen, Y.; Xiong, A.Y.; Wang, Y.; Xie, P.P. Performance of high-resolution satellite precipitation products over China. J. Geophys. Res.: Atmos. 2010, 115, D02114. [Google Scholar]
  16. Vernimmen, R.R.E.; Hooijer, A.; Aldrian, M.E.; van Dijk, A. Evaluation and bias correction of satellite rainfall data for drought monitoring in Indonesia. Hydrol. Earth Syst. Sci. 2012, 16, 133–146. [Google Scholar] [CrossRef]
  17. Yong, B.; Liu, D.; Gourley, J.J.; Tian, Y.; Huffman, G.J.; Ren, L.; Hong, Y. Global view of real-time TRMM Multi-satellite Precipitation Analysis: Implication to its successor Global Precipitation Measurement mission. Bull. Am. Meteorol. Soc. 2014. [Google Scholar] [CrossRef]
  18. Carr, M.K.V. The water relations and irrigation requirements of oil palm (Elaeis guineensis): A review. Exp. Agric. 2011, 47, 629–652. [Google Scholar] [CrossRef]
  19. Tangang, F.T.; Juneng, L.; Salimun, E.; Vinayachandran, P.N.; Seng, Y.K.; Reason, C.J.C.; Behera, S.K.; Yasunari, T. On the roles of the northeast cold surge, the Borneo vortex, the Madden-Julian Oscillation, and the Indian Ocean Dipole during the extreme 2006/2007 flood in southern Peninsular Malaysia. Geophys. Res. Lett. 2008, 35, L14807. [Google Scholar] [CrossRef]
  20. Tan, M.L.; Ibrahim, A.L.; Yusop, Z.; Duan, Z.; Ling, L. Impacts of land-use and climate variability on hydrological components in the Johor River Basin, Malaysia. Hydrol. Sci. J. 2014. [Google Scholar] [CrossRef]
  21. Varikoden, H.; Samah, A.A.; Babu, C.A. Spatial and temporal characteristics of rain intensity in the Peninsular Malaysia using TRMM rain rate. J. Hydrol. 2010, 387, 312–319. [Google Scholar] [CrossRef]
  22. Semire, F.A.; Mohd-Mokhtar, R.; Ismail, W.; Mohamad, N.; Mandeep, J.S. Ground validation of space-borne satellite rainfall products in Malaysia. Adv. Space Res. 2012, 50, 1241–1249. [Google Scholar] [CrossRef]
  23. Ashouri, H.; Hsu, K.-L.; Sorooshian, S.; Braithwaite, D.K.; Knapp, K.R.; Cecil, L.D.; Nelson, B.R.; Prat, O.P. PERSIANN-CDR: Daily precipitation climate data record from multi-satellite observations for hydrological and climate studies. Bull. Am. Meteorol. Soc. 2014. [Google Scholar] [CrossRef]
  24. Tangang, F.T.; Juneng, L.; Salimun, E.; Sei, K.M.; Le, L.J.; Muhamad, H. Climate change and variability over Malaysia: Gaps in science and research information. Sains Malays. 2012, 41, 1355–1366. [Google Scholar]
  25. Tan, M.L.; Ficklin, D.L.; Ibrahim, A.L.; Yusop, Z. Impacts and uncertainties of climate change on streamflow of the Johor River Basin, Malaysia using a CMIP5 General Circulation Model ensemble. J. Water Clim. Ch. 2014, 5, 676–695. [Google Scholar] [CrossRef]
  26. Suhaila, J.; Jemain, A.A. Investigating the impacts of adjoining wet days on the distribution of daily rainfall amounts in Peninsular Malaysia. J. Hydrol. 2009, 368, 17–25. [Google Scholar] [CrossRef]
  27. Huffman, G.J.; Bolvin, D.T. TRMM and Other Data Precipitation Data Set Documentation; NASA: Washington, DC, USA, 2014. [Google Scholar]
  28. Yatagai, A.; Kamiguchi, K.; Arakawa, O.; Hamada, A.; Yasutomi, N.; Kitoh, A. APHRODITE constructing a long-term daily gridded precipitation dataset for Asia based on a dense network of rain gauges. Bull. Am. Meteorol. Soc. 2012, 93, 1401–1415. [Google Scholar] [CrossRef]
  29. Schneider, U.; Becker, A.; Meyer-Christoffer, A.; Ziese, M.; Rudolf, B. DWD: Offenbach, Germany, 2011. Available online: http://gpcc.dwd.de/ (accessed on 25 November 2014).
  30. Becker, A.; Schneider, U.; Meyer-Christoffer, A.; Ziese, M.; Finger, P.; Stender, P.; Heller, A.; Breidenbach, J.N. GPCC Report for Years 2009 and 2010; DWD: Offenbach, Germany, 2011. Available online: http://gpcc.dwd.de/ (accessed on 25 November 2014).
  31. Fuchs, T.; Schneider, U.; Meyer-Christoffer, A.; Finger, P.; Breidenbach, J.N.; Heller, A.; Stender, P.; Rudolf, B. GPCC Annual Report for Year 2008; DWD: Offenbach, Germany, 2009. Available online: http://gpcc.dwd.de/ (accessed on 25 November 2014).
  32. Fuchs, T.; Schneider, U.; Meyer-Christoffer, A.; Finger, P.; Breidenbach, J.N.; Heller, A.; Stender, P. GPCC Annual Report for Year 2007; DWD: Offenbach, Germany, 2008. Available online: http://gpcc.dwd.de/ (accessed on 25 November 2014).
  33. Kurtzman, D.; Navon, S.; Morin, E. Improving interpolation of daily precipitation for hydrologic modelling: Spatial patterns of preferred interpolators. Hydrol. Process. 2009, 23, 3281–3291. [Google Scholar] [CrossRef]
  34. Chaplot, V.; Darboux, F.; Bourennane, H.; Leguédois, S.; Silvera, N.; Phachomphon, K. Accuracy of interpolation techniques for the derivation of digital elevation models in relation to landform types and data density. Geomorphology 2006, 77, 126–141. [Google Scholar] [CrossRef]
  35. Huffman, G.J.; Adler, R.F.; Bolvin, D.T.; Gu, G.J.; Nelkin, E.J.; Bowman, K.P.; Hong, Y.; Stocker, E.F.; Wolff, D.B. The TRMM multisatellite precipitation analysis (TMPA): Quasi-global, multiyear, combined-sensor precipitation estimates at fine scales. J. Hydrometeorol. 2007, 8, 38–55. [Google Scholar] [CrossRef]
  36. Xue, X.W.; Hong, Y.; Limaye, A.S.; Gourley, J.J.; Huffman, G.J.; Khan, S.I.; Dorji, C.; Chen, S. Statistical and hydrological evaluation of TRMM-based Multi-satellite Precipitation Analysis over the Wangchu Basin of Bhutan: Are the latest satellite precipitation products 3B42V7 ready for use in ungauged basins? J. Hydrol. 2013, 499, 91–99. [Google Scholar] [CrossRef]
  37. Acker, J.G.; Leptoukh, G. Online analysis enhances use of NASA Earth science data. Eos, Trans. Amer. Geophys. Union 2007, 88, 14–17. [Google Scholar] [CrossRef]
  38. Huffman, G.J.; Adler, R.F.; Morrissey, M.M.; Bolvin, D.T.; Curtis, S.; Joyce, R.; McGavock, B.; Susskind, J. Global precipitation at one-degree daily resolution from multisatellite observations. J. Hydrometeorol. 2001, 2, 36–50. [Google Scholar] [CrossRef]
  39. Huffman, G.J.; Bolvin, D.T.; Adler, R.F. Last Updated 2012: GPCP Version 1.2 1-Degree Daily (1DD) Precipitation Data Set; WDC-A, NCDC: Asheville, NC, USA, 2012. Available online: ftp://ftp.cgd.ucar.edu/archive/PRECIP/ (accessed on 3 July 2014).
  40. Hsu, K.L.; Gao, X.G.; Sorooshian, S.; Gupta, H.V. Precipitation estimation from remotely sensed information using artificial neural networks. J. Appl. Meteorol. 1997, 36, 1176–1190. [Google Scholar] [CrossRef]
  41. Sorooshian, S.; Hsu, K.; Braithwaite, D.; Ashouri, H. NOAA Climate Data Record (CDR) of Precipitation Estimation from Remotely Sensed Information Using Artificial Neural Networks (PERSIANN-CDR), Version 1 Revision 1; NOAA National Climatic Data Center: Asheville, NC, USA, 2014. Available online: http://www.ncdc.noaa.gov/thredds/ncss/grid/cdr/persiann/persiann.ncml/dataset.html (accessed on 5 July 2014). [CrossRef]
  42. Joyce, R.J.; Janowiak, J.E.; Arkin, P.A.; Xie, P.P. CMORPH: A method that produces global precipitation estimates from passive microwave and infrared data at high spatial and temporal resolution. J. Hydrometeorol. 2004, 5, 487–503. [Google Scholar] [CrossRef]
  43. Climate Prediction Center/National Centers for Environmental Prediction/National Weather Service/NOAA/U.S. Department of Commerce. Updated Daily. NOAA CPC Morphing Technique (CMORPH) Global Precipitation Analyses. Research Data Archive at the National Center for Atmospheric Research, Computational and Information Systems Laboratory. 2011. Available online: http://rda.ucar.edu/datasets/ds502.0/ (accessed on 8 July 2014).
  44. Li, Z.; Yang, D.W.; Hong, Y. Multi-scale evaluation of high-resolution multi-sensor blended global precipitation products over the Yangtze River. J. Hydrol. 2013, 500, 157–169. [Google Scholar] [CrossRef]
  45. Khan, S.I.; Hong, Y.; Gourley, J.J.; Khattak, M.U.K.; Yong, B.; Vergara, H.J. Evaluation of three high-resolution satellite precipitation estimates: Potential for monsoon monitoring over Pakistan. Adv. Space Res. 2014, 54, 670–684. [Google Scholar] [CrossRef]
  46. World Meteorological Organization. Chapter 14; Observation of present and past weather; state of the ground. In Guide to Meteorological Instruments and Methods of Observation; WMO: Geneva, Switzerland, 2012; pp. I.14–19. [Google Scholar]
  47. Mashingia, F.; Mtalo, F.; Bruen, M. Validation of remotely sensed rainfall over major climatic regions in Northeast Tanzania. Phys. Chem. Earth 2014, 67–69, 55–63. [Google Scholar] [CrossRef]
  48. Jamandre, C.A.; Narisma, G.T. Spatio-temporal validation of satellite-based rainfall estimates in the Philippines. Atmos. Res. 2013, 122, 599–608. [Google Scholar] [CrossRef]
  49. Mishra, A.; Gairola, R.M.; Varma, A.K.; Agarwal, V.K. Remote sensing of precipitation over Indian land and oceanic regions by synergistic use of multisatellite sensors. J. Geophys. Res. Atmos. 2010, 115, D08106. [Google Scholar]
  50. Ebert, E.E.; Janowiak, J.E.; Kidd, C. Comparison of near-real-time precipitation estimates from satellite observations and numerical models. Bull. Am. Meteorol. Soc. 2007, 88, 47–64. [Google Scholar] [CrossRef]
  51. Lo Conti, F.; Hsu, K.L.; Noto, L.V.; Sorooshian, S. Evaluation and comparison of satellite precipitation estimates with reference to a local area in the Mediterranean Sea. Atmos. Res. 2014, 138, 189–204. [Google Scholar] [CrossRef]
  52. Chiu, L.S.; Liu, Z.; Vongsaard, J.; Morain, S.; Budge, A.; Neville, P.; Bales, C. Comparison of TRMM and water district rain rates over New Mexico. Adv. Atmos. Sci. 2006, 23, 1–13. [Google Scholar] [CrossRef]
  53. Kummerow, C.; Hong, Y.; Olson, W.S.; Yang, S.; Adler, R.F.; McCollum, J.; Ferraro, R.; Petty, G.; Shin, D.B.; Wilheit, T.T. The evolution of the Goddard Profiling Algorithm (GPROF) for rainfall estimation from passive microwave sensors. J. Appl. Meteorol. 2001, 40, 1801–1820. [Google Scholar] [CrossRef]
  54. Behrangi, A.; Tian, Y.; Lambrigtsen, B.H.; Stephens, G.L. What does CloudSat reveal about global land precipitation detection by other spaceborne sensors? Water Resour. Res. 2014, 50, 4893–4905. [Google Scholar] [CrossRef]
  55. Thiemig, V.; Rojas, R.; Zambrano-Bigiarini, M.; Levizzani, V.; De Roo, A. Validation of satellite-based precipitation products over sparsely gauged African River Basins. J. Hydrometeorol. 2012, 13, 1760–1783. [Google Scholar] [CrossRef]
  56. Feidas, H. Validation of satellite rainfall products over Greece. Theor. Appl. Climatol. 2010, 99, 193–216. [Google Scholar] [CrossRef]
  57. Joshi, M.K.; Rai, A.; Pandey, A.C. Validation of TMPA and GPCP 1DD against the ground truth rain-gauge data for Indian region. Int. J. Climatol. 2013, 33, 2633–2648. [Google Scholar]
  58. McPhee, J.; Margulis, S.A. Validation and error characterization of the GPCP-1DD precipitation product over the contiguous United States. J. Hydrometeorol. 2005, 6, 441–459. [Google Scholar] [CrossRef]
  59. Dinku, T.; Chidzambwa, S.; Ceccato, P.; Connor, S.J.; Ropelewski, C.F. Validation of high-resolution satellite rainfall products over complex terrain. Int. J. Remote Sens. 2008, 29, 4097–4110. [Google Scholar] [CrossRef]
  60. Apip; Takara, K.; Yamashiki, Y.; Sassa, K.; Ibrahim, A.B.; Fukuoka, H. A distributed hydrological-geotechnical model using satellite-derived rainfall estimates for shallow landslide prediction system at a catchment scale. Landslides 2010, 7, 237–258. [Google Scholar]
  61. Tian, Y.D.; Peters-Lidard, C.D. A global map of uncertainties in satellite-based precipitation measurements. Geophys. Res. Lett. 2010, 37, L24407. [Google Scholar] [CrossRef]
  62. Moazami, S.; Golian, S.; Kavianpour, M.R.; Hong, Y. Comparison of PERSIANN and V7 TRMM Multi-satellite Precipitation Analysis (TMPA) products with rain gauge data over Iran. Int. J. Remote Sens. 2013, 34, 8156–8171. [Google Scholar] [CrossRef]
  63. Katiraie-Boroujerdy, P.S.; Nasrollahi, N.; Hsu, K.L.; Sorooshian, S. Evaluation of satellite-based precipitation estimation over Iran. J. Arid Environ. 2013, 97, 205–219. [Google Scholar] [CrossRef]
  64. Li, X.H.; Zhang, Q.; Xu, C.Y. Assessing the performance of satellite-based precipitation products and its dependence on topography over Poyang Lake basin. Theor. Appl. Climatol. 2014, 115, 713–729. [Google Scholar] [CrossRef]
  65. Duan, Z.; Bastiaanssen, W.G.M. First results from Version 7 TRMM 3B43 precipitation product in combination with a new downscaling–calibration procedure. Remote Sens. Environ. 2013, 131, 1–13. [Google Scholar] [CrossRef]
  66. Qin, Y.; Chen, Z.; Shen, Y.; Zhang, S.; Shi, R. Evaluation of satellite rainfall estimates over the Chinese mainland. Remote Sens. 2014, 6, 11649–11672. [Google Scholar] [CrossRef]
  67. Beighley, R.E.; Ray, R.L.; He, Y.; Lee, H.; Schaller, L.; Andreadis, K.M.; Durand, M.; Alsdorf, D.E.; Shum, C.K. Comparing satellite derived precipitation datasets using the Hillslope River Routing (HRR) model in the Congo River Basin. Hydrol. Process. 2011, 25, 3216–3229. [Google Scholar] [CrossRef]
  68. Chaplot, V. Impact of spatial input data resolution on hydrological and erosion modeling: Recommendations from a global assessment. Phys. Chem. Earth A B C 2014, 67–69, 23–35. [Google Scholar] [CrossRef]

