1. Introduction
Snow cover is an important indicator for climate change and the main source of fresh water in arid and semiarid regions [
1,
2,
3]. Its variation leads to variations in albedo, which then influences the surface energy budget [
4]. The accumulation and melting of snow effect the annual distribution of water resources [
5]. Therefore, long-term snow datasets are fundamental to climatological and hydrological studies. In particular, the snow water equivalent (SWE) or snow depth is a key variable in hydrological models [
6,
7].
Passive microwave (PMW) remote sensing is the most efficient method of retrieving snow depth or SWE data on a regional or global scale due to its ability to penetrate clouds and its high temporal resolution. Currently, there are three daily PMW SWE or snow depth products covering China: the global SWE product from the National Snow and Ice Data Center (NSIDC) [
8,
9], the Northern Hemisphere SWE product from the European Space Agency (ESA) [
10], and the snow depth product for China from the West Data Center in China (WestDC) [
11]. The WestDC snow depth product has been used in studies of climate change [
12,
13], vegetation growth [
14], permafrost changes [
15], and river runoff [
16].
The WestDC snow depth product for China has been retrieved from the Scanning Multichannel Microwave Radiometer (SMMR), the Special Sensor Microwave Imager (SSM/I), the Special Sensor Microwave Imager/Sounder (SSMI/S) and the Advanced Microwave Scanning Radiometer-Earth Observing System (AMSR-E) from 1978 to the present. However, the satellite sensors and platforms possess different radiometric characteristics. The continuity and consistency of the brightness temperatures and snow products derived from these sensors data are affected by the updating and replacement of sensors or platforms [
17]. Che
et al. [
11] used two equations to retrieve the snow depth in China because of differences between the SMMR and SSM/I data. The different retrieval equations improved the consistency of the snow depth from the SMMR and SSM/I data but did not resolve the inconsistency between the snow cover areas (SCAs) obtained using the two sensors, particularly in areas of shallow snow (e.g., the Qinghai-Tibet Plateau, QTP). Studies of North America also indicated that differences between the sensors affected the temporal consistency of the SWE [
18,
19]. SWE estimates during the SMMR winter seasons are systematically and significantly lower than the retrievals during SSM/I seasons if no brightness temperature adjustments are applied [
18,
19]. Therefore, the brightness temperature data obtained from the various sensors must be calibrated.
Cross-platform calibrations have been performed between the SMMR and SSM/I carried on DMSP-F08 (SSM/I(F08)) [
20,
21], the SSM/I(F08) and SSM/I carried on DMSP-F11 (SSM/I(F11)) [
21,
22], the SSM/I(F11) and SSM/I carried on DMSP-F13 (SSM/I(F13)) [
17,
21], and the SSM/I(F13) and AMSR-E [
21] in various regions. The results indicated a large gap between the SMMR and SSM/I, moderate differences between the SSM/I and AMSR-E, and slight differences among the SSM/I sensors carried on F08, F11 and F13 (hereafter denoted as SSM/I(s)). The large gap between the SMMR and SSM/I caused a large difference in the SWE in North America [
18]. Although the brightness temperature differences among the SSM/I(s) were very small, they led to a large difference in the derived sea ice extent [
17]. With the SSM/I out of operation in 2009, and the AMSR-E out of operation in 2011, the SSMI/S became the alternative sensor for providing PMW data for snow depth products. Cavalieri
et al. [
23] identified the difference between the sea ice extents derived from these sensors and developed an inter-sensor calibration for the sea ice extent product. Thus far, however, no integrated evaluations have been conducted on the consistency of the snow depth and SCA derived using data from these sensors from 1979 to the present. Furthermore, the inter-sensor calibration coefficients varied by region, and no investigation has been performed to determine which calibration is suitable for regional snow depth products (e.g., in China).
In this study, we developed an inter-sensor calibration between the Tb from neighboring sensors, and we systematically evaluated the temporal continuity of the daily SCA and snow depth products for China derived from satellite PMW data. First, in
Section 2, we describe the inter-sensor calibration between the SSM/I and SSMI/S because a brightness temperature calibration between the SSM/I and SSMI/S that extends the PMW data to the present has not yet been developed.
Section 3 presents an evaluation of the consistencies between the SCA and snow depth derived from neighboring sensors data. In
Section 4, the differences between the calibration results reported in various studies are discussed.
3. Inter-Sensor Comparison in Snow Cover Area and Snow Depth
The snow cover identification and snow depth retrieval are based on the volume scattering properties of snow particle. The decision tree method in Grody and Basist [
25] was used to identify the snow cover. In this method, a brightness temperature difference (TBD) greater than 0 was used as the criterion for scatters, and the scatters other than snow, such as precipitation, cold deserts and frozen ground, were removed based on the polarization difference and brightness temperature difference at different frequencies. One of the criteria for removing frozen ground involves 85V, and the criteria to remove precipitation involve 22V. Due to the absence of 22V and 85V in SMMR, in this study, the criteria involving 85V were not used, and 18V was used instead of 22V.
The passive microwave snow depth retrieval was based on the fact that snow particles scattered the passive microwave signal from the underlying land, and the scattering strength increases with frequency and snow depth. Based on this principle, the spectral gradient method was developed to retrieve the snow depth. In this method, the TBD between 18 and 36 GHz increases with the snow depth and SWE [
26]. This method has been used to derive the snow depth or SWE on global and regional scales [
11,
27,
28]. Considering the influence of snow properties, Che
et al. [
11] modified the Chang algorithm to develop a snow depth retrieval algorithm for China. In this study, the modified Chang algorithm by Che
et al. [
11] was used to derive the snow depth in China.
The relative biases in the SCA and snow depth of the various sensors were used to evaluate their consistency, which was expressed as (a1 − a2)/a2, where a1 and a2 represent the SCA or snow depth derived from the two neighboring sensors. In this study, the population of snow-covered pixels was used to represent the SCA. The snow volume in the snow-covered pixels represented the magnitude of snow depth. The snow volume in a pixel was calculated by multiplying the snow depth by the area of pixel. For PMW, the area of the pixel is 25 × 25 km2.
3.1. Comparison between SCA and Snow Depth from SSM/I(F13) and SSMI/S(F17)
The population of snow-covered pixels and snow depth in China during the overlap period was derived from F13, F13C and F17 based on the decision tree method in [
25]. The snow volume for China was calculated based on the snow depth.
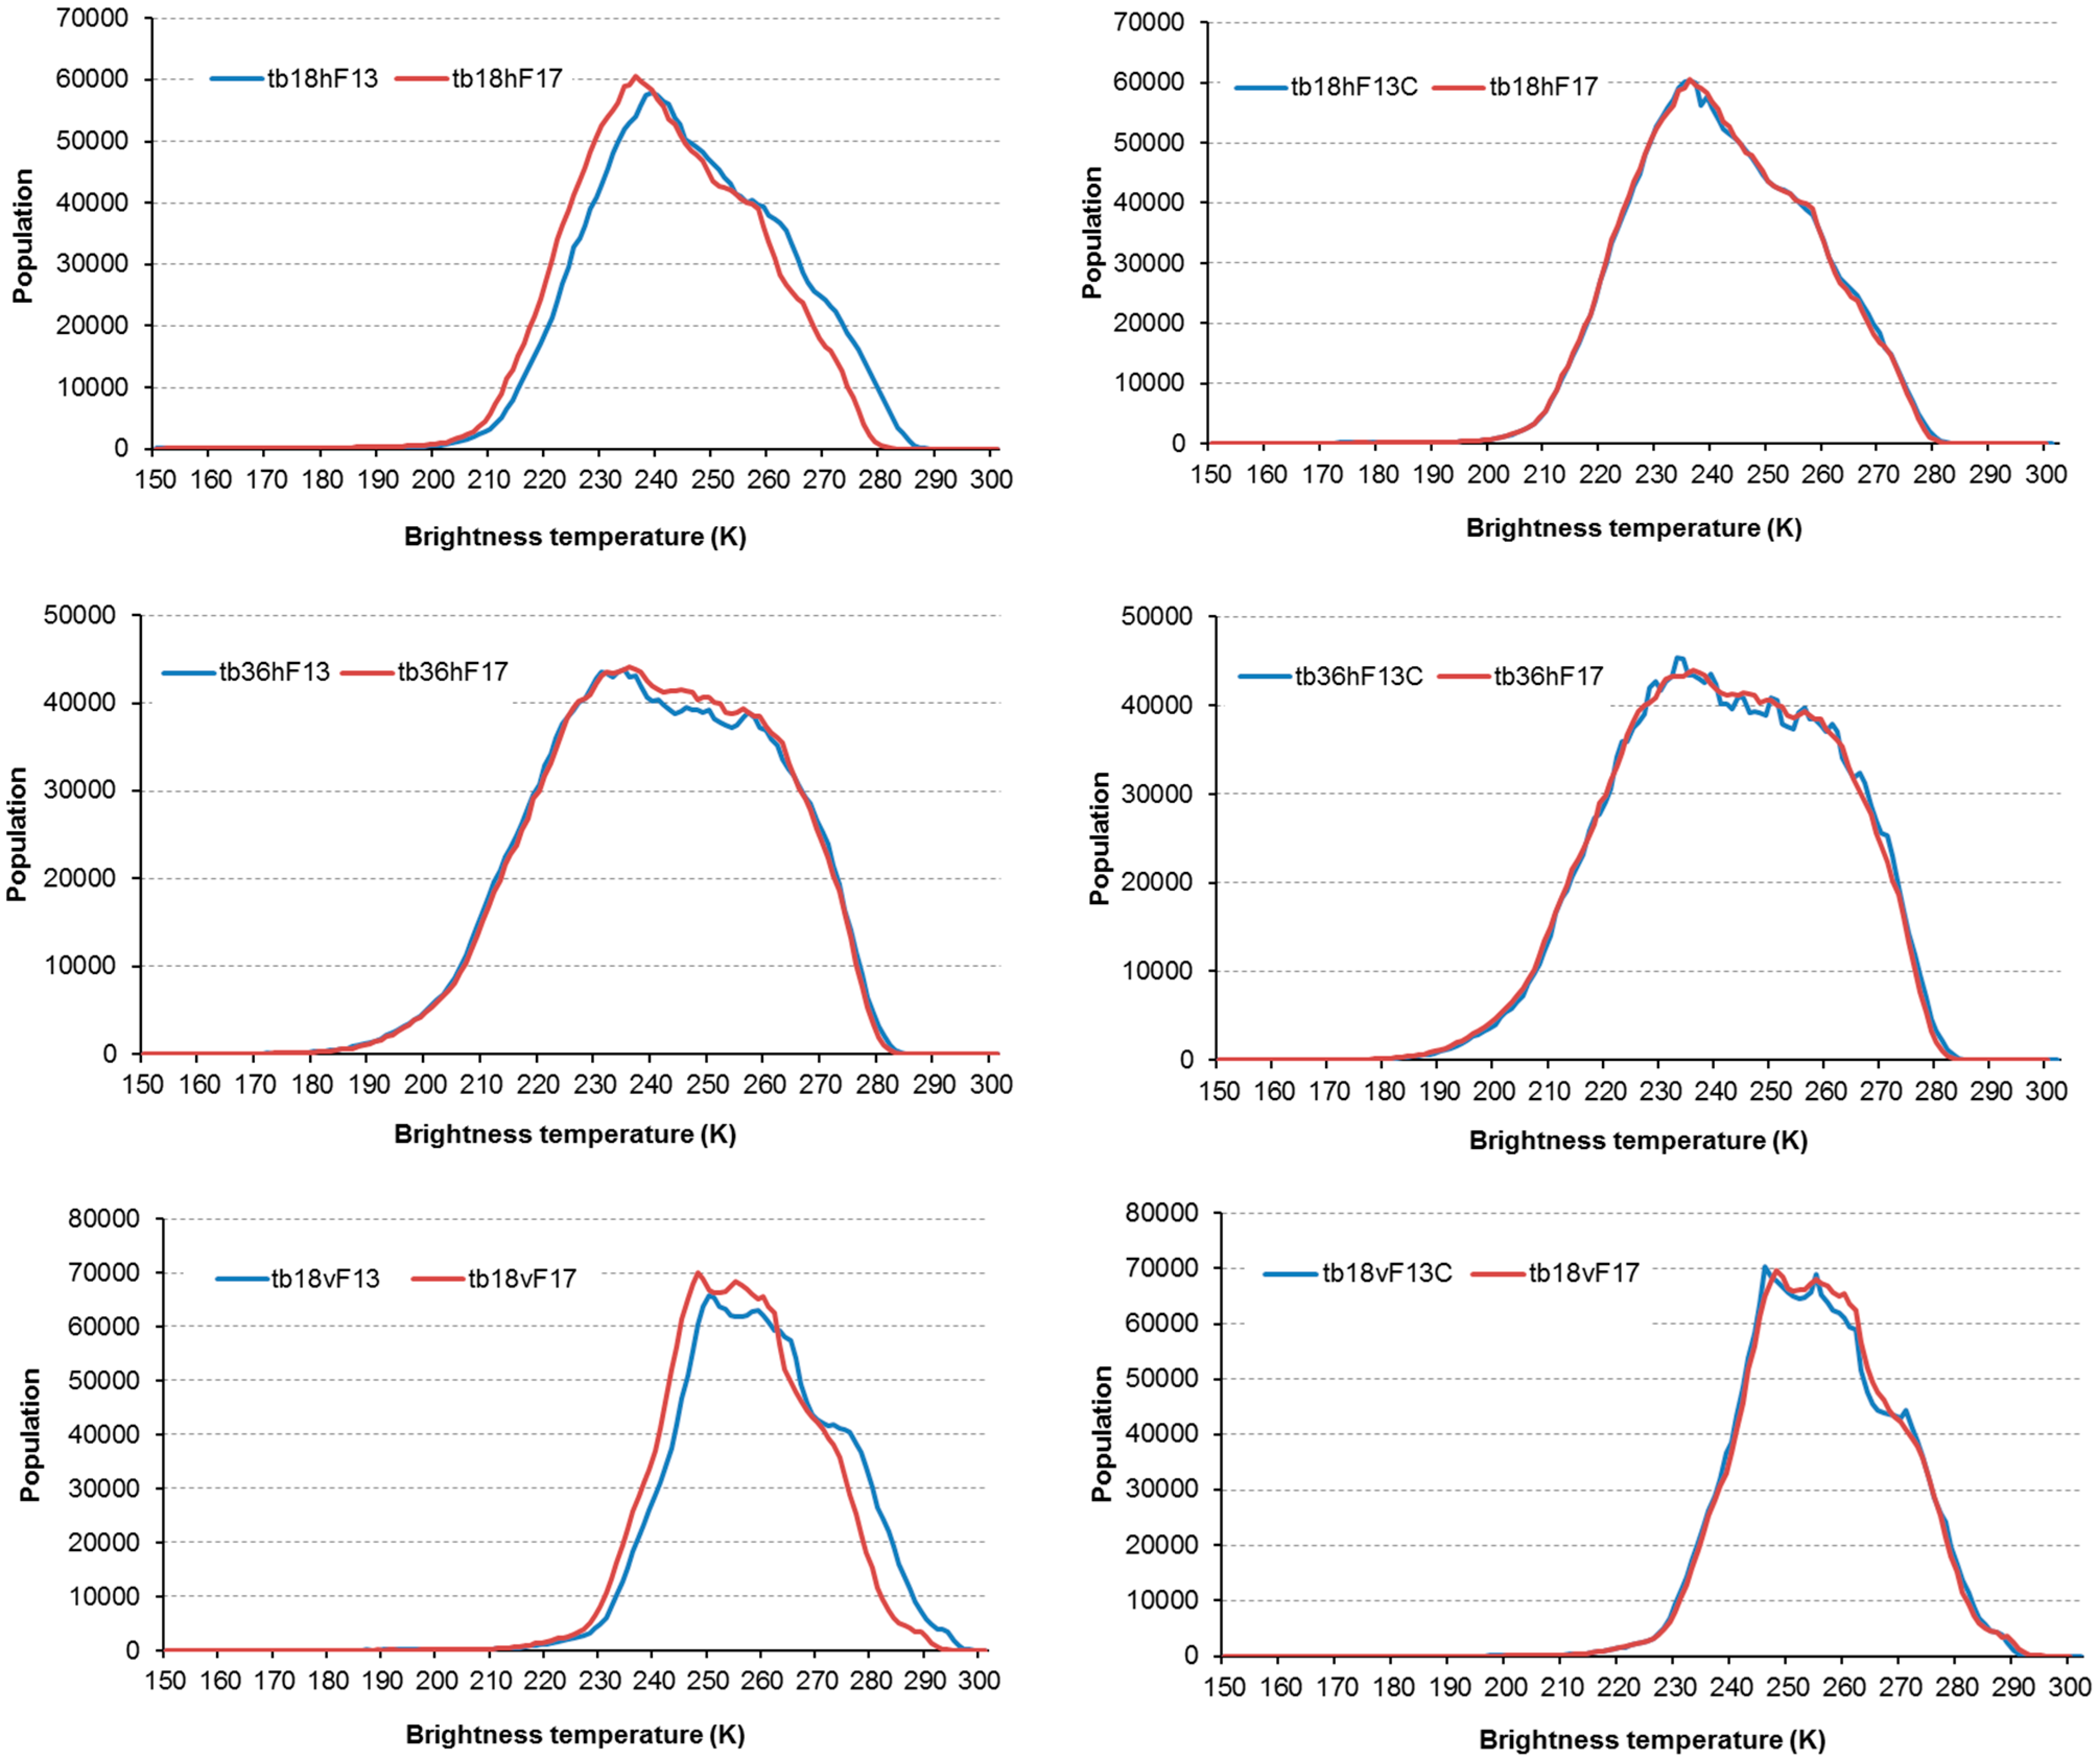
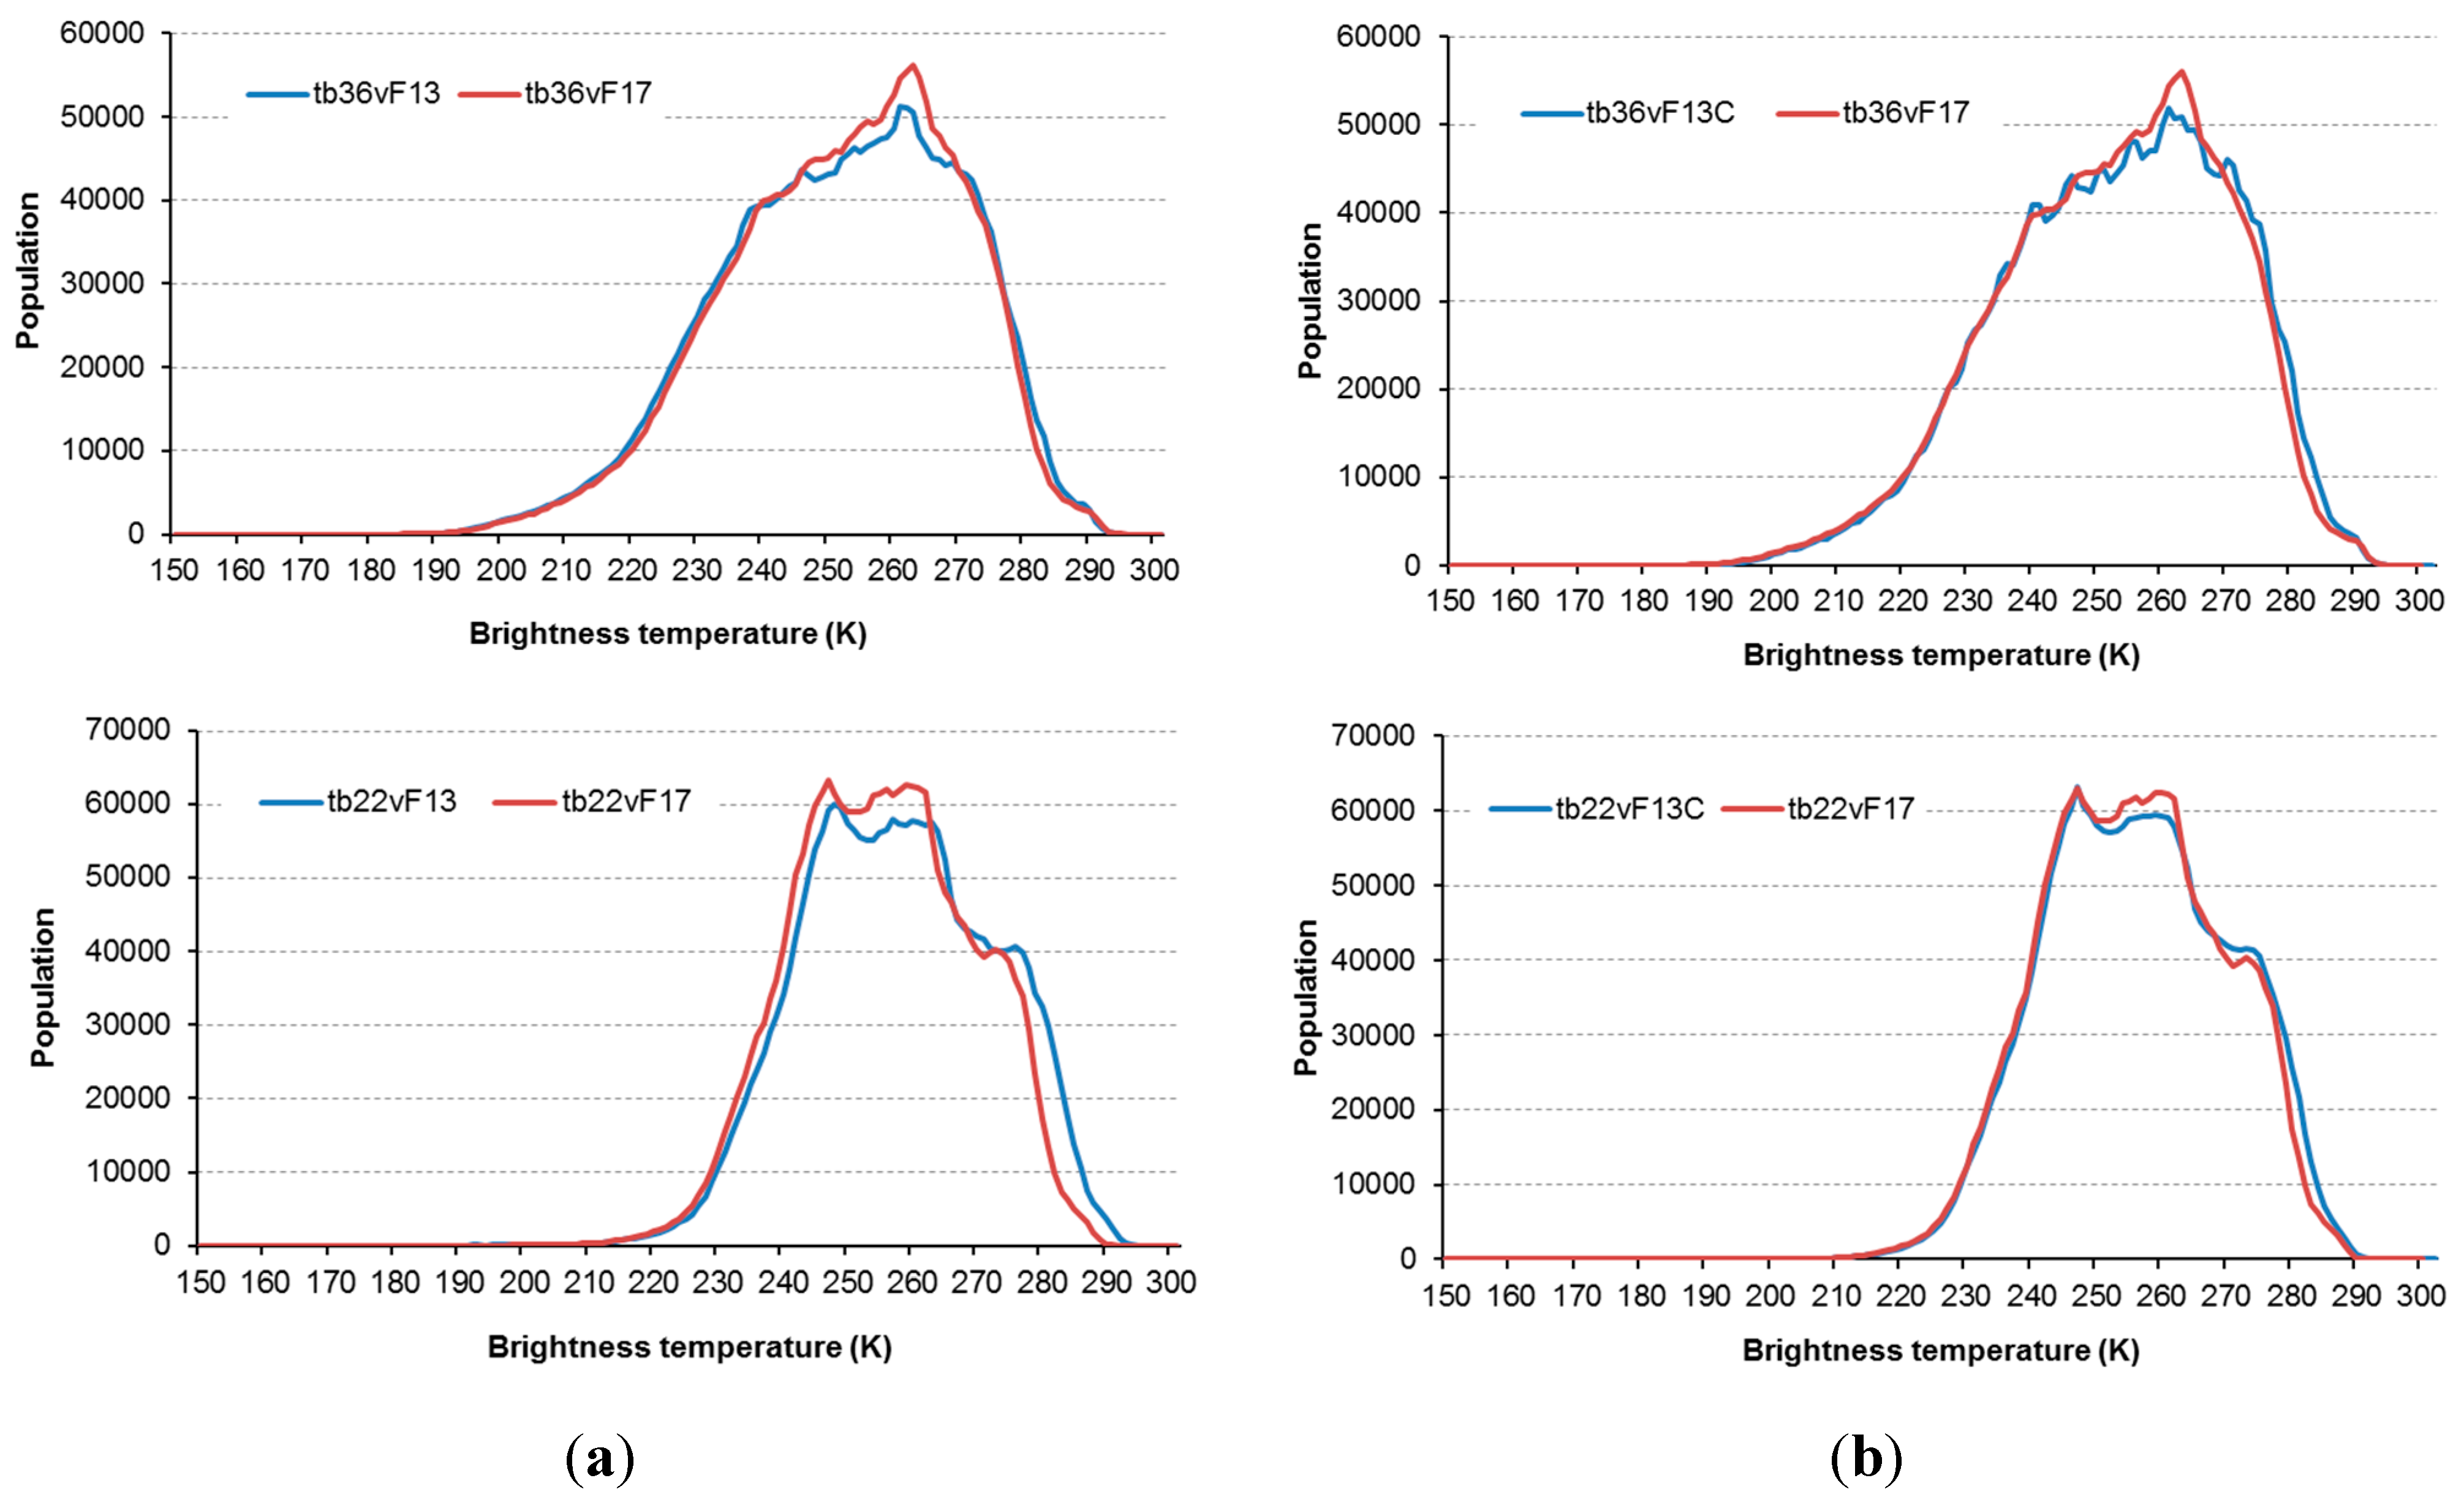
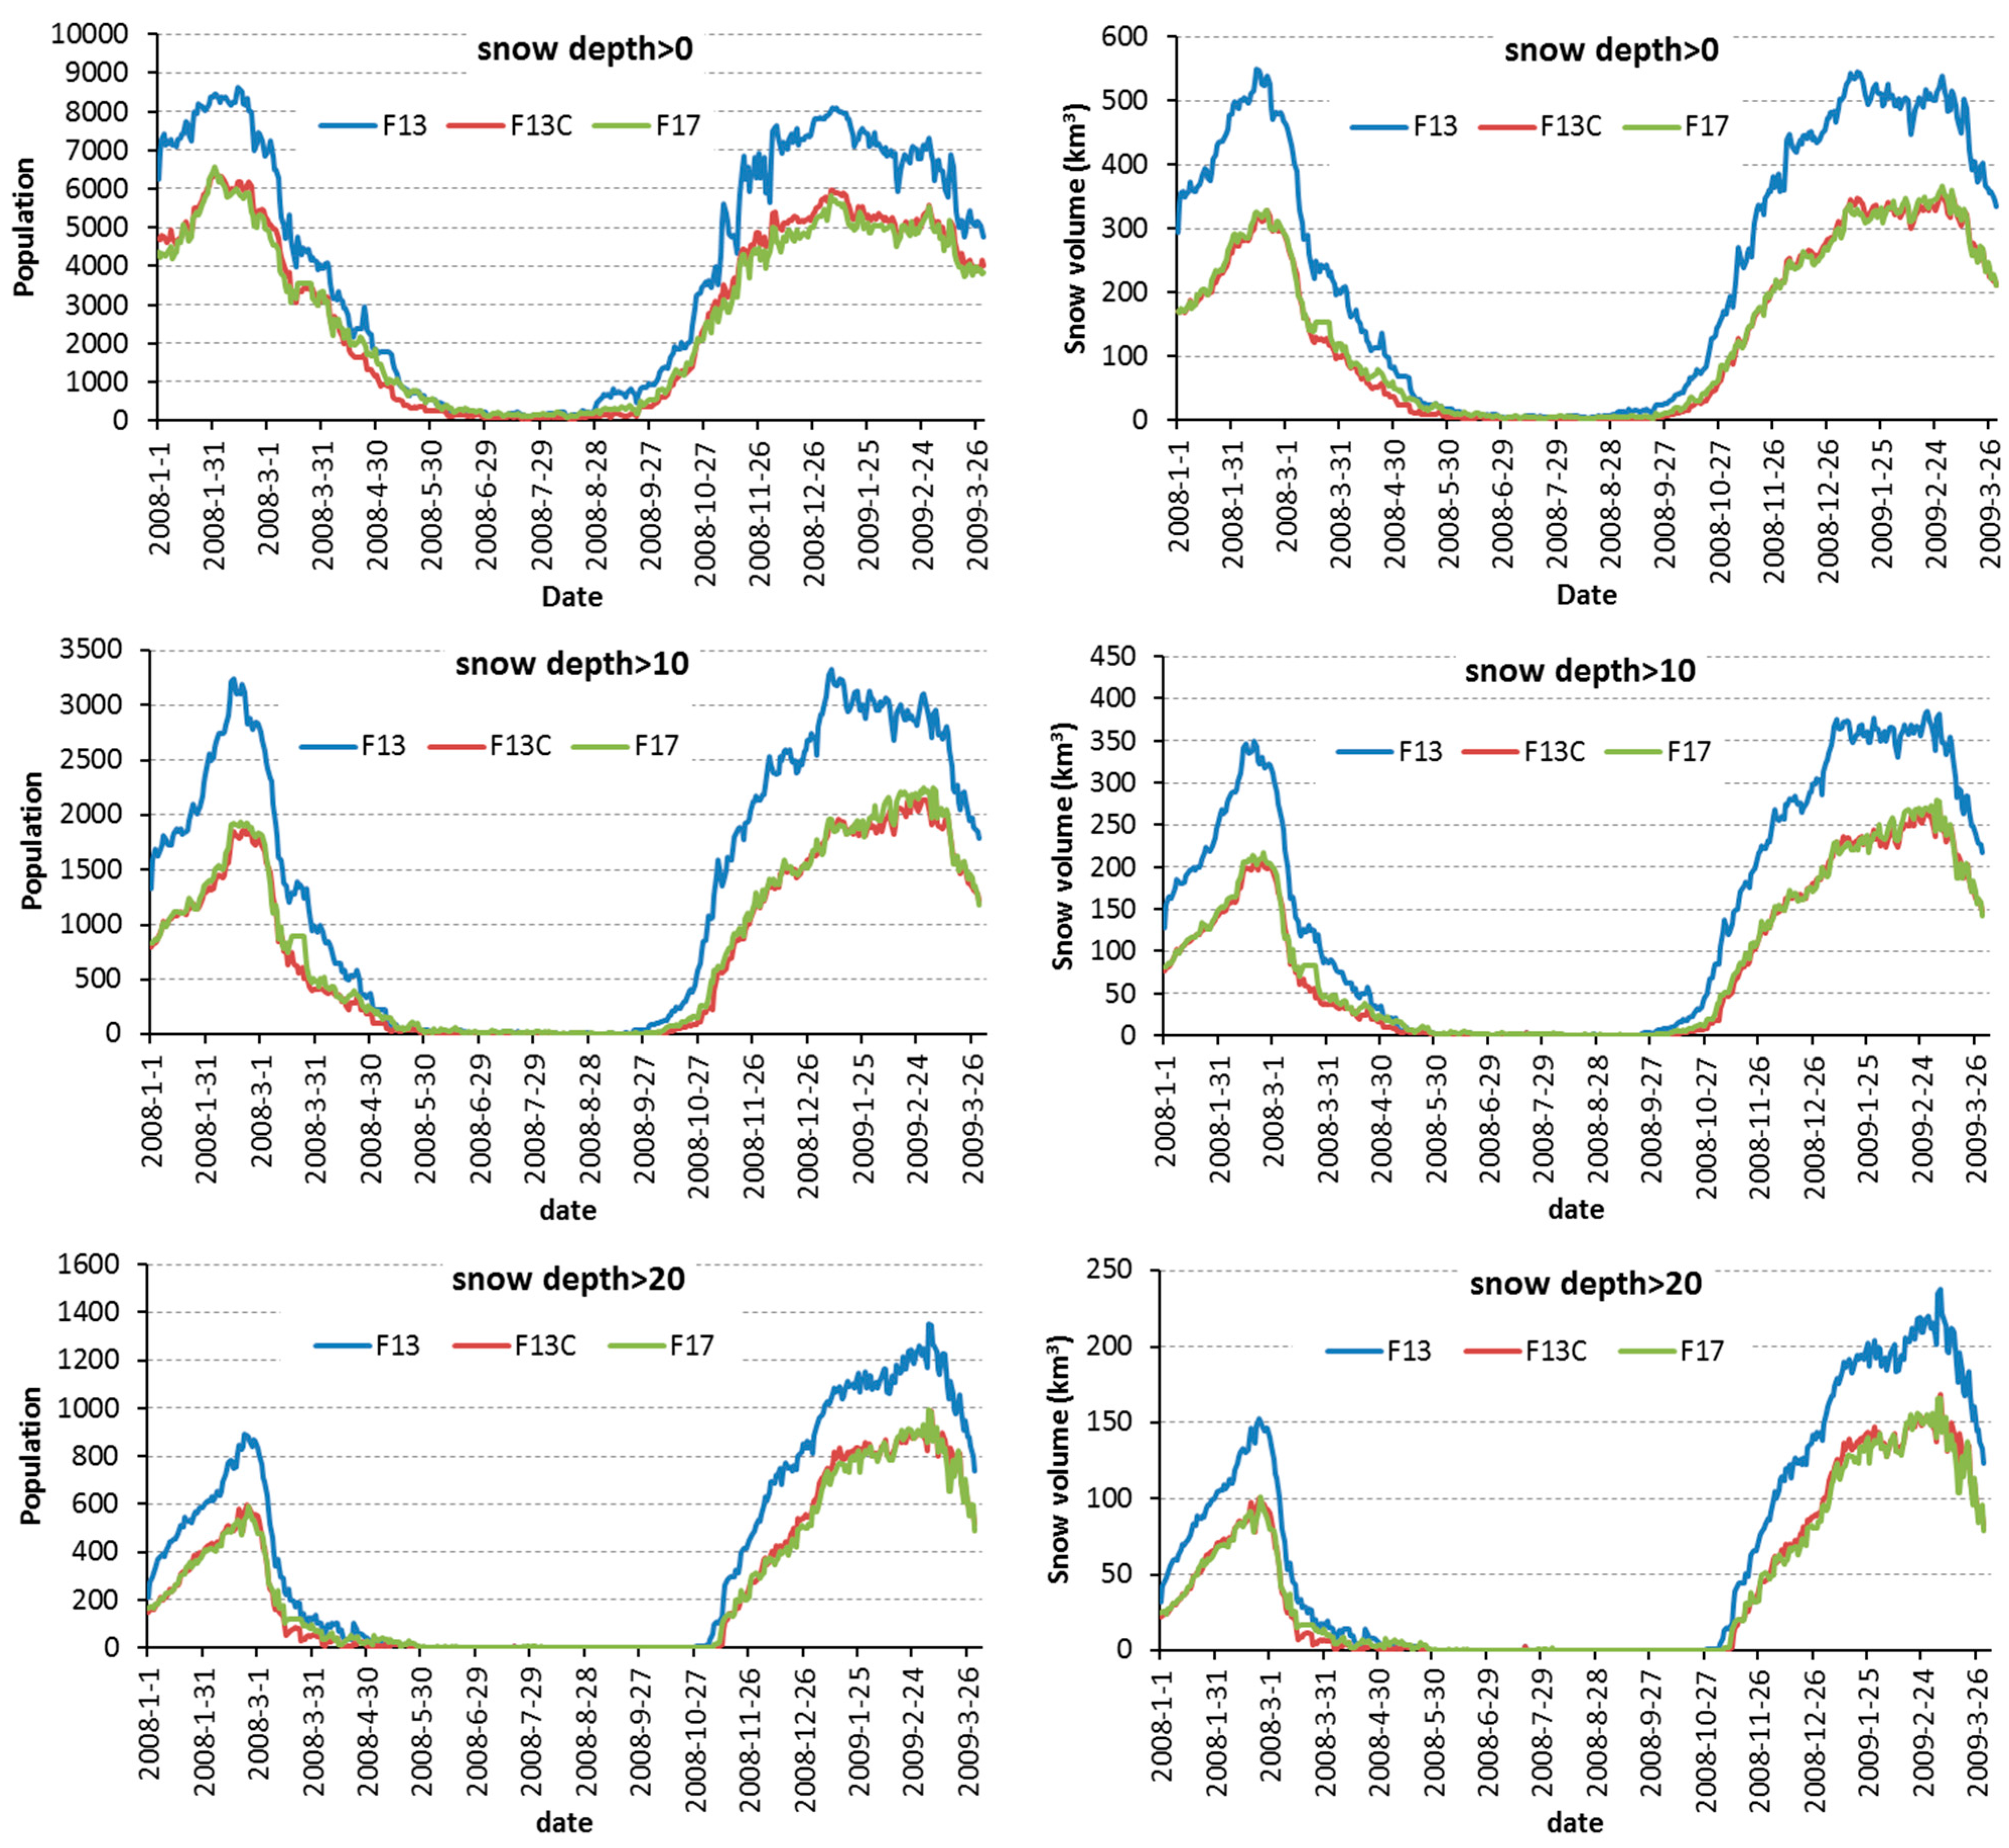
Figure 3 shows the variations in the population of snow-covered pixels and the snow volume for China from F13, F13C and F17. The graphs exhibited that the SCA and snow volume from F13 are much higher than those from F17, and the consistency between F17 and F13C was high (
Figure 3). To quantitatively evaluate the consistency, we calculated the relative bias between F13 and F17, F13C and F17 based on F17. The results showed that the SCA (TBD > 0) and corresponding snow volume improved from 42.42% to 1.65% and from 66.18% to −1.5%, respectively (
Table 3). The relative biases in population and snow volume all decreased in the areas with snow depths of greater than 0 cm, greater than 10 cm and greater than 20 cm. In the area with snow depths greater than 10 cm, the relative bias in the population improved from 60.98 to −4.2% and that in the snow volume improved from 59.71 to −2.23%. In the area with snow depths of greater than 20 cm, the corresponding values improved from 50.91% to 0.35% and from 55.19% to 0.89%, respectively.
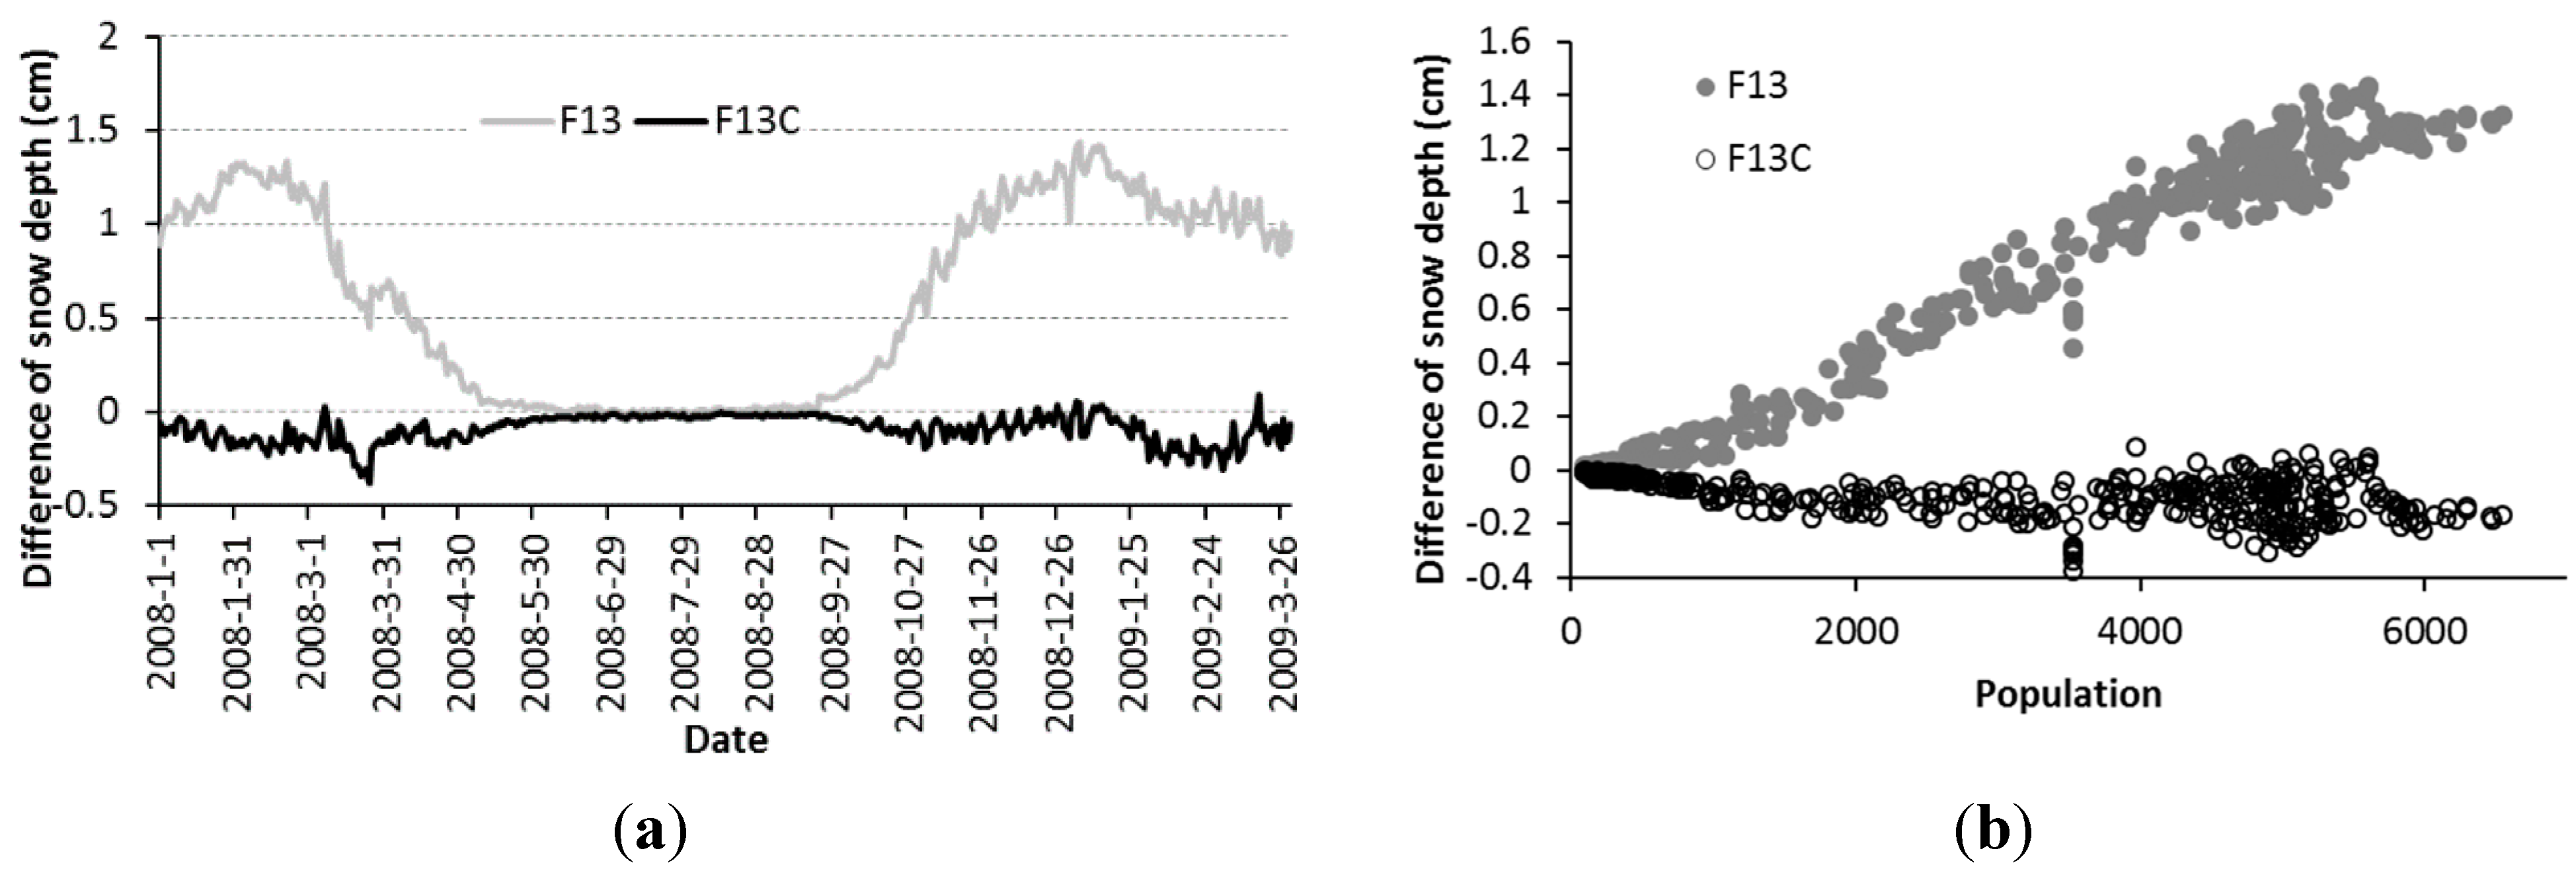
Moreover, we calculated the population of snow covered pixels for every day and the difference between the snow depth from F13 and F17 at every pixel and averaged the values each day during the overlap period over China (
Figure 4a). The results indicated that the differences changed seasonally before the calibration but only changed slightly after the calibration. In addition, a scatter diagram showed the relationship between the populations of snow-covered pixels and the difference in snow depth (
Figure 4b). The figure showed that the difference in snow depth increased with the population before the calibration, whereas it was distributed randomly after the calibration (
Figure 4). Thus, the inter-calibration between F13 and F17 greatly improved the consistency of both the retrieved SCA and snow depth.
Figure 3.
Comparison of the populations of snow-covered pixels and the corresponding snow volume at different ranges of snow depths (snow depth > 0, snow depth > 10 and snow depth > 20) derived from F13, F13C and F17.
Figure 3.
Comparison of the populations of snow-covered pixels and the corresponding snow volume at different ranges of snow depths (snow depth > 0, snow depth > 10 and snow depth > 20) derived from F13, F13C and F17.
Figure 4.
Average differences between snow depths from F13 and F17 and from F13C and F17 during the overlap period: (a) the variation in the mean difference between the snow depth from F13 and F17 over China for each day during the overlap period; and (b) relationship between the difference in the snow depth and snow-covered area (population).
Table 3.
Relative errors in the snow volume and population from F13 and F13C based on F17 for different snow depth (SD) ranges.
Table 3.
Relative errors in the snow volume and population from F13 and F13C based on F17 for different snow depth (SD) ranges.
| | F13 | F13C |
|---|
| | Snow Volume | Population | Snow Volume | Population |
|---|
| SD > 0 | 66.18% | 42.42% | −1.5% | 1.65% |
| SD > 10 | 59.71% | 60.98% | −2.23% | −4.2% |
| SD > 20 | 55.19% | 50.91% | 0.89% | 0.35% |
3.2. Comparison between SCA and Snow Depth from SMMR and SSM/I
China is located in the mid-latitudes; thus, the swath of the SMMR beam is very narrow (half that of the SSM/I), which leads to a long repeat time for a given pixel. Furthermore, the SMMR data were collected every other day, and the effective overlap time was 15 days. The overlap time occurred in the summer, when snow cover in China is sparse. All of these factors led to a scarcity of overlapping snow cover pixels in China. Therefore, it is difficult to quantitatively evaluate the difference between the snow depth and SCA obtained from the SMMR and SSM/I.
In this study, we derived the multi-year SCA and corresponding snow depth in China from the SMMR and SSM/I and determined the spatial distributions of snow cover. In addition, we found that distinct differences in SCA are evident in the QTP.
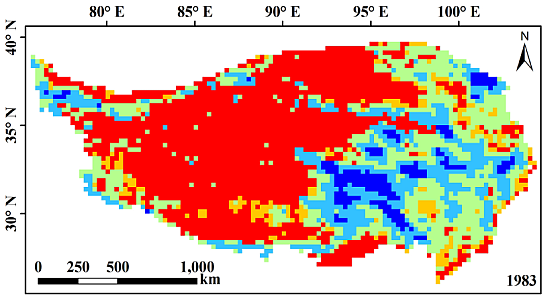
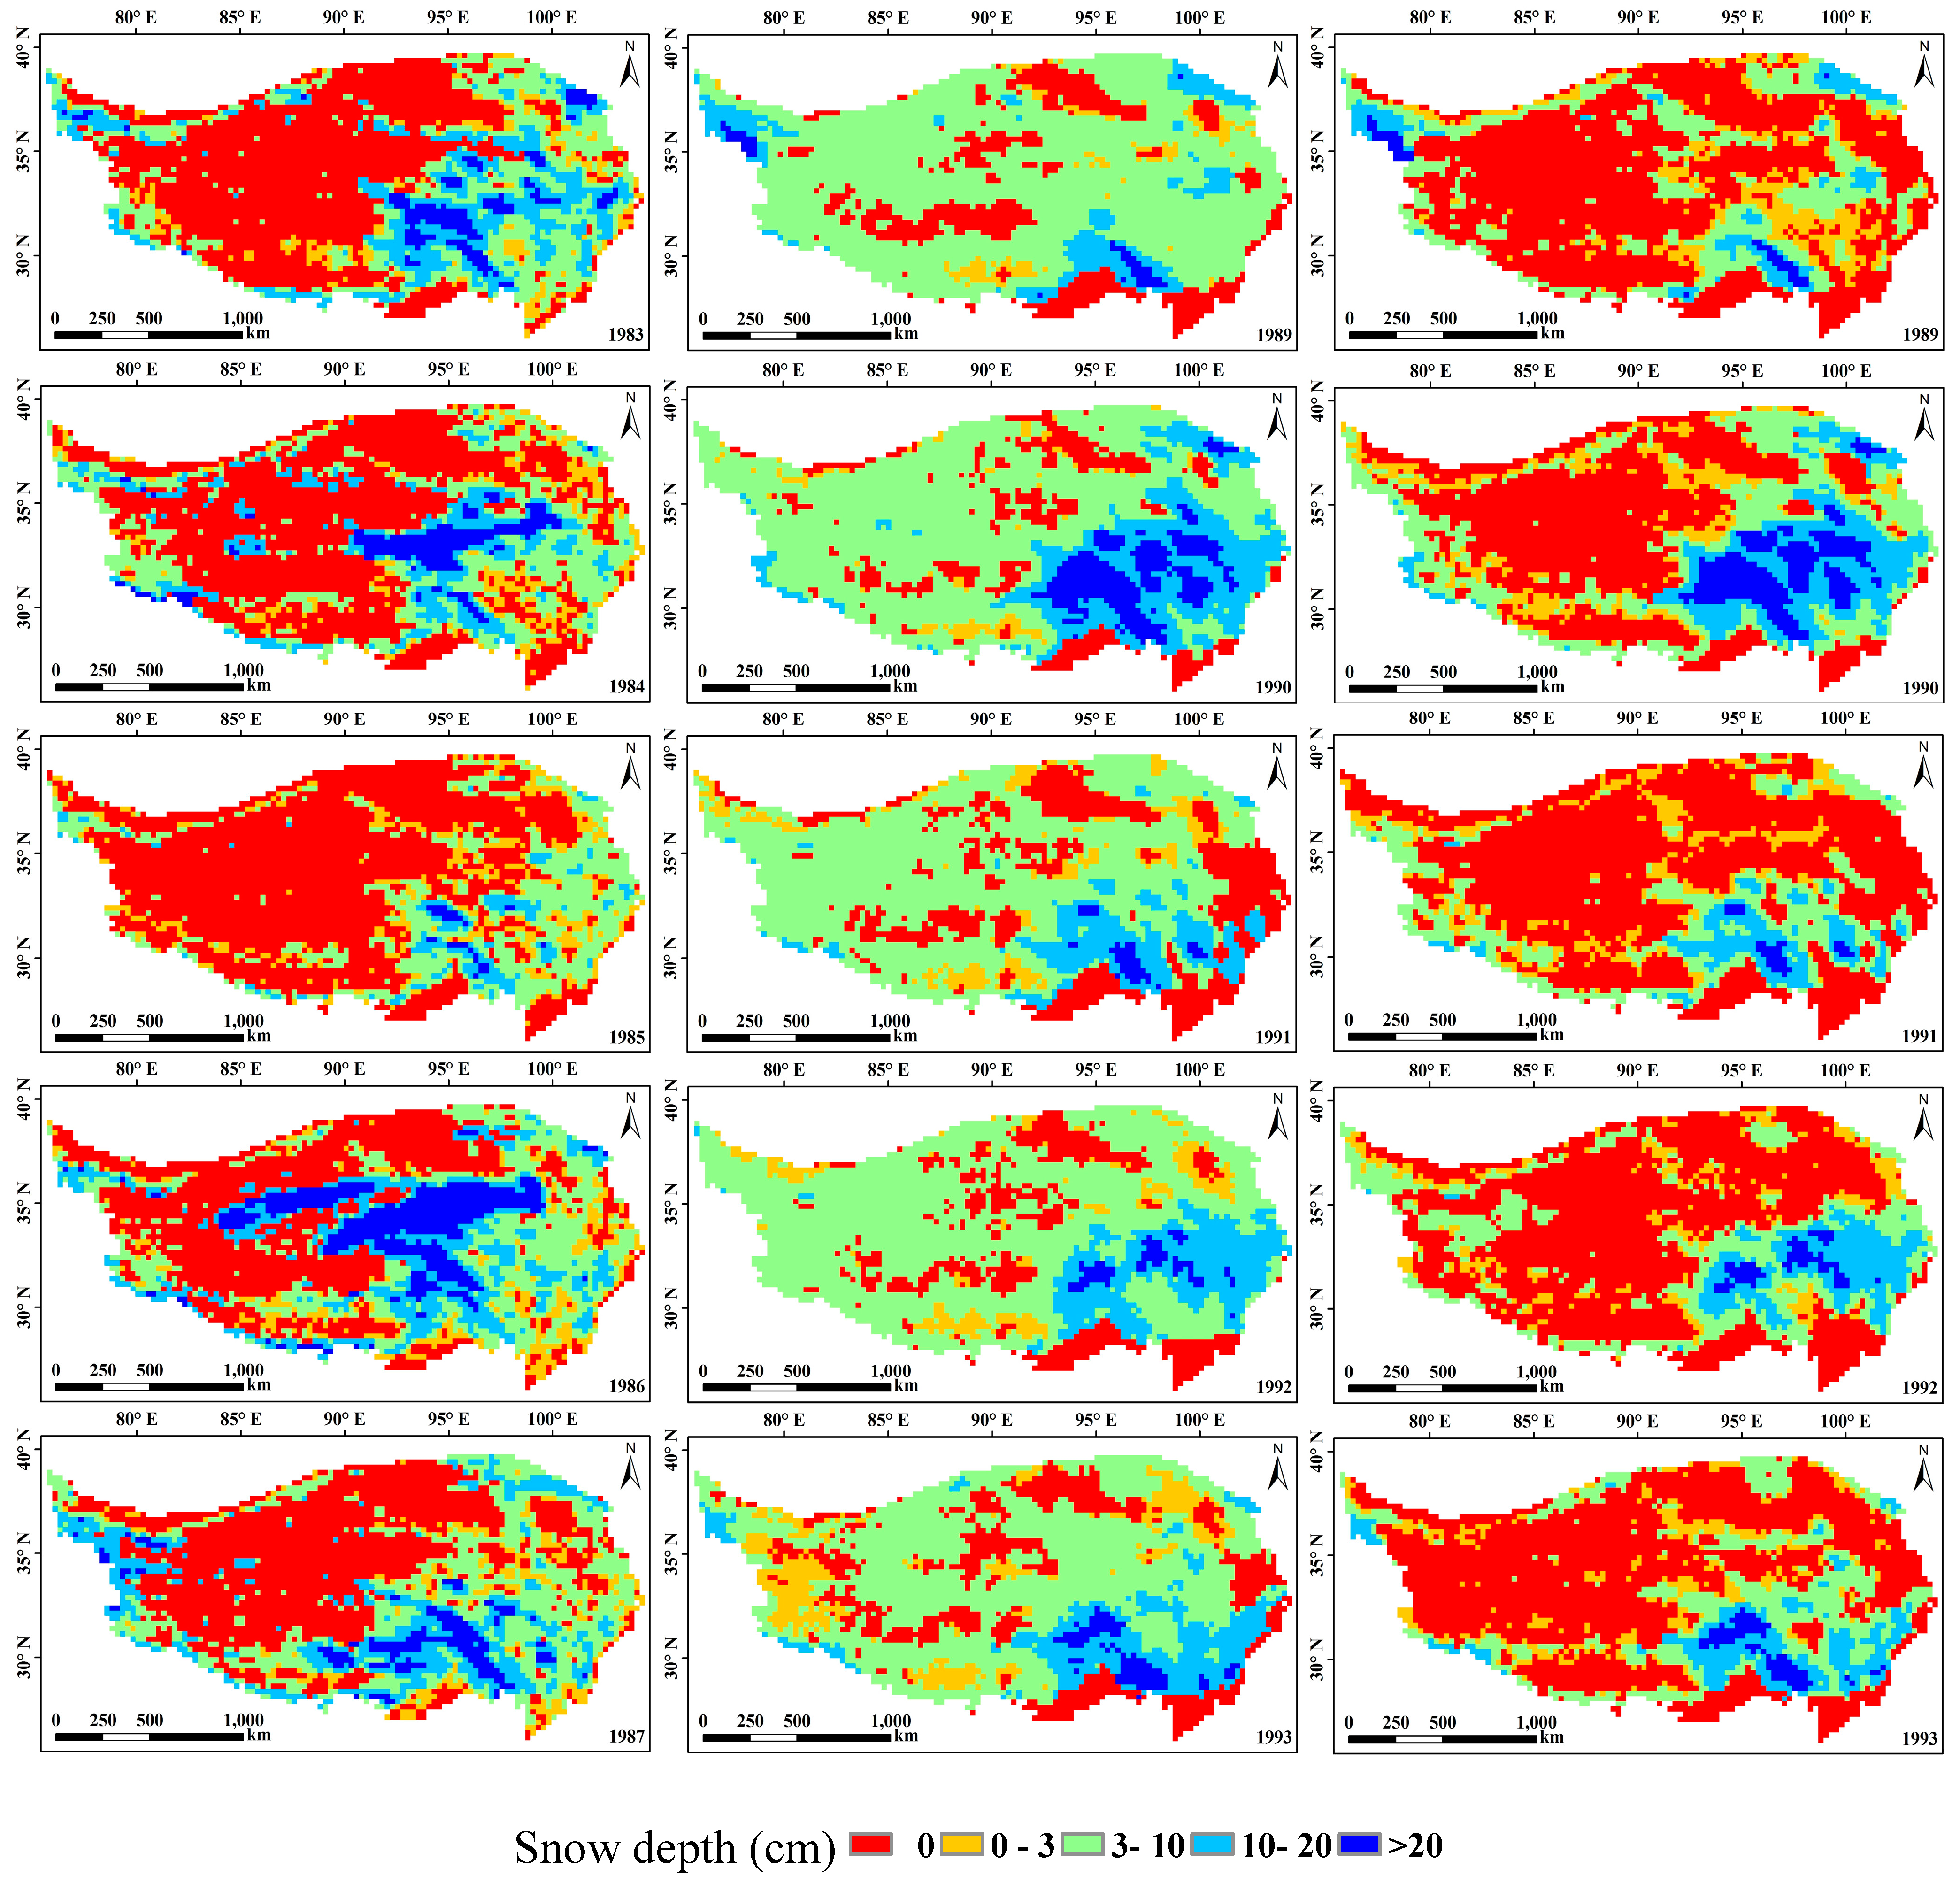
Figure 5 shows the snow depth of the QTP on 1 January 1983, 1984, 1985, 1986, and 1987 from SMMR and 1989, 1990, 1991, 1992, and 1993 from SSM/I. Based on the multi-year snow cover distribution from SMMR, rare snow is a typical feature in the central and eastern plateau (
Figure 5 left). But snow cover from 1989 to 1993 showed large areas of snow cover in the central and eastern plateau (
Figure 5 middle). On the other hand, the meteorological station observation did not show that snow depth and snow cover days from 1989 to 1998 were larger than from 1983 to 1987. Therefore, we argued that the difference was caused by the change of sensors. After calibration, the snow cover derived from SSM/I showed rare snow in the central and eastern plateau for every year from 1989 to 1993 (
Figure 5 right). Therefore, the spatial distribution of the snow cover indirectly demonstrated that inter-sensor calibration improved the consistency of the snow depth product.
Figure 5.
Comparison of snow depths derived from the SMMR (1983–1987) and SSM/I before and after the calibration (1989–1993); (left) snow depth distribution from the SMMR; (middle) snow depth distribution from the SSM/I; and (right) snow depth distribution from the calibrated SSM/I.
Figure 5.
Comparison of snow depths derived from the SMMR (1983–1987) and SSM/I before and after the calibration (1989–1993); (left) snow depth distribution from the SMMR; (middle) snow depth distribution from the SSM/I; and (right) snow depth distribution from the calibrated SSM/I.
4. Discussion
Many calibration works had been performed between the SMMR and SSM/I(F08) [
18,
20,
21], the SSM/I(F08) and SSM/I(F11) [
20,
21,
22], and the SSM/I(F11) and SSM/I(F13) [
17,
21,
22], but the calibration results varied between regions. Therefore, it was necessary to evaluate the effect of different calibration results on the consistency of the SCA and snow depth products.
4.1. Other Calibration Results for the SMMR and SSM/I
The relationship between brightness temperatures from the overlapping sensors varies by region.
Table 4 lists the calibration results from various studies [
18,
20,
21]. In this section, we discuss the bias caused by the various calibrations. Because the calibration coefficients produced by Derksen
et al. [
18] were limited to vertical polarization, we only compared the former two groups of calibration results. After calibration, the brightness temperature at all channels from both methods decreased, but the magnitude of the decrease in the first method was slightly larger than that in the second method. When the calibration results were used in the SCA and snow depth product retrieval in China, the relative biases of the SCA and snow volume during the short overlap time between F08 and the SMMR decreased from 134.9% and 112.3% to −33.1% and −29.2%, respectively, after the calibration based on group one of the calibration results and to −32.2% and −43.7% based on group two of the calibration results, respectively. However, the results only represented information from a small number of pixels in the eastern corner of the Tibetan Plateau and Tien Mountain (during the overlap time, these two areas were the only locations with snow cover).
Table 4.
Comparison of the calibration results from various studies. Group one is from Dai and Che [
21]; group two is from Jezek
et al. [
20] for SMMR/F08, Abdalati
et al. [
22] for F08/F11, and Stroeve
et al. [
17] for F11/F13; and group three is from Derksen
et al. [
18] for SMMR/F08 and Stroeve
et al. [
17] for F11/ F13.
Table 4.
Comparison of the calibration results from various studies. Group one is from Dai and Che [21]; group two is from Jezek et al. [20] for SMMR/F08, Abdalati et al. [22] for F08/F11, and Stroeve et al. [17] for F11/F13; and group three is from Derksen et al. [18] for SMMR/F08 and Stroeve et al. [17] for F11/ F13.
| Sensors | Channels | Slope | Intercept | Slope | Intercept | Slope | Intercept |
|---|
| | | Group one | Group two | Group three |
| SMMR/F08 | 18H/19H | 0.934 | 8.9173 | 0.94 | 2.62 | n/a | n/a |
| 18V/19V | 0.848 | 31.134 | 0.87 | 21.9 | 0.936 | 8.24 |
| 37H/37H | 0.967 | 5.2716 | 0.954 | 2.85 | n/a | n/a |
| 37V/37V | 0.856 | 34.361 | 0.861 | 30.2 | 0.900 | 21.89 |
| F08/F11 | 19H | 0.990 | 1.9825 | 1.000 | 0.297 | 0.988 | 2.4 |
| 19V | 1.000 | −0.0537 | 1.000 | 0.152 | 0.984 | 2.91 |
| 37H | 0.989 | 1.432 | 1.009 | −1.67 | 0.995 | 0.992 |
| 37V | 0.992 | 1.3799 | 0.987 | 2.81 | 0.983 | 3.13 |
| F11/F13 | 19H | 1.002 | −0.0222 | 1.003 | −0.59 | 0.995 | 1.633 |
| 19V | 0.997 | 0.6073 | 0.993 | 1.28 | 0.996 | 1.09 |
| 37H | 0.998 | 0.4057 | 0.984 | 2.85 | 0.994 | 1.607 |
| 37V | 0.998 | 0.1588 | 1.007 | −1.816 | 0.989 | 2.659 |
4.2. Comparison between SSM/I(s)
The overlap time between F08 and F11 was 3 December to 30 December, 1991, and the overlap time between F11 and F13 was 3 May to 30 September, 1995. The SCA and snow depth in China during the overlap times were derived from the SSM/I(F08), SSM/I(F11), and SSM/I(F13). The relative biases in the SCA and snow depth were 5.80% and 3.73% between F08 and F11 and 3.31% and 1.85% between F11 and F13.
Group one of the calibration results between F08 and F11 [
21] was developed for the Greenland ice sheet and the Sahara Desert. Group two [
22] was developed for the Greenland ice sheet. Group three was developed for the Antarctic ice sheet. The group one calibration [
21] between F11 and F13 was developed for the Antarctic ice sheet and the Sahara Desert, group two [
17] was developed for the Southern Hemisphere, and group three [
17] was developed for the Northern Hemisphere. The calibration results presented in
Table 4 indicate that the coefficients varied between sampling regions, but the slopes are close to 1, and the intercepts are close to 0.
When F11 was assigned as the independent variable, the brightness temperatures from F08 and F13 were calibrated based on the calibration results in
Table 4, and the population of snow-covered pixels and the snow volume were retrieved. The results indicated that different calibrations led to slightly different relative biases (
Table 5). For F08 and F11, the results from group two [
20] yielded the lowest relative bias, but the original group showed a lower relative bias than this in the population of snow pixels. For F11 and F13, group one [
21] yielded the lowest relative bias in the snow volume when the snow depth was greater than 0 cm. Group three yielded the lowest bias when the snow depth was greater than 10 cm. The original bias for the SCA (TBD > 0) was the lowest.
Therefore, the consistency in the snow data derived from the SSM/I(s) was high, and the inter-sensor calibration did not improve the consistency.
Table 5.
Relative biases in the SCA and snow volume from overlapping sensors over China at different snow depth range (a) for F08/F11 and (b) for F11/F13.
Table 5.
Relative biases in the SCA and snow volume from overlapping sensors over China at different snow depth range (a) for F08/F11 and (b) for F11/F13.
| (a) |
| Methods | SD > 0 | SD > 10 | SD > 20 |
| SCA Snow volume | SCA Snow volume | SCA Snow volume |
| Original | −5.80% | −3.73% | −3.63% | −3.03% | −2.97% | −2.06% |
| Group 1 | −9.89% | −3.03% | −8.09% | −6.26% | −12.66% | −11.34% |
| Group 2 | −6.29% | −1.85% | −4.76% | −4.00% | −3.81% | −2.89% |
| Group 3 | −8.71% | −1.89% | −7.67% | −5.80% | −12.88% | −11.55% |
| (b) |
| Methods | SD > 0 | SD > 10 | SD > 20 |
| SCA Snow volume | SCA Snow volume | SCA Snow volume |
| Original | 3.31% | 1.85% | 3.70% | 3.45% | 5.31% | 4.79% |
| Group 1 | 0.24% | −3.13% | 4.25% | 4.94% | 3.55% | 4.14% |
| Group 2 | 4.41% | −5.30% | 12.29% | 13.68% | 8.98% | 9.81% |
| Group 3 | −4.38% | −5.10% | −1.04% | −0.51% | −1.30% | −0.51% |
4.3. Comparison between the Snow-Cover Areas from PM and IMS
The temporal consistency of the SCA and snow depth in China was improved through the inter-sensor calibration, but it is difficult to determine which sensor is best suited to be a reference, and other sensors were calibrated based on this sensor because different reference data lead to different snow depth data. Therefore, in this section, SCAs from the SSM/I and SSMI/S were compared with SCA from the Interactive Multisensor Snow and Ice Mapping System (IMS) to determine the reference sensor.
The IMS SCA product was produced based on daily manual visual analyses of satellite data by experienced analysts using multiple types of optical and microwave remote sensing data [
29]. Initially, the IMS SCA product was produced with a nominal spatial resolution of 190 km and a temporal resolution of seven days. Since 1997, the IMS has provided daily snow data with a nominal resolution of 24 km. Since February 2004, the IMS began providing daily products with a nominal resolution of 4 km [
30]. In this study, the IMS snow cover data with a spatial resolution of 4 km was used as the reference to determine the most effective PMW sensor for monitoring snow cover.
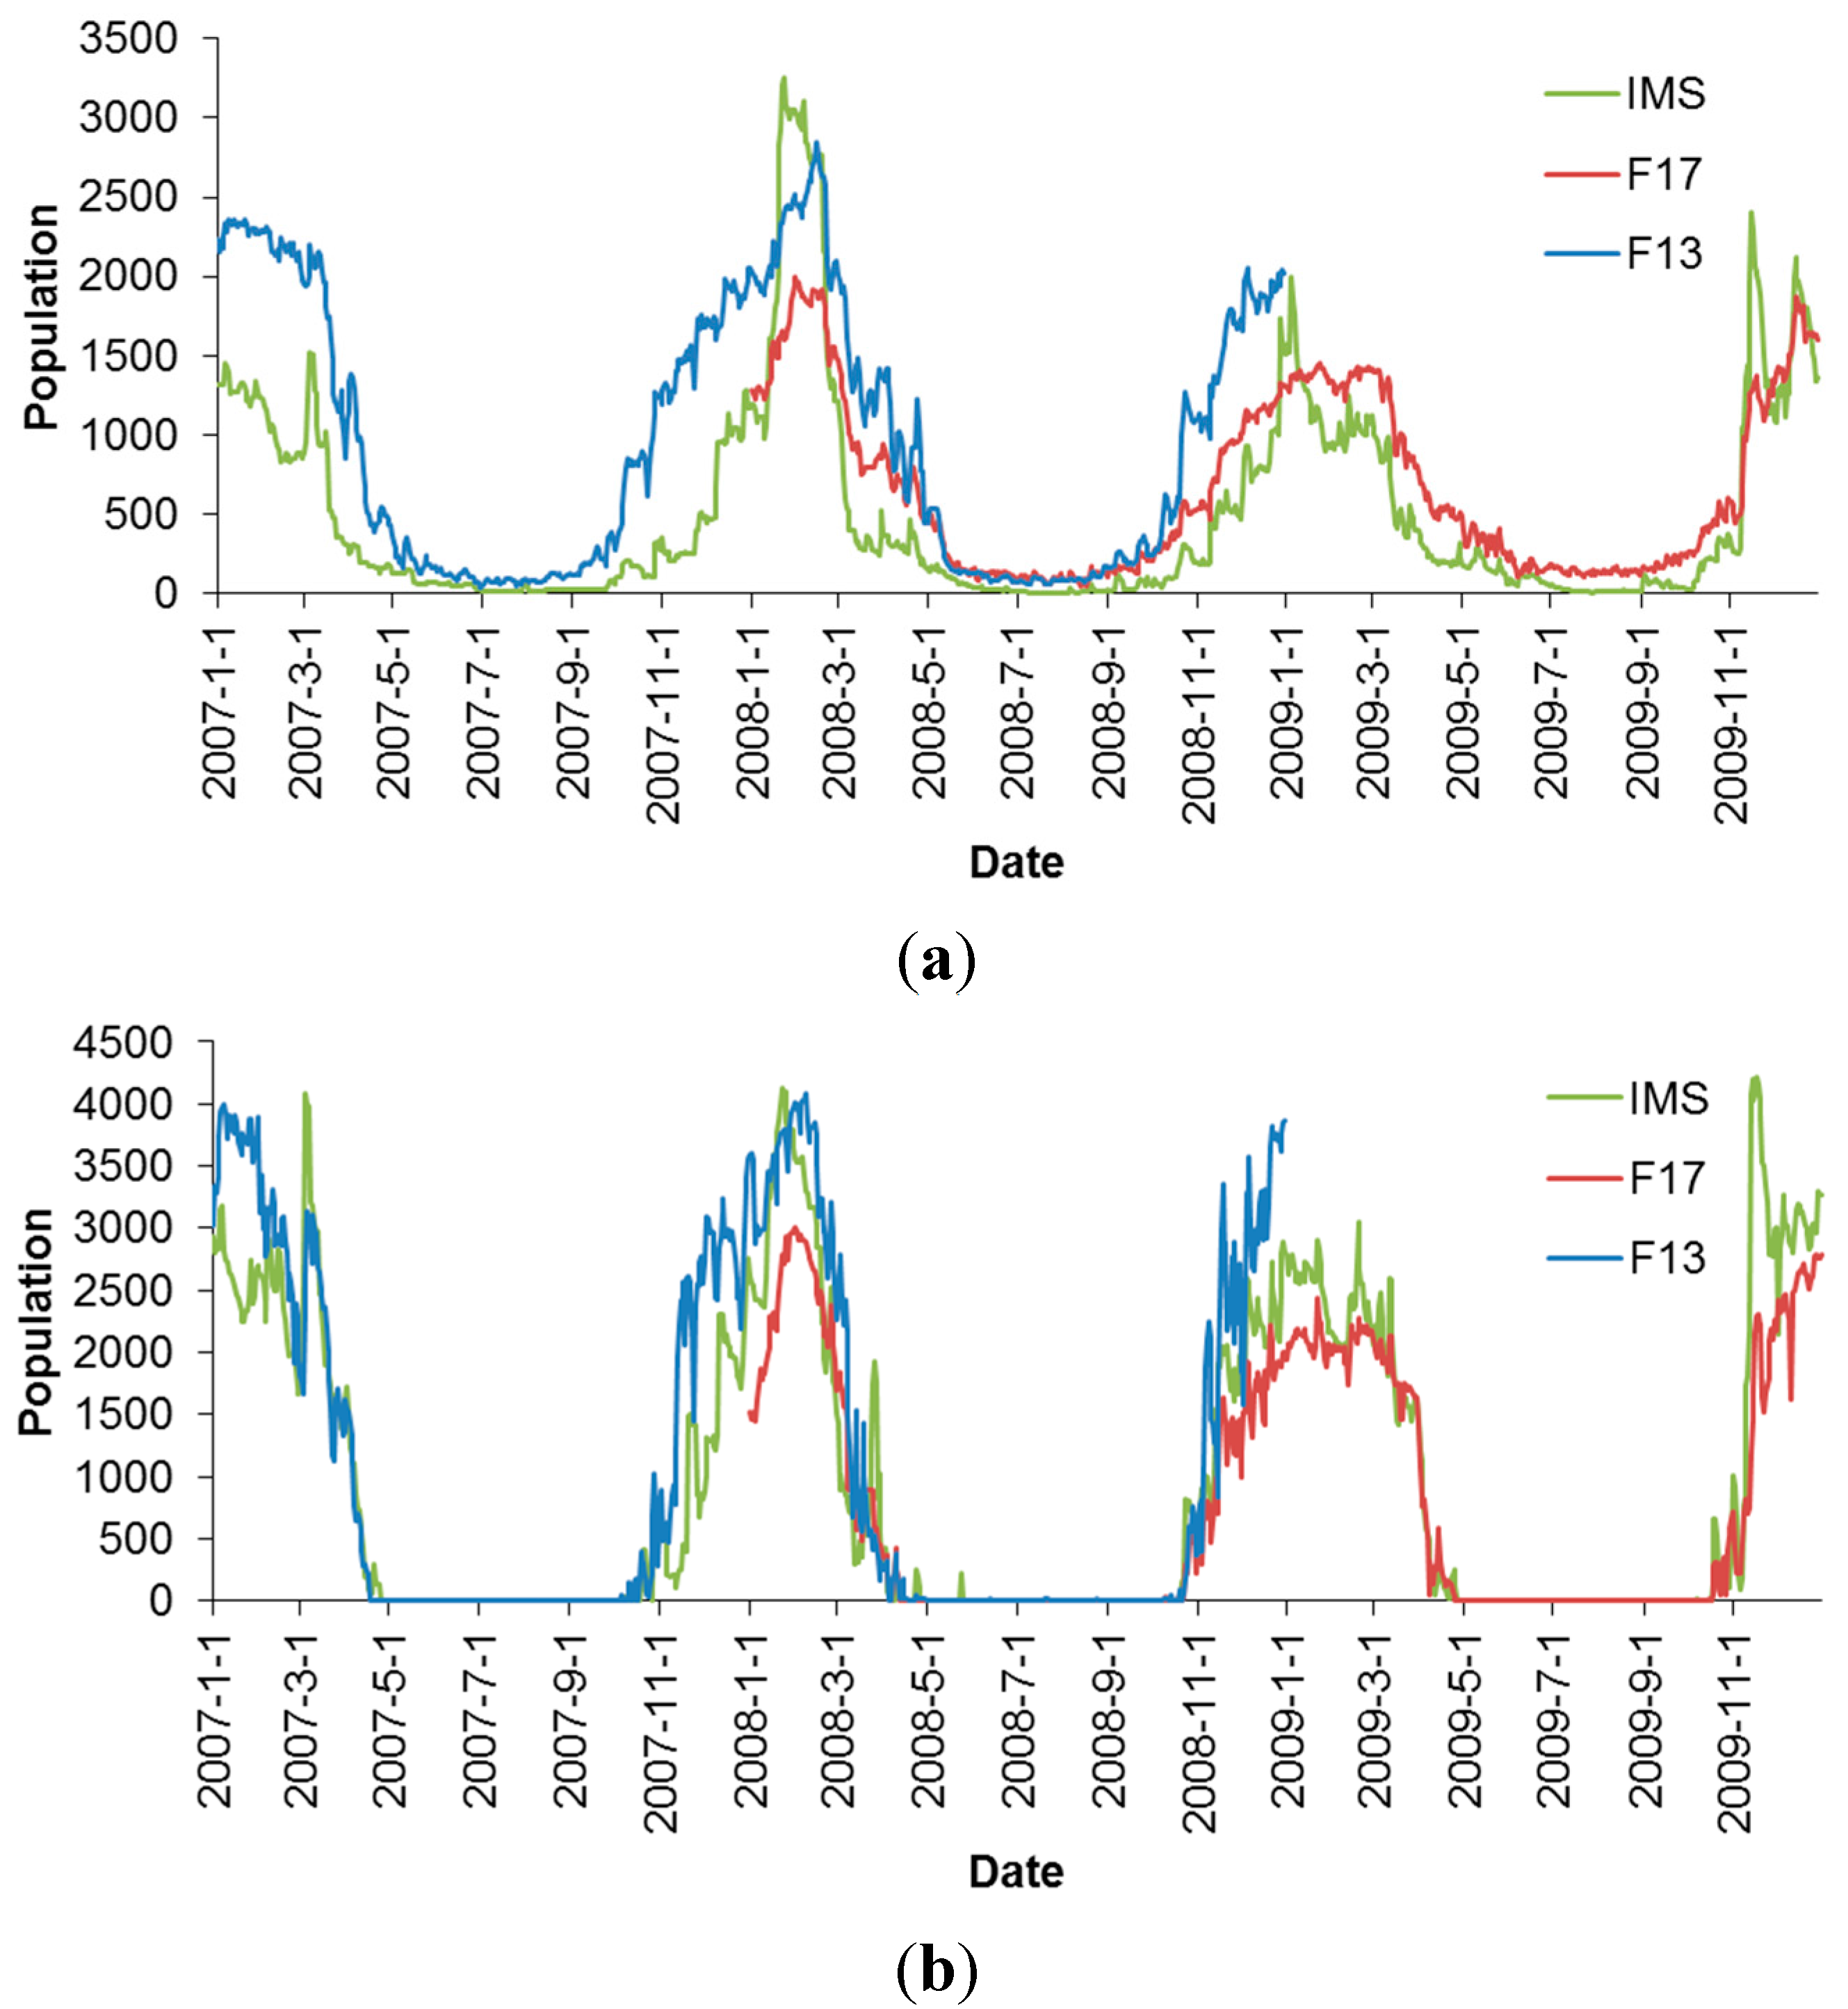
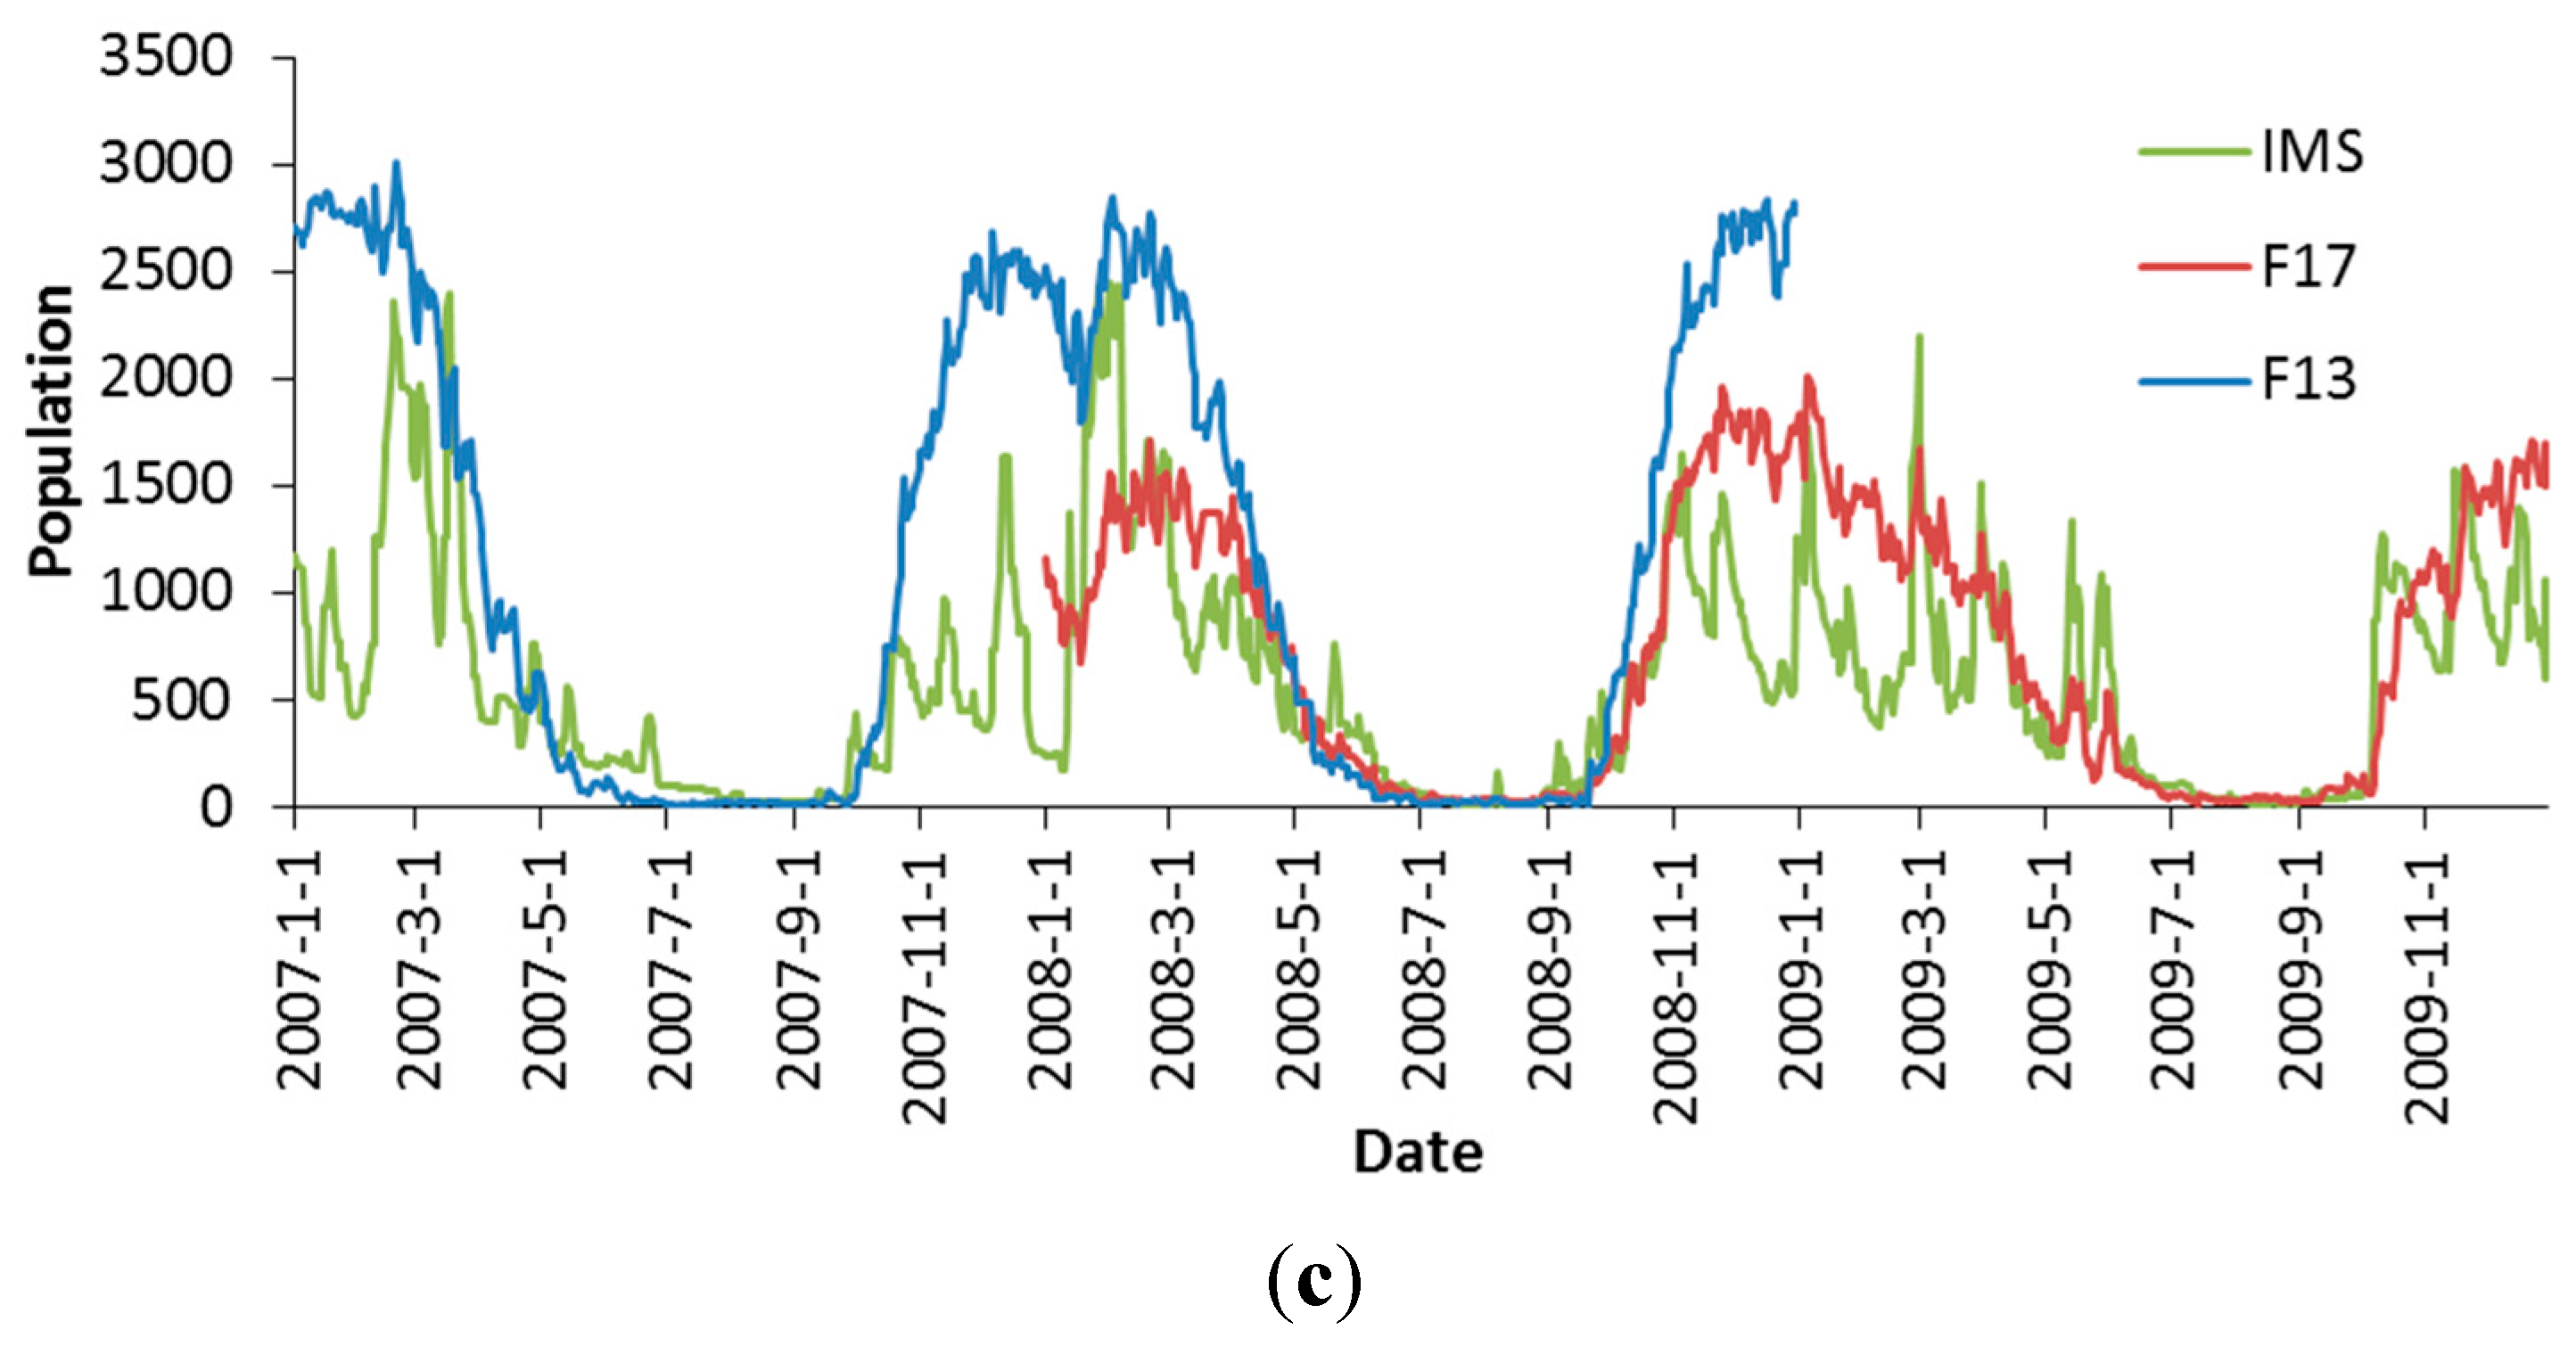
We resampled the IMS data with a spatial resolution of 4 km to the spatial resolution of the PMW data and calculated the snow cover fraction. The pixels with snow cover fractions greater than 50% were assumed to be covered by snow. The population of snow-covered pixels in the IMS data from 2007 to 2009 was used as a reference, and the relative bias in the SCA derived from F13 and F17 was calculated. Generally, the relative biases between F17 and IMS were 18.1% in the northwest, −20.4% in the northeast, and 82.9% in the Tibetan Plateau. The relative biases between F13 and IMS were 72.9% in the northwest, 22.7% in the northeast, and 148.9% in the QTP. F13 reflected the peak value in the IMS, whereas F17 tended to underestimate the peak value (
Figure 6).
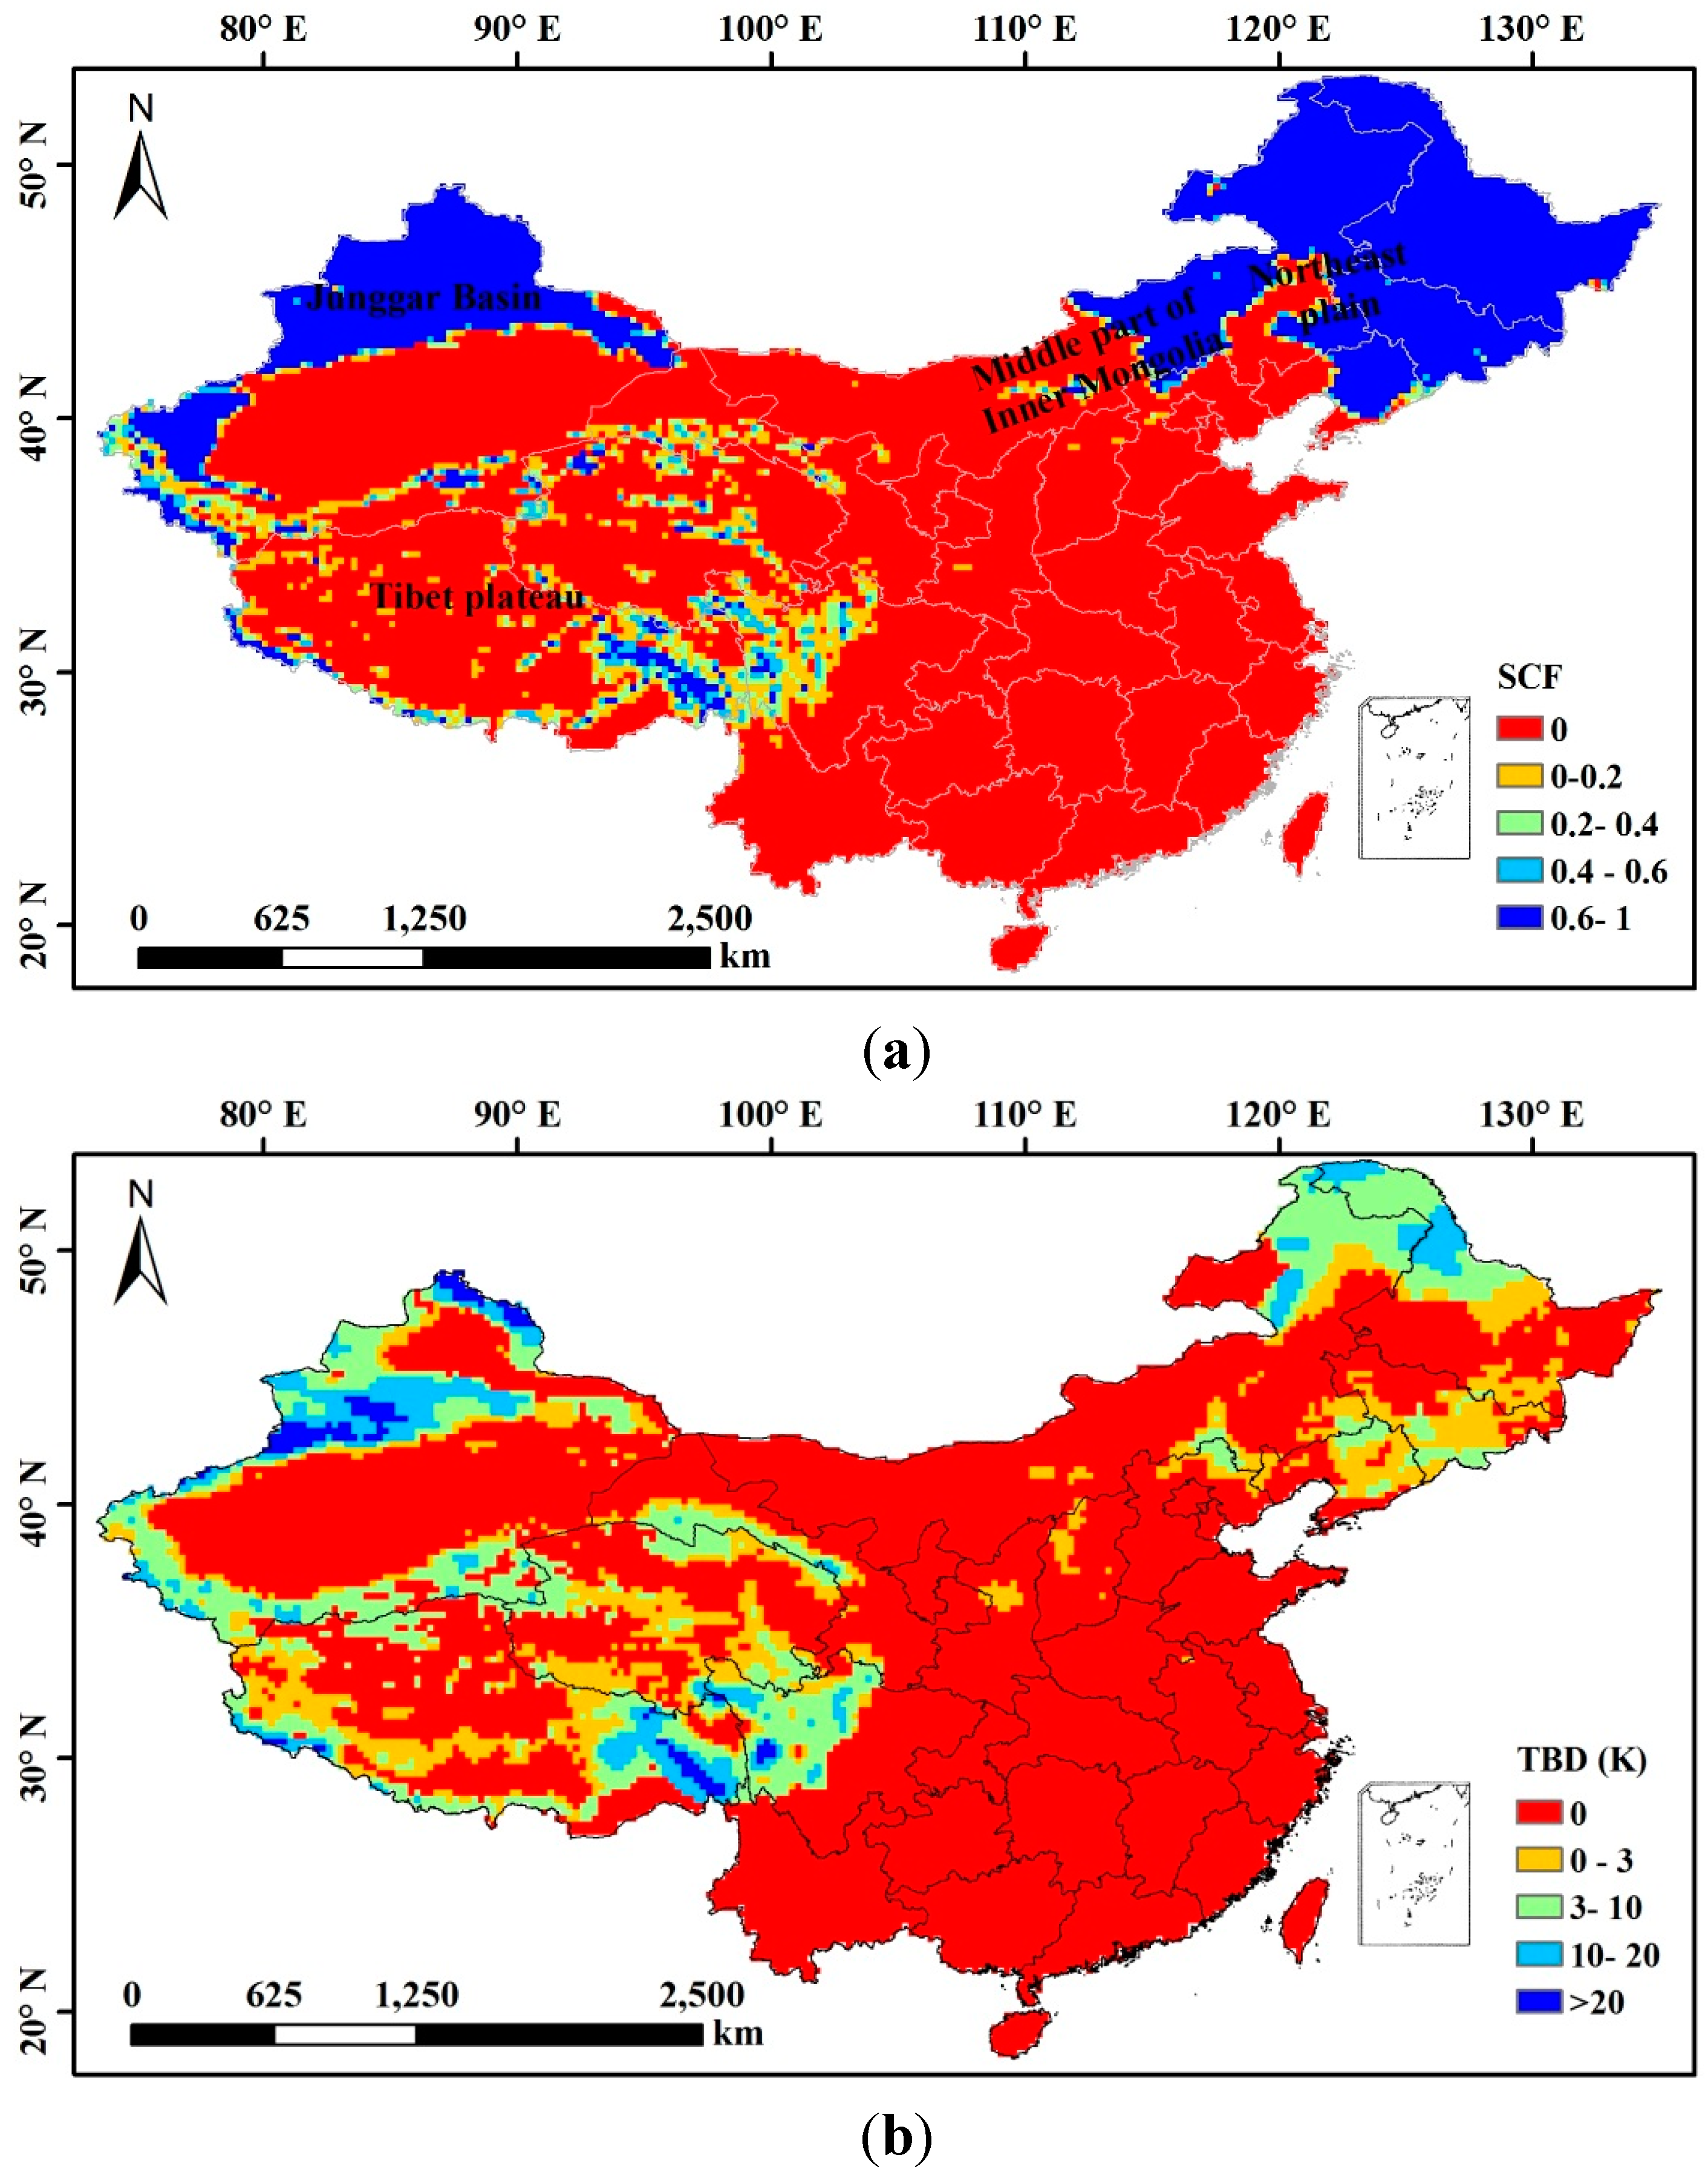
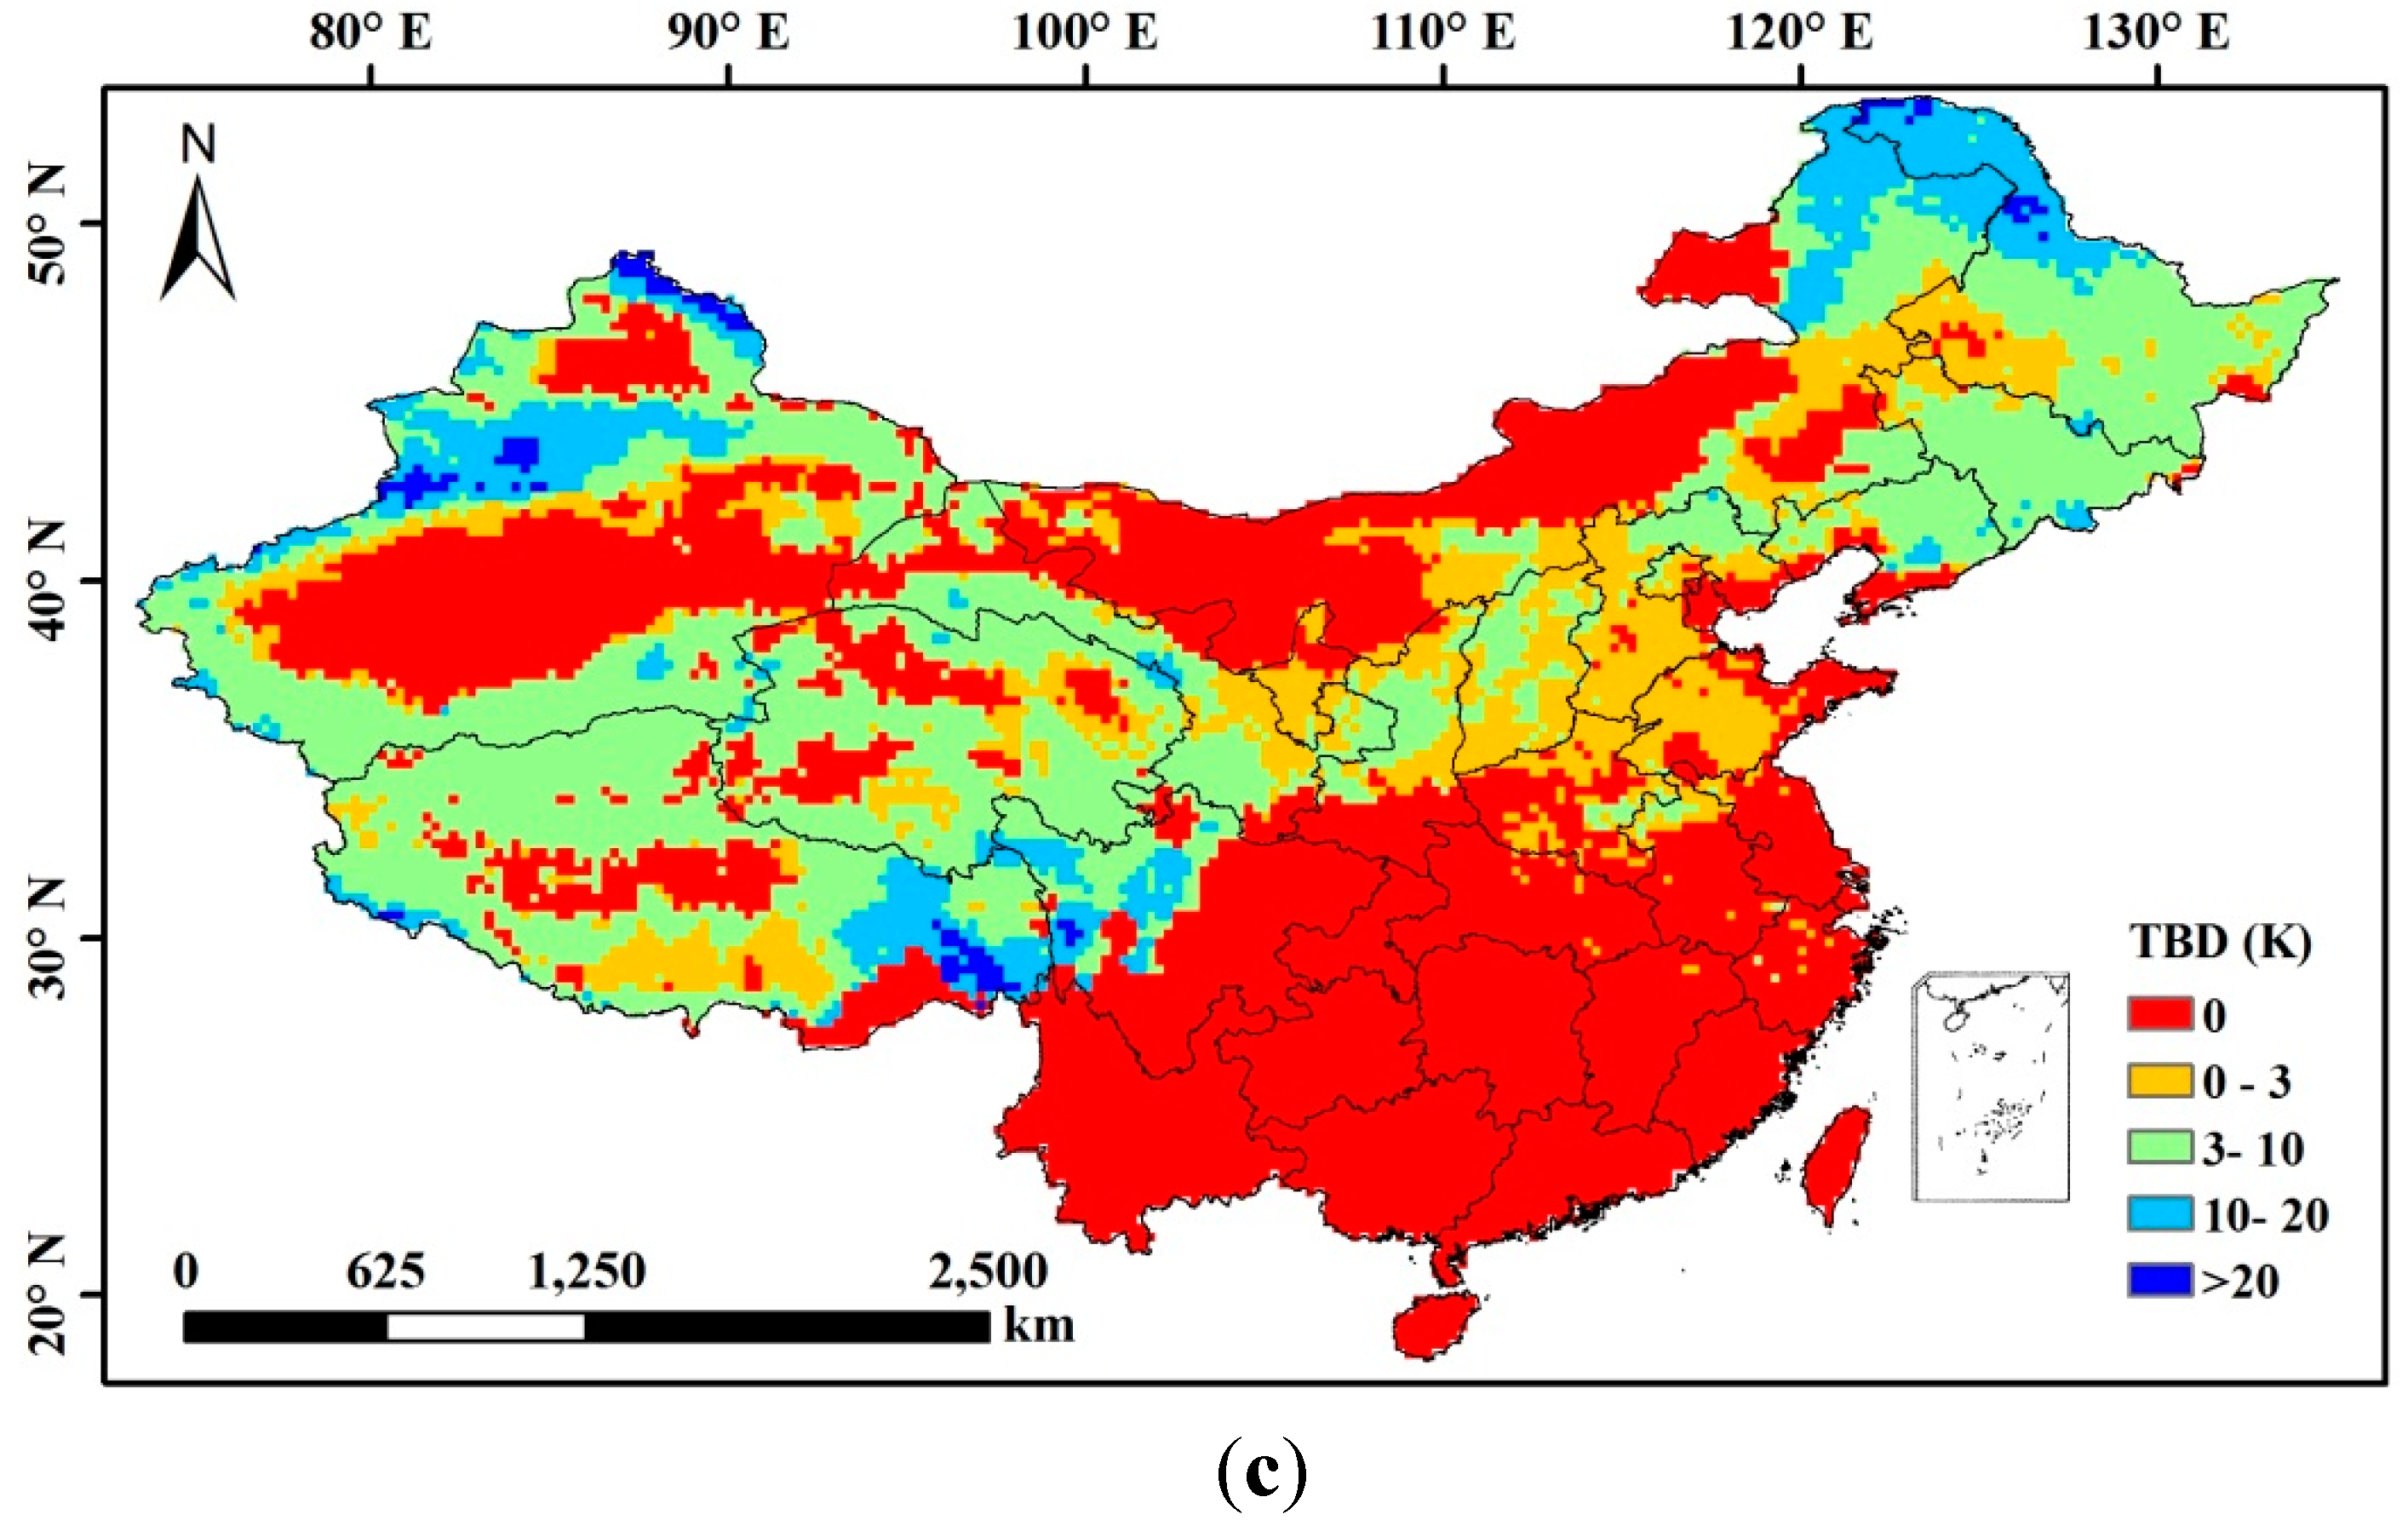
Spatially, the main differences were located in the northeast plain, central Inner Mongolia in the northeast, the Junggar Basin in the northwest, and the QTP. In the northeast plain, the SCA from F17 was less than that from the IMS and F13. In central Inner Mongolia and in the Junggar Basin, the SCA from the IMS was greater than that from F17 and F13. In the QTP, the SCA from the IMS was much smaller than that from F17 and F13. F13 produced a large snow area in central China, but the IMS and F17 showed no snow in this area (
Figure 7).
Figure 6.
Population of snow-covered pixels from F17, F13 and IMS: (a) Northwest; (b) Northeast; and (c) QTP.
Figure 6.
Population of snow-covered pixels from F17, F13 and IMS: (a) Northwest; (b) Northeast; and (c) QTP.
Figure 7.
Spatial distribution of snow cover fraction (SCF) from the IMS (a) and in TBD from F17 (b) and F13 (c) over China on 1 January 2008.
Figure 7.
Spatial distribution of snow cover fraction (SCF) from the IMS (a) and in TBD from F17 (b) and F13 (c) over China on 1 January 2008.
Therefore, based on IMS snow cover, it remains difficult to determine which sensor was used as the reference. Due to the stop of SSM/I in 2009 and the continuous operation of SSMI/S, we suggested SSMI/S data as the reference in consideration of the snow dataset continuation. However, high-quality, long-term products require not only temporal consistency but also an emphasis on retrieval accuracy. The decision tree method in [
25] cannot discern shallow snow or classify other scatters to shallow snow in some areas in China. Therefore, to improve the accuracy of the retrieved snow cover, we also suggest that a suitable criterion for identifying the snow cover in China should be developed based on SSMI/S.
5. Conclusions
In this study, we inter-calibrated the brightness temperatures from SSM/I(F13) and SSMI/S(F17), and we evaluated the consistency of the snow cover area (SCA) and snow depth products in China derived from SMMR, SSM/I and SSMI/S data.
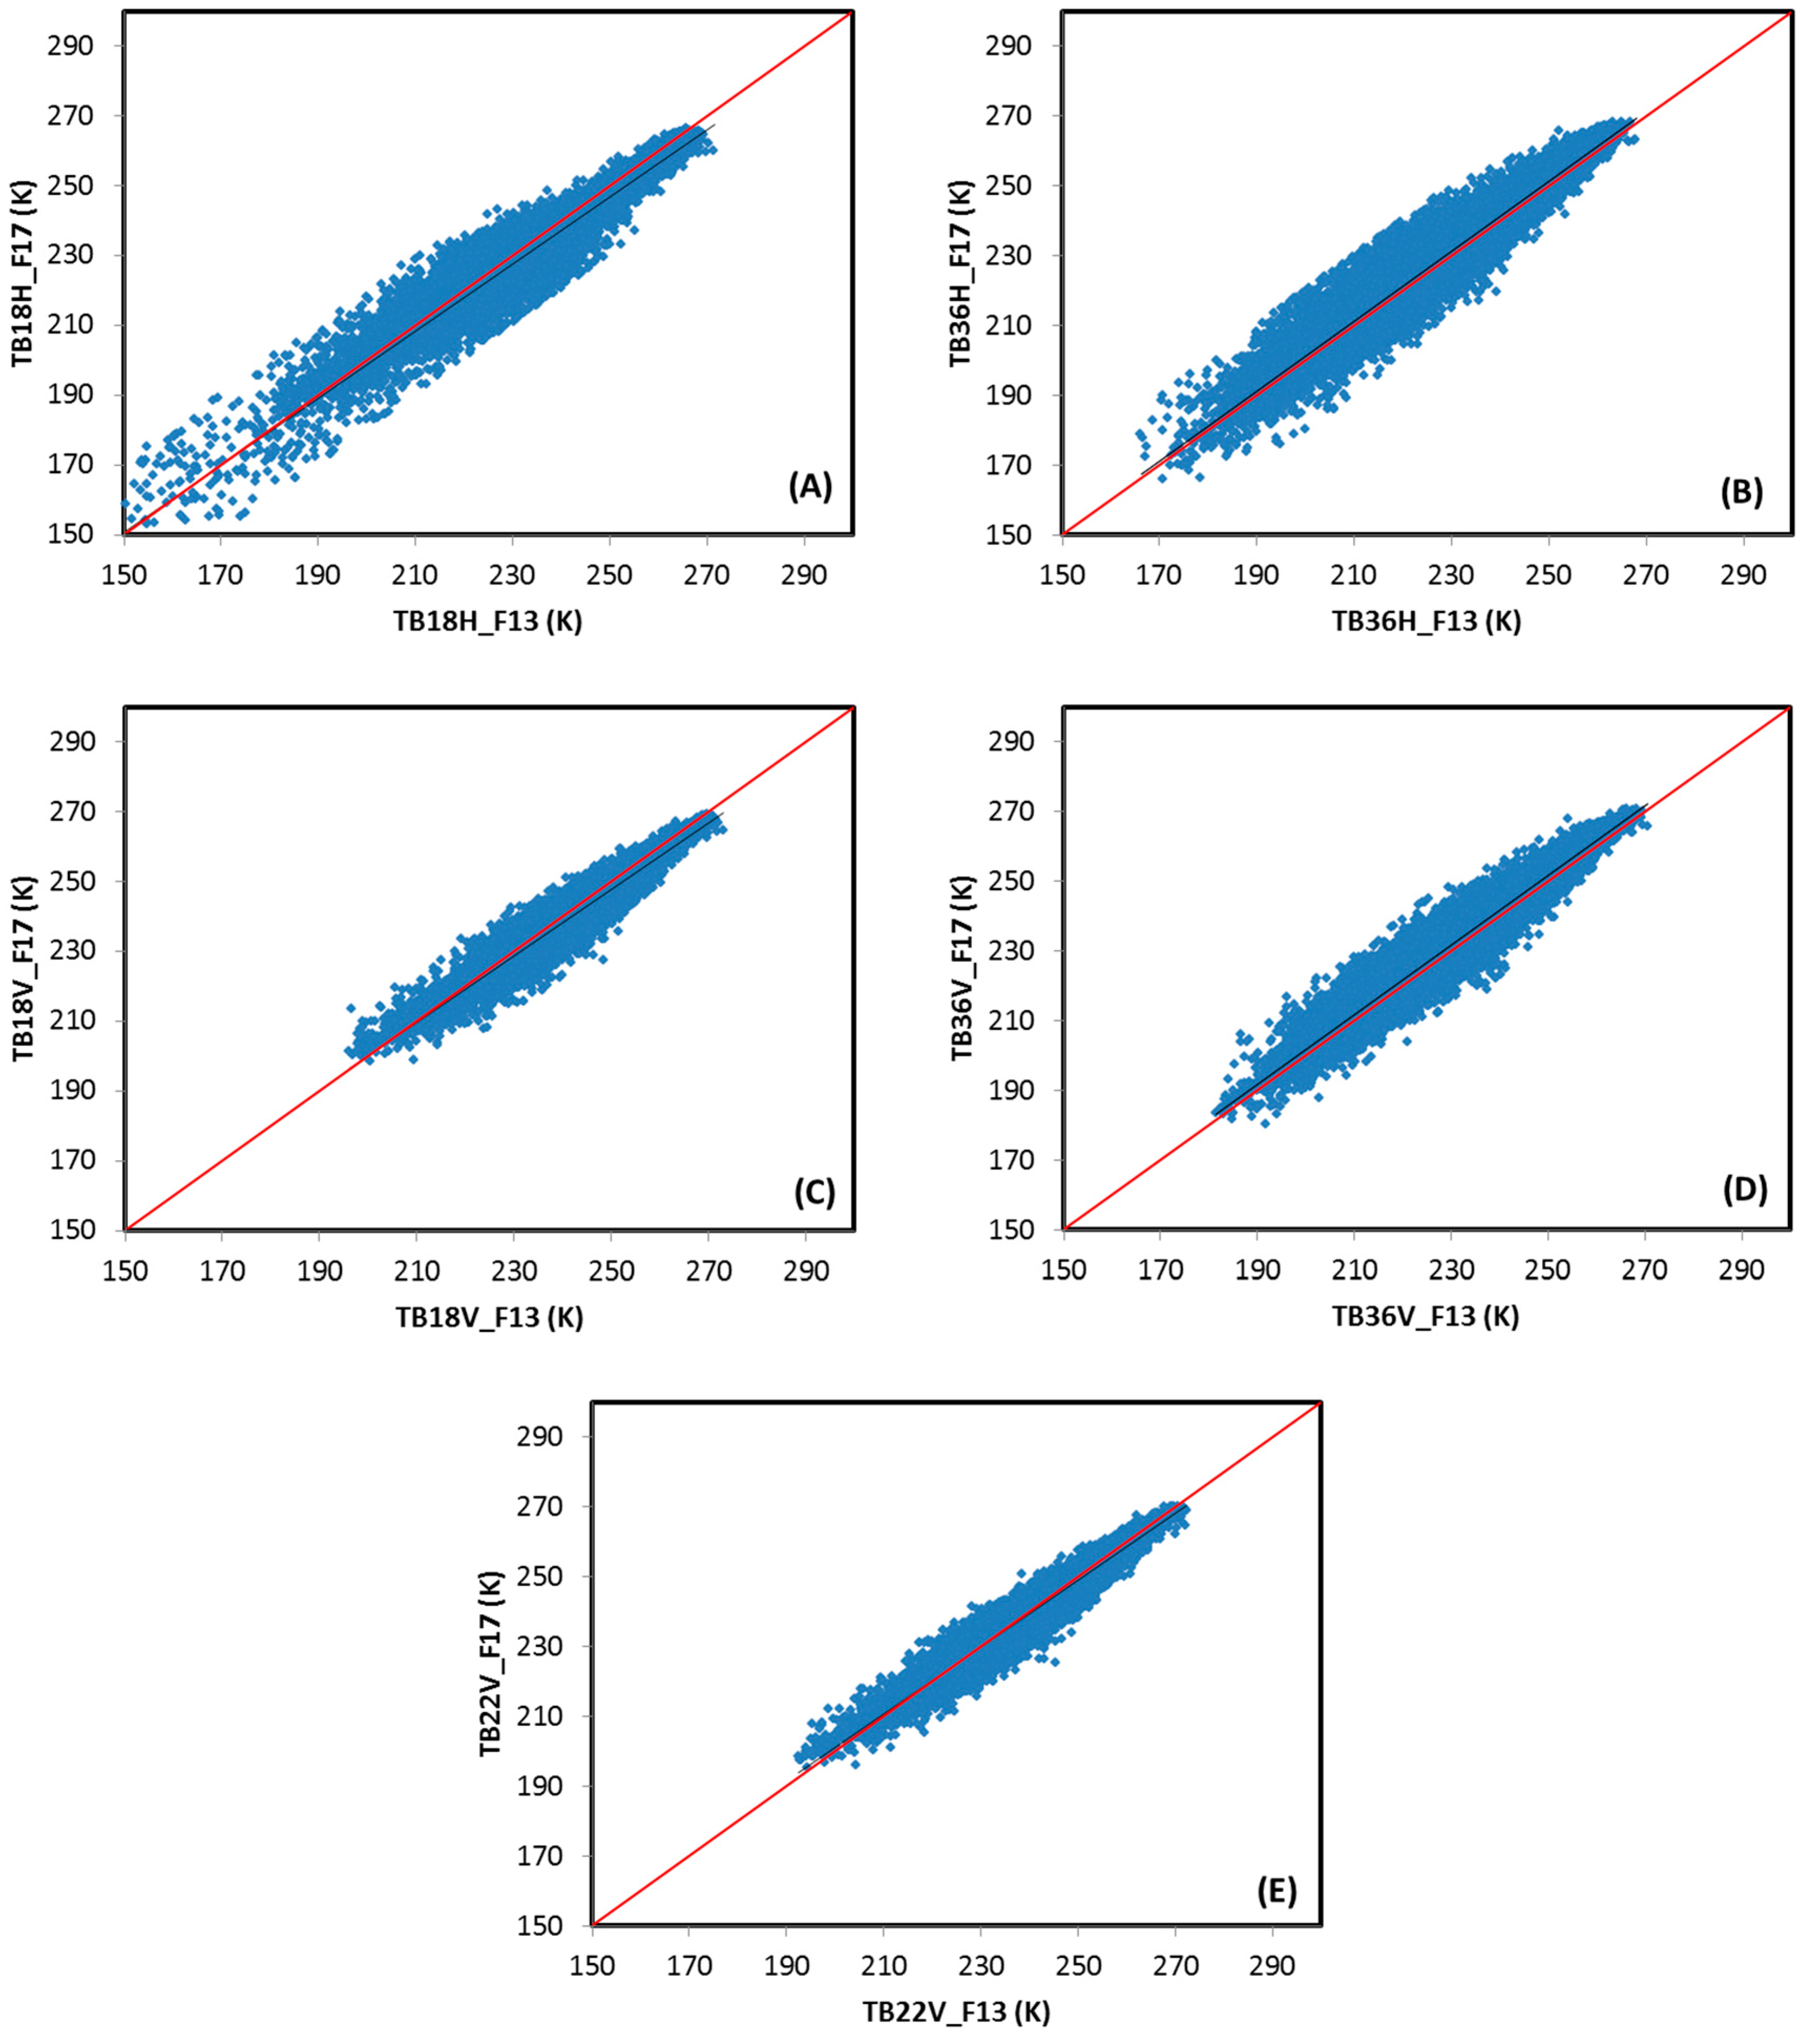
Inter-sensor calibration substantially improved the consistency of the brightness temperature from the SSM/I(F13) and SSMI/S(F17) in China. The correlation coefficients of the population of the Tb at channels 18 H&V, 36 H&V and 22V increased from 0.9763 to 0.9997, from 0.9987 to 0.9989, from 0.9733 to 0.9982, from 0.9965 to 0.9970, and from 0.9853 to 0.9972, respectively. The calibration also improved the relative biases in the SCA and snow volume from 42.42% to 1.65% and from 66.18% to −1.5%, respectively.
A comparison of the multi-year snow cover distribution in China showed that the consistency in the snow cover distribution derived from SMMR and SSM/I data improved after the calibration. The relative biases in the SCA and snow depth decreased from 134.9% and 112.3% to −33.1% and −29.2%, respectively.
The consistency in the SCA and snow depth derived from the SSM/I(F08) and SSM/I(F11), and SSM/I(F11) and SSM/I(F13) data were high; thus, a calibration between SSM/I(s) for SCA and snow depth was unnecessary.
In summary, inter-sensor calibration improved the consistency of the snow depth product in China. We can obtain a temporally consistent, long-term series of snow depth datasets over China using SSMI/S(F17) data as reference. On the other hand, to improve the accuracy of snow depth and snow cover data products, a suitable snow identification method for passive microwave should be developed over China.


