
A Method for Exploring the Link between Urban Area Expansion over Time and the Opportunity for Crime in Saudi Arabia


Abstract
:
1. Introduction
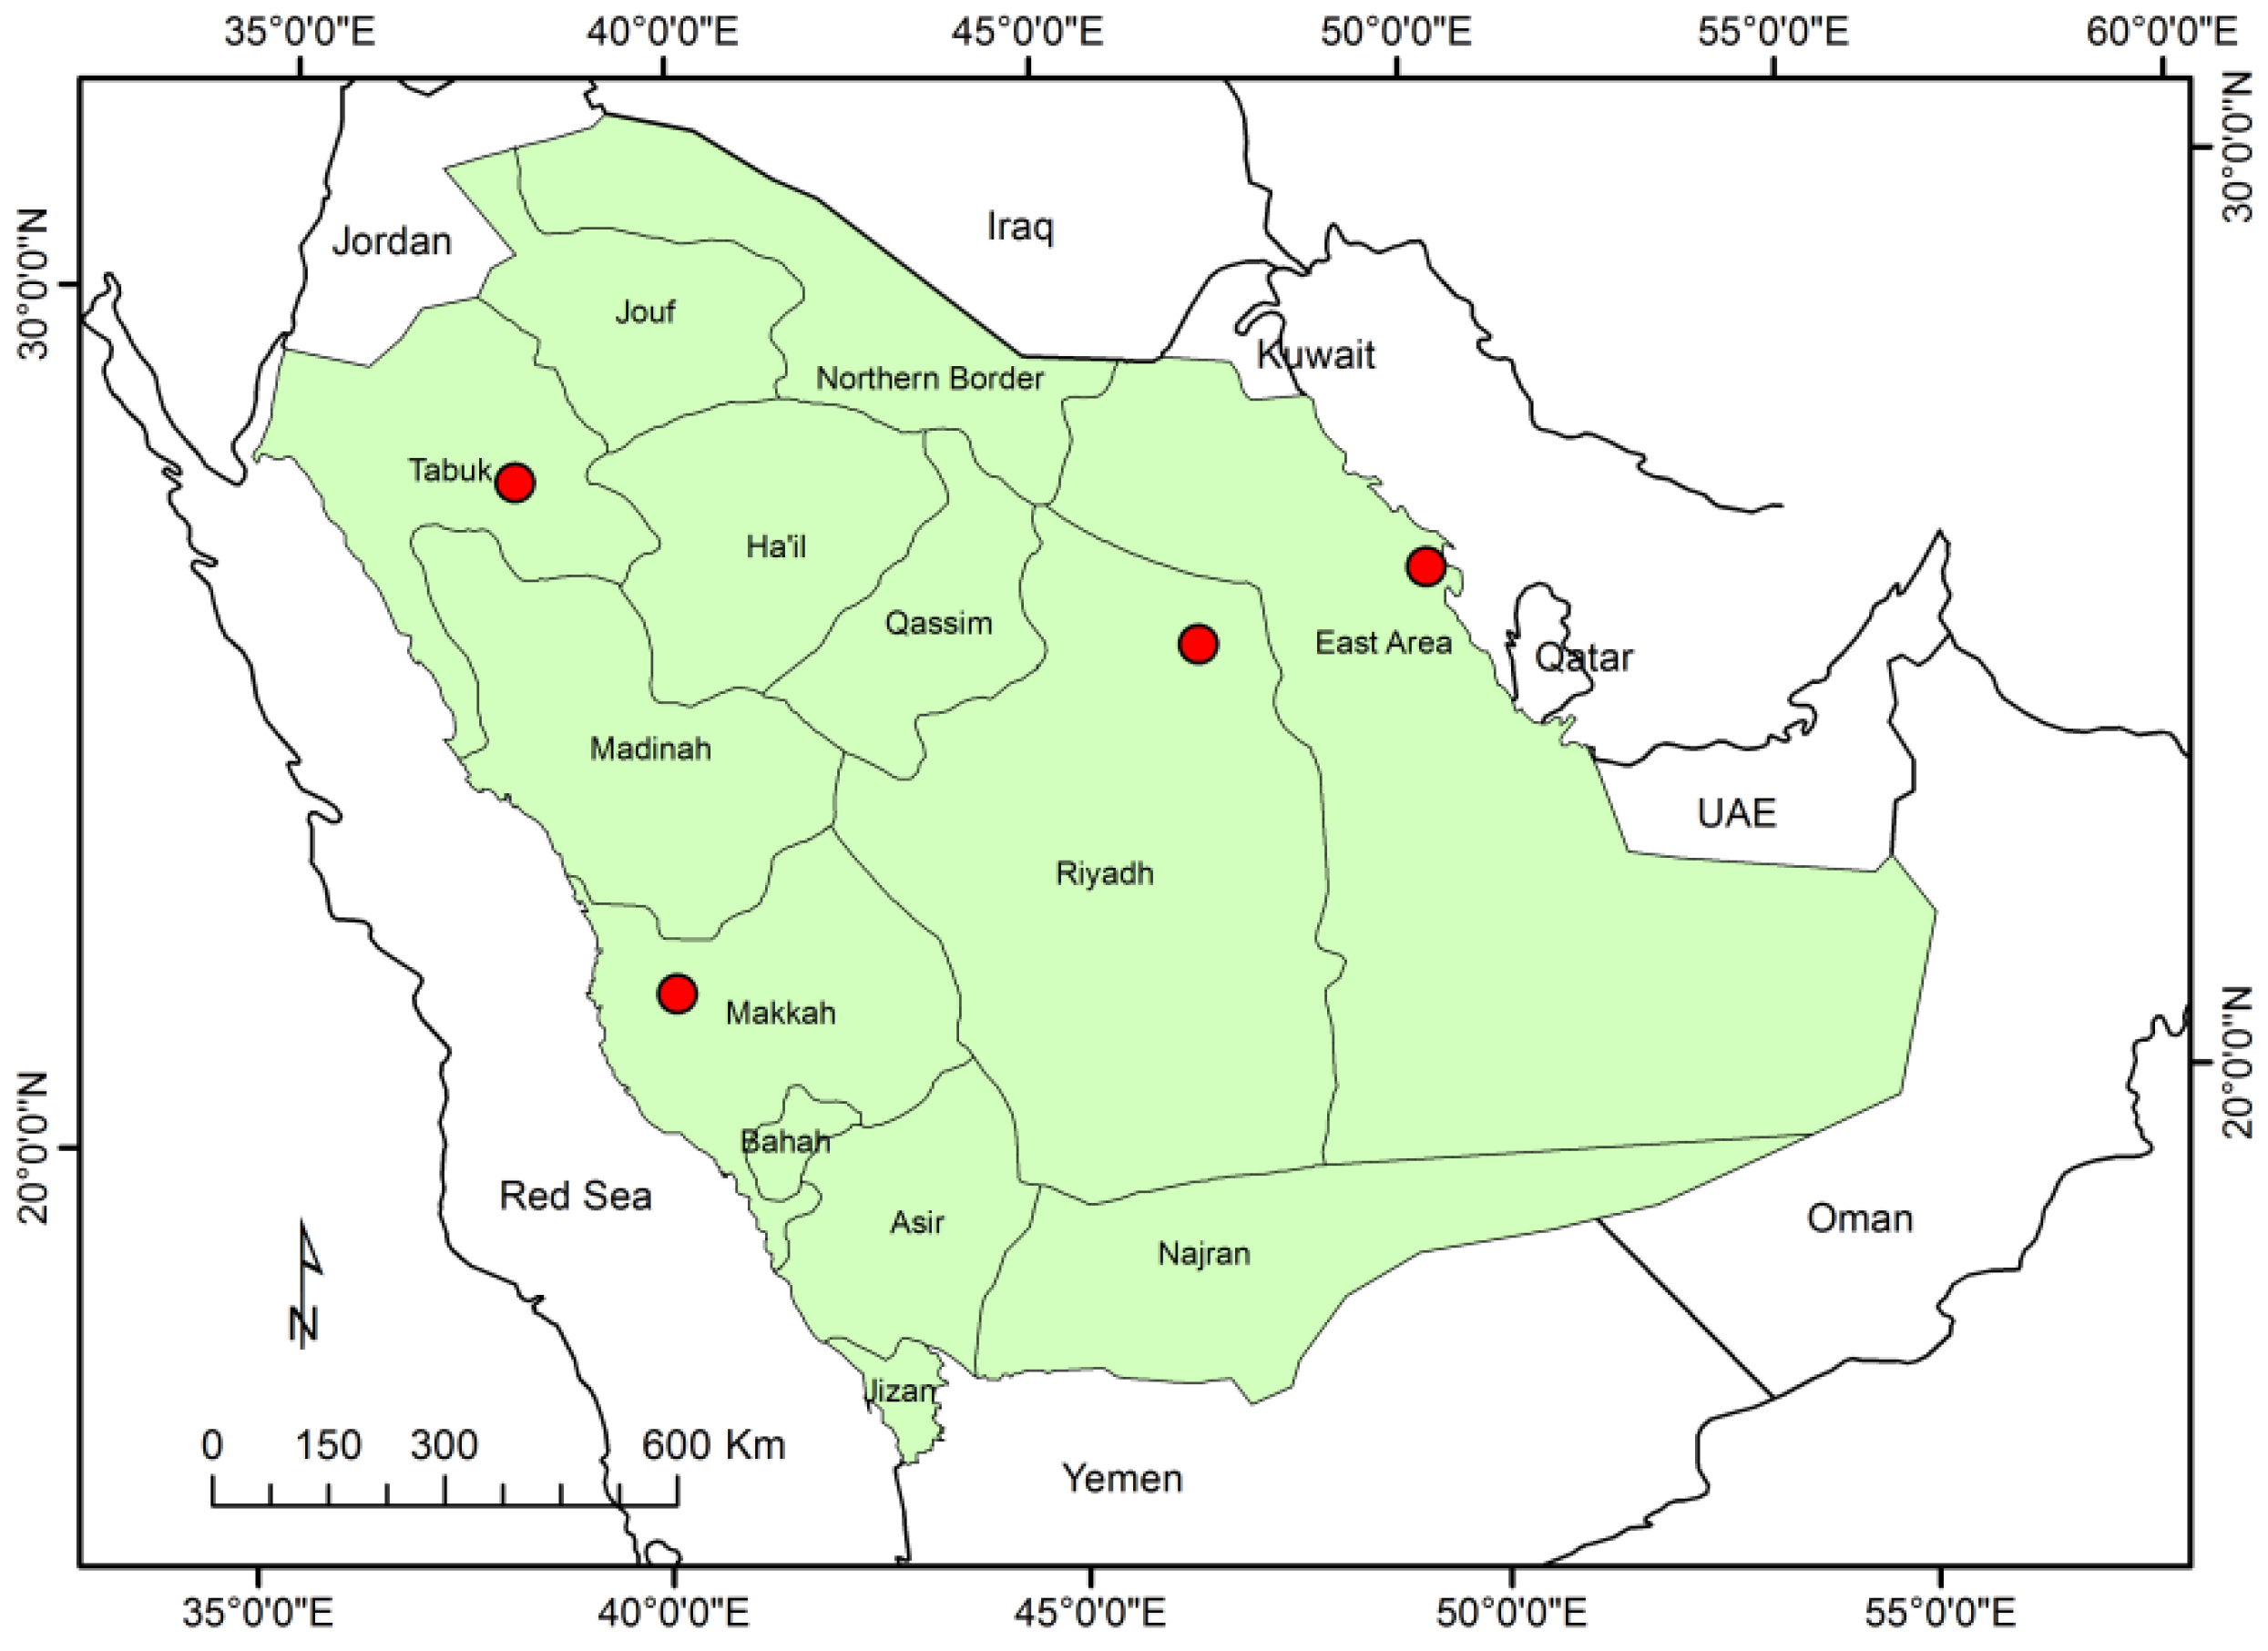
2. Study Area
3. Data
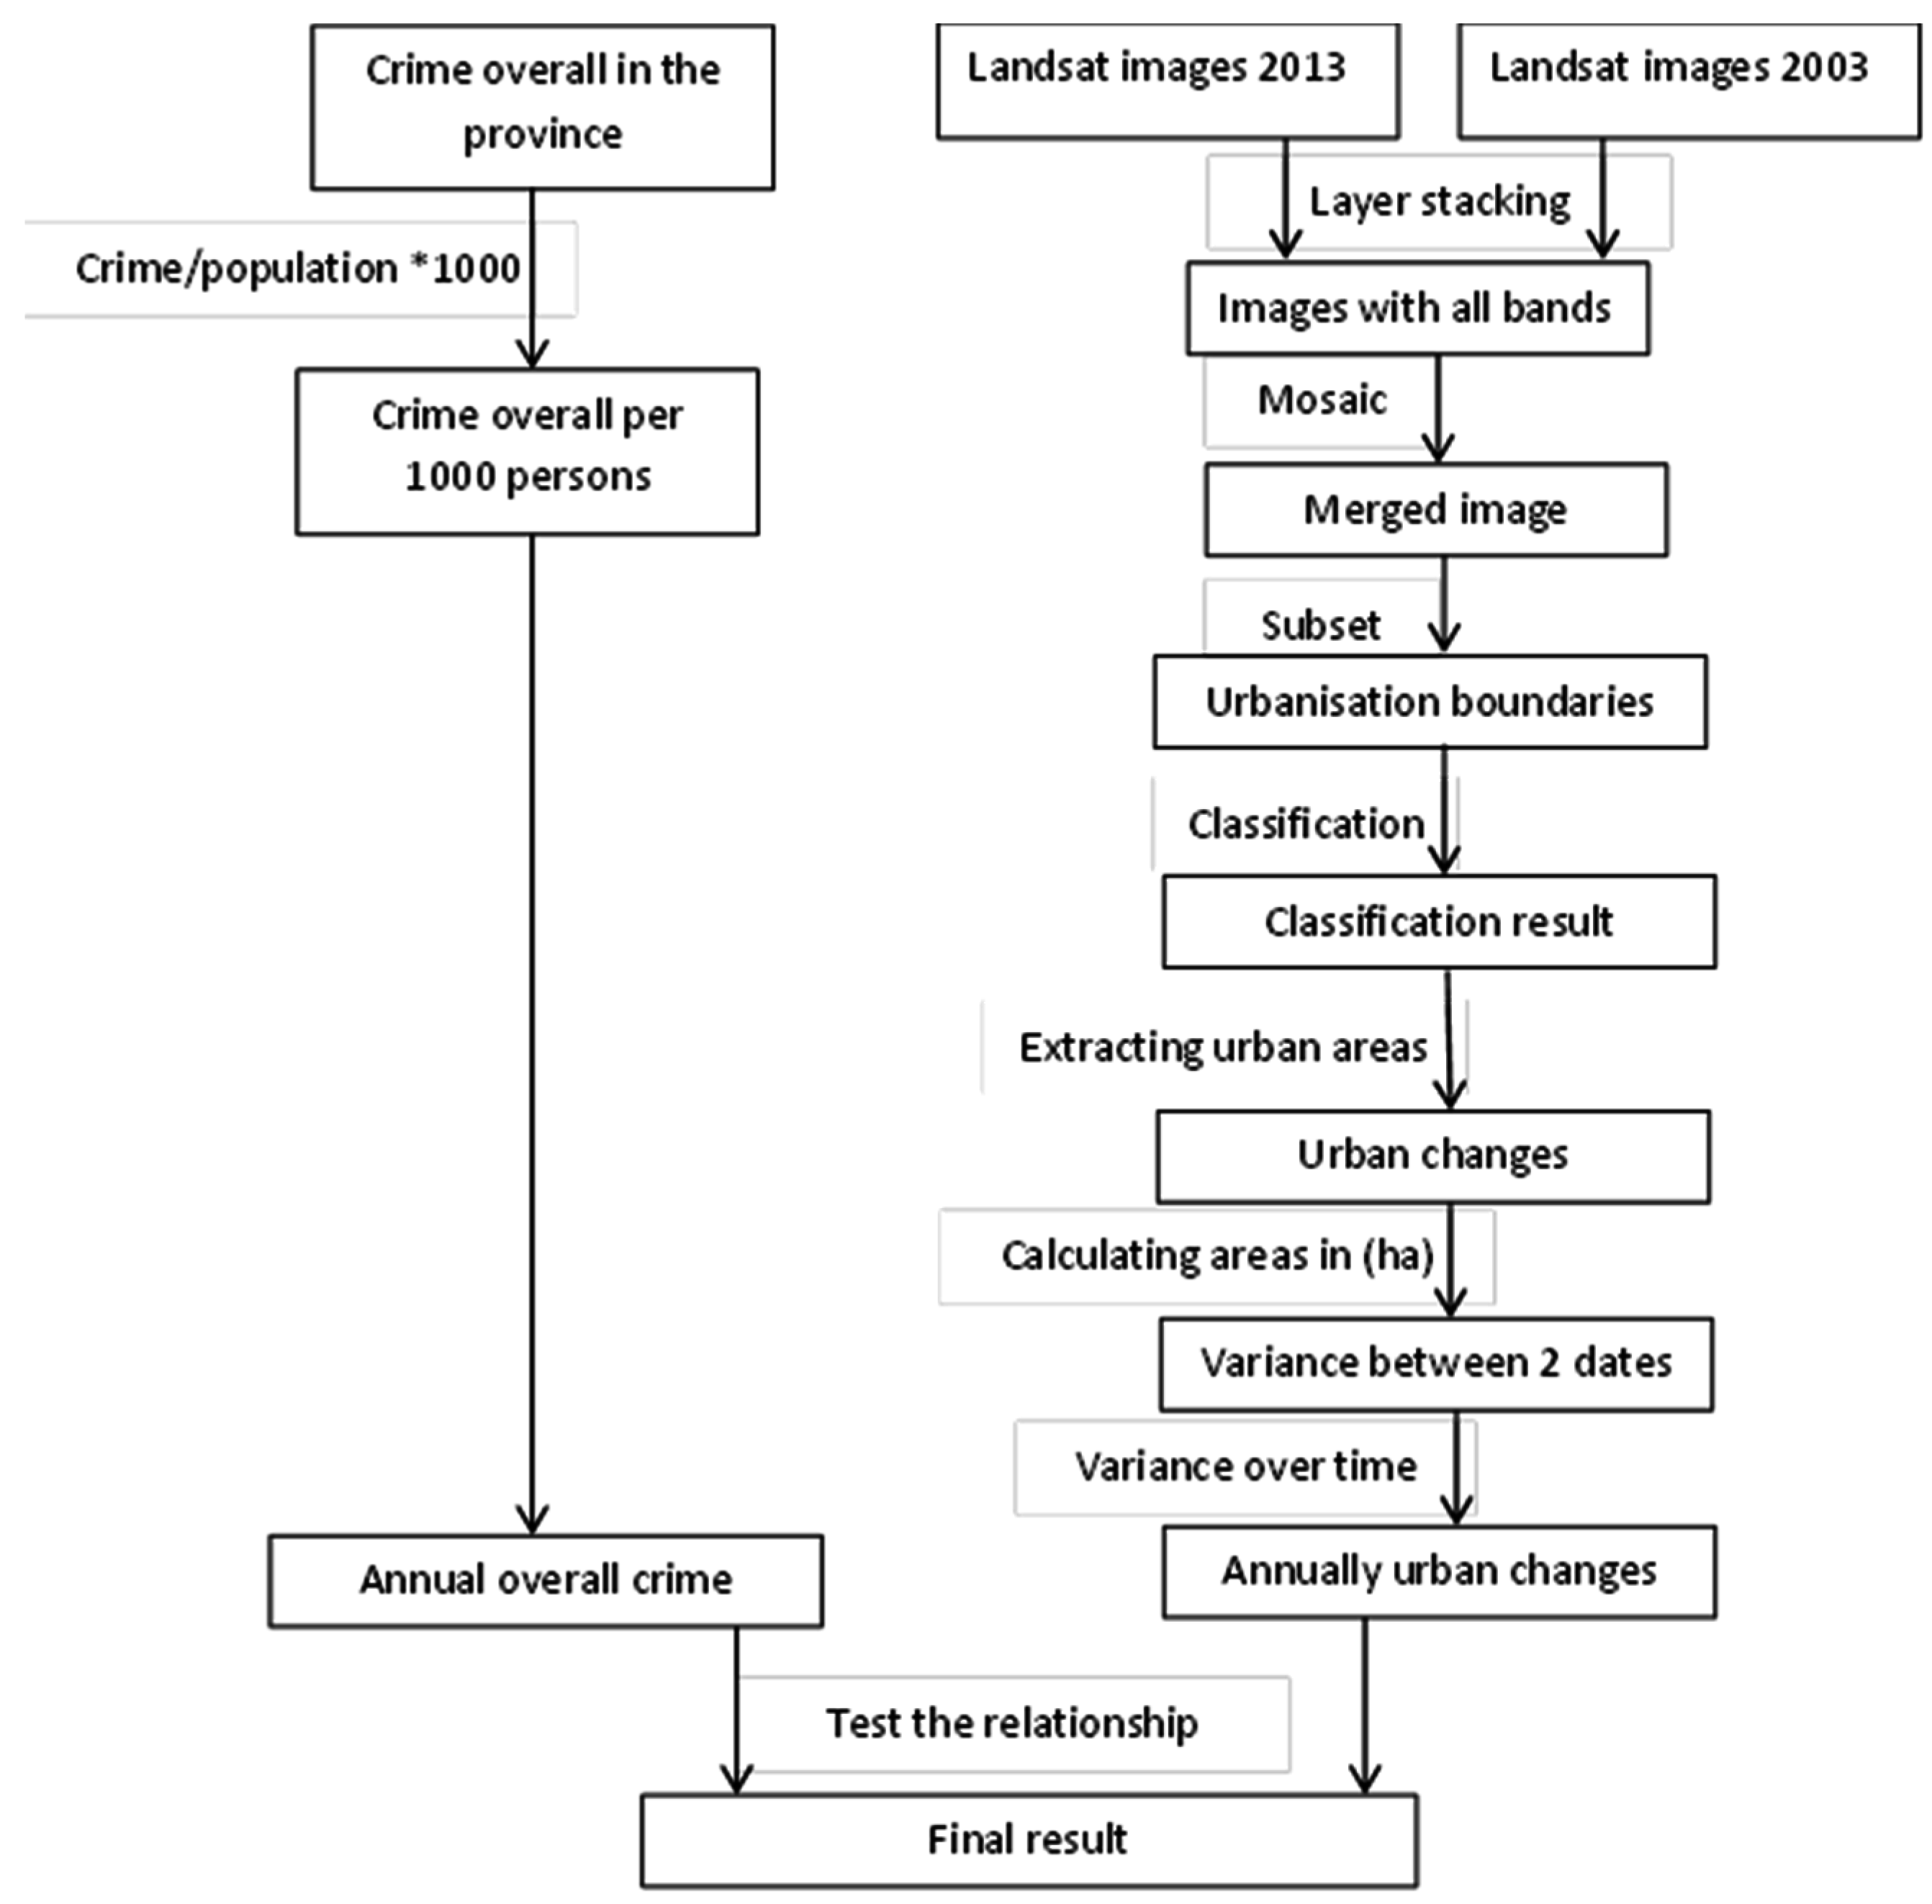
3.1. Population and Criminal Data
3.2. Satellite Data
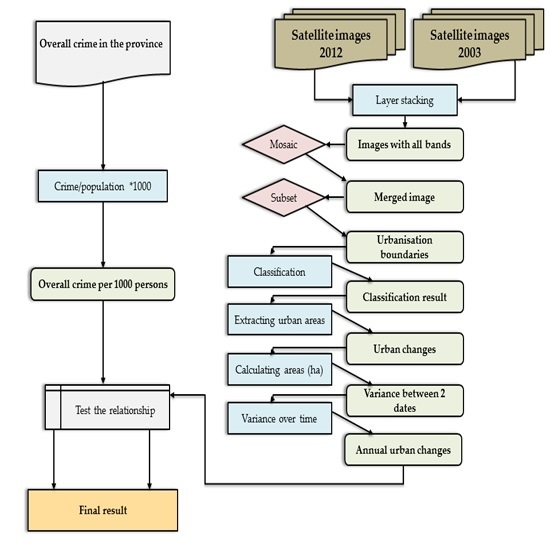
4. Processing
4.1. Image-to-Image Geometric Registration
4.2. Mosaic Processing
4.3. Images Subset
4.4. Classifications and Accuracy Assessment
4.5. Statistical Approach
5. Results
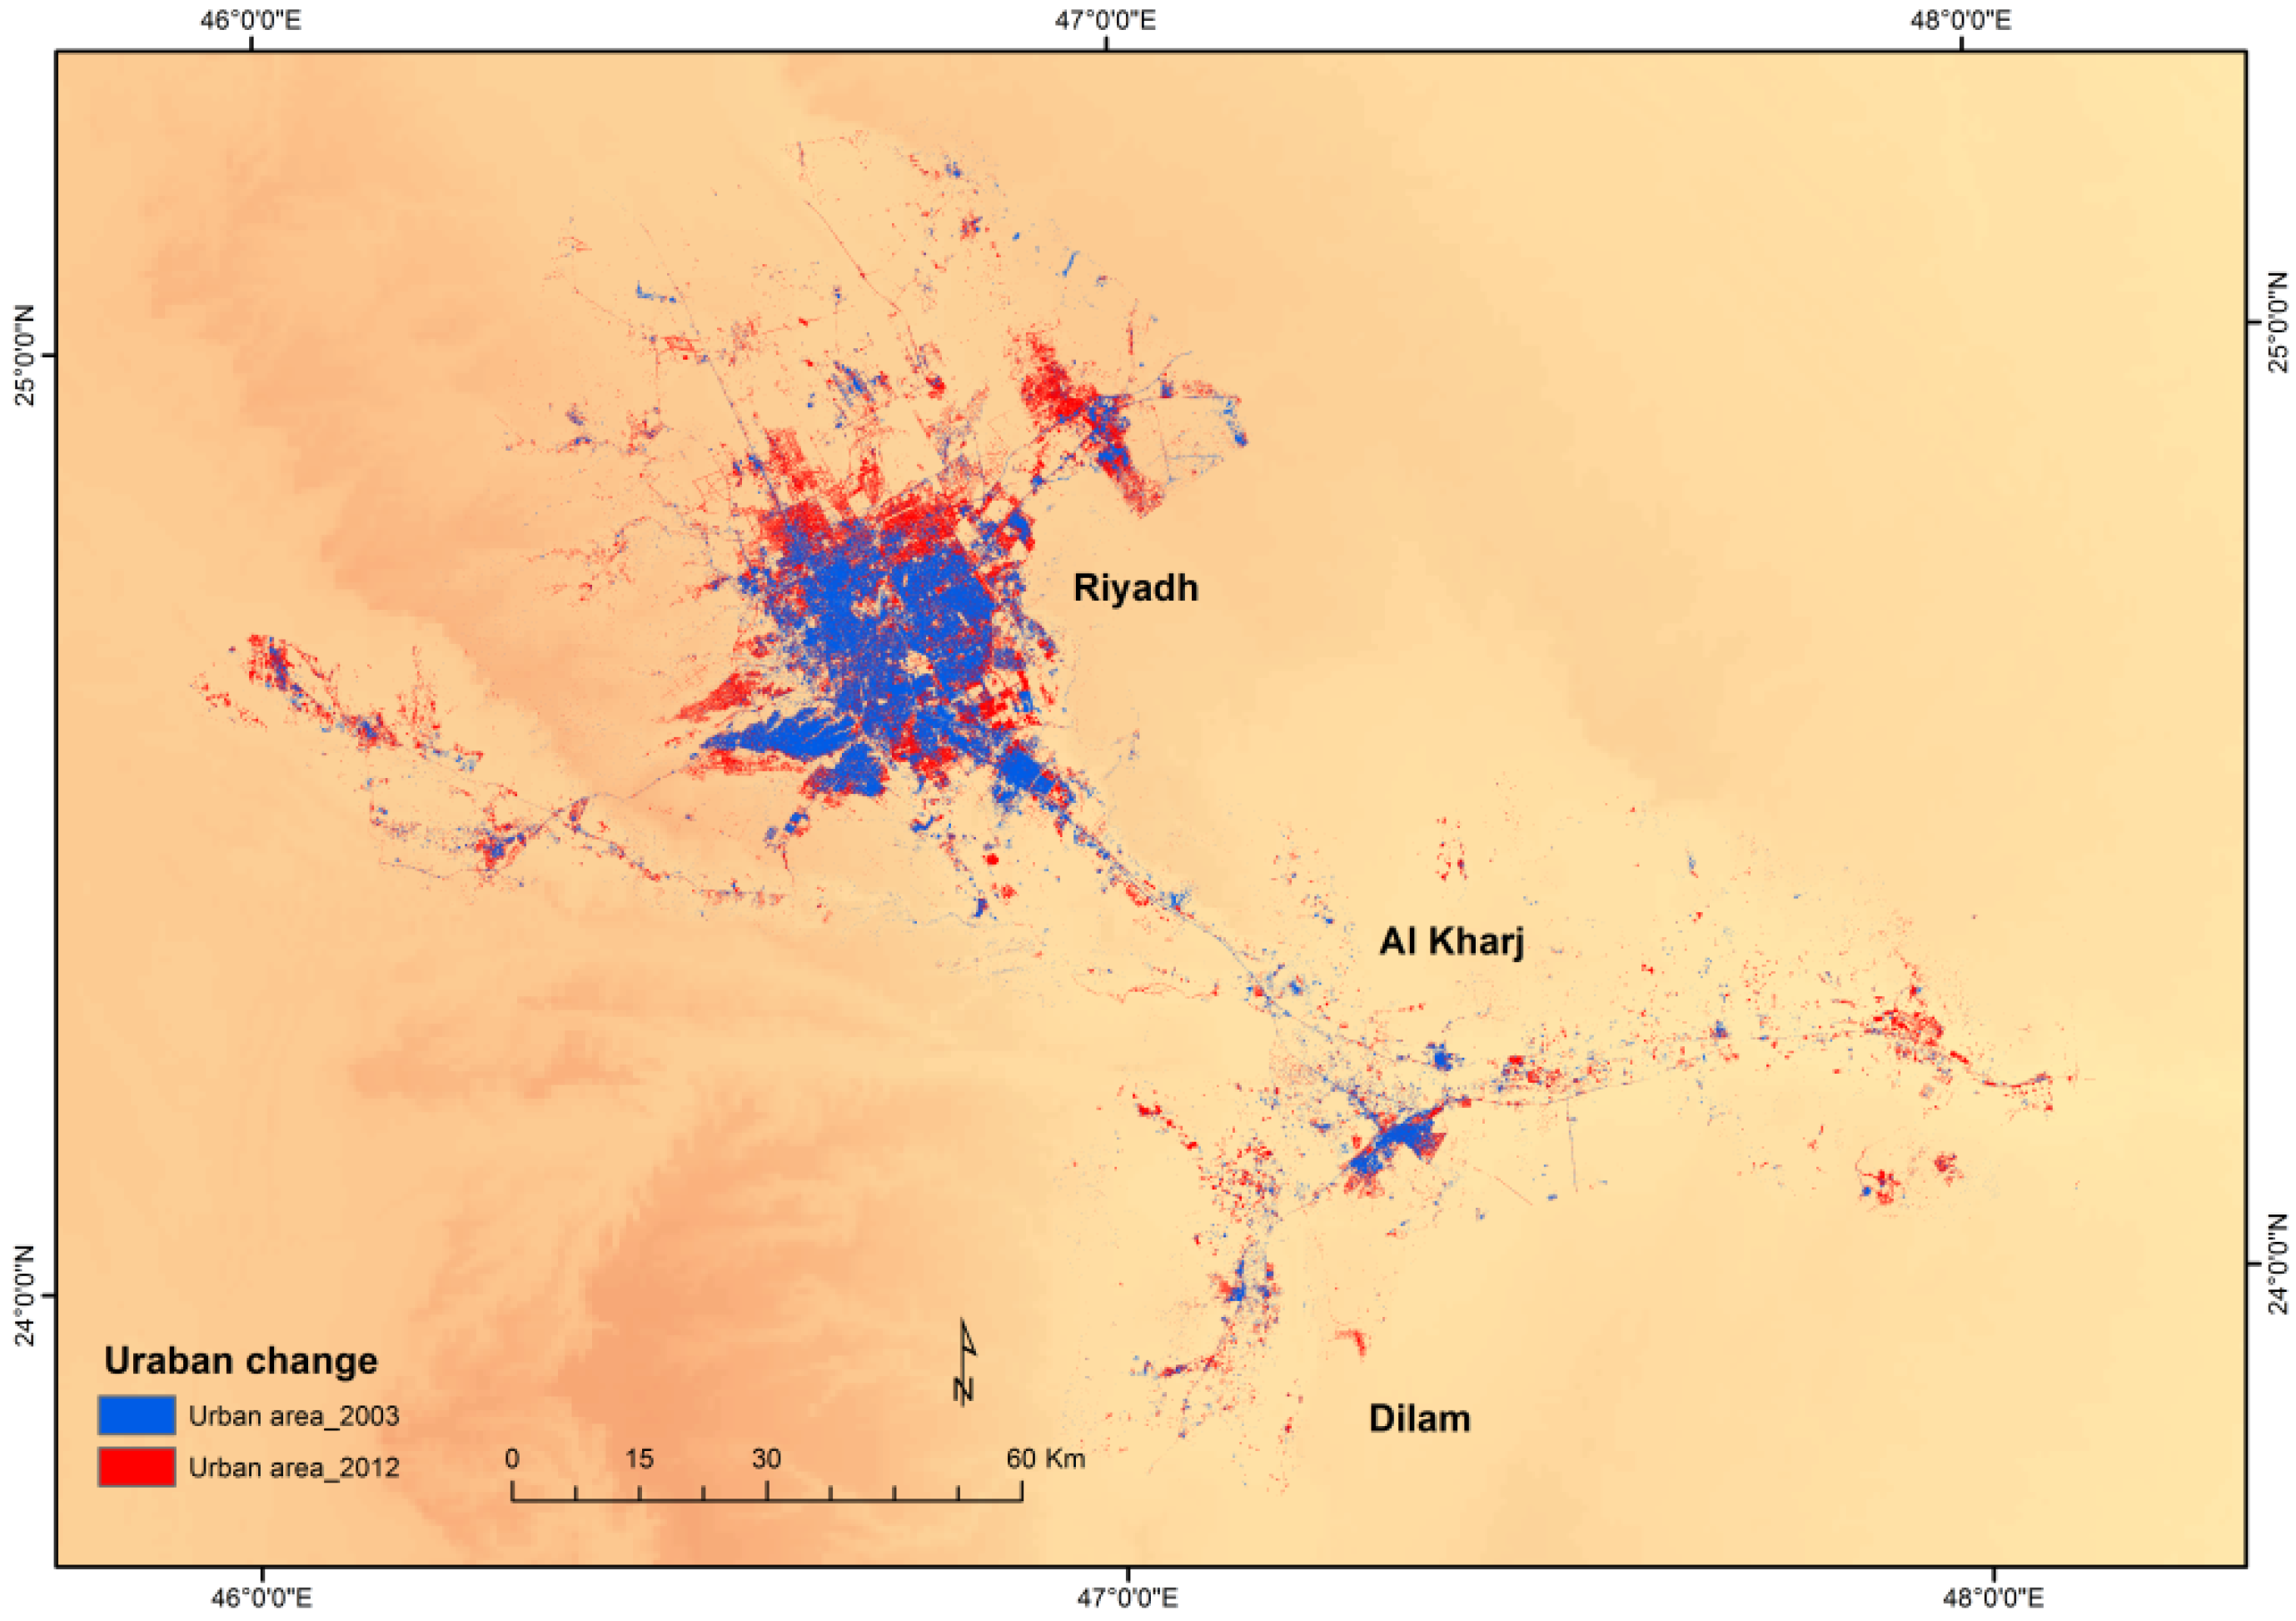
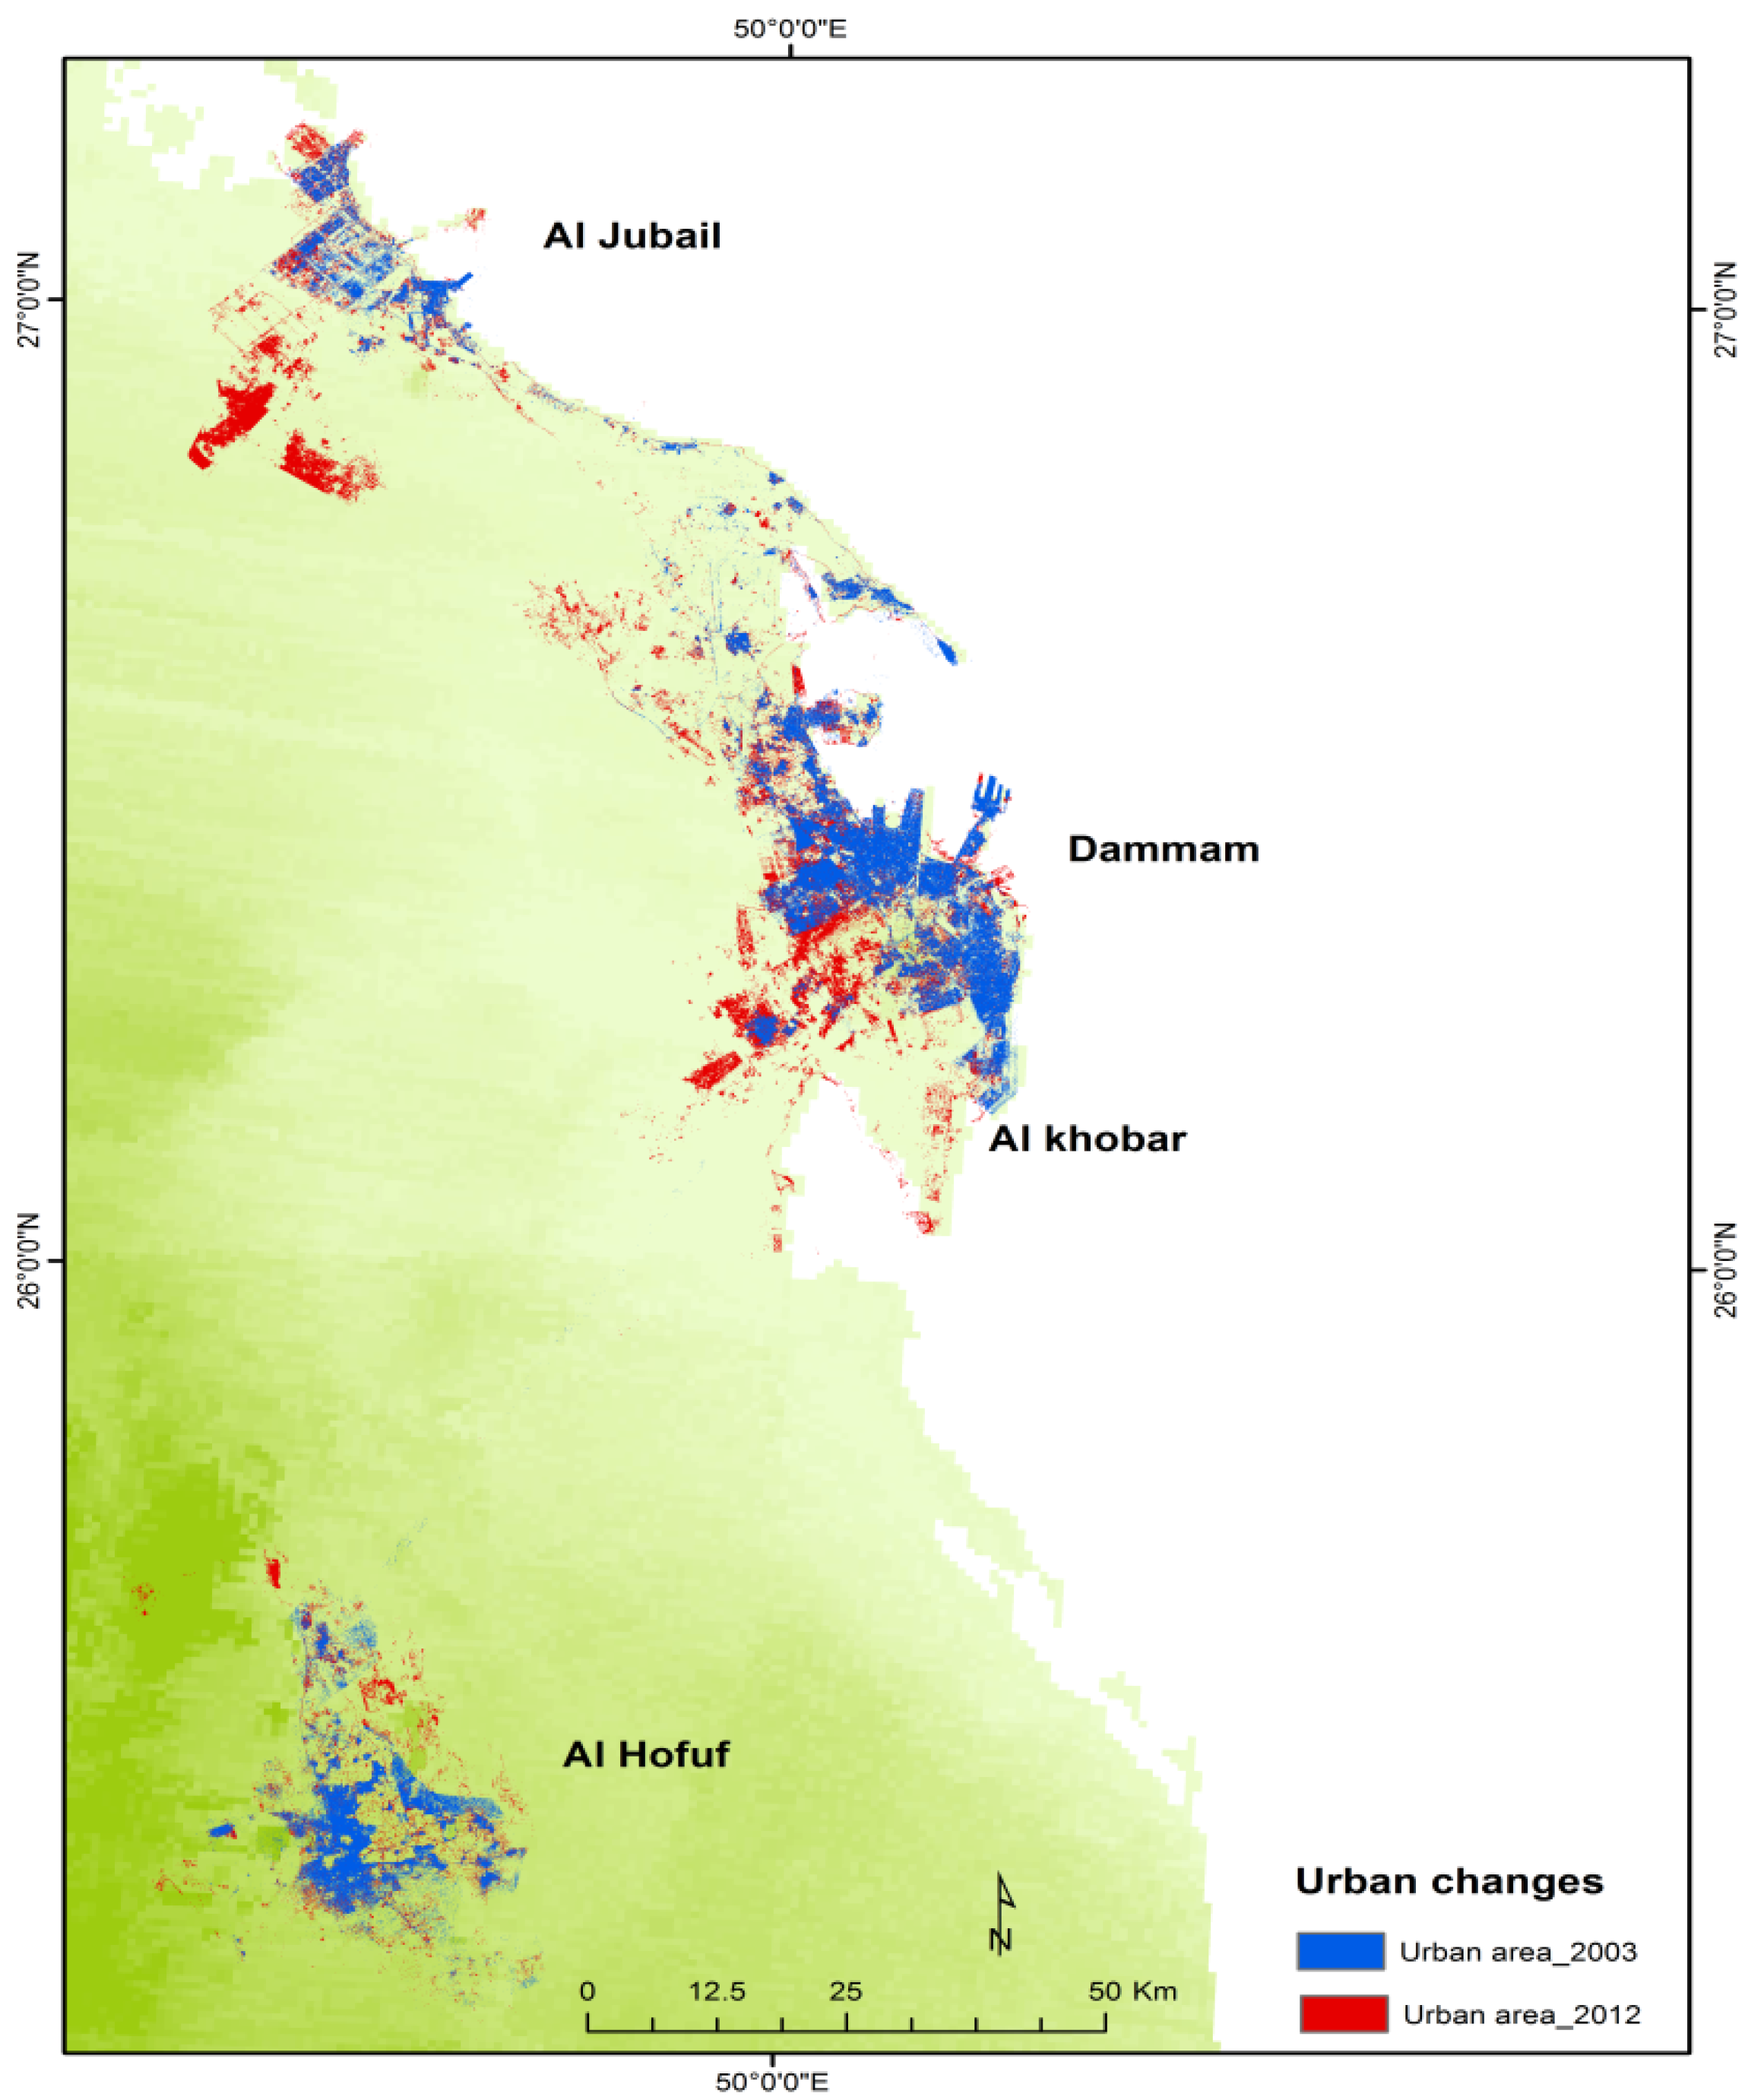
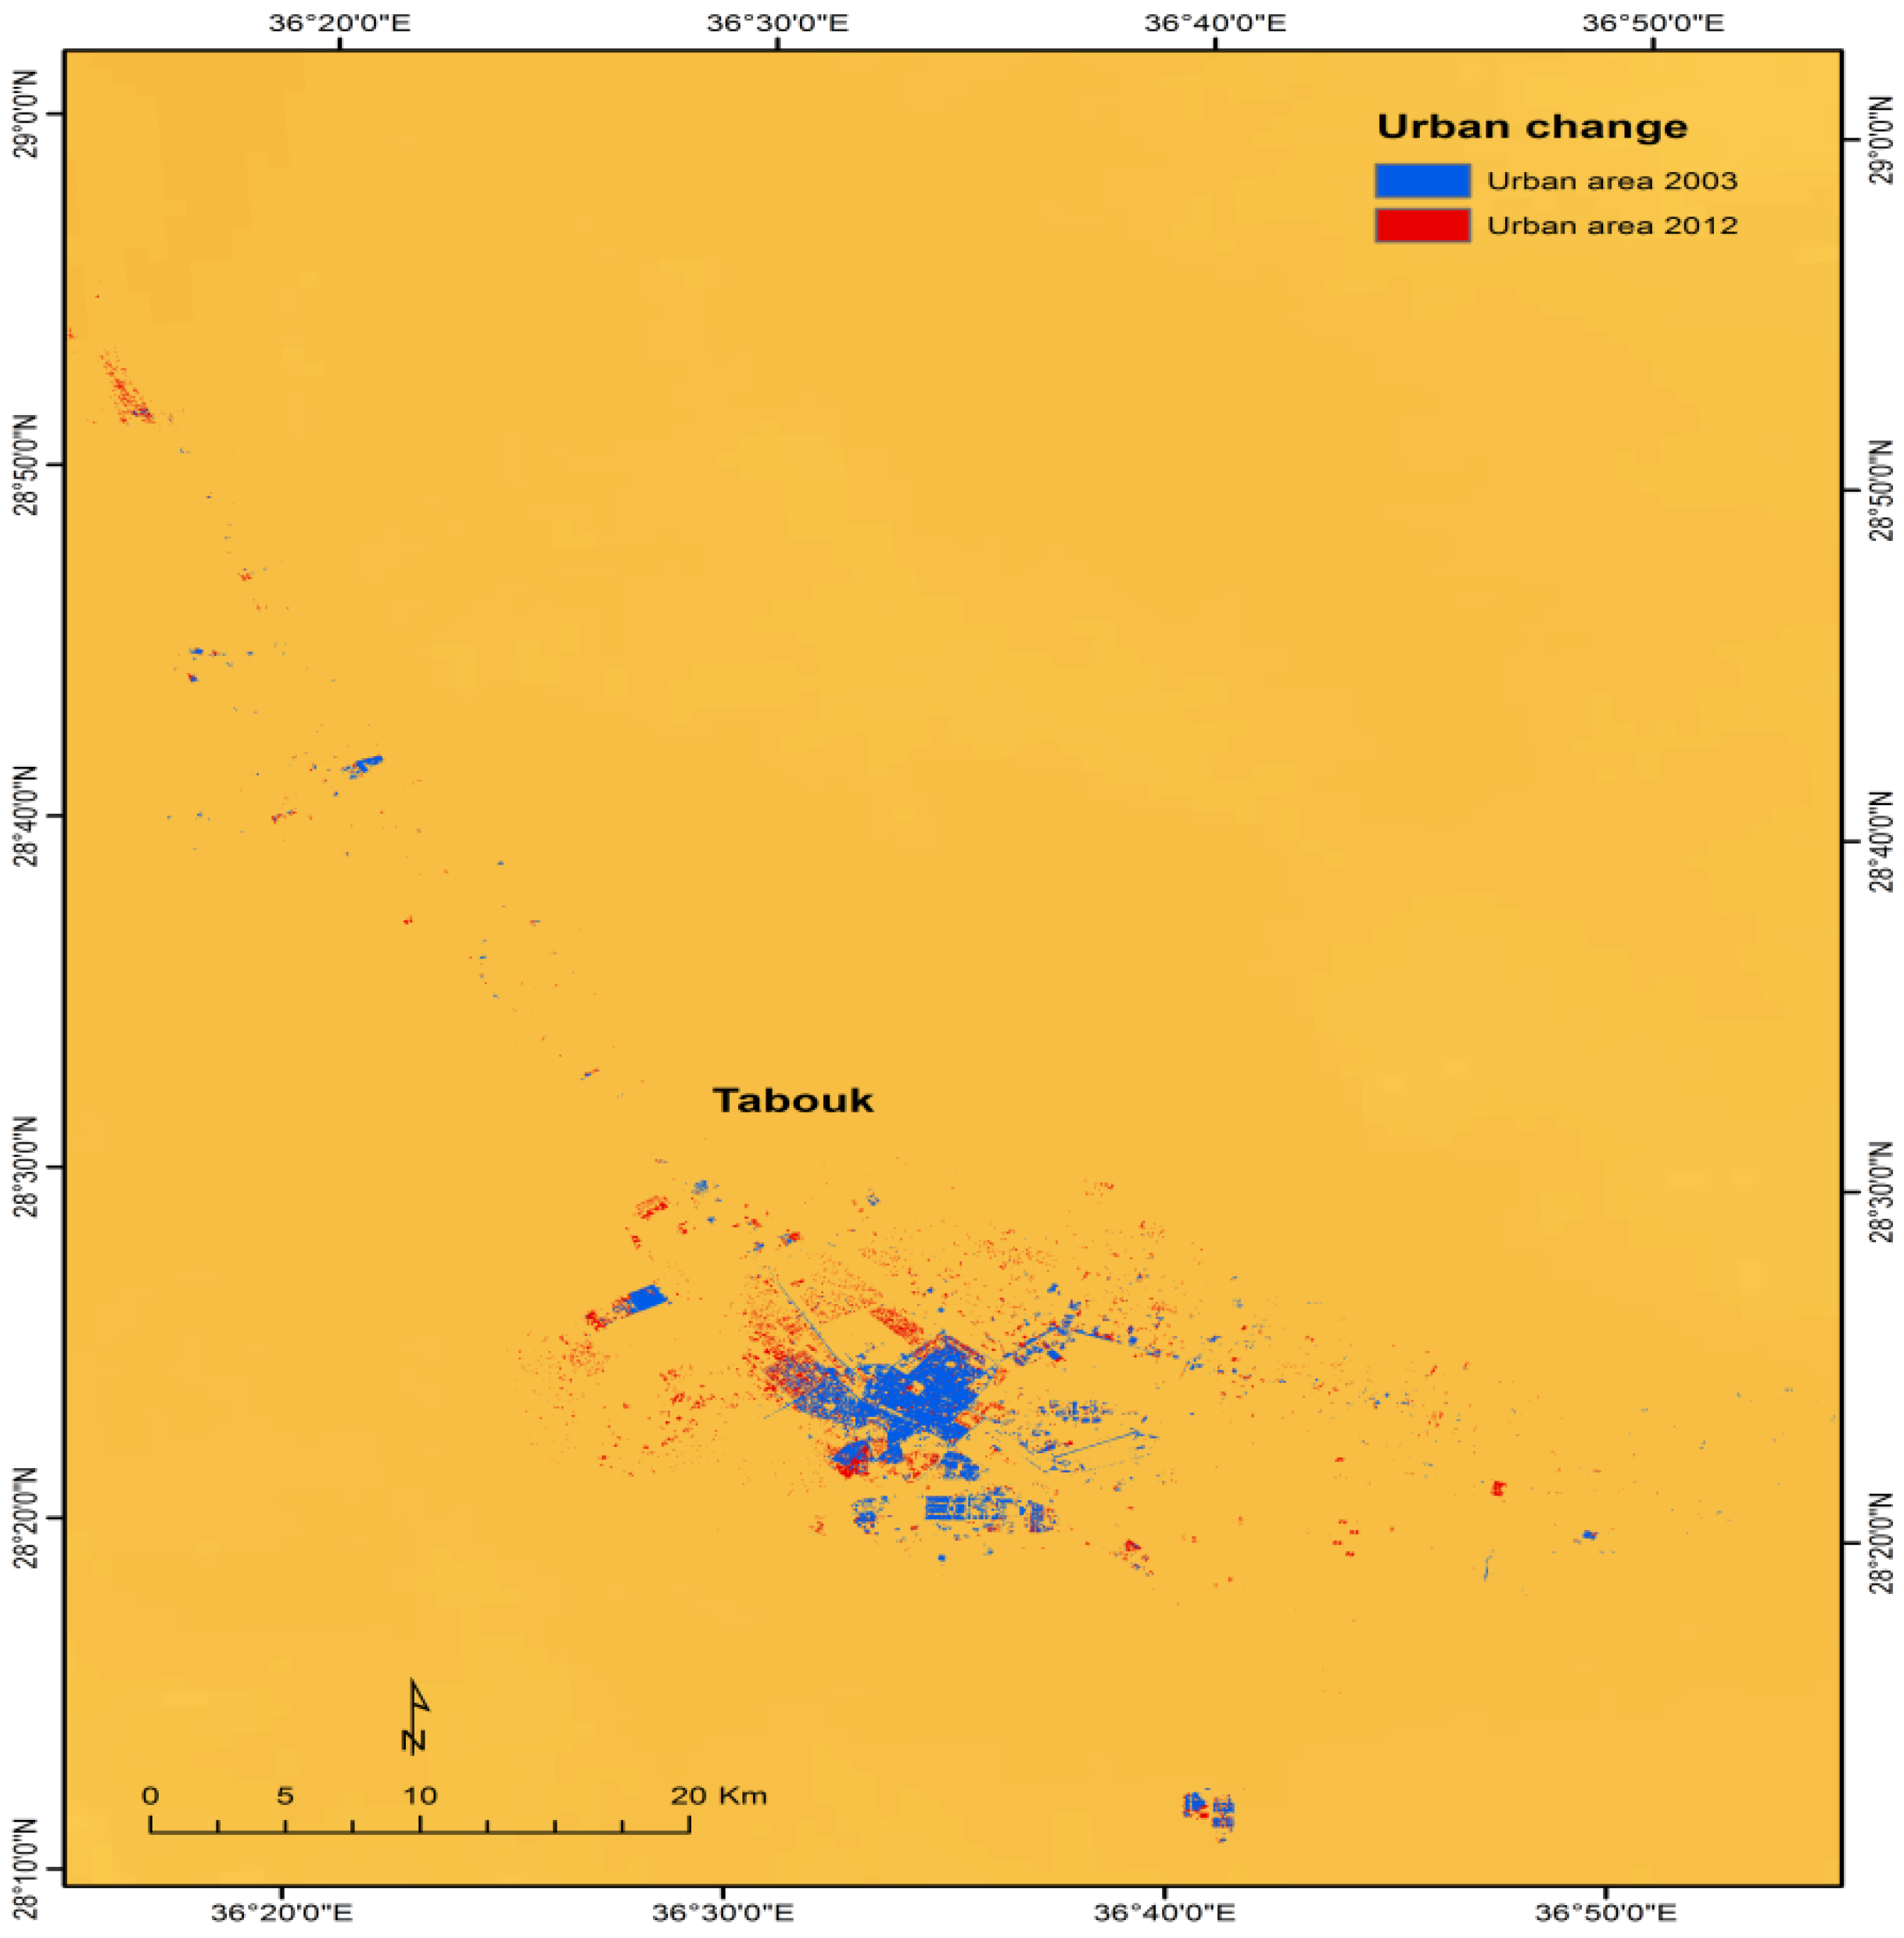
5.1. Classification Maps
5.2. Correlation between Crime and Urban Area Expansion
5.2.1. Riyadh Province
5.2.2. Makkah Province
5.2.3. The East Area
5.2.4. Tabouk
6. Discussion
7. Conclusions
Author Contributions
Conflicts of Interest
References
- Taylor, R.B.; Harrell, A. Physical Environment and Crime; US Department of Justice, Office of Justice Programs, National Institute of Justice: Washington, DC, USA, 1996.
- Newton, A.; Felson, M. Editorial: Crime patterns in time and space: The dynamics of crime opportunities in urban areas. Crime Sci. 2015, 4, 1–5. [Google Scholar] [CrossRef]
- Phillips, C. A review of CCTV evaluations: Crime reduction effects and attitudes towards its use. Crime Prev. Stud. 1999, 10, 123–155. [Google Scholar]
- Levine, N.; Wachs, M.; Shirazi, E. Crime at bus stops: A study of environmental factors. J. Archit. Plan. Res. 1986, 3, 339–361. [Google Scholar]
- Kinney, J.B.; Brantingham, P.L.; Wuschke, K.; Kirk, M.G.; Brantingham, P.J. Crime attractors, generators and detractors: Land use and urban crime opportunities. Built Environ. 2008, 34, 62–74. [Google Scholar] [CrossRef]
- Brantingham, P.J.; Brantingham, P.L. Environmental Criminology; Sage Publications: Beverly Hills, CA, USA, 1981. [Google Scholar]
- Wortley, R.; Mazerolle, L. Environmental Criminology and Crime Analysis; Willan: Portland, OR, USA, 2013. [Google Scholar]
- Brantingham, P.J.; Brantingham, P.L. Environmental criminology: From theory to urban planning practice. Stud. Crime Crime Prev. 1998, 7, 31–60. [Google Scholar]
- White, R.D. Environmental Crime: A Reader; Willan: Portland, OR, USA, 2009. [Google Scholar]
- Boessen, A.; Hipp, J.R. Close-ups and the scale of ecology: Land uses and the geography of social context and crime. Criminology 2015, 53, 399–426. [Google Scholar] [CrossRef]
- Felson, M. Routine activities and crime prevention in the developing metropolis. Criminology 1987, 25, 911–932. [Google Scholar] [CrossRef]
- Lockwood, D. Mapping crime in Savannah social disadvantage, land use, and violent crimes reported to the police. Soc. Sci. Comput. Rev. 2007, 25, 194–209. [Google Scholar] [CrossRef]
- Snowden, A.J.; Pridemore, W.A. Alcohol outlets, social disorganization, land use, and violence in a large college town direct and moderating effects. Crim. Justice Rev. 2013, 38, 29–49. [Google Scholar] [CrossRef]
- Harries, K. Extreme spatial variations in crime density in Baltimore County, MD. Geoforum 2006, 37, 404–416. [Google Scholar] [CrossRef]
- Tabangin, D.R.; Flores, J.C.; Emperador, N.F. Investigating crime hotspot places and their implication to urban environmental design: A geographic visualization and data mining approach. Int. J. Hum. Soc. Sci. 2010, 5, 210–218. [Google Scholar]
- Chainey, S.; Ratcliffe, J. GIS and Crime Mapping; John Wiley & Sons: Chichester, UK, 2013. [Google Scholar]
- Bannister, J.; Fyfe, N. Introduction: Fear and the city. Urban Stud. 2001, 38, 807–813. [Google Scholar] [CrossRef]
- Glasson, J.; Cozens, P. Making communities safer from crime: An undervalued element in impact assessment. Environ. Impact Assess. Rev. 2011, 31, 25–35. [Google Scholar] [CrossRef]
- Robinson, J.B. Crime and regeneration in urban communities: The case of the big dig in Boston, Massachusetts. Built Environ. 2008, 34, 46–61. [Google Scholar] [CrossRef]
- Kruger, T.; Landman, K. Crime and the physical environment in South Africa: Contextualizing international crime prevention experiences. Built Environ. 2008, 34, 75–87. [Google Scholar] [CrossRef]
- Bursik, R.J.; Grasmick, H.G. Neighbourhoods and Crime; Lexington: New York, NY, USA, 1993. [Google Scholar]
- Rossmo, D.K. Geographic Profiling; CRC Press: Boca Raton, FL, USA, 1999. [Google Scholar]
- LeBas, A. Violence and urban order in Nairobi, Kenya and Lagos, Nigeria. Stud. Comp. Int. Dev. 2013, 48, 240–262. [Google Scholar] [CrossRef]
- Nazri, A. Impacts of urban land use on crime patterns through GIS application. Plan. Malays. Geospat. Anal. Urban Plan. 2013, 11, 1–22. [Google Scholar]
- Leitner, M. Crime Modeling and Mapping Using Geospatial Technologies; Springer Science & Business Media: Berlin, Germany, 2013; Volume 8. [Google Scholar]
- Opiyo, R.O. The Interaction between Land Use Transformation and Crime Incidence in Dandora, Nairobi, Kenya. Ph.D. Thesis, University of Nairobi, Nairobi, Kenya, 2014. [Google Scholar]
- Bursik, R.J., Jr.; Webb, J. Community change and patterns of delinquency. Am. J. Sociol. 1982, 88, 24–42. [Google Scholar] [CrossRef]
- Browning, C.R.; Byron, R.A.; Calder, C.A.; Krivo, L.J.; Kwan, M.-P.; Lee, J.-Y.; Peterson, R.D. Commercial density, residential concentration, and crime: Land use patterns and violence in neighborhood context. J. Res. Crime Delinquency 2010, 47, 329–357. [Google Scholar] [CrossRef]
- Wuschke, K.; Brantingham, P.L.; Ginther, J. Landscapes of crime: Exploring urban crime and land use. In Proceedings of the GeoTEC Event 2009, Vancouver, BC, Canada, 1–4 June 2009.
- Schneider, R.H.; Kitchen, T. Putting crime prevention through environmental design into practice via planning systems: A comparison of experience in the US and UK. Built Environ. 2013, 39, 9–30. [Google Scholar] [CrossRef]
- Kelly, A.B.; Kelly, N.M. Validating the remotely sensed geography of crime: A review of emerging issues. Remote Sens. 2014, 6, 12723–12751. [Google Scholar] [CrossRef]
- Stucky, T.D.; Ottensmann, J.R. Land use and violent crime. Criminology 2009, 47, 1223–1264. [Google Scholar] [CrossRef] [Green Version]
- Zhang, W. Does compact land use trigger a rise in crime and a fall in ridership? A role for crime in the land use—Travel connection. Urban Stud. 2015. [Google Scholar] [CrossRef]
- Schmitz, P.M.U.; Cooper, A.K.; Quick, G.J. Using satellite imagery for crime mapping in South Africa. In Proceedings of the 6th Annual International Conference, Denver, CO, USA, 8–11 December 2002.
- Frazier, A.E.; Bagchi-Sen, S.; Knight, J. The spatio-temporal impacts of demolition land use policy and crime in a shrinking city. Appl. Geogr. 2013, 41, 55–64. [Google Scholar] [CrossRef]
- Cullen, J.B.; Levitt, S.D. Crime, urban flight, and the consequences for cities. Rev. Econ. Stat. 1999, 81, 159–169. [Google Scholar] [CrossRef]
- Daghistani, A.I. Emergence of an urban region: A case study of the central coastal region in the Eastern Province of Saudi Arabia. Cities 1993, 10, 25–36. [Google Scholar] [CrossRef]
- Al-Ogla, S. A study of hospital and medical libraries in Riyadh, Kingdom of Saudi Arabia. Bull. Med. Libr. Assoc. 1998, 86, 57–62. [Google Scholar] [PubMed]
- Schneider, J.; Garatly, D.; Srinivasan, M.; Guy, S.J.; Curtis, S.; Cutchin, S.; Manocha, D.; Lin, M.C.; Rockwood, A. Towards a digital Makkah—Using immersive 3D environments to train and prepare pilgrims. In Proceedings of the International Conference on Digital Media and Its Applications in Cultural Heritage (DMACH), Amman, Jordan, 12–13 March 2011.
- Malik, S.A. Rural Migration and Urban Growth in Riyadh, Saudi Arabia; University of Michigan: Ann Arbor, MI, USA, 1973. [Google Scholar]
- Garba, S.B. Managing urban growth and development in the Riyadh metropolitan area, Saudi Arabia. Habitat Int. 2004, 28, 593–608. [Google Scholar] [CrossRef]
- Alhowaish, A.K. Eighty years of urban growth and socioeconomic trends in Dammam metropolitan area, Saudi Arabia. Habitat Int. 2015, 50, 90–98. [Google Scholar] [CrossRef]
- General Authority for Statistics, Saudi Arabia. Available online: www.cdsi.gov.sa/ (accessed on 16 May 2016).
- Ministry of Justice. Statistical Book, Ministry of Justice; Ministry of Justice: Riyadh, Saudi Arabia, 2013.
- Algahtany, M.; Kumar, L.; Khormi, H.M. Spatio-temporal changes on crime patterns in Saudi Arabia from 2003–2012. GSTF J. Law Soc. Sci. 2014, 4, 11–19. [Google Scholar]
- Algahtany, M.; Kumar, L.; Khormi, H. Are immigrants more likely to be involved in criminal activity in Saudi Arabia? Open J. Soc. Sci. 2016, 4, 170–186. [Google Scholar] [CrossRef]
- United States Geological Survey. Available online: https://www.usgs.gov/ (accessed on 28 May 2016).
- Goshtasby, A. Registration of images with geometric distortions. IEEE Trans. Geosci. Remote Sens. 1988, 26, 60–64. [Google Scholar] [CrossRef]
- Collins, J.B.; Woodcock, C.E. An assessment of several linear change detection techniques for mapping forest mortality using multitemporal Landsat TM data. Remote Sens. Environ. 1996, 56, 66–77. [Google Scholar] [CrossRef]
- Jensen, J.R.; Lulla, K. Introductory digital image processing: A remote sensing perspective. Geocarto Int. 1987, 2, 65. [Google Scholar] [CrossRef]
- Congalton, R.G. A review of assessing the accuracy of classifications of remotely sensed data. Remote Sens. Environ. 1991, 37, 35–46. [Google Scholar] [CrossRef]
- Hauke, J.; Kossowski, T. Comparison of values of pearson’s and spearman’s correlation coefficients on the same sets of data. Quaest. Geogr. 2011, 30, 87–93. [Google Scholar] [CrossRef]
- Cohen, L.E.; Felson, M. Social change and crime rate trends: A routine activity approach. Am. Sociol. Rev. 1979, 44, 588–608. [Google Scholar] [CrossRef]
- Hirschfield, A.; Bowers, K.J. The development of a social, demographic and land use profiler for areas of high crime. Br. J. Criminol. 1997, 37, 103–120. [Google Scholar] [CrossRef]


| Area | Landsat | Path | Row | Date | Population | Population Density p/1 km2 |
|---|---|---|---|---|---|---|
| Riyadh | LE7 | 165 | 43 | 2 August 2003 | 5,616,117 | 14 |
| 166 | 43 | 14 January 2003 | ||||
| LC8 | 165 | 43 | 13 January 2014 | |||
| 166 | 43 | 20 January 2014 | 7,309,966 | 19 | ||
| Makkah | LE7 | 169 | 45 | 19 January 2003 | 5,790,275 | 42 |
| 170 | 45 | 10 January 2003 | ||||
| LC8 | 169 | 45 | 12 April 2013 | |||
| 170 | 45 | 19 April 2013 | 7,471,975 | 54 | ||
| The East Area | LE7 | 164 | 41 | 1 February 2003 | 3,436,200 | 6 |
| 164 | 42 | 24 May 2003 | ||||
| LC8 | 164 | 41 | 12 June 2013 | |||
| 164 | 42 | 12 June 2013 | 4,414,278 | 8 | ||
| Tabouk | LE7 | 173 | 40 | 31 January 2003 | 662,038 | 4 |
| LC8 | 173 | 40 | 29 July 2013 | 845,857 | 6 |
| Provinces | Landsat (ETM+) 2003 | Landsat (OLI) 2013 | ||||||
|---|---|---|---|---|---|---|---|---|
| Producer’s Accuracy | User’s Accuracy | Overall Accuracy | Kappa Coefficient | Producer’s Accuracy | User’s Accuracy | Overall Accuracy | Kappa Coefficient | |
| Riyadh | 91.17 | 99.79 | 92.65 | 0.89 | 93.13 | 98.39 | 87.48 | 0.82 |
| Makkah | 96.29 | 30.05 | 96.78 | 0.86 | 92.47 | 82.13 | 80.56 | 0.56 |
| The East Area | 89.75 | 72.48 | 90.06 | 0.86 | 76.98 | 95.76 | 91.09 | 0.87 |
| Tabouk | 85.51 | 100.00 | 94.67 | 0.91 | 63.56 | 99.72 | 88.18 | 0.82 |
| Urban Area over the 10 Years (ha) | ||||
|---|---|---|---|---|
| Year | Riyadh | Makkah | The East Area | Tabouk |
| 2003 | 73,359.72 | 53,124.93 | 53,295 | 3501 |
| 2004 | 77,802.66 | 55,904.7 | 55,488.89 | 3532.11 |
| 2005 | 82,245.6 | 58,684.47 | 57,682.78 | 3563.22 |
| 2006 | 86,688.54 | 61,464.24 | 59,876.67 | 3594.33 |
| 2007 | 91,131.48 | 64,244.01 | 62,070.56 | 3625.44 |
| 2008 | 95,574.42 | 67,023.78 | 64,264.44 | 3656.55 |
| 2009 | 100,017.4 | 69,803.55 | 66,458.33 | 3687.66 |
| 2010 | 104,460.3 | 72,583.32 | 68,652.22 | 3718.77 |
| 2011 | 108,903.2 | 75,363.09 | 70,846.11 | 3749.88 |
| 2012 | 113,346.2 | 78,142.86 | 73,040.31 | 3781 |
| Variance (2003–2012) | 48,872.34 | 25,017.93 | 19,745.31 | 280 |
| Expansion (%) | 66.62 | 47.1 | 37.05 | 8.00 |
| Province | Riyadh | Makkah | The East Area | Tabouk | |||||
|---|---|---|---|---|---|---|---|---|---|
| Spearman’s rho | Urban Expansions | Crime Overall | Urban Expansions | Crime Overall | Urban Expansions | Crime Overall | Urban Expansions | Crime Overall | |
| Urban changes | Correlation Coefficient | 1.000 | 0.697 * | 1.000 | 0.782 ** | 1.000 | 0.430 | 1.000 | −0.200 |
| Sig. (two-tailed) | 0.025 | 0.008 | 0.214 | 0.580 | |||||
| N | 10 | 10 | 10 | 10 | 10 | 10 | 10 | 10 | |
| Crime overall | Correlation Coefficient | 0.697 * | 1.000 | 0.782 ** | 1.000 | 0.430 | 1.000 | −0.200 | 1.000 |
| Sig. (two-tailed) | 0.025 | 0.008 | 0.214 | 0.580 | |||||
| N | 10 | 10 | 10 | 10 | 10 | 10 | 10 | 10 | |
| Significance | * Correlation is significant at the 0.05 level (two-tailed). | ** Correlation is significant at the 0.01 level (two-tailed). | No significant correlation | No significant correlation | |||||
© 2016 by the authors; licensee MDPI, Basel, Switzerland. This article is an open access article distributed under the terms and conditions of the Creative Commons Attribution (CC-BY) license (http://creativecommons.org/licenses/by/4.0/).
Share and Cite
Algahtany, M.; Kumar, L. A Method for Exploring the Link between Urban Area Expansion over Time and the Opportunity for Crime in Saudi Arabia. Remote Sens. 2016, 8, 863. https://doi.org/10.3390/rs8100863
Algahtany M, Kumar L. A Method for Exploring the Link between Urban Area Expansion over Time and the Opportunity for Crime in Saudi Arabia. Remote Sensing. 2016; 8(10):863. https://doi.org/10.3390/rs8100863
Chicago/Turabian StyleAlgahtany, Mofza, and Lalit Kumar. 2016. "A Method for Exploring the Link between Urban Area Expansion over Time and the Opportunity for Crime in Saudi Arabia" Remote Sensing 8, no. 10: 863. https://doi.org/10.3390/rs8100863