1. Introduction
Geoinformation technologies have been extensively used on land for the documentation of archaeological sites and the reconstruction of the “hidden” built environment, thus contributing to the protection, promotion and management of cultural resources [
1]. The in-shore implementation of diverse geophysical prospection methods has nowadays become an integral part of archaeological research in planned and rescue excavations or regional archaeological surveys, providing a non-destructive and rapid mapping of a site without disturbing the ground or the monuments themselves [
2,
3,
4]. The following overview of relevant geophysical applications in marine contexts, though far from exhaustive, helps to define the framework in which this research sits. At the same time, it highlights the peculiarities and uniqueness of the proposed approach with respect to the state of the art of the discipline.
Acoustic marine geophysical methods, like sub-bottom profiling and side scan sonar, have also been employed in maritime archaeology mainly for the mapping of ancient shipwrecks, and especially at depths exceeding the scuba-diving range [
5]. Successful applications in relatively shallower marine environments have been used for examining seafloor texture and stratigraphy [
6]. Ultra-high resolution two- and three-dimensional (2-D/3-D) marine seismic surveys have been performed on an experimental basis to image submerged structures and sediment stratigraphy in shallow water-covered archaeological areas [
7]. The identification of submerged ancient Roman harbours and ruins in coastal sites with saline water thickness less than 20 m was made possible using suspended Overhauser [
8] and caesium [
9,
10] magnetometers. Klein [
11] used a configuration of six gradiometers mounted on a trimaran to map the submerged relics of Elaia (Turkey) in parts of the wider shallow marine environment of the city. The characterization of wetland environments has also been the subject of active research using the direct current electrical resistivity imaging method. Resistivity surveying has been tested, proving its efficiency in the extremely demanding waterborne areas, for geological mapping [
12], interpretation of vertical stratigraphy [
13] and identifying the submarine aquifer discharge [
14].
The majority of the recent off-shore field applications involve the employment of resistivity imaging in brackish wetlands where the resistivity of the water is at least one order of magnitude larger than the respective saline water sea resistivity [
15]. Recently, Tassis et al. [
16] used 2-D numerical modelling to explore the limitations of Electrical Resistivity Tomography (ERT) in resolving weak zones in submerged resistive bedrock. At the same time it has been noted that the electrical resistivity prospection poses new challenges in terms of data acquisition and processing regarding water-covered areas [
17]. The measurement strategy often tends to incorporate a mixture of floating and submerged array configurations that are either static or moved behind a boat [
18].
In contrast to the previous applications, the use of resistivity tomography is uncommon in shallow maritime archaeology. Passaro [
19] managed to outline the shape of a military shipwreck as low calculated resistivity values from a towed floating mobile configuration. A comprehensive feasibility study on the efficiency of ERT in reconstructing submerged archaeological relics in shallow seawater environments, based on extensive numerical models verified by subsequent field experimentation, is given by Simyrdanis et al. [
20]. The vast majority of marine ERT applications involve the implementation of 2-D measurement and processing approaches for the characterization of the sub-bottom stratigraphy. Efforts toward the direction of 3-D underwater resistivity mapping have been limited in the collection of multiple dynamic ERT lines in a floating mode and subsequent analysis though a quasi-3D approach [
19]. This work goes a step further in the investigation of a submerged archaeological site through the employment of a true 3-D imaging resistivity survey in terms of data acquisition and processing, constraining simultaneously the modeling and inversion procedure with the thickness and salinity of the water layer. A submerged part (7100 m
2) of the ancient city of Olous, which is located on the northeastern part of the island of Crete, in Greece (
Figure 1a), was investigated though a full 3-D underwater ERT in an effort to enrich the picture of the archaeological remains buried below the sea bottom and revealing the submerged built environment (
Figure 1b).
2. Archaeological Evidence
Given the limited references to Olous in ancient texts, most of our knowledge about its history is derived from the available epigraphic, numismatic and other archaeological evidence. Although Minoan tombs have been identified in the broader area, a votive pit is currently the most ancient find in Olous and dates the establishment of the settlement to the Archaic period (8th to 5th century Before Common Era (BCE)). Regarding the Hellenistic period (4th to 1st century BCE), the epigraphic evidence attests to the existence of a wealthy harbour town in a strategic location [
21]. Most of the submerged architectural remains (probably buildings of the town) have been attributed to that period.
Recently, the Greek Ephorate of Underwater Antiquities in cooperation with the Institute for Mediterranean Studies (IMS) located and mapped part of the currently submerged Hellenistic fortification of Olous (the wall and a probable tower), which seems to define also the southern limit of the harbour, provided that the latter followed the trend of that period in the form of the “limen kleistos”, the walled or protected harbour.
The Roman Imperial period is attested by tombs of the cemetery in the surrounding area to the west, by two fragments of inscribed marble statues of the 2nd 3rd century Common Era (CE) and by scattered pottery finds. Part of the submerged architectural remains is also attributed to this occupation phase of the settlement.
During the Early Byzantine period, another important presence is attested at Olous by a basilica with a mosaic pavement dating back to the 7th c. CE with dedicatory inscriptions, remains of house foundations nearby, and another submerged Early Byzantine building (a probable basilica). Finally, during the Venetian period a large salt pan complex (now in complete disuse) was developed, probably established in Byzantine times, as well as the fortress of Spinalonga Islet (north of Olous), in which constructing materials from the Hellenistic and Roman Imperial town of Olous were reused.
3. Methodology
3.1. GNSS Survey
Topographic survey and mapping at the site of Olous was undertaken with a Real Time Kinematic (RTK) Global Navigation Satellite System (GNSS) using two separate geodetic units. One of them was configured as base station and the second one as rover (
Figure 2). The base station was placed on a fixed position close to the investigated area. The absolute coordinates of the base point were stored in the UTM Zone 34N projection through the HEllenic POsitioning System (HEPOS). HEPOS operates and covers the whole territory of Greece, consisting of 98 permanent reference stations and a control center that collects and processes all streaming data from the reference stations, thus providing “real time” sub-centimetre positioning accuracy of the coordinate points for RTK techniques. The rover GNSS unit was constantly communicating with the base station (for differential correction) through an internal UHF protocol.
The rover unit moved along the surveyed area to set up the geophysical grids, map the visible submerged walls and relics and outline the modern coastline (
Figure 3). The bathymetry of the bay was logged with the pole carrying the GNSS rover unit which was in constant contact with the bottom of the sea. The average positioning and elevation accuracy over the more than 10,000 surveyed points was 1.4 cm. Both sensors and the logging procedure were controlled through a palmtop computer running commercial topographic software. The data points were corrected to absolute elevations using the Earth Gravitational Model (EGM08) that was recently released by the US National Intelligence Agency [
22].
3.2. Electrical Resistivity Tomography
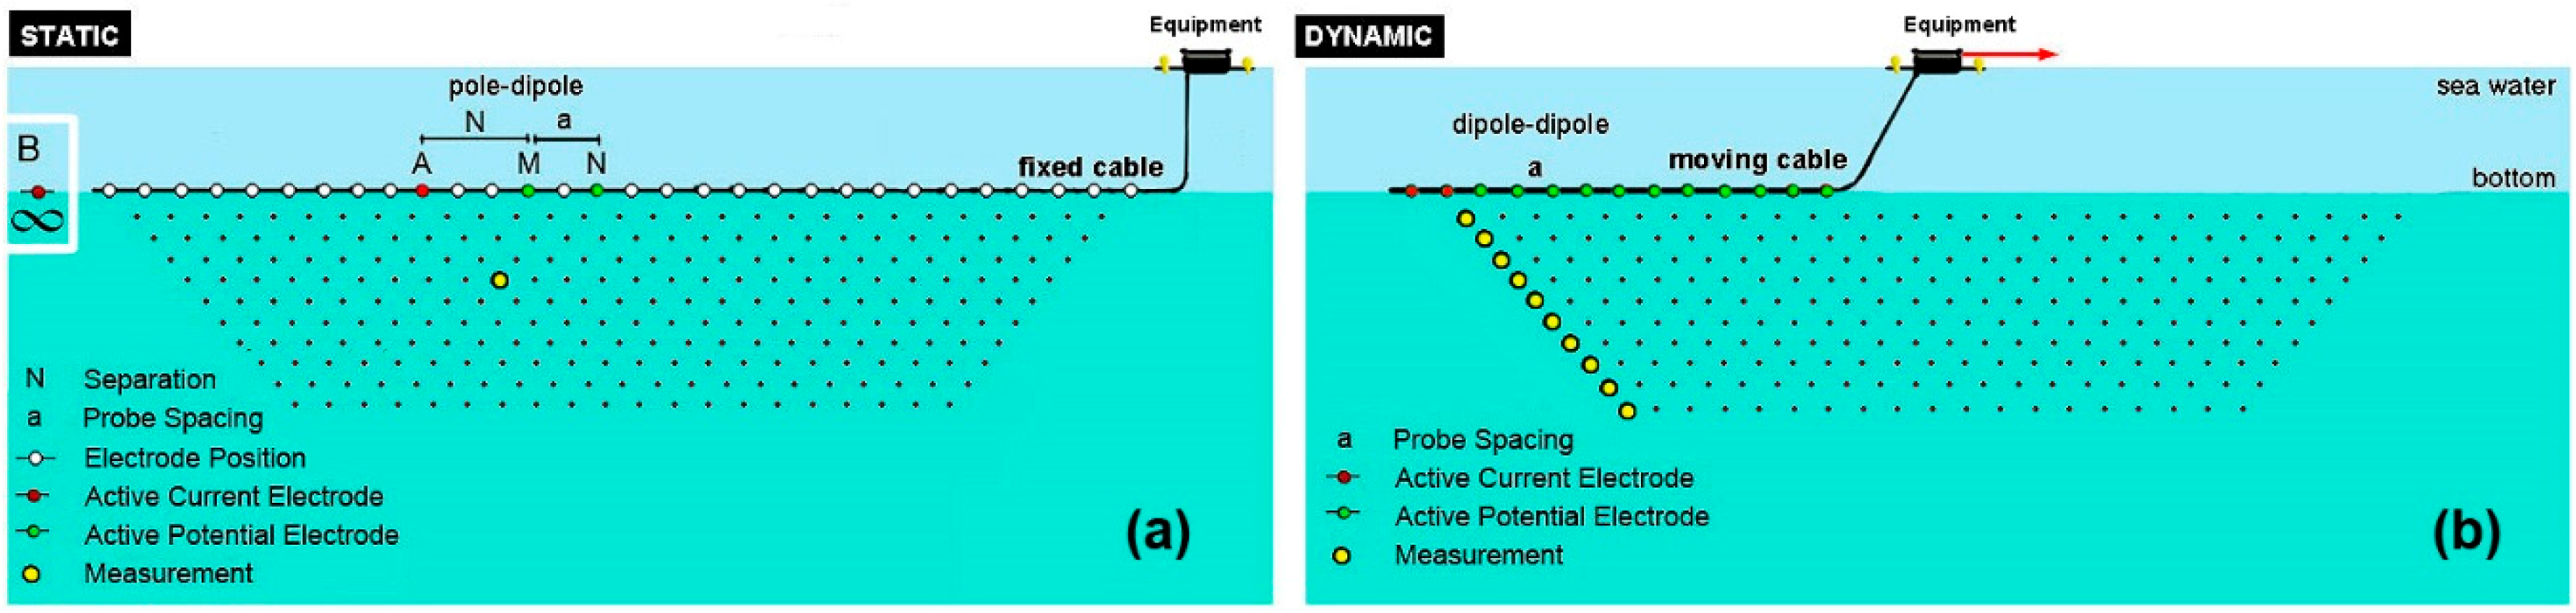
Two alternative survey modes were applied for ERT data collection in Olous, employing either a fixed cable position (static) or a moving (dynamic) array along a predefined survey line (
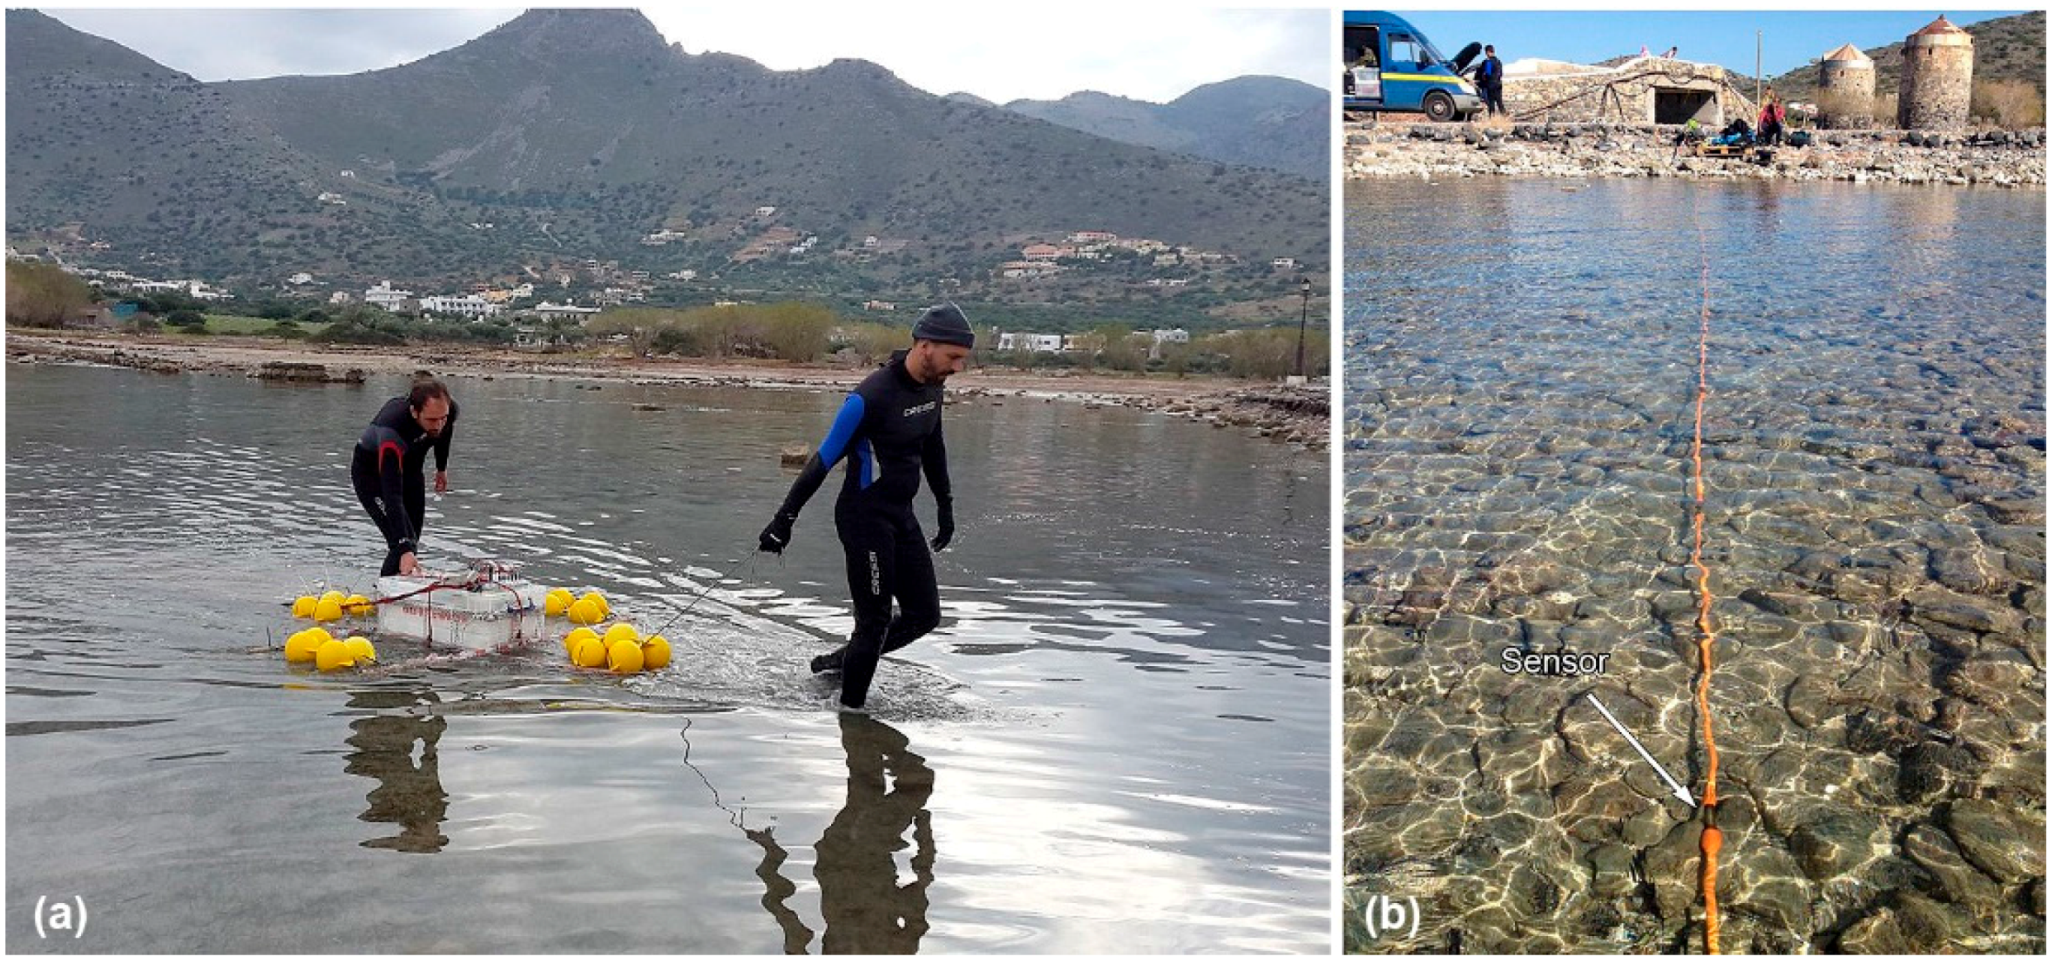
Figure 4). The dynamic survey mode was made feasible by pulling a custom made boat which carried the instrumentation, the toughpad computer and the external battery across the surface of the water (
Figure 5a). The custom made apparatus was constructed with a waterproof plastic box and its interior was divided into compartments (with polystyrene for extra isolation and levitation) to safely enclose the instrumentation. The whole apparatus could sustain a weight more than 30 kilos on the sea surface. Four elongated wooden sticks with supporting buoys at the edges were placed around the plastic box for stability purposes. The boat’s shallow draft (approximately 0.1 m) permitted rapid data acquisition when floating over the archaeological relics even in very shallow water. This was useful because the survey could be undertaken in areas very close to the seashore without being hindered by protruding stones or structures on the sea bottom that were close to the water surface.
The static submerged mode was made possible with the use of a 48-channel multicore cable which was kept fixed and submerged along a specific line during data acquisition (
Figure 5b).
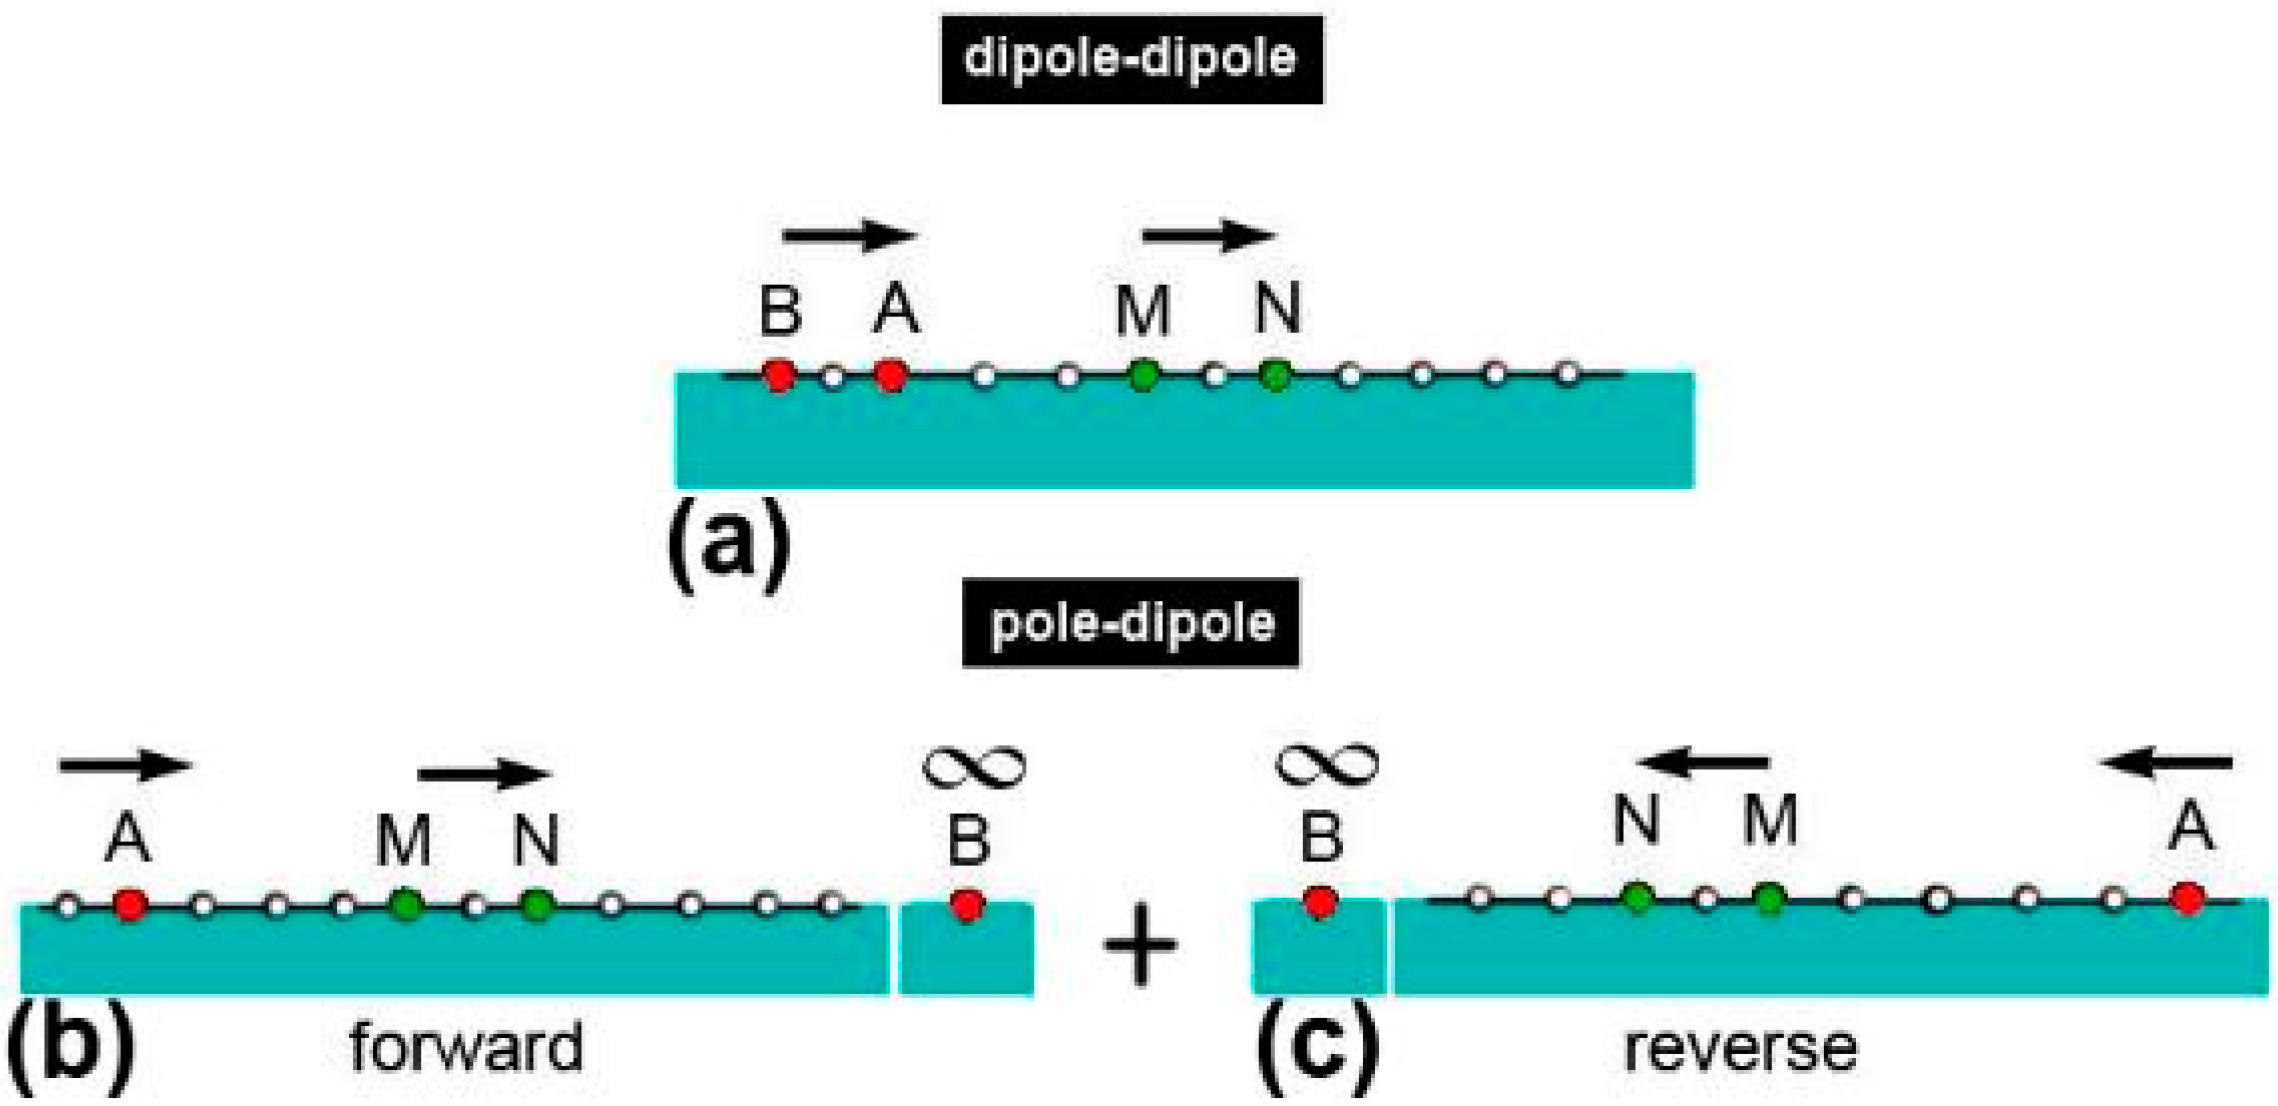
The dynamic submerged mode was completed using the dipole–dipole array where the potential difference was measured at ten different potential dipoles with increasing separations from the current dipole in one single current injection (
Figure 4b and
Figure 6a). The pole–dipole electrode configuration was used to capture forward and reverse resistance measurements with the static submerged mode (
Figure 6b,c). The total number of measurements for the static mode depends on the line length, the inner probe spacing (“a = 1 m”) and the separation between the current electrode A and the dipole MN. For the dynamic survey mode, the number of data points depends on the line length and the moving velocity of the whole configuration along the line.
The static and dynamic survey modes were completed with a 10-channel commercial resistivity meter capable of generating a current of 2.5 amps. The resistivity meter was used in combination with an external toughpad computer to store and check in situ the quality of the data. The main unit was connected with an external battery due to the high amount of current needed for the marine survey. The use of the multichannel resistivity instrumentation facilitated the ability of logging multiple potential readings with a single current injection, thus reducing the total acquisition time. The maximum investigation depth reached almost 5 m below the water surface in spite of the high conductivity of the sea layer.
The layout of the nine grids covering 7100 m
2 in the bay of Elounda was planned in advance and was carried out in the field with the help of the RTK GNSS unit (
Figure 7). The static submerged mode was used to collect the ERT data along 145 parallel 2-D lines in Grids 1 to 5 where the instrumentation was always kept on the coast and a multicore marine cable with 48 stainless steel electrodes with one meter separation was sunk in the sea during data capture (
Figure 5b). Grid 1 was divided into three sub-grids (a, b, c). Grids 6a and 6b were sampled with the dipole–dipole dynamic submerged mode along 33 parallel traverses using a custom made cable with 13 electrodes (
Figure 5a). The basic inter-electrode spacing along all 2-D line was 1 m and the inter-line distance in all Grids was 1 m, except for Grid 3 where a two meter distance was adopted. The nine grids were covered with 178 2-D ERT lines with a cumulative length of 8.3 km and more than 181,000 apparent resistivity measurements describing the submerged resistivity distribution in seven working field days (
Figure 7).
4. Results
4.1. Bathymetry Model and Mapping Visible Submerged Archaeological Features
The bathymetry of the bay was mapped by moving the rover GNSS unit, which was in constant connection with the base for differential correction, along almost parallel southeast–northwest tracks. Along each profile, a new point was logged when a horizontal and vertical distance difference of 0.1 m and 0.25 m respectively occurred. This field configuration resulted in an average horizontal spatial resolution of 0.5 m (yielding lines not perfectly parallel) for mapping the bathymetry of the bay (
Figure 3).
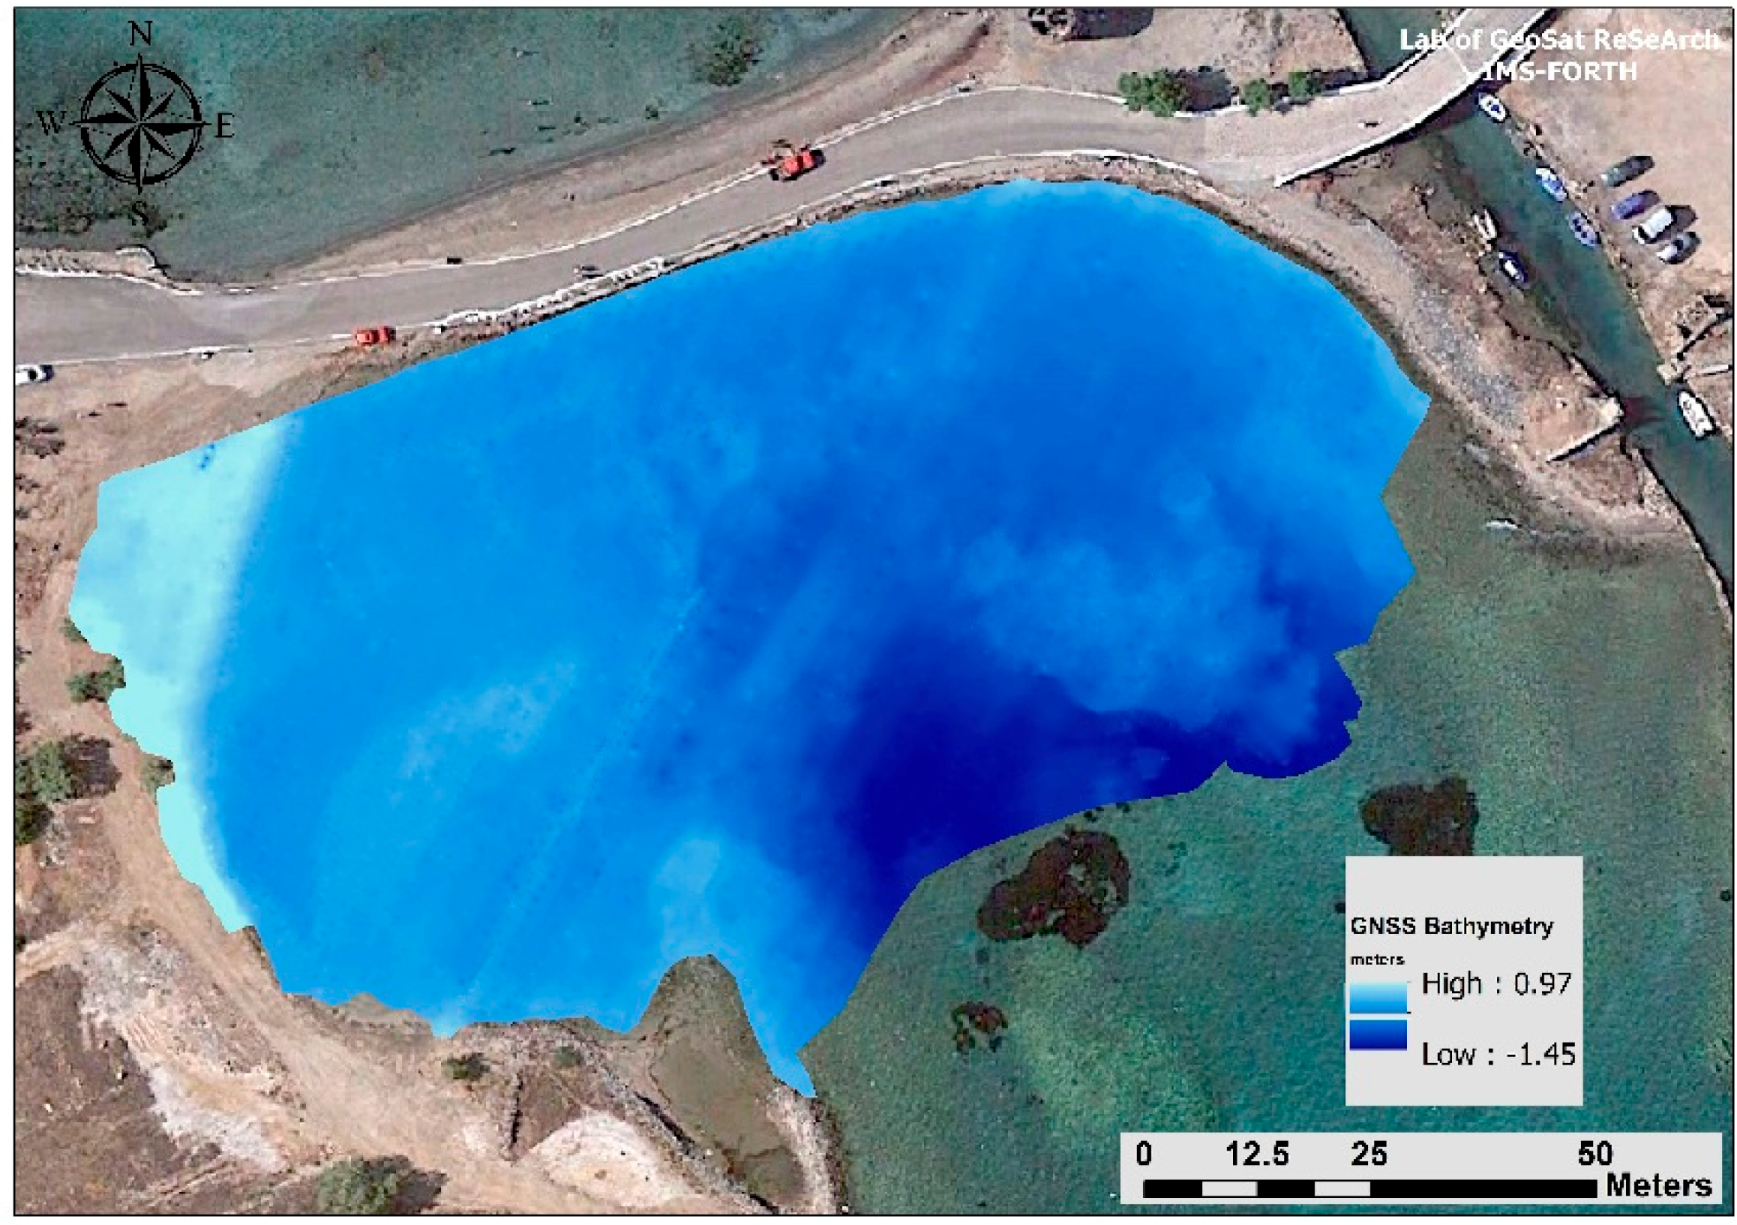
The bathymetry data points exceeding the average value by ±3 standard deviations were filtered from the original data set. The data were then interpolated with a kriging algorithm and the resulting GNSS digital model ranges between 0.97 m above mean sea level (AMSL) in the western part of the bay and 1.47 m below mean sea level (BMSL) in the south central part. At the same time the bathymetry model exhibits structural information by outlining with considerable accuracy submerged rectangular buildings and a diagonal wall (west) as well as deeper parts of the sea bottom (east) (
Figure 8). This model formed the basic information for the subsequent correction of ERT data for the conductive sea water layer.
The visible submerged architectural structures on the bay were mapped by placing the pole holding the GNSS unit on both sides of the walls to more accurately reconstruct their thicknesses. The points were overlaid on the high resolution aerial image of Elounda Bay and were connected to form the direction and the dimensions of the visible architectural remains. The western part of the bay is characterized by a long structure that runs for 54 m along the southwest-northeast direction which is bisected in its middle by two small parallel walls heading towards the northwest. The end of this long structure intersects with the southeast corner of a large rectangular structure of 34 m × 24 m that has a WSW–ENE orientation the northern boundary of this structure is better preserved in contrast to the southern part where only a small corner is visible today. The projection of the northern boundary of this structure seems to be in alignment with isolated structures to the east. This large structure is divided into two compartments with a southeast-northwest wall with a measured length of 12.5 m. A southeast-northwest structure 17 m in length can be also identified at the eastern part of the bay close to the coastline (
Figure 9).
4.2. 2-D and 3-D Resistivity Inversion Models
A systematic method was followed to pre-process all the 178 individual 2-D survey lines. After de-spiking outlier values (due to high geometric factors, small potential values or values collected with insufficient current) the data were exported as resistances (i.e., normalized potential values based on the current intensity).
The individual 2-D lines were processed with commercial 2-D inversion software (RES2DINV) using common processing inversion parameters. Afterwards, the 2-D apparent resistivity lines for each grid were combined into a single data file and a full 3-D inversion program (RES3DINV) was used to reconstruct the 3-D submerged resistivity variation. In both cases (2-D and 3-D) a robust inversion method [
23] was applied for the deconvolution of the apparent resistivity data and the reconstruction of the 2-D or 3-D resistivity models below the surface of the sea.
The resistivity of the saline water was measured with a professional hand-held conductivity meter able to resolve the high conductivity of the sea. The resistivity of the sea water column (0.18 Ohm-m) and depth below the sea surface for each electrode extracted from the bathymetry model, were also incorporated into the inversion model to account for the effect of the highly conductive saline water layer.
The static submerged 2-D inversion models from Grids 1 to 5 exhibited an average RMS error of 3.9%, signifying the high data quality and the increased confidence of the interpreted submerged 2-D resistivity distribution. On the other hand, the dynamic lines in Grids 6a and 6b suffered from high levels of noise which is reflected on the consistent RMS errors (~40%–50%) of the final inverted models, even after heavily trimming of the spurious data. This is mainly attributed to the low signal to noise ratio of the dipole-dipole array used for the data collection, which is even more severe in the highly conductive marine environment. In any case, the dipole-dipole resistivity models outlined blocky resistive anomalies related to architectural remains, but the degree of confidence in mapping stratigraphy along the individual 2-D lines is considered relatively low.
The combined interpretation of all the 2-D ERT line from Olous resulted in a simplified conceptual model describing the main submerged lithological units in the bay of Elounda (
Figure 10). The interpreted cultural and anthropogenic layer lies below the sea with an average thickness of 1 to 1.5 m and resistivity ranging from 1 to 7 Ohm-m. The archaeological structures and associated remains are basically located within this layer as blocky resistive anomalies with resistivity values more than 7 Ohm-m. A conductive horizon (0.18–1.0 Ohm-m) with an average thickness of 2 m corresponding to fine grained sediments lies below the cultural layer. In depths of more than 4.5–5.0 m, the resistivity section reconstructs a resistive layer (>10 Ohm-m) which is related to the limestone bedrock of the wider area [
24]. The bedrock shows discontinuities in places probably related with small faults or fractures that cause its downward vertical movement.
In a later processing stage the individual lines from each grid in Olous were combined into a single file including the respective underwater topography and the water resistivity. The 3-D subsurface reconstruction of each grid, employing the 3-D inversion program, resulted in final resistivity models with relatively low RMS errors (3.5%–6.0%) for Grids 1 (a, b, c), 2, 4 and 5. The low signal to noise ratio of the dipole-dipole array is reflected in the inversion models in Grids 3, 6a and 6b with relatively higher RMS errors (10%–27%). Similar inversion parameters were used for the processing of all the grids, where the submerged subsurface was divided into ten layers of constant thickness (0.5 m), thus reaching down to a depth of 5 m below the sea. The sea water layer was also part of the modelling procedure that constrained the inversion model and its effect was taken into account based on the difference between the free water surface (0 m) and the bathymetric variations below the sea surface.
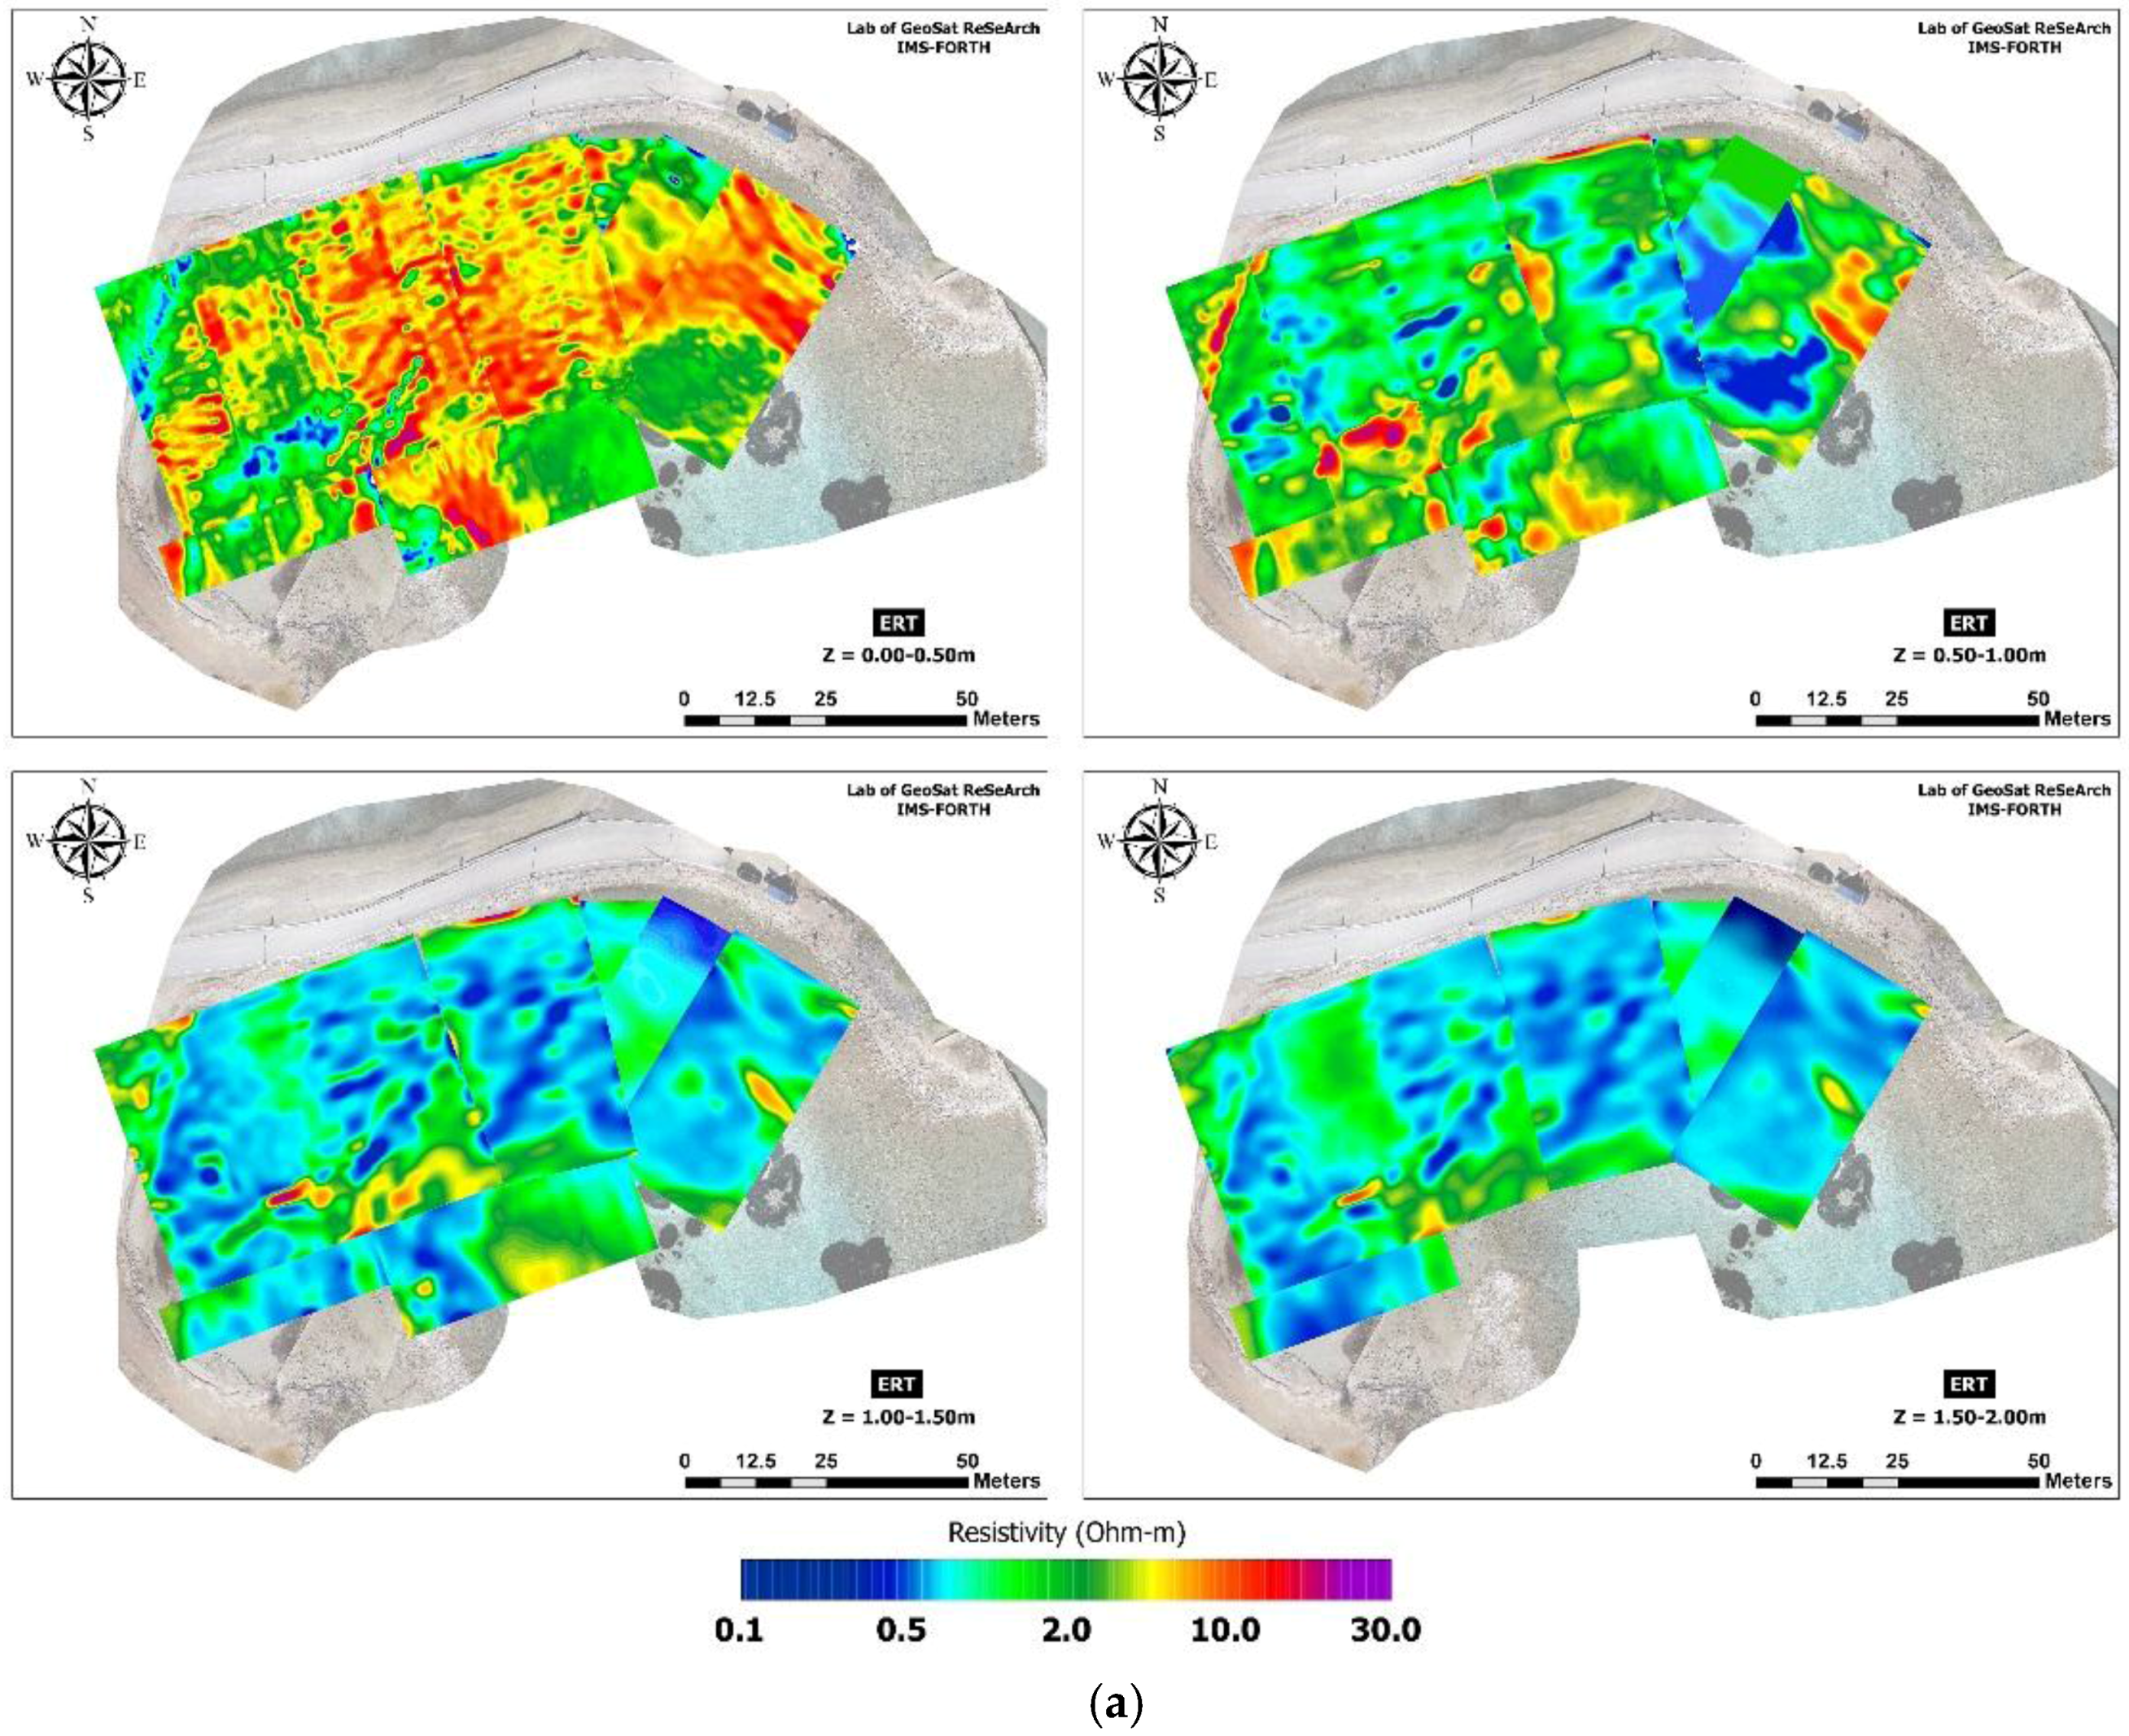
The 3-D resistivity inversion models were sliced every 0.5 m and a common colour scale was used to uniformly describe submerged resistivity variations. Slices up to a depth of two meters were extracted from all the 3-D models and were merged to compile respective master resistivity depth slices covering the whole area in Olous that was surveyed. The mismatch at the edges of the grids in each master depth slice was minimized with histogram equalization. However, this problem still remained in the deeper depth slices, which is attributed to the fewer data points in these deeper parts at the edges of the grids. This problem is also amplified by the inherent limitation of the 3-D inversion to accurately reconstruct the resistivity at the edges of the modelling space (
Figure 11a).
The resistivity variations show substantial heterogeneity in the layer up to one meter from the sea bottom where the majority of the archaeological remains exist (
Figure 11b). The depth slices outline linear and rectangular resistive anomalies related to submerged structures covered by the sea and recent marine sediments. This is in accordance with the 2-D results and the respective conceptual model where the potential anthropogenic relics are concentrated and expanded within the first meter below the sea bottom. The conductive signature at depths below one meter is attributed to the fine grained layer which was also mapped through the individual 2D vertical sections (
Figure 11).
5. Discussion
The historical importance of Olous is mainly related to (or derived from) its location in the marine crossroad connecting Northern Crete with the Aegean islands and the wider Mediterranean area. This is supported by the ancient Classical texts where Olous is described as an important city port, which probably flourished in accordance with the general trend in developing maritime connections during the period after the 6th century BCE and the special attention given to Greek warships. Such development consisted also in the construction, for the first time in the Aegean, of built ports where warships were protected by walls from potential attacks from land or sea.
The first systematic mapping and documentation of the visible submerged architectural remains (walls, structures, buildings and roads) in Olous was completed in the summer of 2015 in collaboration with the Greek Ephorate of Underwater Archaeology through in situ diving. A first rough estimation of the potential settlement extent can be extracted by the outline of the probable Hellenistic fortification wall to the south and two fortified towers to the north. The southern fortress wall has been identified at depths of 2–2.5 m below the modern sea surface. It encloses the bay from east to west defining a curved area covered with scattered stones to the southeast (
Figure 1b).
A very well preserved building with recognizable rooms and separating walls is clearly visible in the southeastern part of the bay and submerged in water less than a meter deep. The in situ inspection clearly showed walls of different occupation phases, although the precise functionality of the complex cannot be established precisely at present. On the opposite side of the bay to the southwest the in-land basilica clearly continues towards the sea forming a large religious complex. At the northeastern part of the bay, next to the modern canal, the archaeological survey has identified thick walls (~1–1.5 m) related to foundations of large and tall structures potentially related to public buildings (
Figure 1b).
The resistivity depth slice of 0.0–0.5 m best defines the resistive anomalies outlined though the ERT survey, indicating at the same time the average thickness of the structures buried below the bottom of the sea (
Figure 12a). The western part of the bay is delimited by a long diagonal southwest-northeast wall and a large rectangular structure. The resistivity survey did not image this long diagonal wall due to specific field logistical constraints since the marine cable was placed over the wall while the respective electrodes were submerged into the sea on both sides of the wall with extension cables. Within the western part of the rectangular structure named O1, ERT shows at least four rectilinear anomalies aligned with the southwest-northeast walls of the structure. The largest of them is ~9 m long and 1.8 m wide (
Figure 12b).
The group of anomalies O2 is mainly parallel to the northeast–southwest visible walls. South of O2, geophysics mapped the continuation to the northeast of a southwest–northeast diagonal wall, measuring a total length of ~25 m (O3). At least two diagonal features and possibly another are also reconstructed further to the north and south of O3 with almost equal separation distances of about 3.5–5 m. The area O4 is characterized by at least five east–west indications of buried architecture with the longest almost 9 m in length and the shortest 4.5 m. Area O5 is occupied by two southeast–northwest and two southwest–northeast features, where the latter are buried within the range of 0.5–1.0 m (
Figure 12b).
Anomalies O1 to O5 have strong resistive signatures signifying the relatively high level of preservation of the submerged features. At the same time these structures share similar orientations with the visible submerged relics thus giving a strong indication of their belonging to the same construction phase, which is either related to the salt pans or a more modern phase (
Figure 12b).
Moving to the east, the resistivity survey depicts three linear southwest–northeast features (O6a) which correlate well with the visible remains in that area, showing the continuation of the northern southwest–northeast wall in that direction. The rectangular structure in O6b occupies a section of 20 m × 8 m which is probably related to a building. Further to the south a structural complex of 25 m × 20 m with crossing walls and at least nine compartments is reconstructed through the resistivity map (
Figure 12b).
Towards the eastern section of the bay the ERT investigation outlined two long curvilinear features of about 26 m, probably related to the corridors (O8a) that are in almost a parallel orientation with a visible submerged structure. The strong resistive signatures in area O8b denoting linear and parallel structural segments are probably related to wall foundations with a high level of preservation. Finally, the compact high resistivity region in area O9 which does not exhibit a pronounced regular shape is probably related to a collapsed submerged structure (
Figure 12b).
The wealth of information retrieved from the ERT survey, in combination with the aerial photo interpretation and processing, helps to establish a first-order reconstruction of the ancient or even relatively modern landscape of Elounda. The ERT interpreted data to the west provide further details for this area identifying potential sub-divisions of spaces, which are in line with common practices of salt production ([
25], and in particular, pp. 89–94), even in modern times. Salt pans need to be close to the sea (normally regulated with channels) and require controlled depth difference with respect to the mean sea level to work properly. The most preserved long wall to the south of O5 and O3 may represent a later adjustment of the salt pans (given construction techniques, the use of mortar and the more elevated profile).
The eastern part of the bay has some common aspects but also differences with the western part. In one respect the general orientation of the structures seems mirrored to those in the west, probably defining the other side of the curving bay as one would expect. At the same time, no salt pans are attested in the immediate area, and neither do the documented submerged structures suggest any internal division to be compatible with salt production compartments. This area is therefore the most problematic and interesting at the same time.
The features named as O7 are of particular importance since their apparent orientation does not seem to match with any nearby structure. Furthermore, they seem to be distributed along regular orthogonal axes, allowing us to suppose that they belong to a regular urban plan as one would expect in Hellenistic or Roman periods. Yet it is still too early to say with a high degree of confidence that these traces belong to the earlier settlement of the bay, and research should be expanded towards the south in search of possible architectural continuations with similar orientations and a regular grid. Nevertheless, this first systematic approach has brought to light essential information not visible with the naked eye about the historic layout of this ancient settlement.
6. Conclusions
The possibility of applying well-known geoinformation methods like Electrical Resistivity Tomography and Global Navigation Satellite System to un- (or under-) explored archaeological shallow-water contexts was very important from a methodological point of view and for the results obtained. Indeed, although the adaptation of commonly used tools to depths shallower than two meters presented some challenges and required the creation or customization of equipment, the final results support such efforts and provide useful information for understanding the complex and stratified archaeological site of Olous.
Specifically, the in situ experience from the archaeological site of Olous led to the conclusion that ERT is capable of providing a robust method for mapping and reconstructing submerged archaeological structures related to ancient built environment (walls, buildings, roads). These archaeological relics exhibit appropriate resistivity signatures, thus contrasting with the surrounding conductive sediments filled with saline water. The inherent limitation of employing the ERT in a purely conductive environment is counterbalanced by the incorporation of precise knowledge for the conductivity and bathymetry of the saline water in the modelling and inversion procedure.
The innovative aspect of the work arises from the adaptation and development of a well- established and consolidated technique (ERT) to a shallow water context. At the same time, this approach surely needs refinement and will benefit from inputs from different and complementary disciplines. For example, different electrode array configurations suitable for dynamic mode acquisition have to be extensively tested though numerical modelling and in situ applications. The establishment of appropriate dynamic ERT measurement protocols will definitely reduce survey time, while increasing field productivity without actually reducing the quality and resolution of final results. The appropriate integration and adaptation of different geophysical techniques (e.g., multiple magnetic gradiometry) to shallow off-shore environments will add a second layer of information and confidence for a more complete underwater reconstruction.
The use of historical photos and aerial images with the compilation of orthophotos based on recently acquired high resolution aerial images from a Remotely Pilot Aerial Systems (RPAS) can provide additional contributions to data interpretation within a unified environmental setting. Ultimately the results of this work can be regarded as a first step toward the development of an effective interdisciplinary research model that could be applied to similar archaeological surveys in coastal or shallow-water environments.
Acknowledgments
The fieldwork activities of the project “Reconstruction of the Cultural Dynamics in Shallow Marine Environment through Electrical Resistivity Tomography and Photogrammetry in the Coastal Archaeological Site of Olous, Crete, Greece” were funded by the International Society for Archaeological Prospection (ISAP) through the First ISAP Fund Grant. The IT department of GeoSat ReSeArch Lab designed and created a dedicated web page with a WEB-GIS application for the wider communication of the ISAP projects results to the community (
http://ims.forth.gr/project.php?c=46&l=g&pid=79&d=7). Data processing and interpretation was conducted under the basic research program of Foundation for Research and Technology-Institute for Mediterranean Studies. The authors are grateful to Theotokis Theodoulou for assisting in the data interpretation and the Ephorate of Underwater Antiquities in Greece for giving the appropriate permissions for accessing the site of Olous and publishing the results. The three anonymous reviewers are also acknowledged for their constructive criticism of the original manuscript. Panagiotis Tsourlos, Professor of Applied Geophysics in Aristotle University of Thessaloniki is acknowledged for editing the text of the manuscript.
Author Contributions
Simyrdanis Kleanthis: structure of the article and data assembly, ERT data acquisition and processing. Nikos Papadopoulos: structure of the article and data assembly, ERT data interpretation. Gianluca Cantoro: archaeological interpretation, low-altitude aerial images and revision of text.
Conflicts of Interest
The spatial raw data collected in the archaeological site of Olous are freely available to the academic and research community. The users are welcome to submit a simple letter of interest via e-mail to one of the authors identifying their affiliation and the purpose of use. Based on the permission granted by the Greek Ephorate of Underwater Antiquities to GeoSat ReSeArch Lab figures 1b, 3, 7, 8, 9, 11 and 12 are allowed to be published with a graphic scale and the north arrow omitting the coordinates.
References
- Apostolos, S. Best Practices of Geoinformatic Technologies for the Mapping of Archaeolandscapes; David Brown Book: Oakville, CT, USA, 2015. [Google Scholar]
- Gaffney, C. Detecting trends in the prediction of the buried past: A review of geophysical techniques in archaeology. Archaeometry 2008, 50, 313–336. [Google Scholar] [CrossRef]
- Linford, N. The application of geophysical methods to archaeological prospection. Rep. Prog. Phys. 2006, 69, 2205–2257. [Google Scholar] [CrossRef]
- Sarris, A.; Jones, R. Geophysical and related techniques applied to archaeological survey in the Mediterranean: A review. J. Mediterr. Archaeol. 2000, 13, 3–75. [Google Scholar] [CrossRef]
- Sakellariou, D.; Georgiou, P.; Mallios, A.; Kapsimalis, V.; Kourkoumelis, D.; Micha, P.; Theodoulou, T.; Dellaporta, K. Searching for ancient shipwrecks in the Aegean Sea: The discovery of Chios and Kythnos Hellenistic wrecks with the use of marine geological-geophysical methods. Int. J. Naut. Archaeol. 2007, 36, 365–381. [Google Scholar] [CrossRef]
- Papatheodorou, G.; Geraga, M.; Christodoulou, D.; Iatrou, M.; Fakiris, E.; Heath, S.; Baika, K. A marine geoarchaeological survey, cape Sounion, Greece: Preliminary results. Mediterr. Archaeol. Archaeom. 2014, 14, 357–371. [Google Scholar]
- Müller, C.; Woelz, S.; Ersoy, Y.; Boyce, J.; Jokisch, T.; Wendt, G.; Rabbel, W. Ultra-high-resolution marine 2D–3D seismic investigation of the Liman Tepe/Karantina Island archaeological site (Urla/Turkey). J. Appl. Geophys. 2009, 68, 124–134. [Google Scholar] [CrossRef] [Green Version]
- Boyce, J.I.; Reinhardt, E.G.; Raban, A.; Pozza, M.R. Marine magnetic survey of a submerged Roman harbour, Caesarea Maritima, Israel. Int. J. Naut. Archaeol. 2004, 33, 122–136. [Google Scholar] [CrossRef]
- Paoletti, V.; Secomandi, M.; Piromallo, M.; Giordano, F.; Fedi, M.; Rapolla, A. Magnetic survey at the submerged archaeological site of Baia, Naples, southern Italy. Archaeol. Prospect. 2005, 12, 51–59. [Google Scholar] [CrossRef]
- Cocchi, L.; Stefanelli, P.; Carmisciano, C.; Caratori Tontini, F.; Taramaschi, L.; Cipriani, S. Marine archaeogeophysical prospection of Roman Salapia Settlement (Puglia, Italy): Detecting ancient harbour remains. Archaeol. Prospect. 2012, 19, 89–101. [Google Scholar] [CrossRef]
- Klein, C. Geophysical investigations in shallow water at the harbor site of Elaia: Harbor city of the ancient Pergamon. In Proceedings of the 9th International Conference on Archaeological Prospection, Izmir, Turkey, 19–24 September 2011; pp. 133–135.
- Colombero, C.; Comina, C.; Gianotti, F.; Sambuelli, L. Waterborne and on-land electrical surveys to suggest the geological evolution of a glacial lake in NW Italy. J. Appl. Geophys. 2014, 105, 191–202. [Google Scholar] [CrossRef]
- Okyar, M.; Yılmaz, S.; Tezcan, D.; Çavaş, H. Continuous resistivity profiling survey in Mersin Harbour, Northeastern Mediterranean Sea. Mar. Geophys. Res. 2013, 34, 127–136. [Google Scholar] [CrossRef]
- Kelly, B.F.J.; Allen, D.; Ye, K.; Dahlin, T. Continuous electrical imaging for mapping aquifer recharge along reaches of the Namoi River in Australia. Near Surf. Geophys. 2009, 7, 259–270. [Google Scholar] [CrossRef]
- Mansoor, N.; Slater, L. Aquatic electrical resistivity imaging of shallow-water wetlands. Geophysics 2007, 72, F211–F221. [Google Scholar] [CrossRef]
- Tassis, G.; Tsourlos, P.; Rønning, J.S.; Dahlin, T. Detection and Characterisation of Fracture Zones in Bedrock in a Marine Environment—Possibilities and Limitations; Geological Survey of Norway: Trondheim, Norway, 2014; p. 74.
- Loke, M.H.; Lane, J.W. Inversion of data from electrical resistivity imaging surveys in water-covered areas. Explor. Geophys. 2004, 35, 266–271. [Google Scholar] [CrossRef]
- Loke, M.H.; Chambers, J.E.; Rucker, D.F.; Kuras, O.; Wilkinson, P.B. Recent developments in the direct-current geoelectrical imaging method. J. Appl. Geophys. 2013, 95, 135–156. [Google Scholar] [CrossRef]
- Passaro, S. Marine electrical resistivity tomography for shipwreck detection in very shallow water: A case study from Agropoli (Salerno, southern Italy). J. Archaeol. Sci. 2010, 37, 1989–1998. [Google Scholar] [CrossRef]
- Simyrdanis, K.; Papadopoulos, N.; Kim, J.-H.; Tsourlos, P.; Moffat, I. Archaeological investigations in the shallow seawater environment with electrical resistivity tomography. Near Surf. Geophys. 2015, 13, 601–611. [Google Scholar] [CrossRef]
- Apostolakou, V.; Zografaki, V. New inscribed stones in Olous. In Estudios de Epigrafia Griega; Martinez Fernandez, A., Ed.; University of La Laguna: Canary Islands, Spain, 2009; pp. 509–524. [Google Scholar]
- Pavlis, N.K.; Holmes, S.A.; Kenyon, S.C.; Factor, J.K. The development and evaluation of the Earth Gravitational Model 2008 (EGM2008). J. Geophys. Res. 2012, 117, 1–38. [Google Scholar] [CrossRef]
- Loke, M.H.; Acworth, I.; Dahlin, T. A comparison of smooth and blocky inversion methods in 2D electrical imaging surveys. Explor. Geophys. 2003, 34, 182–187. [Google Scholar] [CrossRef]
- Institute of Geology and Mineral Exploration (IGME). Geological Map of Greece-Agios Nikolaos Sheet, 1:50,000; IGME: Athens, Greece, 1987. [Google Scholar]
- Carusi, C. IL Sale Nel Mondo Greco (VI A.C.-III D.C.): Luoghi di Produzione, Circolazione Commerciale, Regimi di Sfruttamento Nel Contesto del Mediterraneo antico; Pragmateiai; Edipuglia: Bari, Italy, 2008. [Google Scholar]
Figure 1.
(a) Landsat satellite image of Crete showing the location of the submerged archaeological site of Olous; (b) Detail of the area that was surveyed in Olous in January 2016 (in red) along with the visible archaeological submerged features (in yellow). (1) Fortified towers; (2) fortification wall; (3) tier; (4) building complex; (5) basilica; (6) walls; (7) salt pans; (8) area covered by the project.
Figure 2.
Base and rover Global Navigation Satellite System (GNSS) units used in the topographic mapping of Olous.
Figure 2.
Base and rover Global Navigation Satellite System (GNSS) units used in the topographic mapping of Olous.
Figure 3.
Spatial distribution of the points collected with the GNSS rover unit in the bay of Olous. These points were used to compile the bathymetry model of the bay. The red polygon outlines the area covered with the Electrical Resistivity Tomography method.
Figure 3.
Spatial distribution of the points collected with the GNSS rover unit in the bay of Olous. These points were used to compile the bathymetry model of the bay. The red polygon outlines the area covered with the Electrical Resistivity Tomography method.
Figure 4.
(a) Static and (b) Dynamic submerged survey modes employed in Olous for the electrical resistivity tomography (ERT) data collection along individual 2-D lines.
Figure 4.
(a) Static and (b) Dynamic submerged survey modes employed in Olous for the electrical resistivity tomography (ERT) data collection along individual 2-D lines.
Figure 5.
(a) Dynamic electrical resistivity tomography (ERT) data acquisition along individual lines forming a geophysical grid. The instrumentation was kept secure inside a custom made floating apparatus; (b) Cable used for the acquisition of static submerged ERT data.
Figure 5.
(a) Dynamic electrical resistivity tomography (ERT) data acquisition along individual lines forming a geophysical grid. The instrumentation was kept secure inside a custom made floating apparatus; (b) Cable used for the acquisition of static submerged ERT data.
Figure 6.
Configurations used for data collection: (a) Dipole–dipole and (b,c) Pole–dipole (forward + reverse).
Figure 6.
Configurations used for data collection: (a) Dipole–dipole and (b,c) Pole–dipole (forward + reverse).
Figure 7.
Layout of the grids and the individual electrical resistivity tomography (ERT) lines used to cover the southern bay in Olous.
Figure 7.
Layout of the grids and the individual electrical resistivity tomography (ERT) lines used to cover the southern bay in Olous.
Figure 8.
Digital bathymetry model of Elounda Bay compiled by the interpolation of the points logged with the Real Kinematic Global Navigation Satellite System (RTK-GNSS).
Figure 8.
Digital bathymetry model of Elounda Bay compiled by the interpolation of the points logged with the Real Kinematic Global Navigation Satellite System (RTK-GNSS).
Figure 9.
Orthophoto of Elounda Bay (obtained by photogrammetric processing of photographs from a remotely piloted aerial system) on top of which the visible submerged stones and walls have been mapped.
Figure 9.
Orthophoto of Elounda Bay (obtained by photogrammetric processing of photographs from a remotely piloted aerial system) on top of which the visible submerged stones and walls have been mapped.
Figure 10.
Representative 2-D resistivity inversion models from Grids 1 (a); 2 (b); 4 (c) and 5 (d) describing the vertical stratigraphy below the sea; (e) Simplified conceptual model of the main stratigraphic units interpreted though the 2D electrical resistivity tomography (ERT) models. The vertical and horizontal axis are given in meters.
Figure 11.
(a) Depth slices up to 2 m below the sea bottom extracted from the 3-D merged inversion models of the grids covering the marine surveyed area in Olous; (b) Isosurface model of high resistivity anomalies (more than 5 Ohm-m) that correspond to the buried architectural remains in Olous.
Figure 11.
(a) Depth slices up to 2 m below the sea bottom extracted from the 3-D merged inversion models of the grids covering the marine surveyed area in Olous; (b) Isosurface model of high resistivity anomalies (more than 5 Ohm-m) that correspond to the buried architectural remains in Olous.
Figure 12.
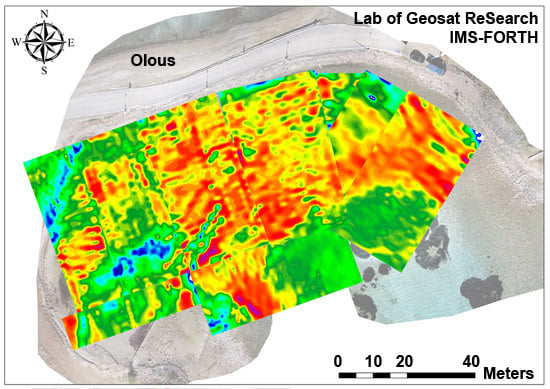
(a) Electrical Resistivity Tomography depth slice of 0.0–0.5 m overlaid on the aerial image of Elounda Bay along with the schematic interpretation (purple) of the structures which have been identified; (b) Coding of the resistivity anomalies (in light blue) from O1 to O9 defining areas of interest.
Figure 12.
(a) Electrical Resistivity Tomography depth slice of 0.0–0.5 m overlaid on the aerial image of Elounda Bay along with the schematic interpretation (purple) of the structures which have been identified; (b) Coding of the resistivity anomalies (in light blue) from O1 to O9 defining areas of interest.
© 2016 by the authors; licensee MDPI, Basel, Switzerland. This article is an open access article distributed under the terms and conditions of the Creative Commons Attribution (CC-BY) license (http://creativecommons.org/licenses/by/4.0/).


