1. Introduction
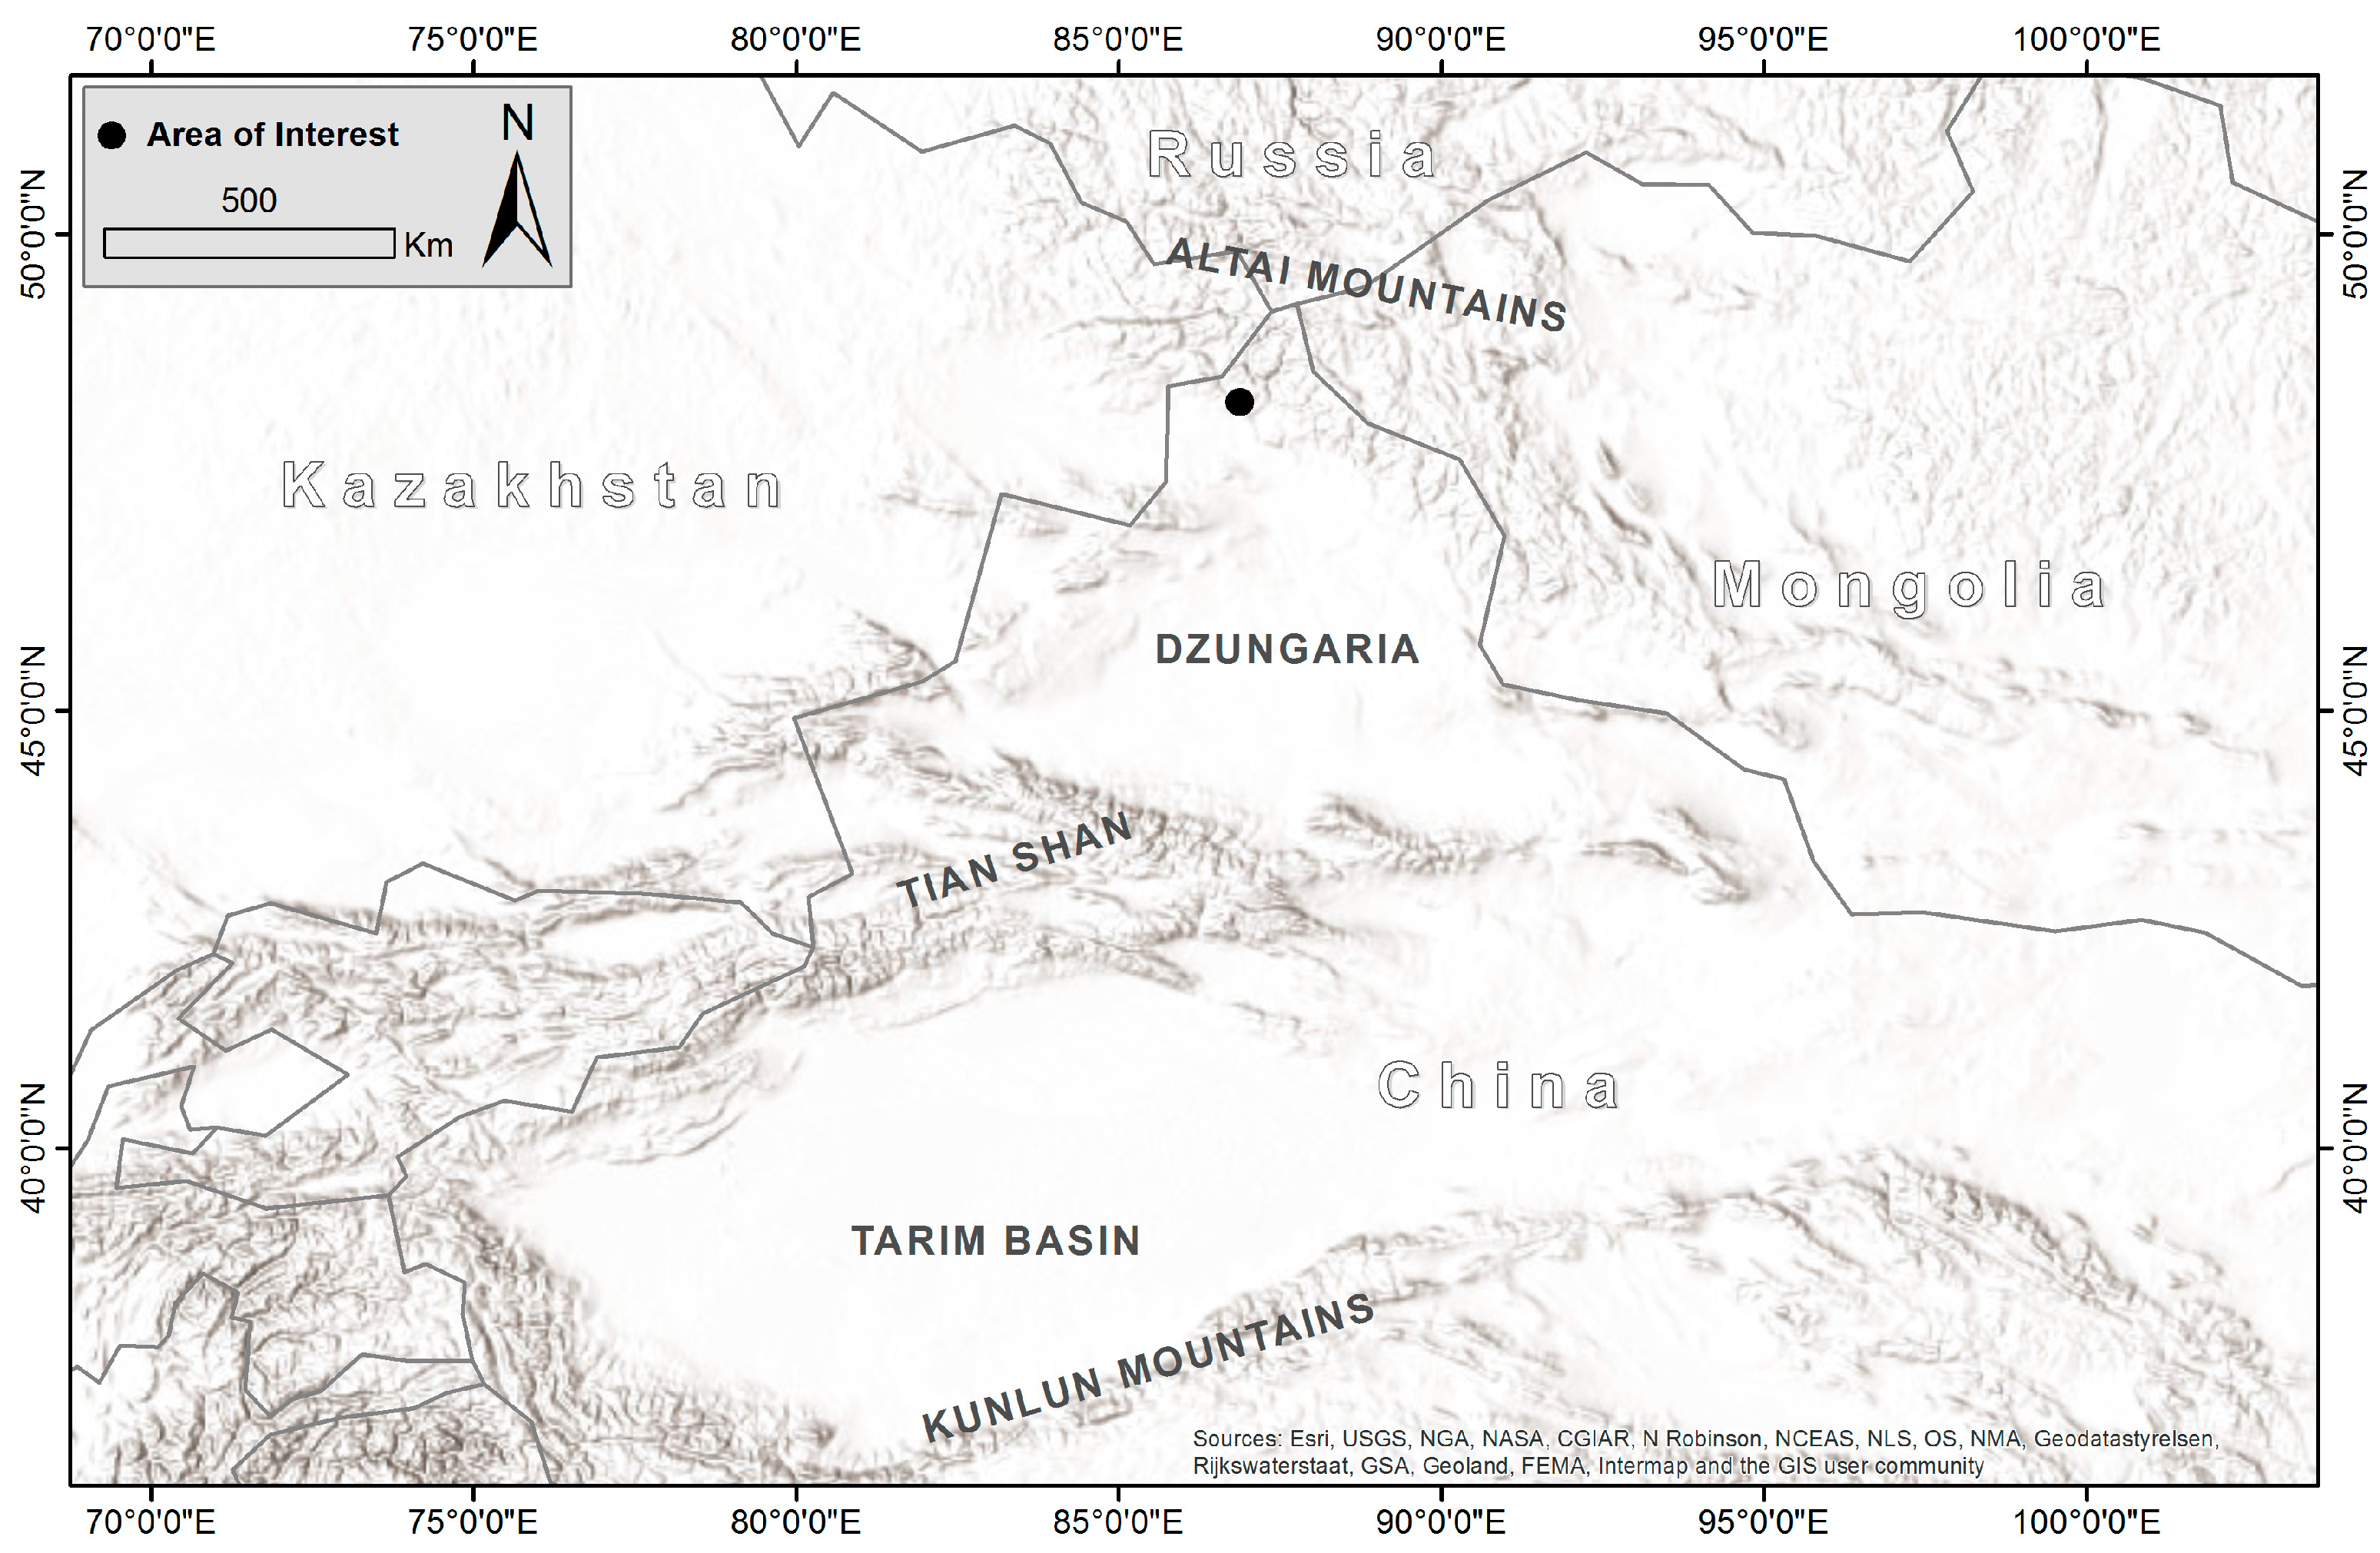
The Altai Mountains have been an important transitional zone in Central Asia for thousands of years. Today, the region is transected by the borders of China, Kazakhstan, Russia, and Mongolia, as shown in
Figure 1. It is also situated at the center of Eurasia’s four major steppe zones with the Mongolian steppe to its east, the pastures of Kazakhstan and Russia to its west, the forested taiga of Siberia in the north, and the dry arid landscapes of Xinjiang to the south [
1].
The region is one of Central Asia’s richest archaeological areas, with some of the oldest archaeological sites in Siberia dating back to 430,000 BP (before present) [
2] and an abundant Bronze and Iron Age heritage.
In this vast, rugged terrain, most valleys contain a large number of cultural heritage sites [
1,
3]. Ideally, the region should be studied as a whole in order to understand this highly complex heritage and its significance in the larger context of Central Asia. However, militarized border zones, language barriers, and differing research cultures make transnational cooperation on field projects extremely difficult. Under these circumstances, remote sensing can be an invaluable tool for the analysis of the archaeological landscape, because it (1) can cover large areas; (2) is not limited by national borders; and (3) can provide a basis for joint analysis of the larger region.
Remote sensing takes the role of a supportive tool in archaeological surveys and excavations. Both optical [
4] and Synthetic Aperture Radar (SAR) [
5] data were used for our fieldwork in summer 2015. Due to its weather independence and high geo-location accuracy, we found high-resolution SAR data to be a useful tool for planning archaeological prospections, for example when identifying areas of interest and planning the logistics of surveys. In recent years, thanks to its wider availability and higher spatial resolution, SAR is becoming more commonly used in archaeology (see, e.g., [
6,
7,
8,
9]).
A high spatial resolution is necessary in order to detect archaeological features. However, how high is the spatial resolution we need for archaeological prospections in the Altai area? Since we need to cover a large area of interest at a high resolution, the tradeoff between spatial coverage and spatial resolution in SAR acquisition becomes an important question.
In this paper, we analyze the spatial and radiometric resolutions necessary for effective identification of clusters of larger (e.g., >10 m diameter) burial mounds in the Altai Mountains. We used various TerraSAR-X (TSX) images in different acquisition modes and spatial resolutions to determine the spatial resolution required to clearly identify burial mounds of different sizes.
In
Section 2, we describe the different types of burial mounds and other structures of archaeological interest relevant for our study, which are archaeological structures with a minimum dimension of at least one square meter, since we cannot identify single stone steles from remote sensing data. In
Section 3, the test data and our methodology are introduced. In
Section 4, we present and discuss the results of our analysis and finally we state our conclusions.
2. Burial Mounds in the Altai Region
In the context of remote sensing–supported landscape archaeology, we focused on larger objects and their spatial distribution. We are especially interested in
Scythian kurgans,
Saka kurgans, and
ogradkas (see
Figure 2).
We define a Scythian kurgan as a burial mound, dating to the Iron Age, built of stones with a light central depression if it has not been robbed, often lining up in an approximate north-south direction with others of its kind. Scythian kurgans are typically between 5–15 m in diameter, but smaller and larger monuments can also be found. We define a Saka kurgan as a large earthen mound with a circular ditch, also dating to the Iron Age. The Saka kurgans are typically between 10–60 m in diameter, but again there are monuments outside this range. An ogradka is a mound-like accumulation of stones with a rectangular enclosure of big stone slabs inside and often (but not necessarily) a single stele or array of standing stones, dating to the Turkic period. Ogradkas are smaller, with a width and height of only a few meters and, as we will show below, are too small to be clearly identified from contemporary SAR remotely sensed data.
As other archaeological features, such as stone circles, standing stones, stone concentrations, etc., are often in close proximity to these larger structures, the detection of these three types can provide sufficient information for a preliminary landscape archaeological analysis and for survey planning. Furthermore, these structures are also often spatially clustered so the detection of large clusters may be sufficient for wide-area overview analysis regarding, e.g., the spatial patterns of these structures in Central Asia.
3. Data Processing and Methodology
3.1. Data Used in Our Analysis
For the experiments described in this paper we used six TSX images. In
Table 1, we listed the details of the images. TSX offers different acquisition modes. For our experiments, we used TSX stripmap (SM) data, TSX spotlight (SL) data, and TSX staring spotlight data (ST). The stripmap mode (SM) is the standard acquisition mode of a SAR sensor and in the case of TSX offers an approximately 3 m resolution. In the spotlight modes (e.g., SL and ST), the acquisition time is increased by shifting the squint angle of the sensor from slightly forward-looking to slightly backward-looking during acquisition. This increases the acquisition time and is used to enhance the spatial resolution in the azimuth direction of the sensor, allowing for an increased resolution of approximately 1.5 m in the standard spotlight mode (SL). In the staring spotlight mode, this acquisition time is further increased, leading to an approximately 0.25 m resolution in azimuth, and due to the larger bandwidth in the range of 300 MHz, compared to the 150 MHZ in SL and SM, a range resolution of approximately 1 m can be achieved. We therefore assumed that we can get the highest discernibility in the staring spotlight mode images, followed by the spotlight mode images. We expected the results from the stripmap mode images to be the least satisfactory due to their lower spatial resolution.
From our ground survey in summer 2015, we collected survey information from 842 monuments that have a spatial extension of more than one meter. As we can see from
Table 2, most of the structures have a diameter below 10 m and are therefore difficult to identify clearly in SAR images. However, the remaining 152 objects with more than a 10 m diameter should be identifiable.
3.2. Geo-Coding Considerations and Pre-Processing
TSX offers a very precise geo-referencing capability, as the orbit is well-known [
10]. The accuracy in azimuth depends mainly on the orbit accuracy and timing error and can reach below one decimeter of absolute precision. In range, the accuracy depends on the atmospheric path delay of the signal as well as on various other error sources (see, e.g., [
10,
11]). Including corrections for these errors, an absolute position accuracy of below one decimeter in range and azimuth can be achieved for TSX images acquired in a stereo configuration [
12].
Using only the path delay information included in the TerraSAR-X header files, we can achieve a precision of <0.5 m, based on our experiments with TSX data in Wuhan [
13]. To be able to geo-correct the data accordingly, we use single-look complex (SLC) data for the geo-referencing and in the following experiments. Using a corner reflector, we set up in the test area during our ground survey, we corrected for systematical errors in the GPS measurements. As it turns out, although just a handheld GPS was used, the measurements were quite accurate, and after correction for the geoid, the difference between the TerraSAR-X estimated coordinates and the GPS coordinates was <1 m, which was acceptable for our experiments.
3.3. Transforming the Survey Results into the SAR Image Coordinate System
In our experiment we were interested in the discernibility of archaeological features in SAR images. As such, we wanted the SAR images to be undisturbed to allow a better analysis of the detectability without introducing additional disturbances from resampling the data. Therefore, we transformed the survey results into the SAR coordinate system instead of resampling the SAR images to a geographic or local coordinate system.
As discussed previously, the coordinates from our ground survey were quite good, but there are still shifts and errors; we will analyze these sources of uncertainty in detail in
Section 4. After transforming the coordinates in the radar coordinate system based on the Range-Doppler model using the height information from the GPS measurements, and including the dry-atmosphere path delay information from the TerraSAR-X headers (see [
13]), we marked
Saka kurgans with a red rectangle,
Scythian kurgans with a green rectangle,
ogradkas in purple, undatable mounds in yellow and all other objects in cyan.
4. Analyzing the Detectability of Archaeological Structures
4.1. Very High Resolution TSX Staring Spotlight Images (ST)
Using the TerraSAR-X staring spotlight mode, we used four-time multi-looking in azimuth to reduce the speckle effect before analyzing the data. This resulted in almost square pixels with a pixel size of approximately 0.9 m by 0.9 m. As we can see in
Figure 3, we can clearly identify large
Saka kurgans in the TSX ST images, especially when they are clustered.
However, not all
Saka kurgans are clearly visible and there is also an increased likelihood of confusing archaeological structures with recent soil markings from husbandry, as can be seen in
Figure 4. Furthermore, large
Scythian kurgans can be identified in TSX ST images, but generally
ogradkas (in purple) are too small to be clearly identified even in TSX ST images, as we can see in
Figure 5.
4.2. TSX Spotlight Images (SL)
In the TSX spotlight mode (SL) images, the spatial resolution in azimuth is reduced to 1.6 m. In this instance, we did not use any multi-looking to keep the full spatial resolution. As we can see from the images shown in
Figure 6, the cluster of
Saka kurgans shown in
Figure 3 can also be discerned in the SL images, but appears much less clear.
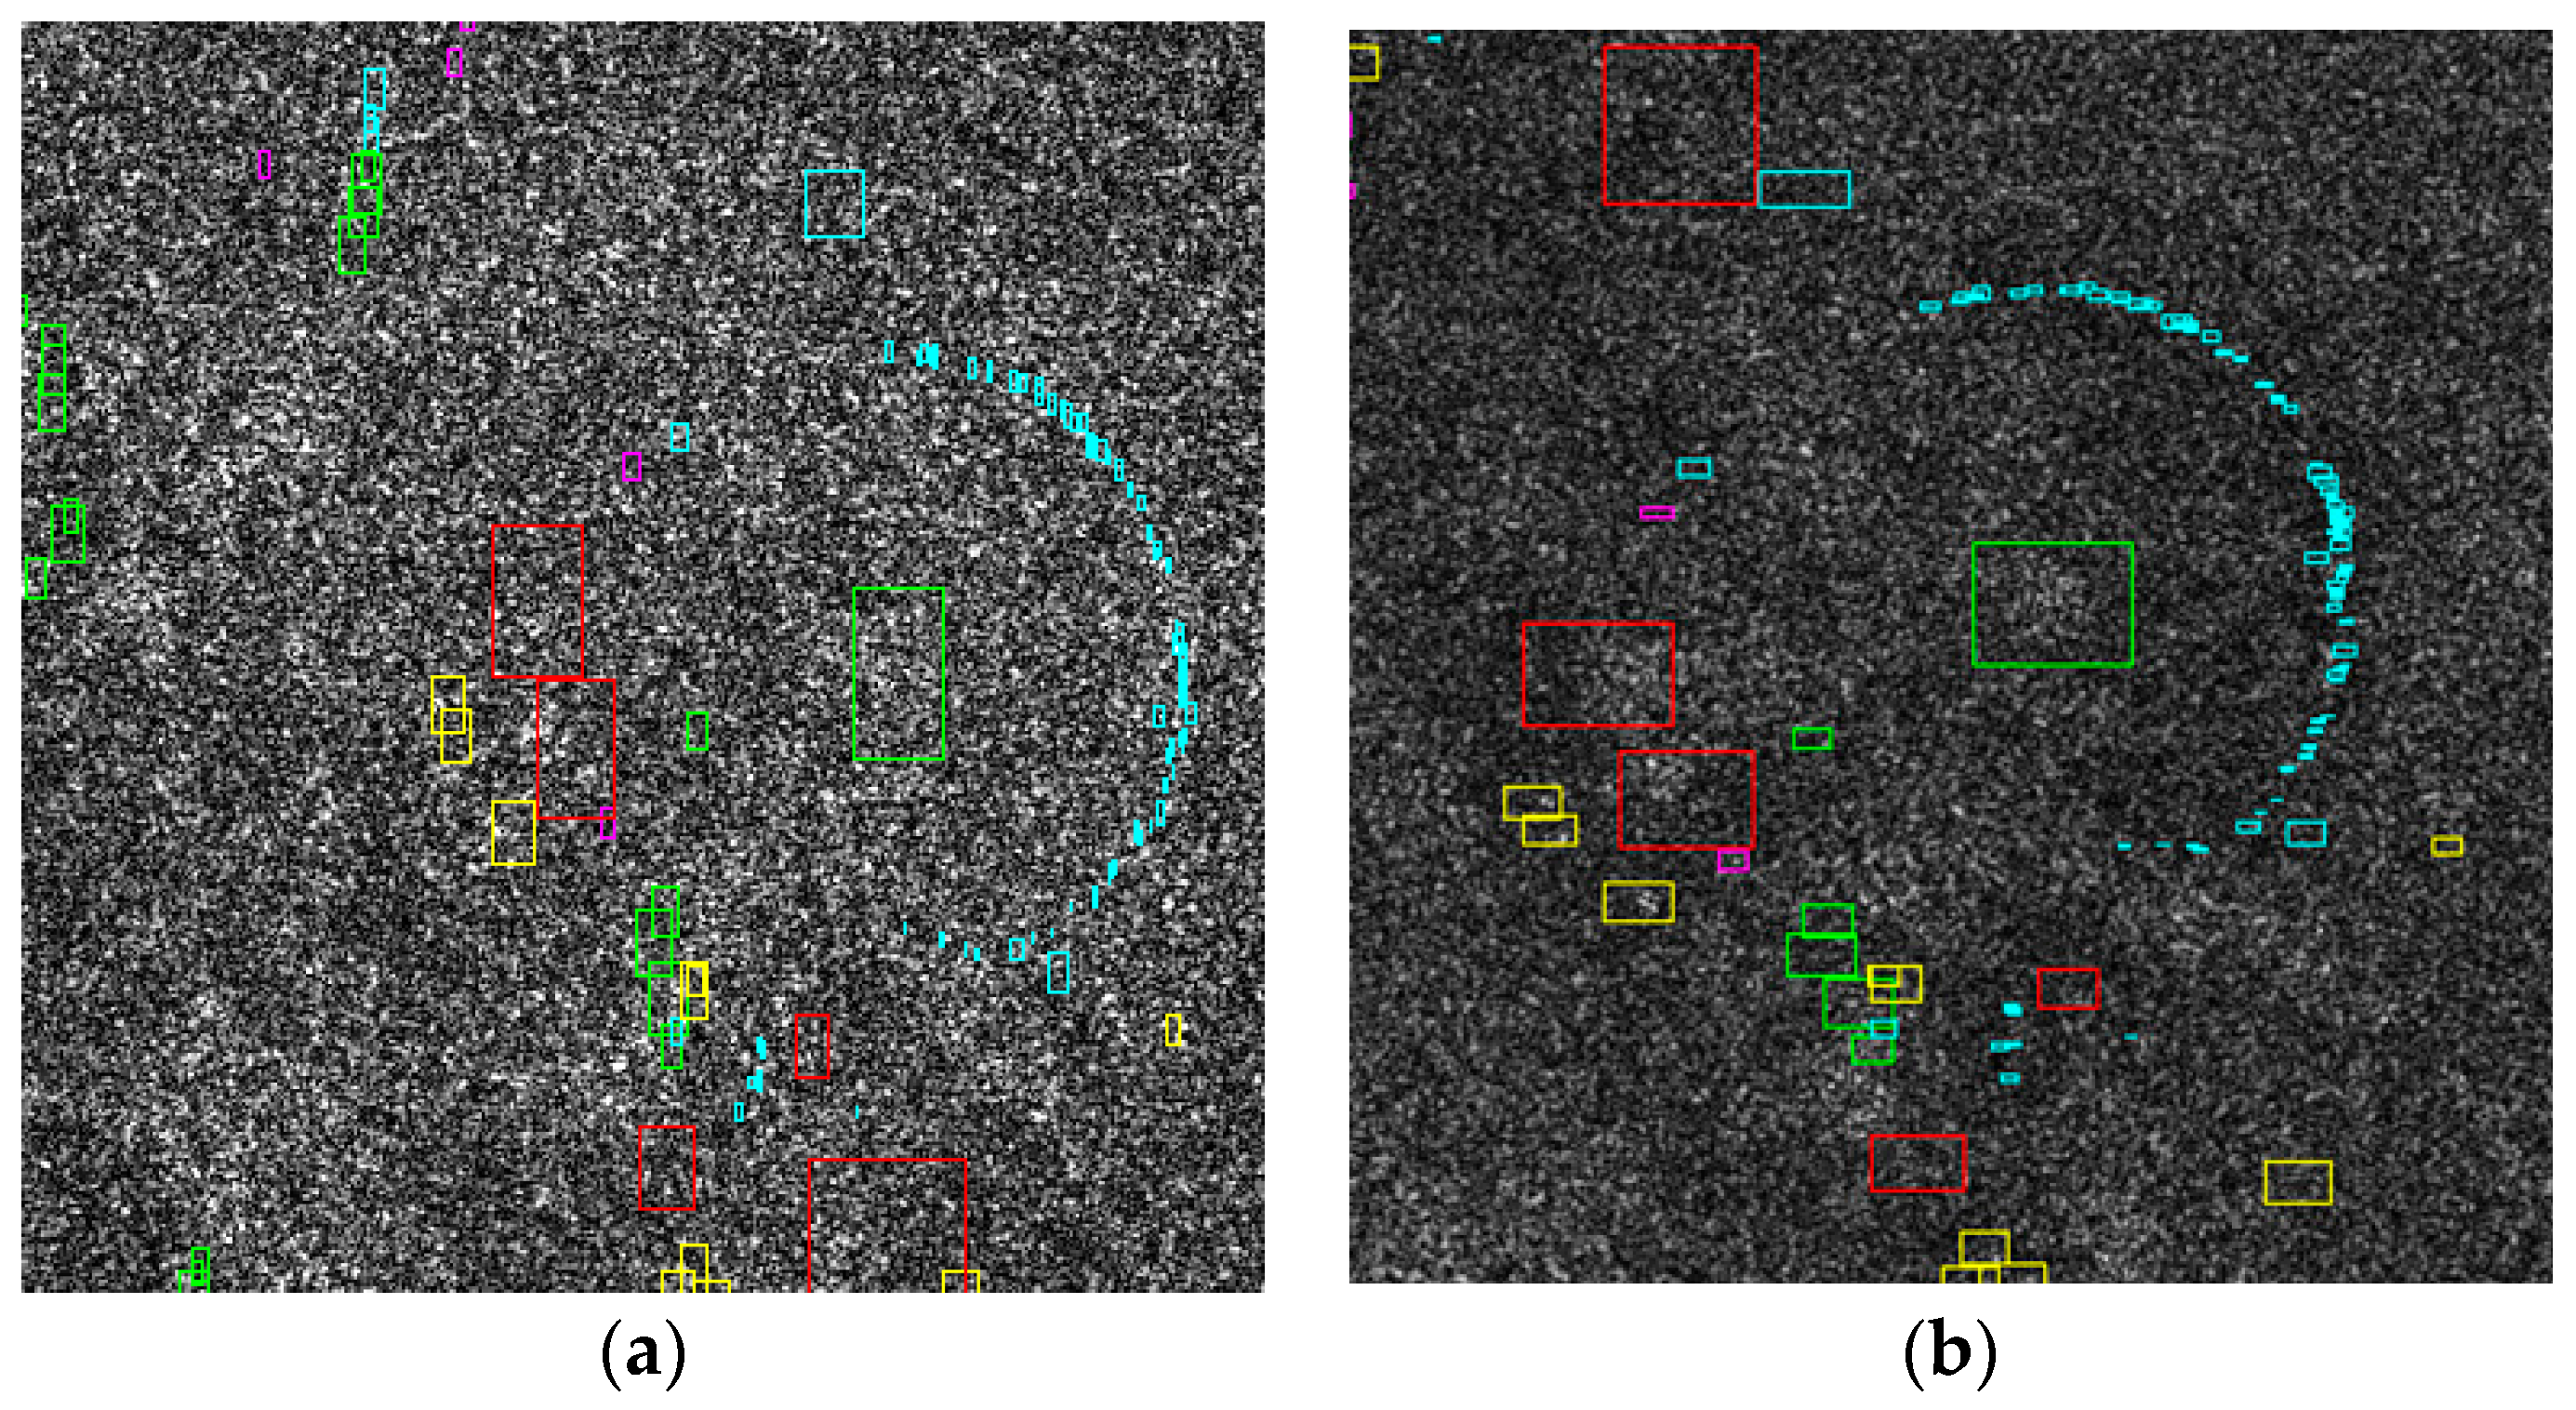
The discernibility also seems to depend on the orbit and the incidence angle. The
Saka kurgans in the image acquired on 9 July 2015, as shown in
Figure 6a, from an ascending orbit with a 37.3° incidence angle at the scene center, are harder to detect than in the image from 15 July 2015, acquired from an ascending orbit with a 22.7° incidence angle, as shown in
Figure 6b, although this image in
Figure 6a has a much smaller ground-range resolution.
However, even the large
kurgan, shown in
Figure 5, is hard to see in the SL images, as shown in
Figure 7a. The visibility is much better in
Figure 6b, the image acquired on 14 July 2015 from an ascending orbit with a 48.4° incidence angle, compared to the image from a descending orbit with a 39.9° incidence angle, shown in
Figure 7a.
Even though the cluster of
Saka kurgans seen in
Figure 3 and
Figure 6 is visible in the ST and the SL mode images, this is not true for all of these monuments, as shown in
Figure 8, where no
Saka kurgans are detectable. This is also the case in the other SL images taken from different orbits and different angles. This cluster of
kurgans is not detectable in any of the SL images.
From these results we can see the detection of larger burial structures is still possible in SL mode images; nevertheless, detection depends strongly on the type of object and the acquisition parameters. Generally, very flat and very steep acquisition angles are preferable, as they enhance the visibility of three-dimensional structures by increasing the layover or the shadow area, respectively. Nevertheless, from an operational point of view the detectability of larger structures in SL images is already very limited and cannot be guaranteed.
4.3. TSX Stripmap Images (SM)
As we can see from
Figure 9, when marked we can detect some of the
Saka kurgans in the cluster, but it would generally be very difficult or even impossible to recognize grave mounds without any previous knowledge. Therefore, TSX stripmap data is not suitable for the detection of these types of archaeological structures.
4.4. Quantifying the Analysis
In the sections above, we demonstrated the discernibility of several archaeological structures in TSX images of different spatial resolutions, modes, orbits, and incident angles. However, for quantifying the results, we generated a random sample of image subsets showing Saka kurgans and Scythian kurgans of different sizes from different images. As we want to analyze the discernibility of the structures in the data and not the advantages and disadvantages of automatic detection methods, we instead tested the visual detectability by showing the images to a test group and asking them to detect the structures in the images.
Our test group consisted of 11 members, all graduate students with experience in SAR image analysis. Only one of the group members has knowledge of archaeology and only two had knowledge of the region.
For each set of different object sizes, two examples were randomly selected and 200 × 200 pixel image subsets from different images were created. To keep the number of images limited for the test group, we selected three sample images: a TSX stripmap mode image from 5 June 2014, a TSX spotlight image from 14 July 2015, and a TSX staring spotlight image from 16 September 2015 (see
Table 1).
We presented the images in slant-range and in the original resolution. However, for the staring spotlight image, we multi-looked four times in azimuth. As the interpretability of SAR images may also depend on the stretching of the amplitude data to the eight-bit grey-scale display, we used two different stretching methods. For the first method we calibrated the data to beta-nought in dB and stretched that from −15 dB to 10 dB for visualization. In the second method, we used a square root of the digital number and stretched the images between 0 and . However, that did not make a significant difference in the results and we therefore aggregated these results together in the analysis. Furthermore, we presented the test group with three response options to the question “Can they can identify a burial mound in the center of the test image?”: yes, maybe, and no.
As we can see from the results shown in
Table 3, the majority could not discern the archaeological features in the stripmap image. Even the large
Saka kurgans were only identified by around 22% of the test group. In the spotlight image, the ‘maybe’ responses dominated and none of the objects are identified clearly. Only in the ST images did a majority respond that a clear identification of the objects was possible. Interestingly, the identification of the
Saka kurgans was generally less certain than the
Scythian kurgans.
For analyzing the discernibility, we used two methods for considering a burial mound to be detected. In the first method, an object needs to have >50% of the test persons clearly identify the object as a burial mound and >75% percent of the test persons identify it as a mound or maybe identifiable as a mound.
Under these rather strict conditions, all of the grave mounds with a >10 m diameter were identified in the staring spotlight image and 50% of the kurgans with a <10 m diameter were identified in the staring spotlight image. However, none of the examples were identified in the spotlight or the stripmap image.
In our second method, we defined every object that had more than 75% of the test persons voting with yes or maybe. Under these conditions, all the objects with a diameter of 10 m and above were identified in the staring spotlight images. Of the Saka kurgans larger than 30 m, 50% were identified in the stripmap and the spotlight images. From the Scythian kurgans of a more than 10 m diameter, 66% were identified in the spotlight image, but none were identified in the stripmap image. For the kurgans with a diameter of 10 m, only half were identified in the spotlight image and none in the stripmap image.
5. Discussion
As shown by our results, using the staring spotlight mode, most larger mounds (>10 m diameter) were clearly distinguished and clusters of smaller mounds were also identifiable. However, the high spatial resolution of the staring spotlight mode comes with a reduced coverage, making it very difficult and expensive to obtain data from large areas, whereas in spotlight and especially in the stripmap mode, large areas can be covered. The problem is that in these modes even the largest mounds (>30 m diameter) were only seldom identified clearly, making these modes unsuitable for mound detection.
Due to the speckling effect, the discernibility of large archaeological and natural structures in SAR images is, especially in comparison with more recent man-made structures, quite limited. Compared to optical imagery, we estimate it would require approximately a two- to three-times-higher spatial resolution for the clear identification of burial mounds. In our experience, we were able to identify larger burial mounds in optical images with a resolution of about one meter; however, for SAR imagery we need at least the spatial and radiometrical resolution of the TSX staring spotlight mode data to discern the burial mounds in our test site. Although we tested many different modes and acquisition parameters, there might be approaches that provide better results and that would certainly be valuable for further research. Future inquiries might focus on polarimetric analyses as well as time-series and multi-baseline interferometry.
6. Conclusions
In this paper, we demonstrated the discernibility of burial mounds in TSX images of different acquisition modes. We showed that in the staring spotlight mode, more than 50% of the larger mounds (>10 m diameter) can clearly be identified with more than 75% positive votes. Furthermore, clusters of smaller mounds are also identifiable. However, in the spotlight and stripmap mode, even the largest mounds (>30 m diameter) were only clearly identified in about 16% and 22% of the cases, respectively, making these modes unsuitable for mound detection.
Based on our experiments, we conclude that the TerraSAR-X staring spotlight mode is useful for archaeological applications, because that mode approaches the spatial resolution of many archaeological features. This was also recently demonstrated by Tapete et al. [
14] using TSX staring spotlight data to measure the rates of looting activities in Syria. As such, the staring spotlight mode might pave the way towards an increased use of SAR in archaeology. However, for landscape analysis and wide-area mapping, the staring spotlight mode data is less advantageous due to the limited acquisition size.
Nevertheless, with the approval at the World Radio Conference in November 2015, future SAR systems will be able to use the 1200 MHz spectrum range in X-band, allowing for much higher spatial resolution in stripmap mode, thus opening possibilities for SAR data usage in wide-area mapping of archaeological features. With the next-generation systems, e.g., TerraSAR-X NG (next generation), very-high-resolution stripmap mode data will become available and will catalyze SAR data applications suitable for landscape archaeology.
Acknowledgments
This work was supported in part by the National Natural Science Foundation of China under Grants 61331016 and 41174120, the CAS-CSIRO Cooperative Research Program (Grant No. GJHZ1407), the Archaeocare Foundation, as well as the Swiss National Science Foundation (Grant P2SKP1_168315). The TerraSAR-X data was provided by DLR via MTH2240. The authors would also like to especially thank the Xinjiang branch of the Chinese Academy of Sciences for their support during our field work.
Author Contributions
T. Balz designed and performed the experiments. G. Caspari was responsible for the archaeological analysis; B. Fu organized the field work; M. Liao contributed in editorial and technical support. T. Balz and G. Caspari wrote the paper.
Conflicts of Interest
The authors declare no conflict of interest.
References
- Gheyle, W. Highlands and Steppes: An Analysis of the Changing Archaeological Landscape of the Altay Mountains from the Eneolithic to the Ethnographic Period. Ph.D. Thesis, University of Ghent, Ghent, Belgium, 2009. [Google Scholar]
- Chlachula, J. Pleistocene climate change, natural environments and Palaeolithic occupation of the Altai area. Quat. Int. 2001, 80–81, 131–167. [Google Scholar] [CrossRef]
- Plets, G. Heritages in the Making. Ph.D. Thesis, University of Ghent, Ghent, Belgium, 2013. [Google Scholar]
- Caspari, G.; Balz, T.; Liu, G.; Wang, X.Y.; Liao, M.S. Application of Hough Forests for the detection of grave mounds in high-resolution satellite imagery. In Proceedings of the 2014 IEEE International Geoscience and Remote Sensing Symposium (IGARSS), Quebec City, QC, Canada, 13–18 July 2014; pp. 906–909.
- Balz, T.; Caspari, G.; Erasmi, S.; Fu, B.H.; Rosenbauer, R.; Liao, M.S. Analyzing TerraSAR-X staring spotlight mode data for archaeological prospections in the Altai Mountains. In Proceedings of the APSAR 2015, Singapore, 1–4 September 2015.
- Chen, F.L.; Lasaponara, R.; Masini, N. An overview of satellite synthetic aperture radar remote sensing in archaeology: From site detection to monitoring. J. Cult. Herit. 2015. [Google Scholar] [CrossRef]
- Erasmi, S.; Rosenbauer, R.; Buchbach, R.; Busche, T.; Rutishauer, S. Evaluating the quality and accuracy of TanDEM-X digital elevation models at archaeological sites in the Cilician Plain, Turkey. Remote Sens. 2014, 6, 9475–9493. [Google Scholar] [CrossRef]
- Stewart, C.; Lasaponara, R.; Schiavon, G. ALOS PALSAR analysis of the archaeological site of Pelusium. Archaeol. Prospect. 2013, 20, 109–116. [Google Scholar] [CrossRef]
- Linck, R.; Busche, T.; Buckreuss, S.; Fassbinder, J.W.E.; Seren, S. Possibilities of archaeological prospection by High-resolution X-band Satellite Radar—A case study from Syria. Archaeol. Prospect. 2013, 20, 97–108. [Google Scholar] [CrossRef]
- Eineder, M.; Minet, C.; Steigenberger, P.; Cong, X.; Fritz, T. Imaging geodesy—Toward centimeter-level ranging accuracy with TerraSAR-X. IEEE Trans. Geosci. Remote Sens. 2011, 49, 661–671. [Google Scholar] [CrossRef]
- Schubert, A.; Jehle, M.; Small, D.; Meier, E. Influence of atmospheric path delay on the absolute geolocation accuracy of TerraSAR-X high-resolution products. IEEE Trans. Geosci. Remote Sens. 2010, 48, 751–758. [Google Scholar] [CrossRef] [Green Version]
- Balss, U.; Gisinger, C.; Cong, X.; Brcic, R.; Steigenberger, P.; Eineder, M.; Pail, R.; Hugentobler, U. High resolution geodetic earth observation with TerraSAR-X: Correction schemes and validation. In Proceedings of the 2013 IEEE International Geoscience and Remote Sensing Symposium (IGARSS), Melbourne, Australia, 21–26 July 2013.
- Wang, J.H.; Balz, T.; Liao, M.S. Absolute geolocation accuracy investigation of high resolution spotlight TerraSAR-X image in Wuhan. Spat. Geoinf. Sci. 2016. submitted. [Google Scholar]
- Tapete, D.; Cigna, F.; Donoghue, D.N.M. ‘Looting marks’ in space-borne SAR imagery: Measuring rates of archaeological looting in Apamea (Syria) with TerraSAR-X Staring Spotlight. Remote Sens. Environ. 2016, 178, 42–58. [Google Scholar] [CrossRef]
Figure 1.
The area of interest in the Altai Mountains.
Figure 1.
The area of interest in the Altai Mountains.
Figure 2.
(a) Example of a Scythian kurgan lining up with others of its kind; (b) Example of a Saka kurgan (left side) with a clearly visible ditch; (c) Example of a Turkic ogradka. The scale bar seen in photos (a) and (c) is 50 cm long.
Figure 2.
(a) Example of a Scythian kurgan lining up with others of its kind; (b) Example of a Saka kurgan (left side) with a clearly visible ditch; (c) Example of a Turkic ogradka. The scale bar seen in photos (a) and (c) is 50 cm long.
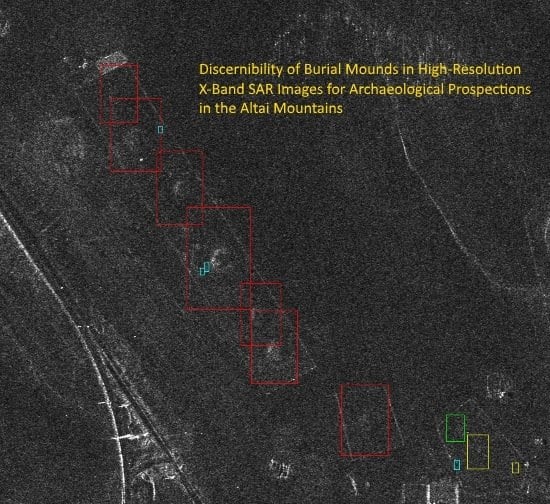
Figure 3.
Cluster of Saka kurgans in the TSX ST image from 16 September 2015 (SAR image © DLR, 2015). (Saka kurgans = red, Scythian kurgans = green, ogradkas = purple, undatable mounds = yellow, and all other objects = cyan).
Figure 3.
Cluster of Saka kurgans in the TSX ST image from 16 September 2015 (SAR image © DLR, 2015). (Saka kurgans = red, Scythian kurgans = green, ogradkas = purple, undatable mounds = yellow, and all other objects = cyan).
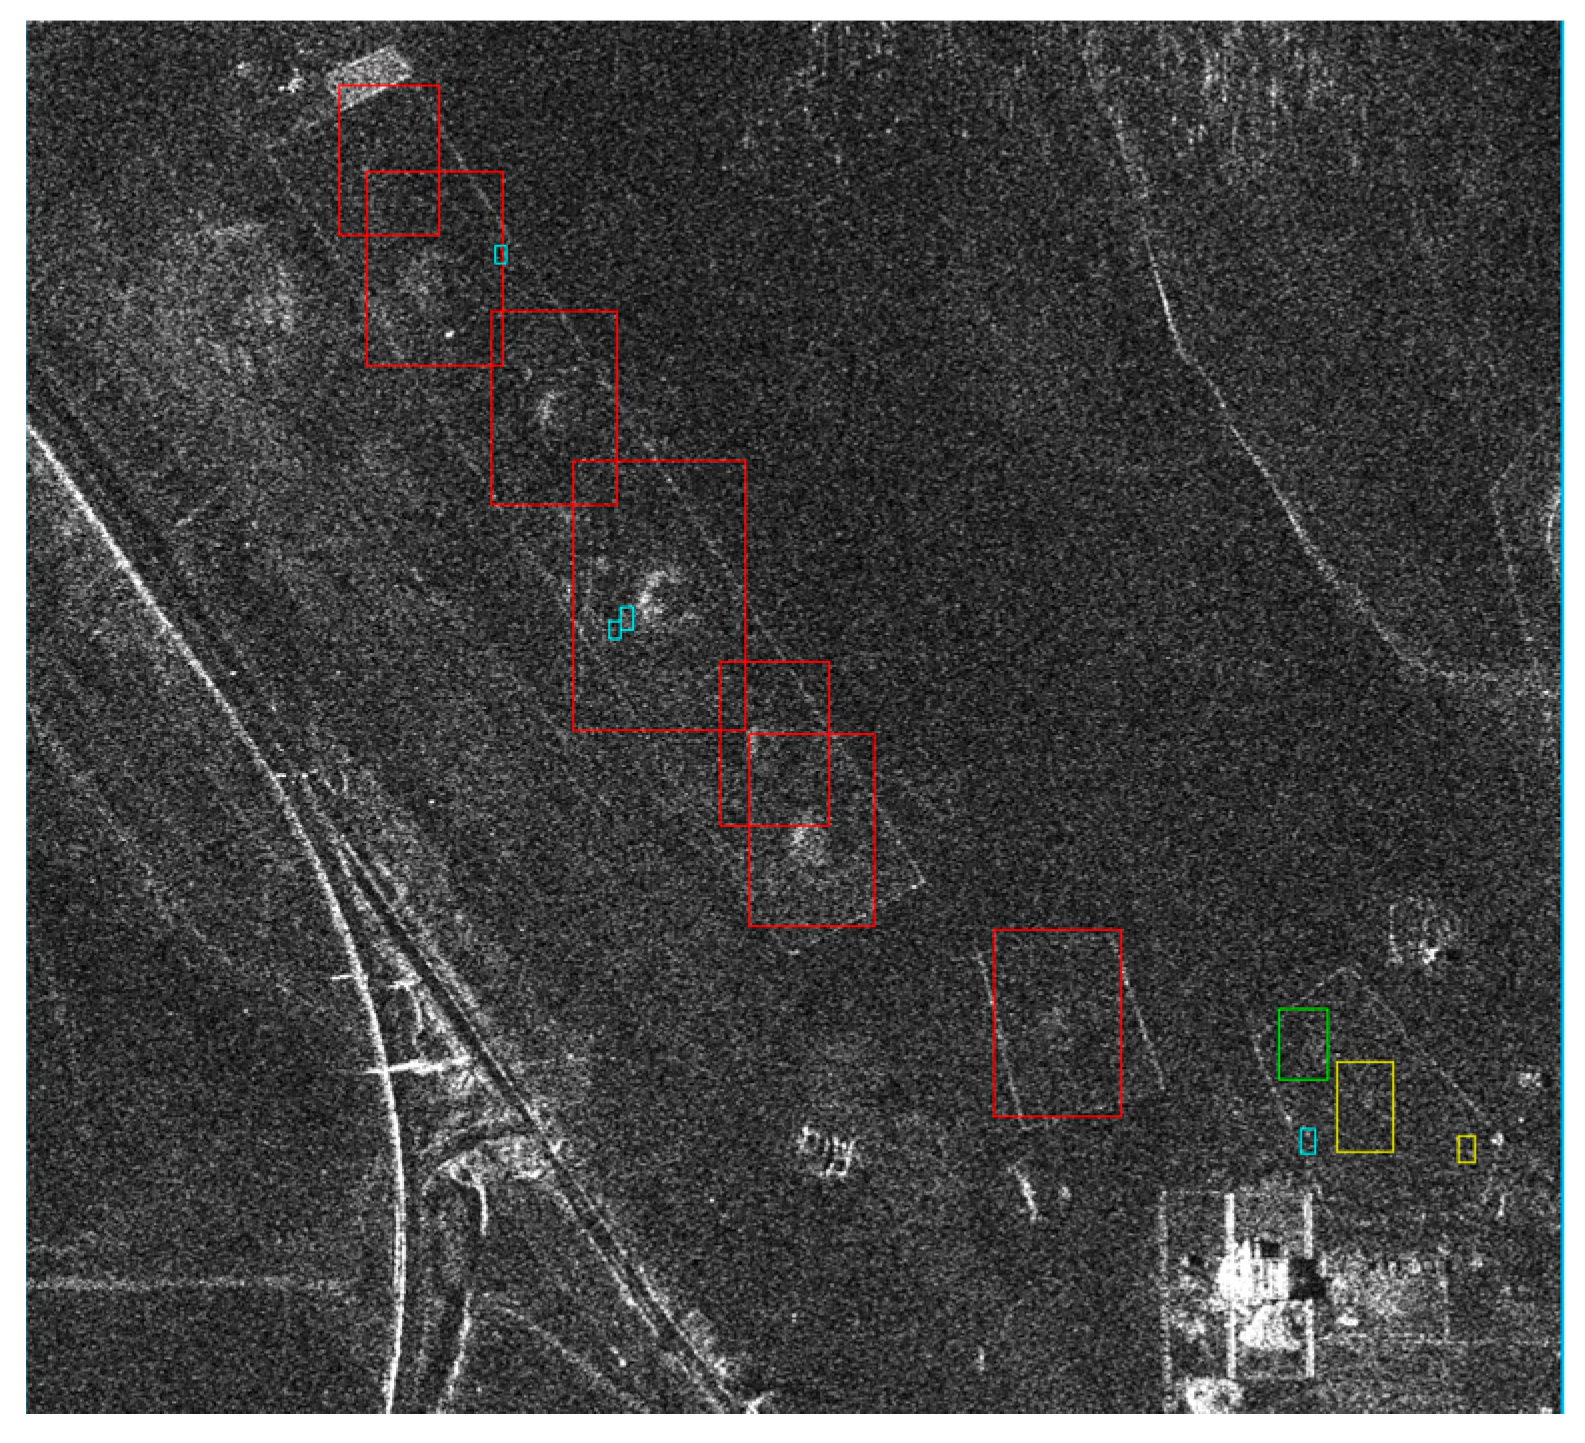
Figure 4.
Saka kurgans and a non-archaeological structure (marked with the yellow arrow) in the TSX ST image from 16 September 2015 (SAR image © DLR, 2015). (Saka kurgans = red, Scythian kurgans = green, ogradkas = purple, undatable mounds = yellow, and all other objects = cyan).
Figure 4.
Saka kurgans and a non-archaeological structure (marked with the yellow arrow) in the TSX ST image from 16 September 2015 (SAR image © DLR, 2015). (Saka kurgans = red, Scythian kurgans = green, ogradkas = purple, undatable mounds = yellow, and all other objects = cyan).
Figure 5.
Cluster of Saka kurgans, Scythian kurgans and ogradkas in the TSX ST image from 16 September 2015 (SAR image © DLR, 2015). (Saka kurgans = red, Scythian kurgans = green, ogradkas = purple, undatable mounds = yellow, and all other objects = cyan).
Figure 5.
Cluster of Saka kurgans, Scythian kurgans and ogradkas in the TSX ST image from 16 September 2015 (SAR image © DLR, 2015). (Saka kurgans = red, Scythian kurgans = green, ogradkas = purple, undatable mounds = yellow, and all other objects = cyan).
Figure 6.
Cluster of Saka kurgans in TSX SL images acquired on 9 July 2015 (a) and 15 July 2015 (b); (SAR images © DLR, 2015). (Saka kurgans = red, Scythian kurgans = green, ogradkas = purple, undatable mounds = yellow, and all other objects = cyan).
Figure 6.
Cluster of Saka kurgans in TSX SL images acquired on 9 July 2015 (a) and 15 July 2015 (b); (SAR images © DLR, 2015). (Saka kurgans = red, Scythian kurgans = green, ogradkas = purple, undatable mounds = yellow, and all other objects = cyan).
Figure 7.
Cluster of Scythian kurgans, Saka kurgans, and ogradkas in the TSX SL images from 12 July 2015 (a) and 14 July 2015 (b)—flipped vertically and horizontally for better comparability (SAR image © DLR, 2015). (Saka kurgans = red, Scythian kurgans = green rectangle, ogradkas = purple, undatable mounds = yellow, and all other objects = cyan).
Figure 8.
Several clusters of Saka kurgans in TSX SL image acquired on 14 July 2015 (SAR images © DLR, 2015). (Saka kurgans = red, Scythian kurgans = green rectangle, ogradkas = purple, undatable mounds = yellow, and all other objects = cyan).
Figure 8.
Several clusters of Saka kurgans in TSX SL image acquired on 14 July 2015 (SAR images © DLR, 2015). (Saka kurgans = red, Scythian kurgans = green rectangle, ogradkas = purple, undatable mounds = yellow, and all other objects = cyan).
Figure 9.
Cluster of Saka kurgans in the TSX SM image from 5 June 2014 (SAR image © DLR, 2015). (Saka kurgans = red, Scythian kurgans = green rectangle, ogradkas = purple, undatable mounds = yellow, and all other objects = cyan).
Figure 9.
Cluster of Saka kurgans in the TSX SM image from 5 June 2014 (SAR image © DLR, 2015). (Saka kurgans = red, Scythian kurgans = green rectangle, ogradkas = purple, undatable mounds = yellow, and all other objects = cyan).
Table 1.
TSX images used in the experiment, with resolution given as ground-range resolution by azimuth resolution and incidence angle (Inc. angle) at the scene center (ST = staring spotlight mode, SL = spotlight mode, SM = stripmap mode).
Table 1.
TSX images used in the experiment, with resolution given as ground-range resolution by azimuth resolution and incidence angle (Inc. angle) at the scene center (ST = staring spotlight mode, SL = spotlight mode, SM = stripmap mode).
| Satellite | Mode | Acquisition Date | Orbit | Resolution (m) | Inc. Angle |
|---|
| TSX-1 | ST | 16 September 2015 | descending | 0.91 × 0.23 | 39.8° |
| TSX-1 | SL | 15 July 2015 | ascending | 3.03 × 1.60 | 22.7° |
| TSX-1 | SL | 14 July 2015 | ascending | 1.57 × 1.60 | 48.4° |
| TSX-1 | SL | 12 July 2015 | descending | 1.83 × 1.60 | 39.9° |
| TSX-1 | SL | 9 July 2015 | ascending | 1.94 × 1.60 | 37.3° |
| TSX-1 | SM | 5 June 2014 | descending | 2.64 × 3.30 | 26.4° |
Table 2.
Distribution of the diameters of the archaeological structure in the test area.
Table 2.
Distribution of the diameters of the archaeological structure in the test area.
| | Number of Objects |
|---|
| Diameter ≥ 40 m | 8 |
| Diameter ≥ 30 m and <40 m | 14 |
| Diameter ≥ 20 m and <30 m | 38 |
| Diameter ≥ 10 m and <20 m | 92 |
| Diameter ≥ 1 m and <10 m | 690 |
Table 3.
Aggregated voting results from the test group with 11 members. The majority votes are marked in bold.
Table 3.
Aggregated voting results from the test group with 11 members. The majority votes are marked in bold.
| | TerraSAR-X Stripmap
5 June 2014 | TerraSAR-X Spotlight
14 July 2015 | TSX Staring Spotlight
16 September 2015 |
|---|
| | No | Maybe | Yes | No | Maybe | Yes | No | Maybe | Yes |
|---|
| Scythian kurgan (10 m–20 m) | 40.9% | 29.5% | 29.5% | 22.7% | 68.2% | 9.1% | 22.7% | 20.5% | 56.8% |
| Scythian kurgan (20 m–30 m) | 63.6% | 22.7% | 13.6% | 21.8% | 60.0% | 18.2% | 18.2% | 4.5% | 77.3% |
| Saka kurgan (>30 m) | 30.3% | 47.0% | 22.7% | 40.0% | 43.6% | 16.4% | 23.4% | 18.2% | 58.4% |
© 2016 by the authors; licensee MDPI, Basel, Switzerland. This article is an open access article distributed under the terms and conditions of the Creative Commons Attribution (CC-BY) license (http://creativecommons.org/licenses/by/4.0/).


