Article

Forms of Urban Expansion of Chinese Municipalities and Provincial Capitals, 1970s–2013

Institute of Remote Sensing and Digital Earth, Chinese Academy of Sciences, Beijing 100101, China
*
Author to whom correspondence should be addressed.
Remote Sens. 2016, 8(11), 930; https://doi.org/10.3390/rs8110930
Submission received: 31 August 2016 / Revised: 21 October 2016 / Accepted: 3 November 2016 / Published: 9 November 2016

Abstract

:
Urban expansion form is the most direct manifestation of urban expansion in space. Although it has been widely and vigorously studied, relatively little attention has been paid to reveal its spatiotemporal characteristics at the administrative level over a long timeframe. In this study, 31 Chinese municipalities and provincial capitals were selected as subjects to identify the urban expansion forms of provincial and higher level cities in China. First, urban expansion processes of these cities in the past four decades were reconstructed using remote sensing and geographical information system (GIS) technology. Then, the overall characteristics of urban expansion were presented to scientifically determine the urban expansion forms of the provincial and higher level cities in China. Afterwards, the annual expansion area per city (AEAC) index was employed to describe the urban expansion processes and determine the important time nodes of the 31 cities. Lastly, the urban expansion type (UET) index was adopted to analyze the spatiotemporal characteristics of urban expansion forms. Results indicate that (1) from the 1970s to 2013, urban lands in provincial and higher level cities in China expanded dramatically, with the central built-up area increasing by over 5 times, and urban expansion demonstrating an apparent spatial difference. The expansion rate of cities in East China was fastest with an AEAC of 13.78 km2, followed by that in Central China (AEAC = 9.67 km2). The urban expansion rate was slowest in West China (AEAC = 7.11 km2); (2) Affected by the national macro policies, urban expansion processes successively experienced four different stages: a slow expansion period (1970s–1987), an accelerating expansion period (1987–1995), a slowdown expansion period (1995–2000), and a high-speed fluctuating expansion period (after 2000); (3) The urban expansion forms of municipalities and provincial capitals were mainly edge-expansion supported by infilling expansion. The leapfrog form contributed minimally to urban expansion; (4) The edge-expansion form surged before 2010 and gradually slowed down after 2010. By contrast, infilling expansion kept increasing in the past four decades. Lastly, the rate of urban expansion via the leapfrog form fluctuated from the 1970s to 2013.

Graphical Abstract

1. Introduction

As important engines for social and economic growth, cities are the most powerful places where humans can affect the natural environment [1,2]. At present, the entire world (and particularly developing countries) is undergoing unprecedented urbanization. Over half of the global population currently lives in cities. By 2050, the proportion of the urban population worldwide is expected to reach 66.67% [3]. As the most direct manifestation of the urbanization process, urban expansion is a powerful sign of progress in social civilizations, a vital result of social and economic development [4], and the most involved entity in the fields of urban development and land resource management.
Urban expansion form, as an important field of study in urban spatial morphology, is the most direct manifestation of urban expansion in space [5] and is closely related to urban morphology, land utilization efficiency, economic development, and the ecological environment [6,7]. Various methods and models are currently available to qualitatively and quantitatively identify urban expansion form. At the end of the 19th century, Burgess, Hoyt, and Harris proposed three classic urban expansion forms, namely, concentric circle, sector, and multi-core types [8]. Berry identified axial, concentric circle, sector, and multi-core urban expansion forms by conducting several instance analyses [9]. Marquez proposed compact, edge, and corridor urban land growth forms [10], whereas Magni classified urban expansion forms into filling-up, extension, traffic line, spreading, and satellite cities [5]. Wilson divided urban expansion into five forms; infill, expansion, isolated, linear branch, and clustered branch [11]. Xu improved and simplified the classification method of urban expansion forms, and defined it as three types; infilling, edge-expansion, and outlying (also called leapfrog) [12]. At present, the research on urban expansion form remains trapped in the method improvement and discussion stages, and relatively little attention has been paid to method applications, particularly in identifying the spatiotemporal characteristics of urban expansion forms at the administrative level over a long timeframe.
China is the largest developing country in the world and has been rapidly developing since the implementation of the “Reform and Opening Up” policy in the 1970s. The urbanization level of China has continuously accelerated from 17.92% to 52.57% during the period from 1978–2012 [5], and is expected to reach as high as 80% in 2050 [13]. Stiglitz, the former vice president of the World Bank, remarked that the urbanization in China and the high-tech development in the United States were two of the greatest events that contributed to the development of human society in the 21st century. Moreover, he predicted that the urbanization issue would be the greatest challenge that China would face in the new century [14]. Given the rapid urbanization process, urban lands in China have aggressively expanded [15], which easily triggers excessive urban expansion and unreasonable spatial forms, along with an increasing number of negative effects on natural resources, economic health, and community character [16,17,18,19,20,21]. Though urban expansion in China has gained considerable attention from both domestic and foreign scholars [22,23] and different fields of studies related to urban expansion, such as dynamic monitoring [24], driving force mechanism [25], simulation and prediction [26], and influences of urban expansion [27], have been widely investigated, relatively little attention has been given to the study of urban expansion forms.
Municipalities and provincial capitals are significant carriers of Chinese society and economy, and they play important roles in national economic development. Most of these cities were included in the first batch of “beneficiaries” of the “Reform and Opening Up” policy. More unreasonable spatial forms and “city diseases” occur in these cities rather than in prefecture and county level cities [28]. Typical single cities (e.g., Beijing, Shanghai, Hangzhou, and Nanjing) [29,30,31], and urban agglomerations with developed economies (e.g., the Yangtze River Delta, Pearl River Delta, and Beijing–Tianjin–Tangshan) [32,33,34] have always been selected as the research subjects in the existing studies on urban expansion form. At present, studies on urban expansion form in municipalities and high level cities at the administrative level over a long timeframe and with high frequency remain limited.
This study aims to rebuild the urban expansion process of municipalities and provincial capitals in China using the visual interpretation method based on multi-source remotely sensed imagery during the period from 1970s–2013, recognize the overall characteristics of urban expansion in municipalities and provincial capitals, analyze the staged characteristics and identify the important time nodes of urban expansion in these cities, quantitatively analyze the urban expansion form, disclose the spatial-temporal characteristics of urban expansion in Chinese municipalities and provincial capitals, provide scientific data to support urban planning and construction in China, and indicate the direction for the sustainable and healthy development of urban lands.

2. Materials and Methods
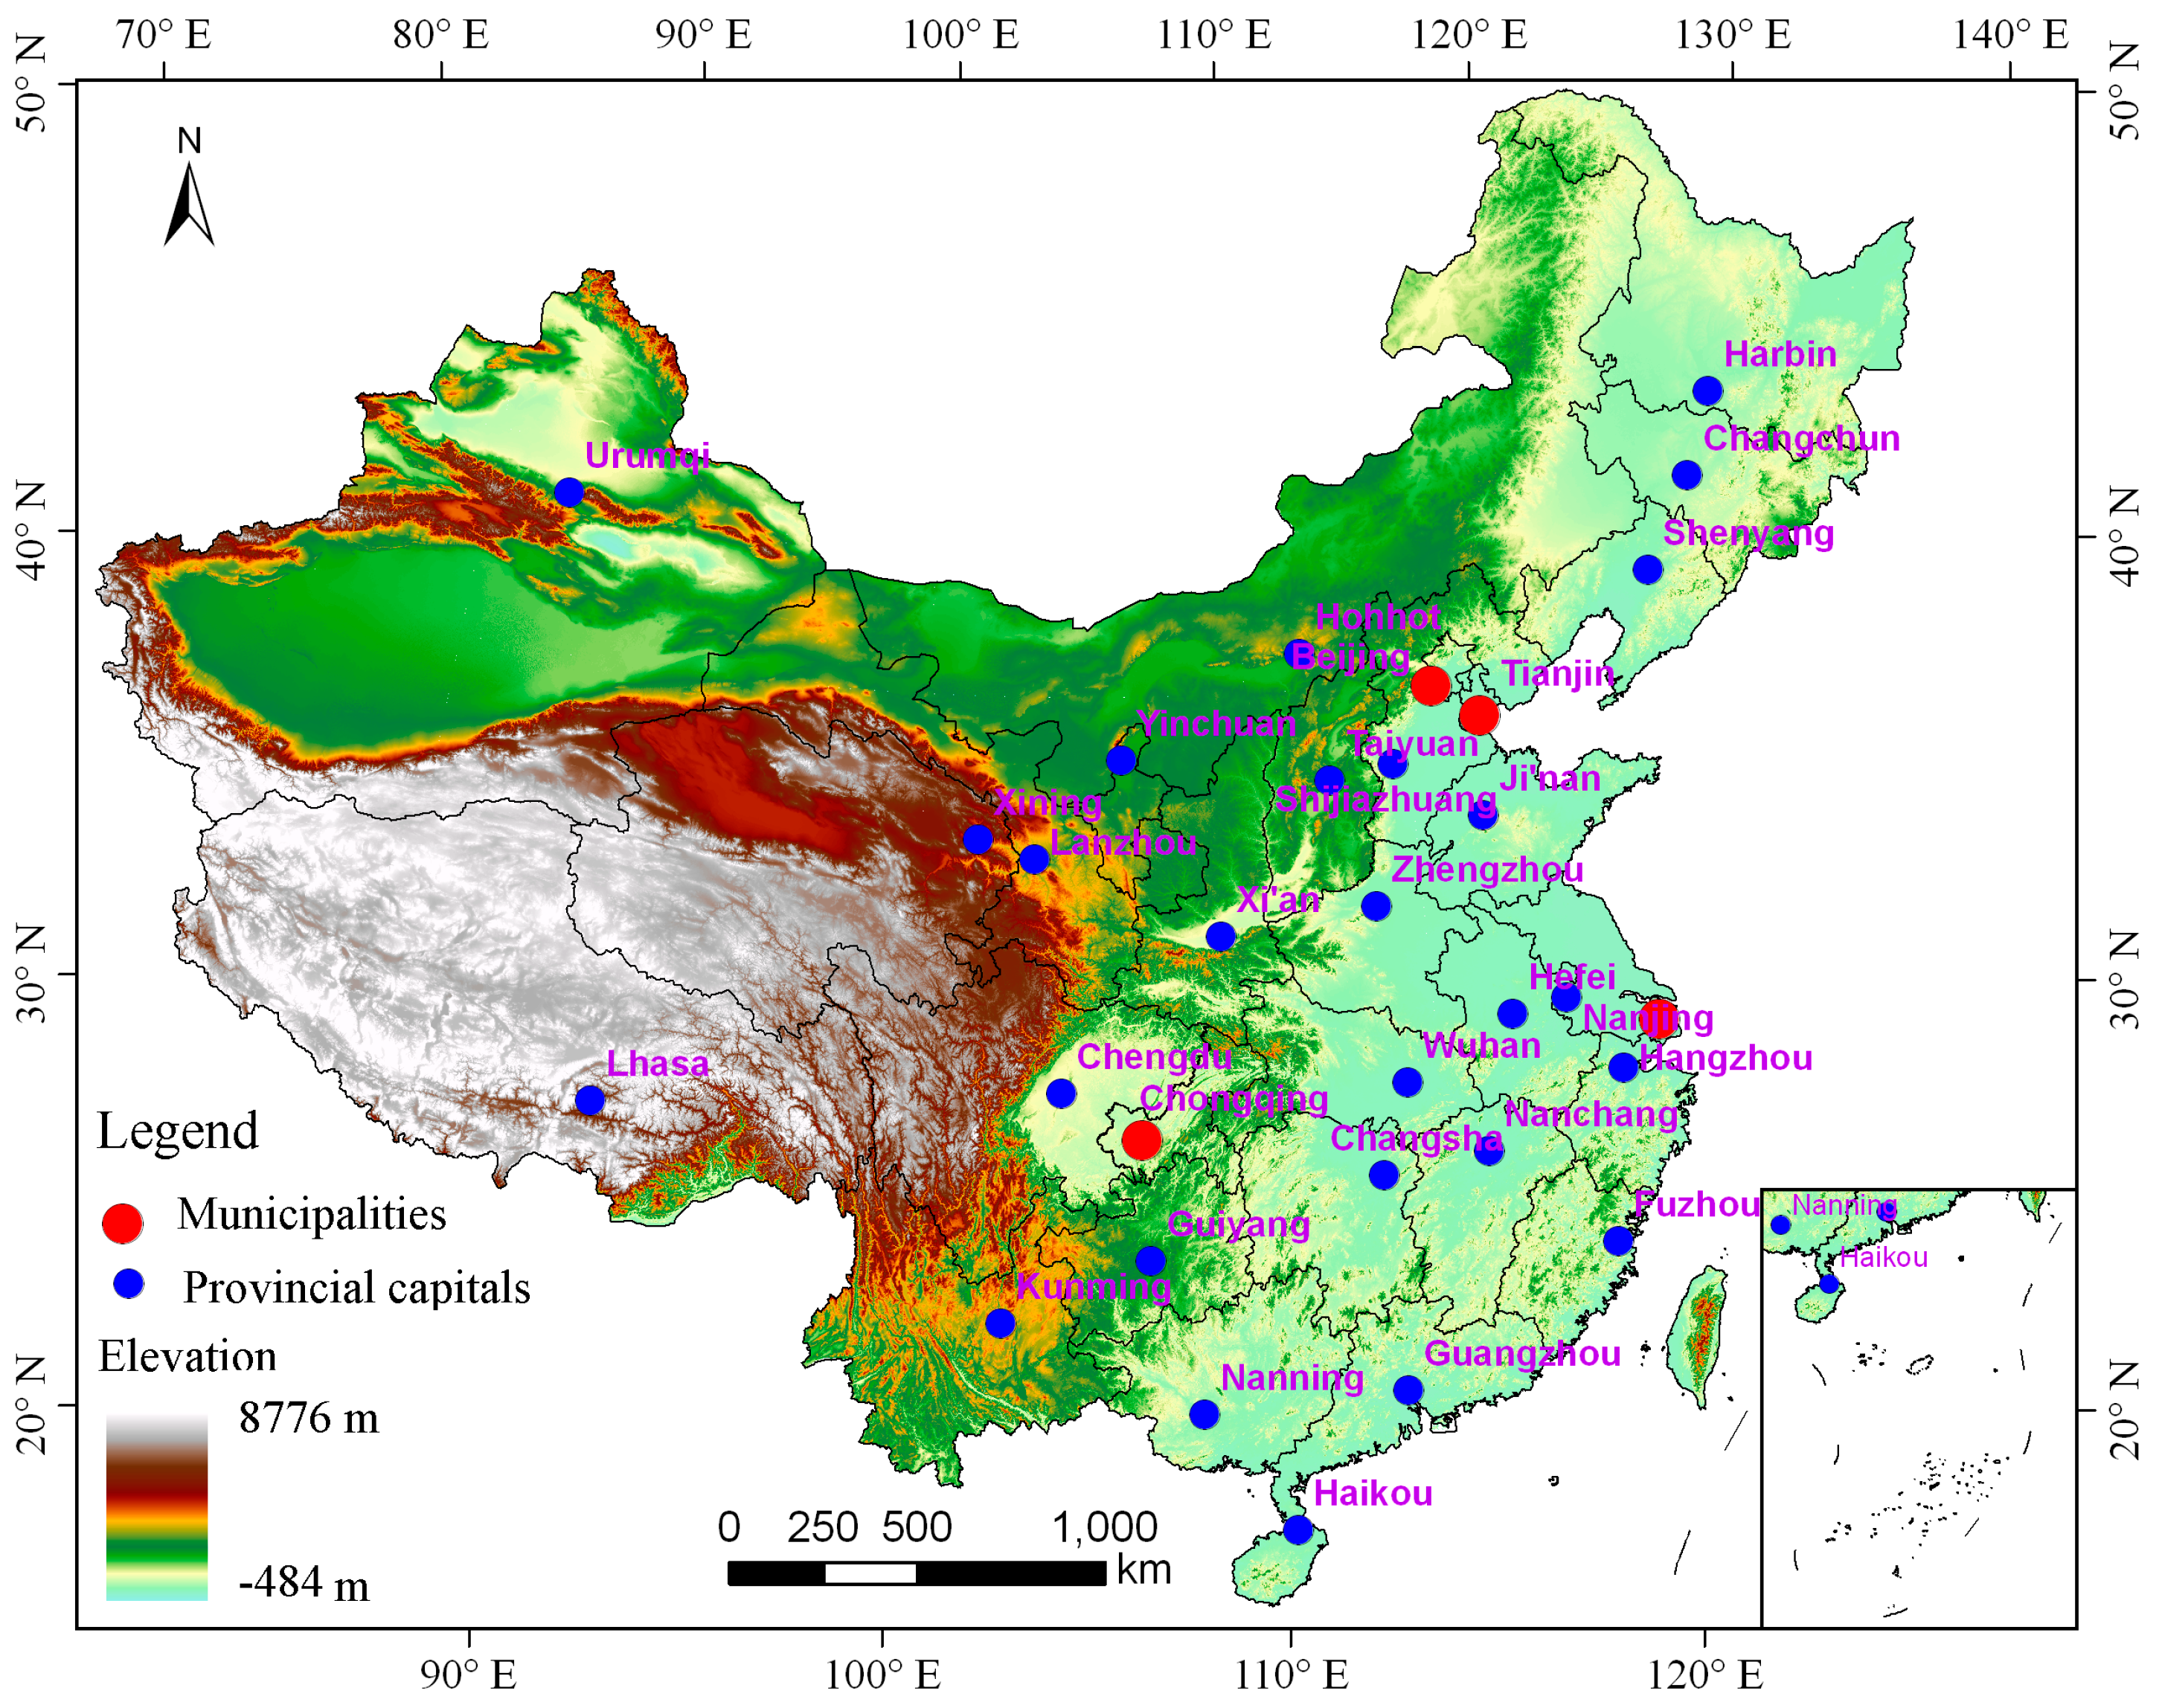
2.1. Study Area

Municipalities and provincial capitals are important administrative units in China. They are commonly the center of the politics, economy, transportation, technology, and culture of a province, or even of the country. These units reflect the objective and orientation of regional development and play important roles in the development of China. China has 4 municipalities and 28 provincial capitals. These cities and the urban communities (e.g., the Yangtze River Delta, Pearl River Delta, and Beijing–Tianjin–Hebei) that surround them have become the mainstream sources of economic growth and urbanization in China. These areas are not only urban agglomerations that create employment and attract the population, but also engines that support the economic development of China [35]. Although these cities account for only a small proportion of the national territory area, they gather a high-density population and social and economic activities, and provide sufficient motive power for urban development. The area of municipalities and provincial capitals accounts for only 5.12% of the total national territory area. As of 2013, municipalities and provincial capitals are home to 17.06% of the population in China, and generated 31.35% of China’s gross domestic product, held 54.03% of the country’s universities, and 41.83% of the medical institutions in the country [36,37].
The urbanization process of Taipei is considerably ahead of the other municipalities and provincial capitals in Mainland China. In 1971, the urbanization rate of Taipei reached 59.00%, whereas the urbanization processes of other provincial and higher level cities were still in their infancy stages [35]. In addition, the urban expansion data of Taipei in 1990 were missing, given the limited acquired remotely sensed imagery. Therefore, sample cities selected for this study are the other 31 municipalities and provincial capitals, excluding Taipei (Figure 1). As of 2013, with the exception of Lhasa, the other 30 cities are all large cities with populations of over 1 million per city. The total population of Shanghai, Beijing, Chongqing, Wuhan, Tianjin, Guangzhou, Xi’an, Chengdu, Nanjing, and Shenyang reached over 5 million per city. The spatial distribution of the 31 cities is imbalanced, and most of the cities are located in Central and East China with flat landforms.

2.2. Urban Land Definition
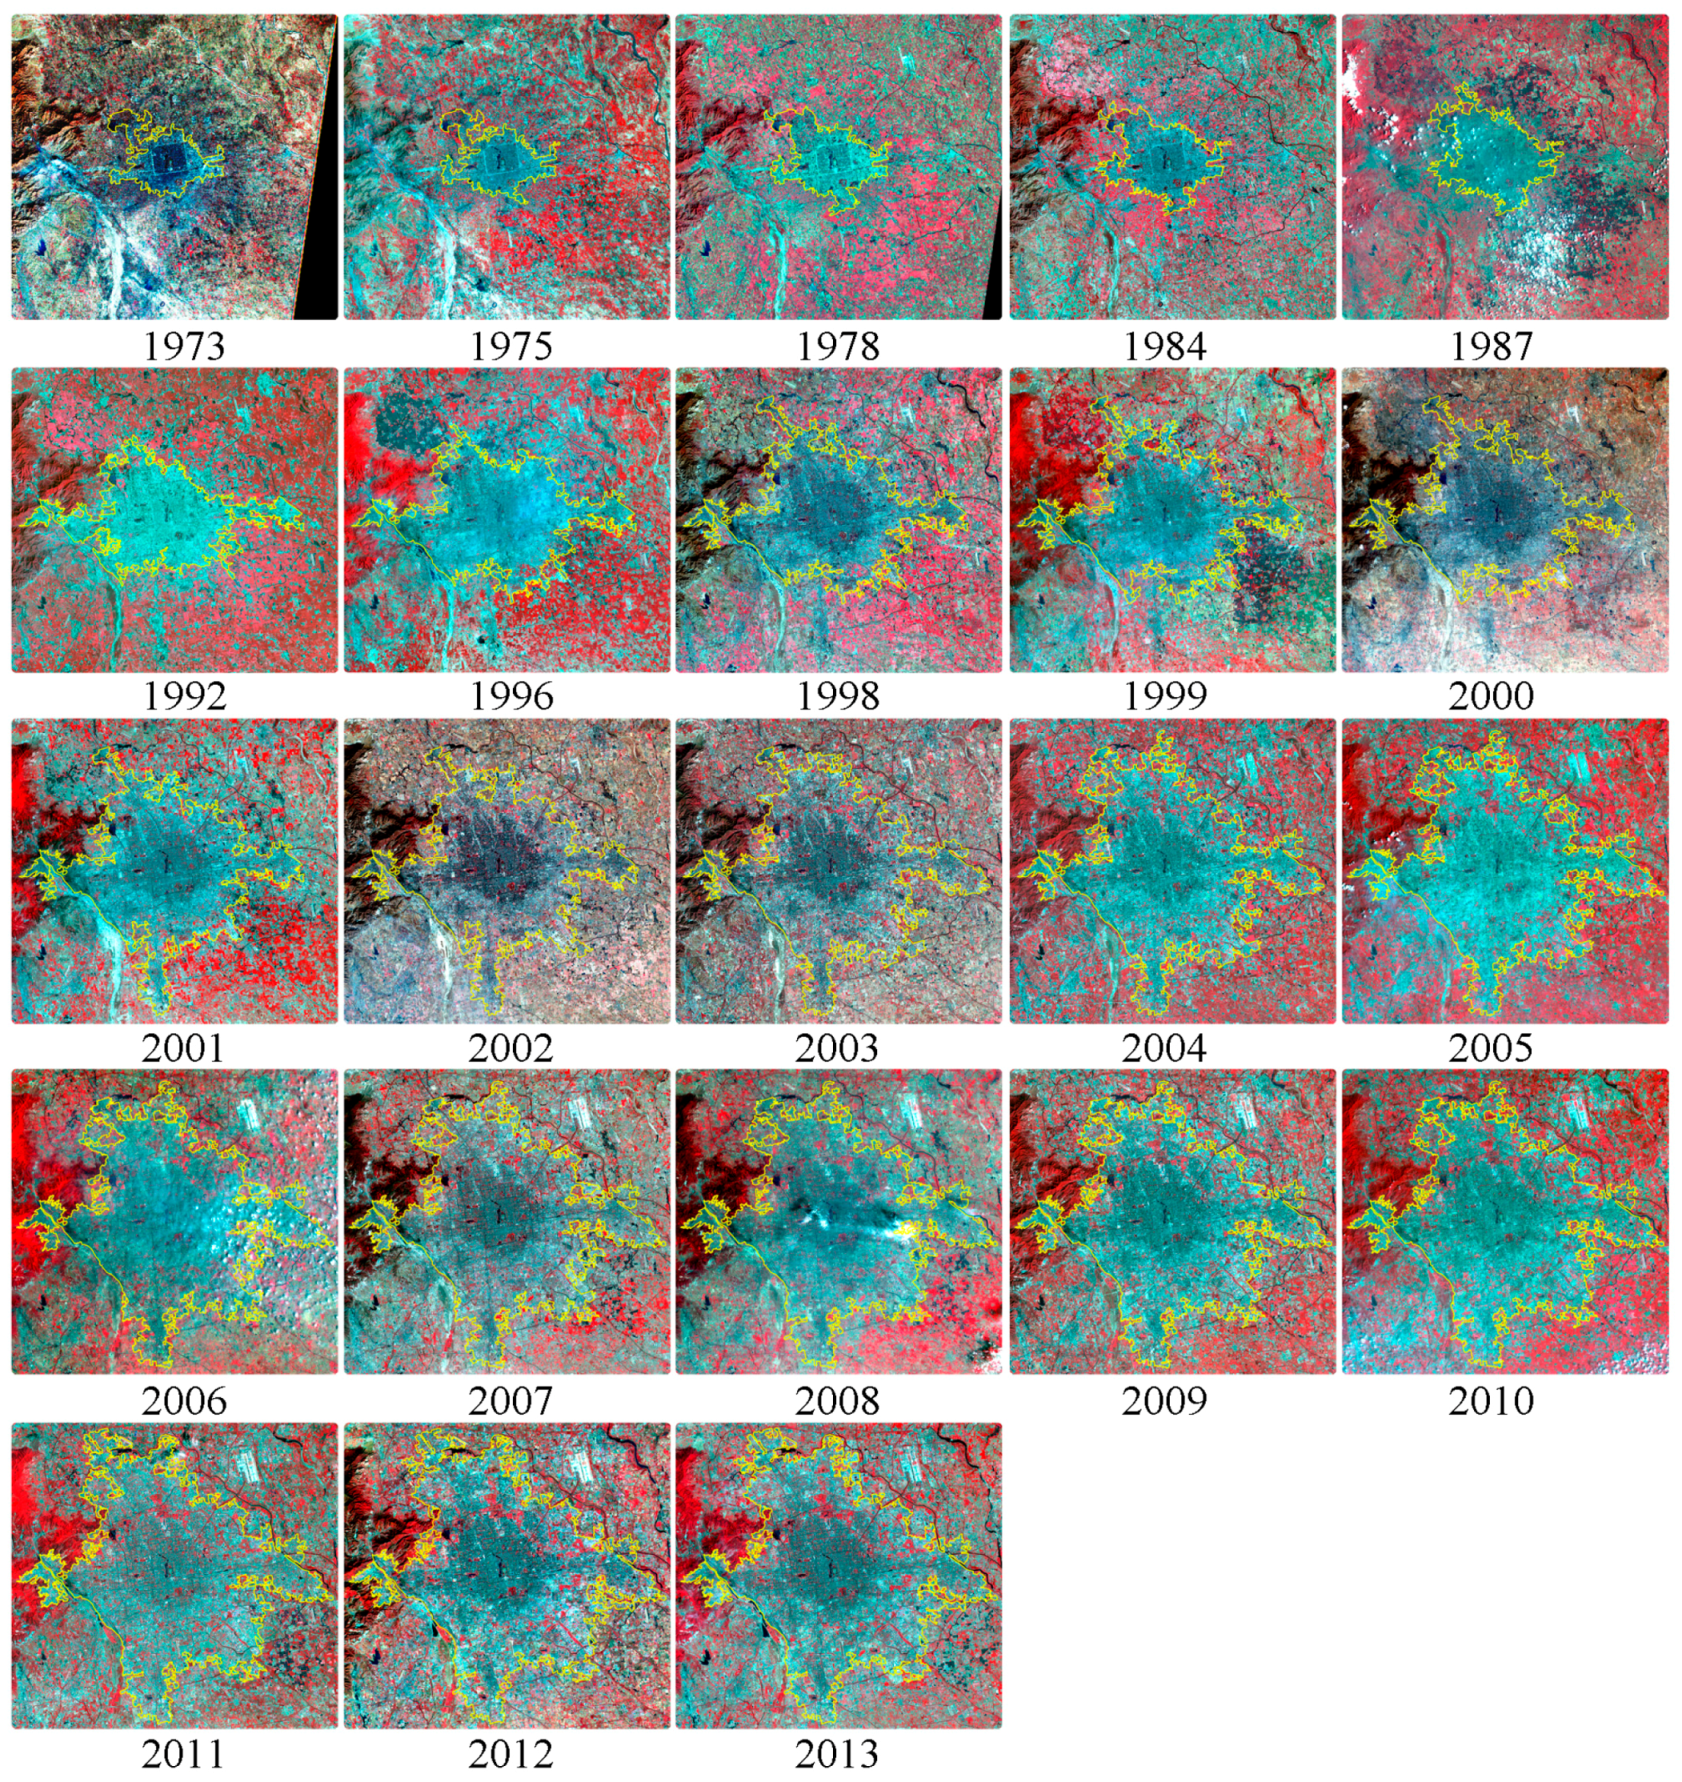
Our mapping focused on the central built-up area, which is similar to the urban entity region [2,28]. The central built-up area is essentially a contiguous region with basic municipal utilities and public facilities, including all artificially constructed elements such as roads, buildings, and parks with vegetation and water [15]. In the cartography process, according to mapping standards adopted by Zhang et al., newly developed urban patches with short sides smaller than four pixels were prohibited from mapping [15,38].

2.3. Data Sources

Multi-source remotely sensed imagery, with a spatial resolution ranging from 19.5 m to 80 m, were chosen as the data source to monitor the urban expansion process of municipalities and provincial capital cities in China between the 1970s and 2013. All images were mainly acquired from the United States Geological Survey (USGS) website. In total, 478 images were used in this study, including 318 Landsat Thematic Mapper or Enhanced Thematic Mapper Plus (TM/ETM+) images, 44 Landsat Multi Spectral Scanner (MSS) images, 27 Landsat Operational Land Imager (OLI) images, 33 China-Brazil Earth Resources Satellite (CBERS) Charge-coupled Device (CCD) images, and 56 Environmental Satellite (HJ–1) CCD images. Landsat TM/ETM+ images were the major data source, and were used to extract urban expansion information of 31 sample cities from the 1980s to 2010. Landsat MSS images, CBERS CCD images, HJ–1CCD images, and Landsat OLI images were the supplemental data sources for time frames with poor quality or for the loss of Landsat TM/ETM+ images, and were used to monitor the urban expansion process of 31 sample cities in the 1970s, 2004–2008, 2011–2013, and 2013, respectively. Image source, year, and sensor of the 31 sample cities are illustrated in Appendix A.

2.4. Data Processing

Urban expansion dynamic monitoring is the foundation for the analysis of urban expansion forms. To rapidly and efficiently map urban areas, various kinds of automatic classification methods are used, that are usually adopted [39,40]; however, they are more difficult to apply in large urban areas because of the massive amount of adjustments required for the parameters as opposed to the visual interpretation method. Moreover, the visual interpretation method has advantages in scientifically recognizing how other land use types convert to urban lands [41,42]. Therefore, the visual interpretation method based on professional knowledge was employed to determine the urban boundaries, according to the same set of interpretation criteria introduced in detail by Zhang et al. [15].
All data processing was performed on the Modular GIS Environment (MGE) platform, which was developed by the Intergraph Company of America and had strong image processing functions [42]. First, to ensure the extraction accuracy of urban information, images were selected with the time phase of vigorous vegetation growth and less than 10% cloud cover [43]. Afterwards, all images were pre-processed by three steps on the MGE platform, including band composition by using standard false-color synthesis [40], band enhancement using linear contrast stretching and histogram equalization [44], and rectifying all images to a common Albers equal area conic (ALBERS) coordinate system based on 1:100,000 topographic maps of China. The accuracy of geometric rectification in terms of relative position error for the same feature point did not exceed two pixels (60 m) [45]. Finally, based on the established interpretation symbols of urban lands, researchers with professional knowledge and experience reconstructed the urban expansion process of 31 cities by using the visual interpretation method referring to Google Earth and topographic maps. Regarding the accuracy of mapping methods elaborated by Zhang et al. [2], the extraction standard of the National Land-Use Change Database of China (NLUD-C) was used to ensure the accuracy of urban expansion monitoring above 90% [15]. Using Beijing as an example, Figure 2 shows us how obvious urban expansion was during the period from 1973–2013 by analyzing remotely sensed imagery, and Figure 3 describes the urban expansion monitoring process during that period.

2.5. Methods

2.5.1. Annual Expansion Area per City

Annual expansion area per city (AEAC) is affected minimally by city sample quantity, monitoring frequency, and the starting year of monitoring, and has advantages in describing urban expansion processes in depth. The higher the monitoring frequency of urban expansion, the more objective the adopted index is. This index has been comprehensively adopted by Zhang et al. and Shi et al., and revealed the overall characteristics of urban expansion in major cities and coastal cities of China, respectively [15,45]. The detailed description of AEAC is below,
A E A C ( n , N ) = i = 1 N U A i ( t + n ) U A i ( t ) n N
where AEAC(n,N) is the annual expansion area per city during tt + n; UAi(t+n) and UAi(t) are the urban areas of city i at time t + n and t, respectively; n is the interval of the calculation period (in years); and N is the quantity of cites in the research region.

2.5.2. Urban Expansion Type

To describe and detect urban expansion forms, three types of urban expansion forms were considered in this study, i.e., edge-expansion, infilling, and leapfrog. Edge-expansion refers to the new growth of urban areas spreading unidirectionally in more or less parallel strips from the fringes of existing urban edges. Infilling denotes that the gap (or hole) between old urban areas or within an old urban area is filled up with new urban area growth. Leapfrog indicates newly grown urban areas without spatial connection to the existing urban lands. To differentiate these three types and identify the overall urban expansion type of cities, an urban expansion type (UET) index was adopted [11,12] and improved in this study. The improved equation of UET is below,
U E T ( i , j ) = L c o m ( i , j ) P n e w ( i , j )
where i represents the ith city; j is the jth newly developed urban patch of the ith city; U E T ( i , j ) , P n e w ( i , j ) , and L c o m illustrate the urban expansion form of the jth newly developed urban patch, the total perimeter of this patch, and the length of the common edge of the jth newly developed urban patch, and the existing urban areas of the ith city in target period. U E T ( i , j ) ranges from 0 to 1, and is defined as the jth newly developed urban patch in city i expanding in leapfrog, edge-expansion, or infilling form when U E T ( i , j )   = 0, 0 < U E T ( i , j ) ≤ 0.5, and 0.5 < U E T ( i , j ) < 1 , respectively.
In one city, areas and proportions of newly developed urban patches expanding in edge-expansion, infilling, and leapfrog forms are summed up, respectively, and the major urban expansion form of this city in the target monitoring period can be described quantificationally.

3. Results

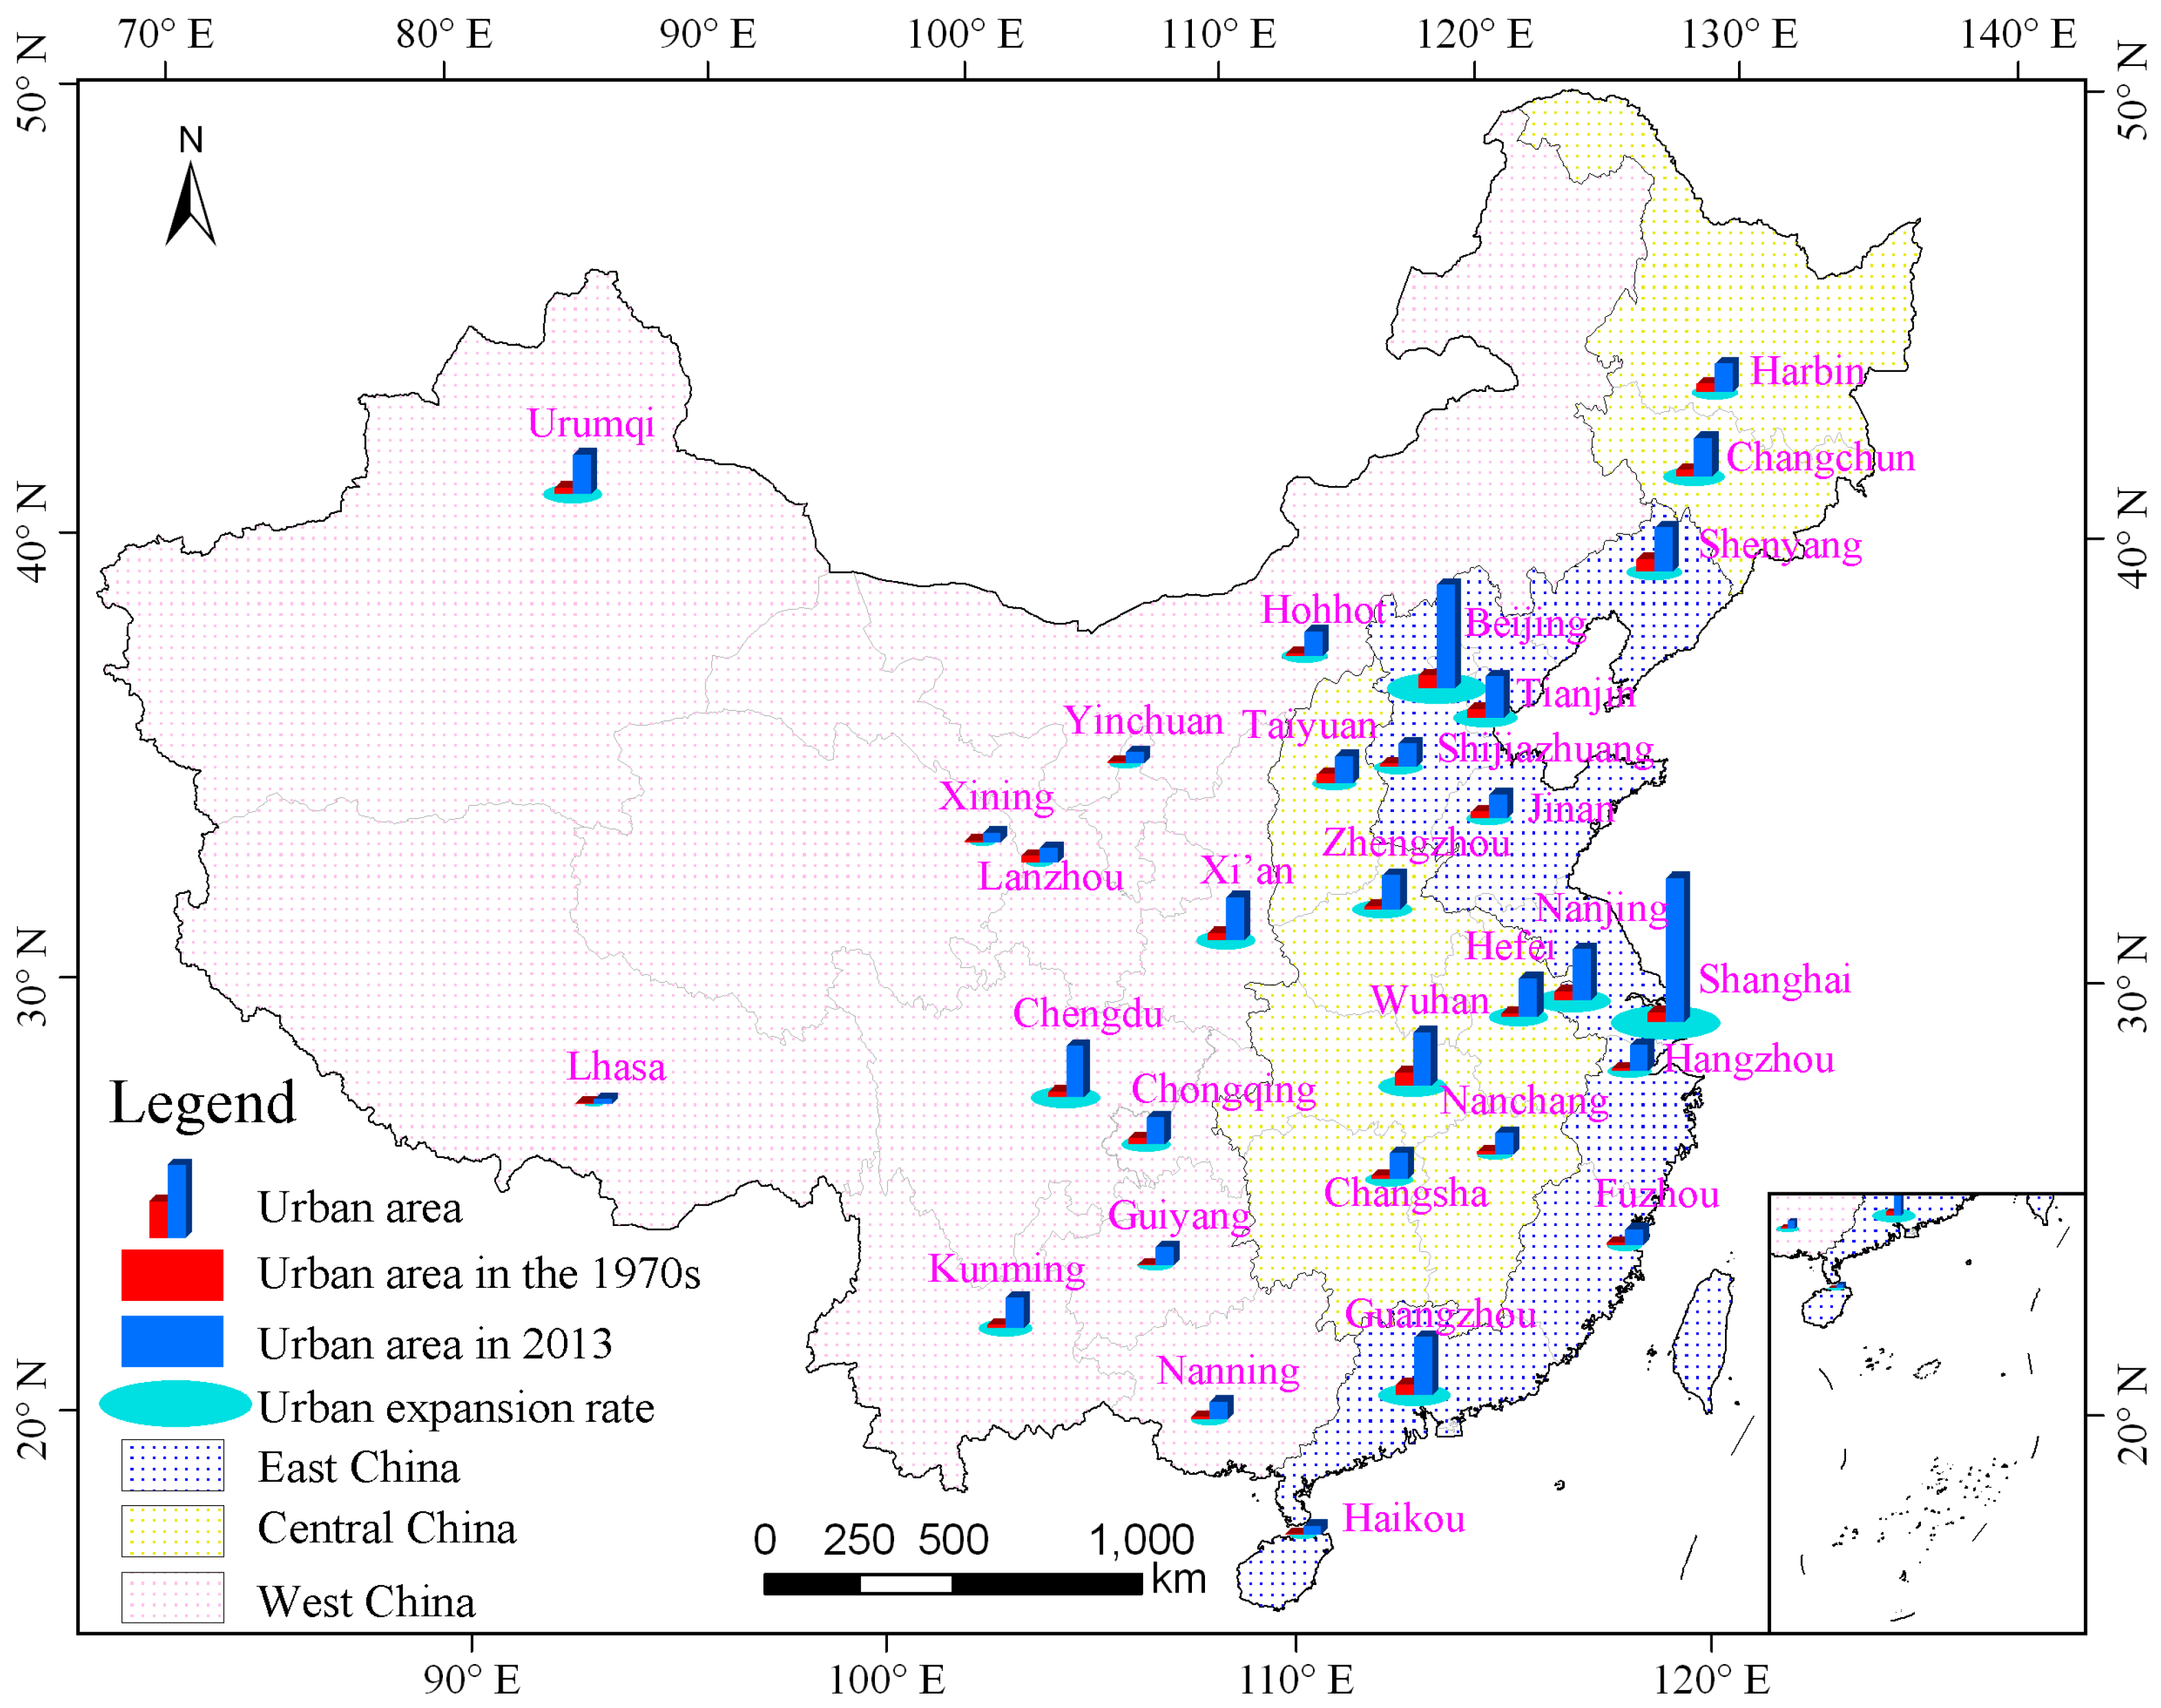
3.1. Overall Characteristics of Urban Expansion in Municipalities and Provincial Capitals

In the 1970s, China was still in its planned economy period. National economic development was completely restricted, and urban lands in the municipalities and provincial capitals were generally small and expanded slowly. The total central built-up area of the 31 cities was 2582.38 km2, with an average area of only 83.30 km2 per city (Figure 4). No city had a central built-up area larger than 200 km2. Only 10 cities (i.e., Wuhan, Beijing, Shenyang, Guangzhou, Shanghai, Taiyuan, Nanjing, Harbin, Tianjin, and Xi’an) had a central built-up area larger than 100 km2. Moreover, most of these cities were in East China, with an altitude below 500 m, a flat landform, rapid social and economic development, and favorable urban development regional advantages. Although these 10 cities only accounted for less than one-third of the cities being monitored, their total central built-up area comprised 57.22% of the 31 cities. The other 21 cities were mostly distributed in Central and West China and exhibited weaker regional economies, and therefore the total central built-up area was less than 100 km2 per city.
With the “Reform and Opening Up” policy, the Chinese society and economy rapidly grew, urban construction was highly valued, and urban lands significantly expanded and even experienced an excessive expansion. In 2013, the central built-up area of the 31 cities expanded to 15,801.57 km2, with an average of 509.73 km2 in each city, i.e., an increase of 6.12 times compared with that in the 1970s (Figure 4). With the exception of Lhasa, the central built-up areas in the other 30 cities were all larger than 100 km2. In 2013, the central built-up area in Shanghai reached 2074.55 km2. It was followed by Beijing, with a central built-up area reaching 1478.94 km2. The central built-up areas of Guangzhou, Nanjing, Wuhan, Hefei, Chengdu, Shenyang, Changchun, Xi’an, Urumqi, and Tianjin were all over 500 km2; most of these cities were “leaders” of the Chinese social and economic development [37,46]. Over half of the monitored cities, which were mostly located in Central and West China, had a central built-up area that ranged from 100 km2 to 500 km2, and they expanded relatively slowly.
Since the 1970s, the expansion pace of municipalities and provincial capitals exhibited an evident spatial difference (Figure 4). Cities in East China expanded rapidly at an average rate of 13.78 km2 per year, and the rate dispersion of expansion was higher than those of the cities in Central and West China (Figure 4). The urban expansion rate of 11 municipalities and provincial capitals in East China was between 2.92 km2 per year (Haikou) and 34.38 km2 per year (Shanghai), with a standard deviation of 10.02 km2 per year. The expansion rate of cities in Central China was 9.67 km2 per year, which was slightly higher than that for cities in West China, but was significantly lower than that for cities in East China. The expansion rate of 8 cities in Central China ranged from 4.43 km2 per year (Nanchang) to 14.85 km2 per year (Wuhan), with a standard deviation (4.38 km2 per year) smaller than those in East China and West China. Cities in West China expanded the slowest at an average rate of 7.11 km2 per year. However, its above dispersion was larger than that of cities in Central China. In West China, the expansion rate of 12 cities was between 1.48 km2 per year (Lhasa) and 15.59 km2 per year (Chengdu), with a standard deviation of 6.68 km2 per year.

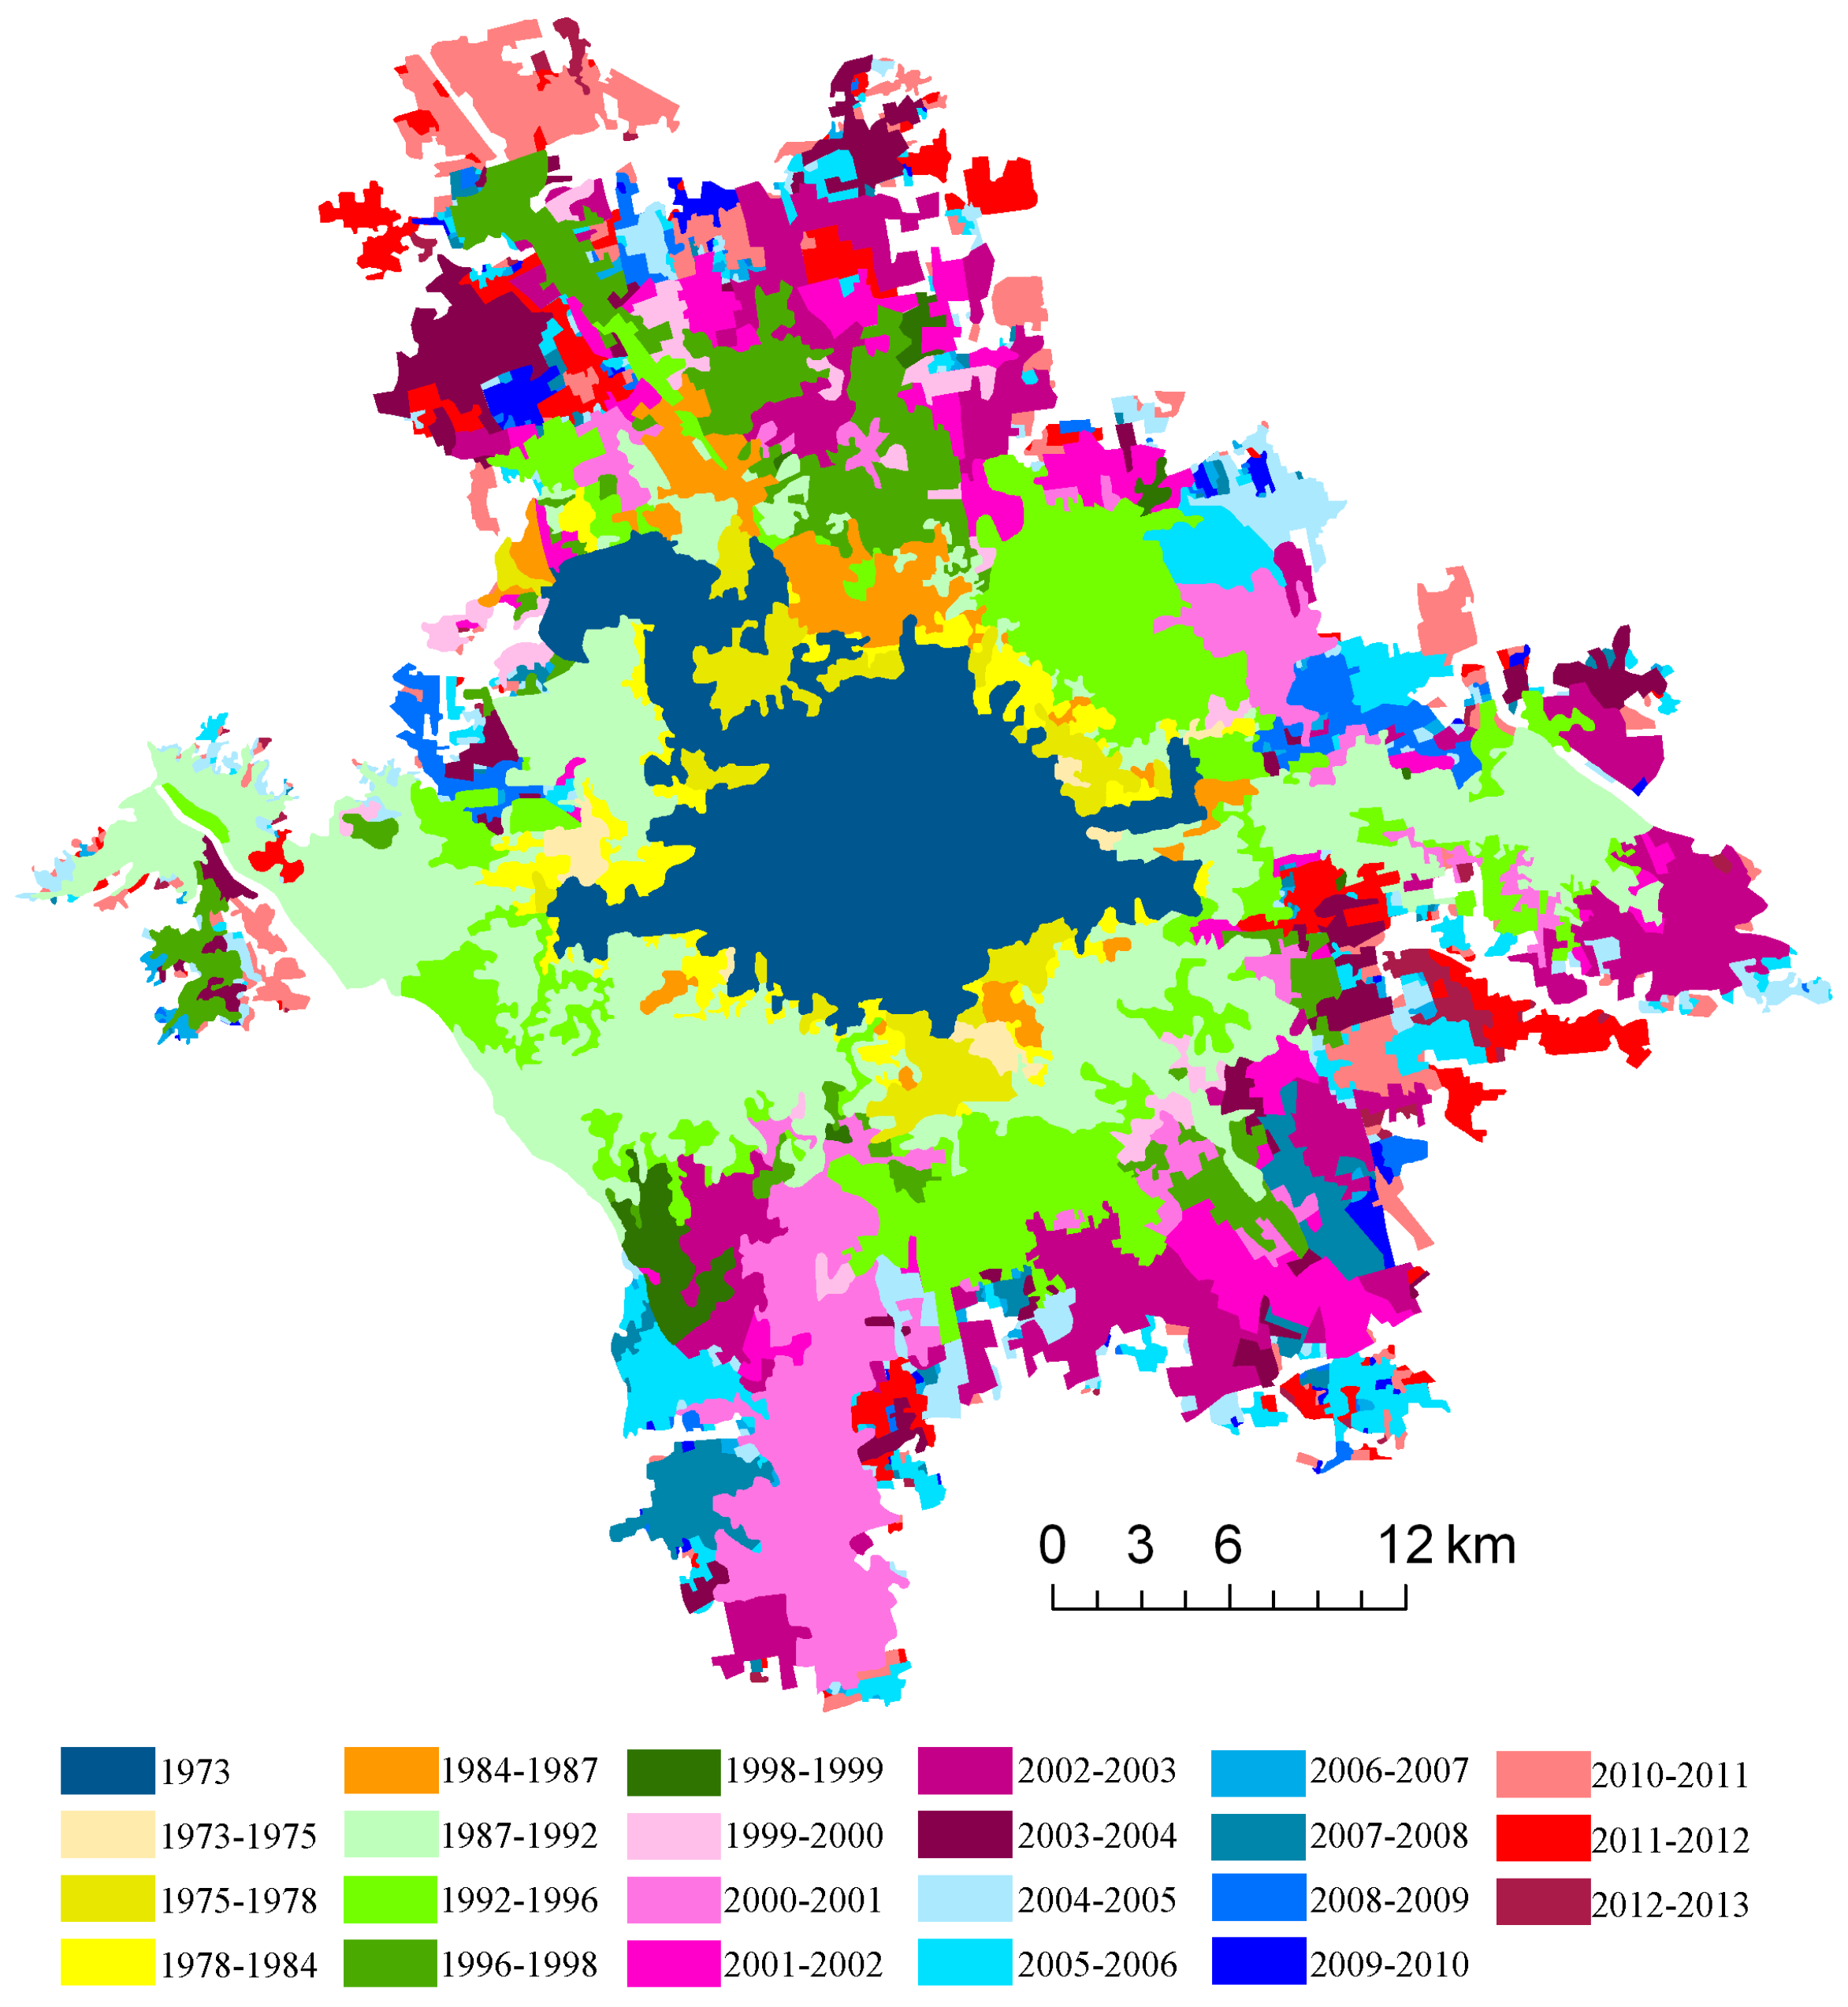
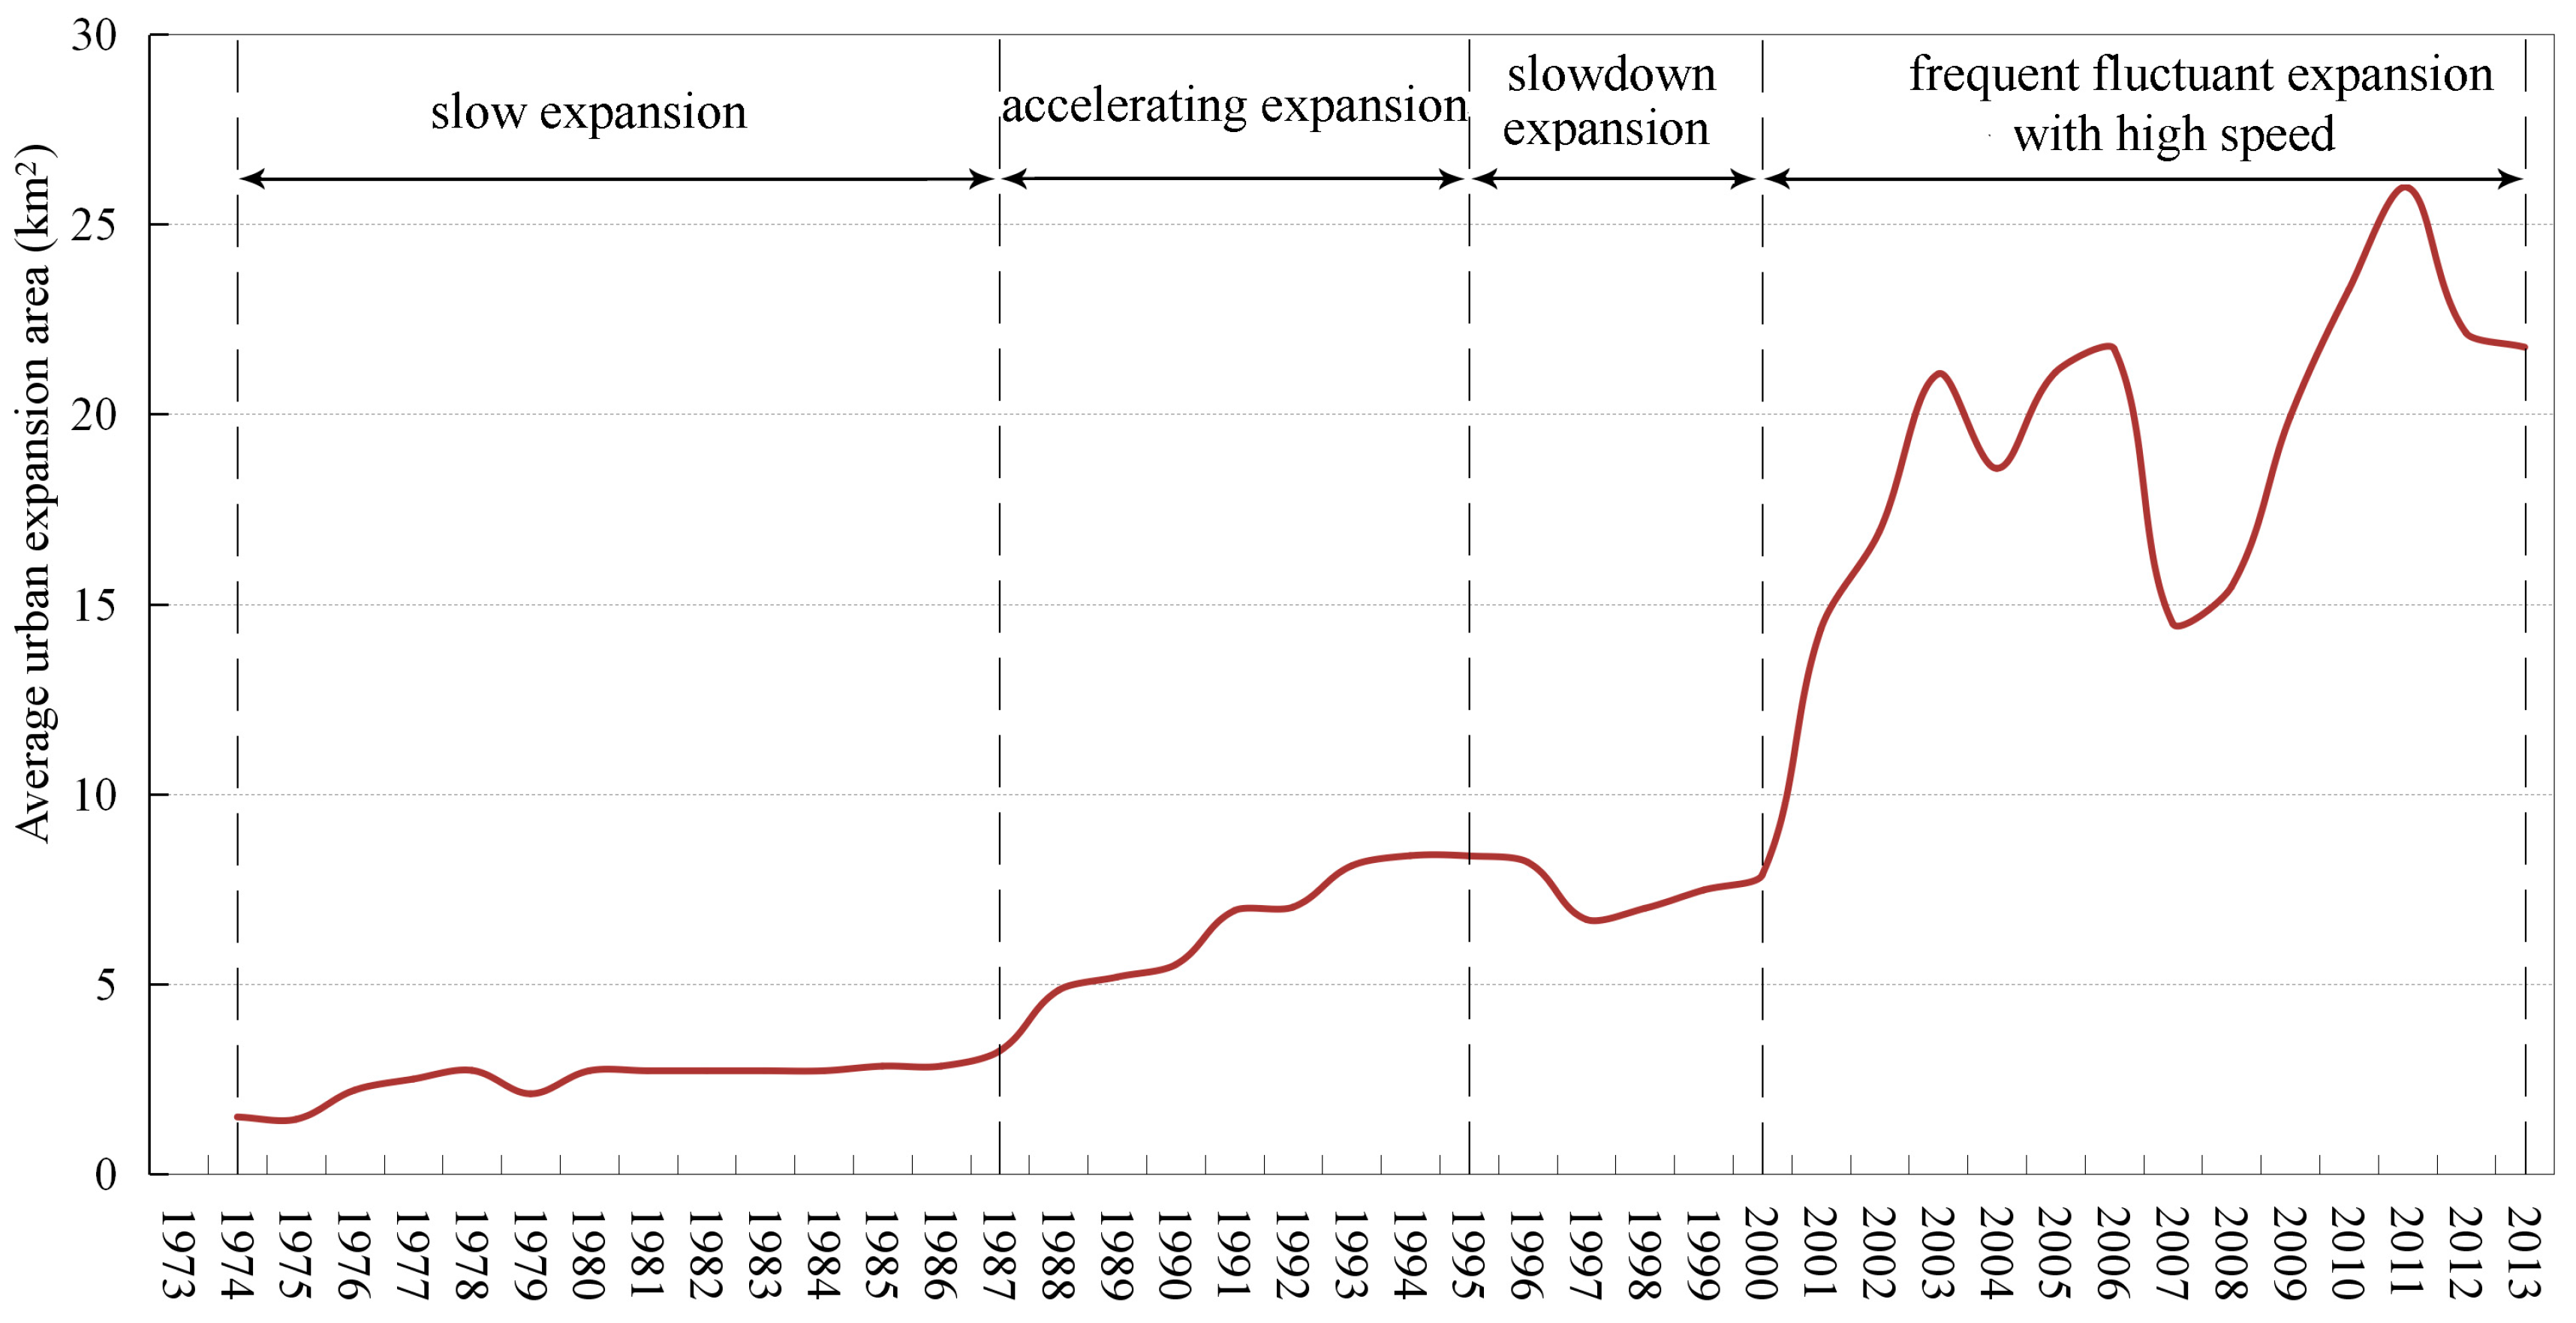
3.2. Urban Expansion Processes of Municipalities and Provincial Capitals

As illustrated in Figure 5, urban lands in municipalities and provincial capitals have expanded dramatically with fluctuations. The annual expansion area per city (AEAC) index of 31 cities increased from 1.50 km2 in the 1970s to 21.76 km2 in 2013, with the urban expansion rate increasing 13.50 times. Figure 5 shows that the 31 sample cities mainly underwent four different urban expansion stages. From the 1970s–1987, the urban expansion of the 31 cities demonstrated a successively slow expansion period, and the average AEAC value was only 2.50 km2. In the next 8 years, municipalities and provincial capitals entered an accelerating expansion period, and the average AEAC value of the 31 cities increased to 6.79 km2, which is 2.72 times higher than that of the 1970s–1987 period. Between 1995 and 2000, a slowdown expansion period occurred. The average AEAC ranged from 6.70 km2 to 8.37 km2. After 2000, the AEAC curve of the 31 cities presented a fluctuant and rapid growth trend. Three expansion rate peaks appeared in 2003, 2006, and 2011; and the peak value continuously increased. Thus, the years 1987, 1995, 2000, 2003, 2006, 2011, and 2013 were important time nodes during the urban expansion process of these 31 cities (Figure 5).

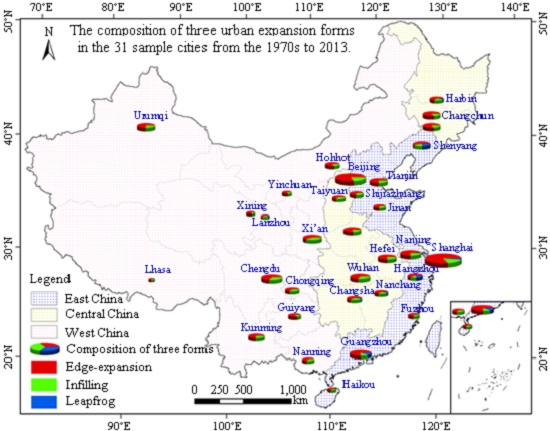
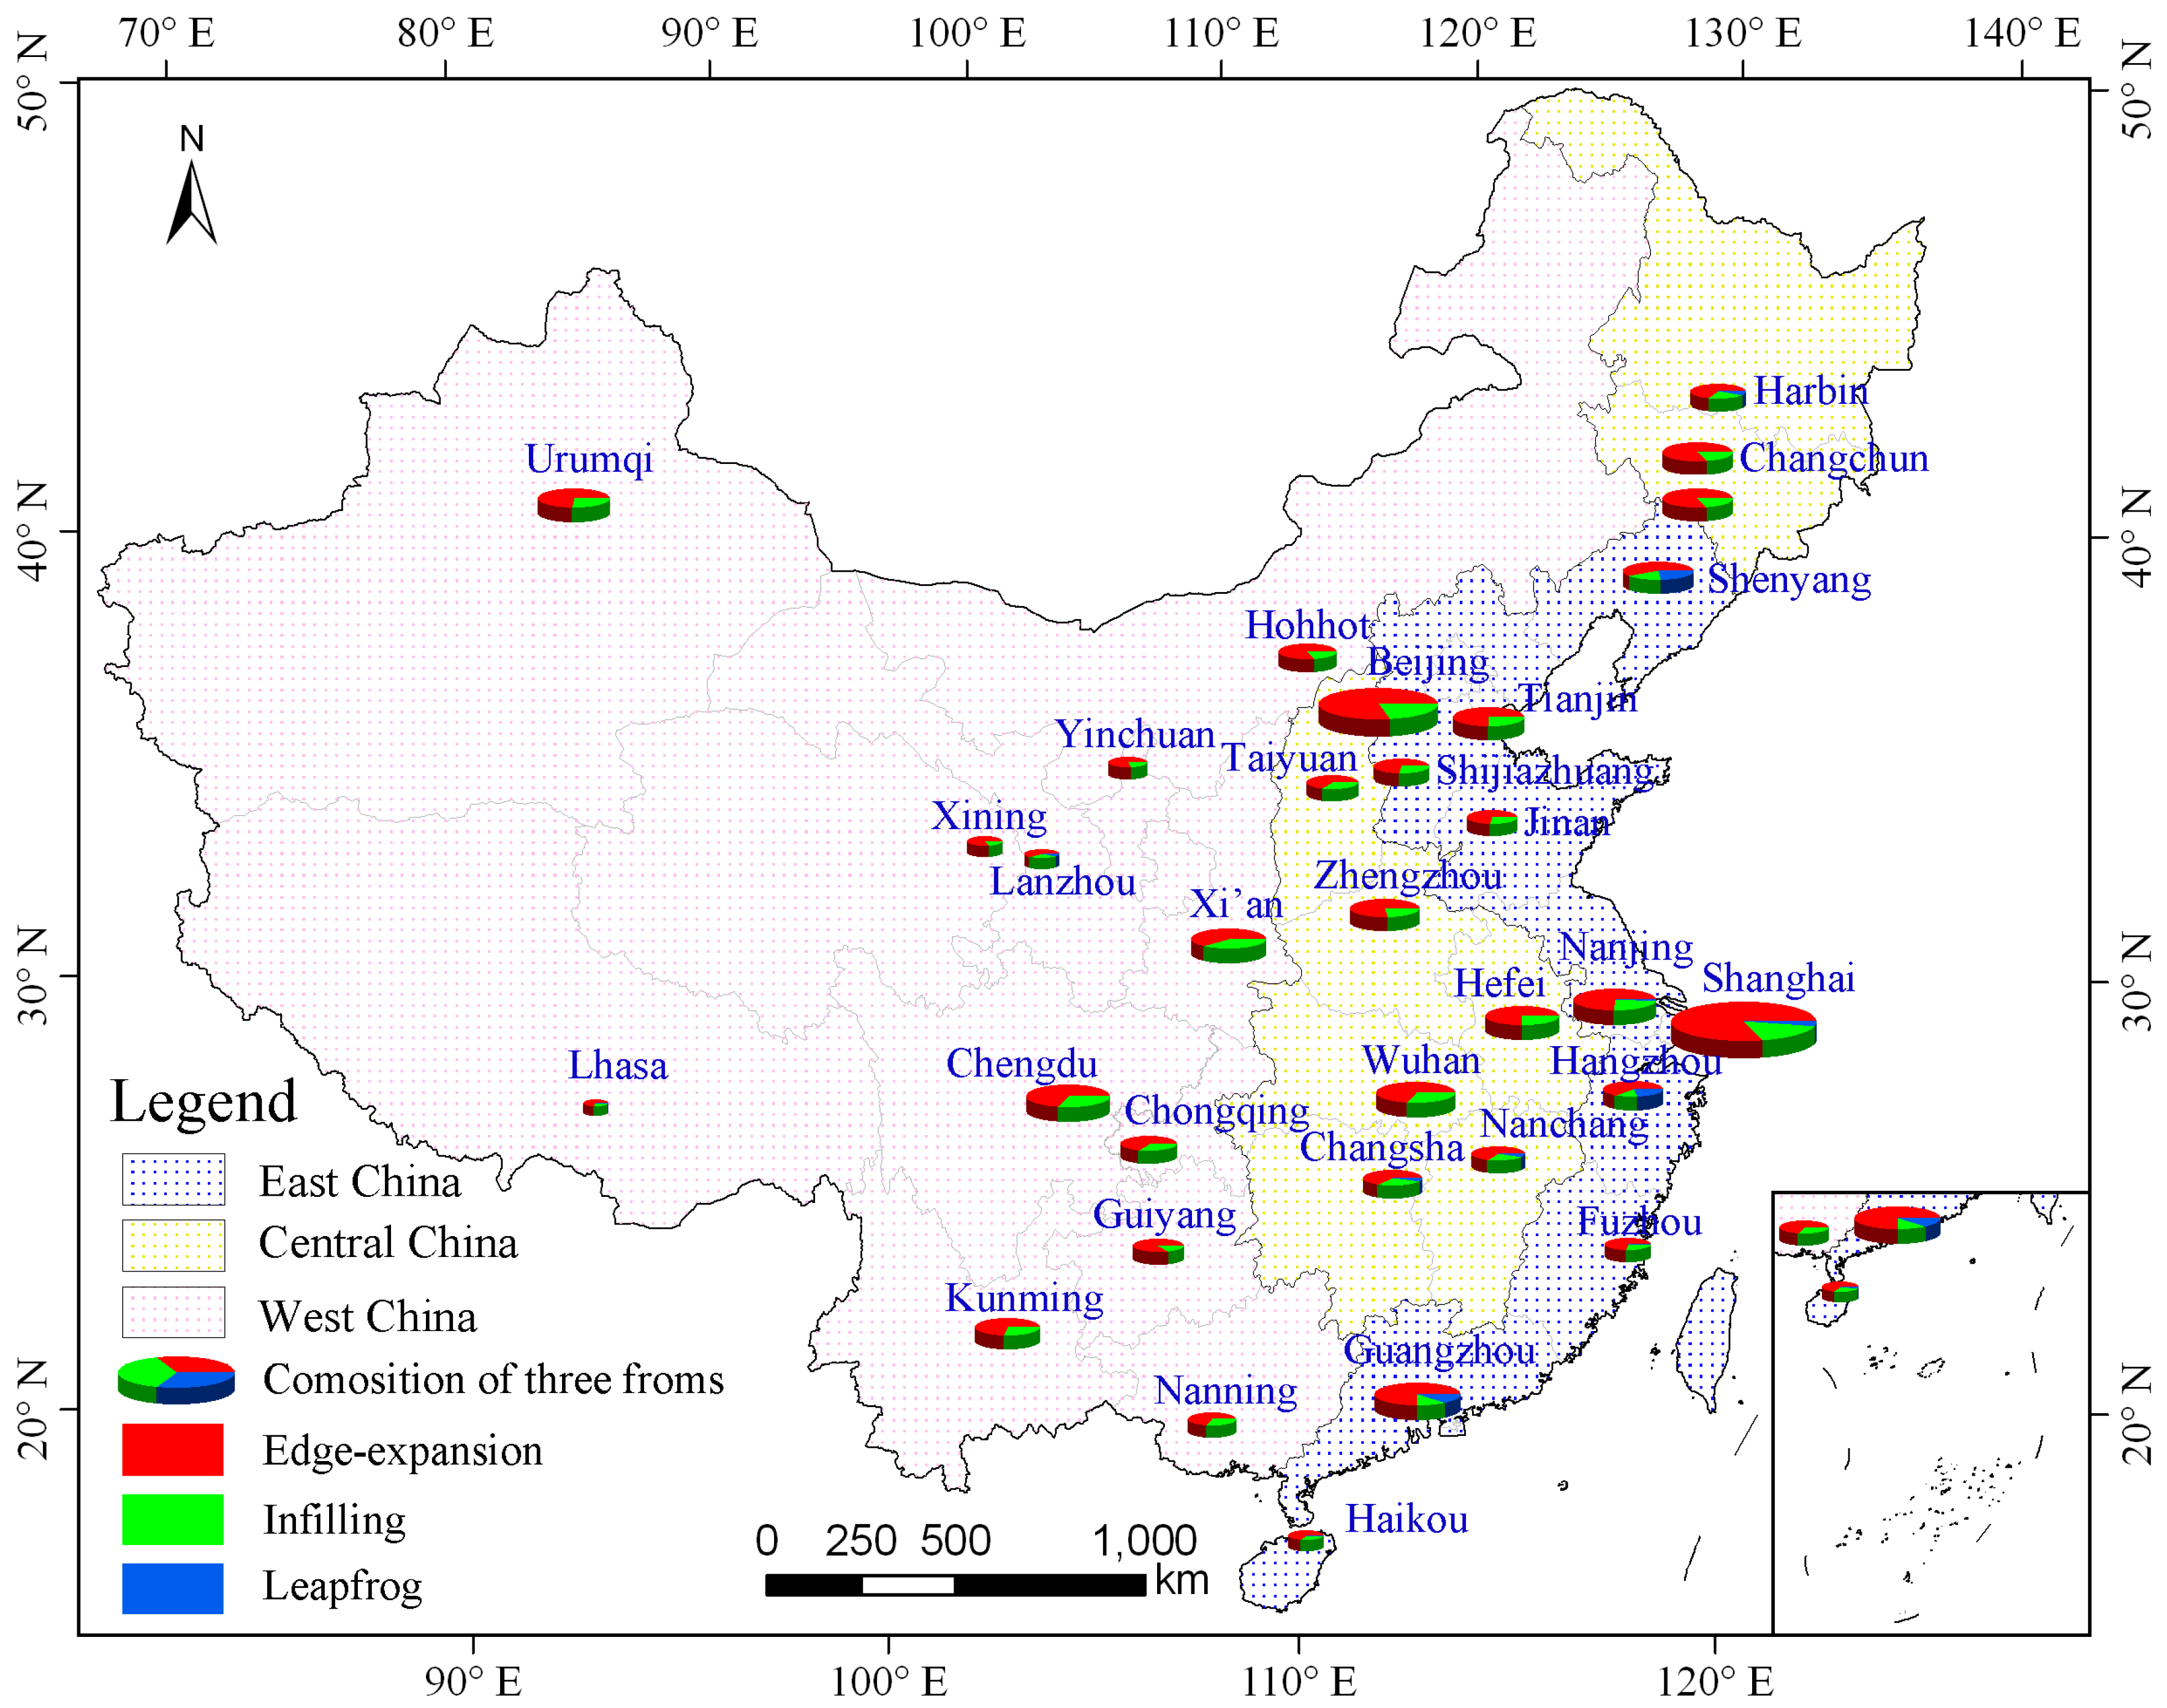
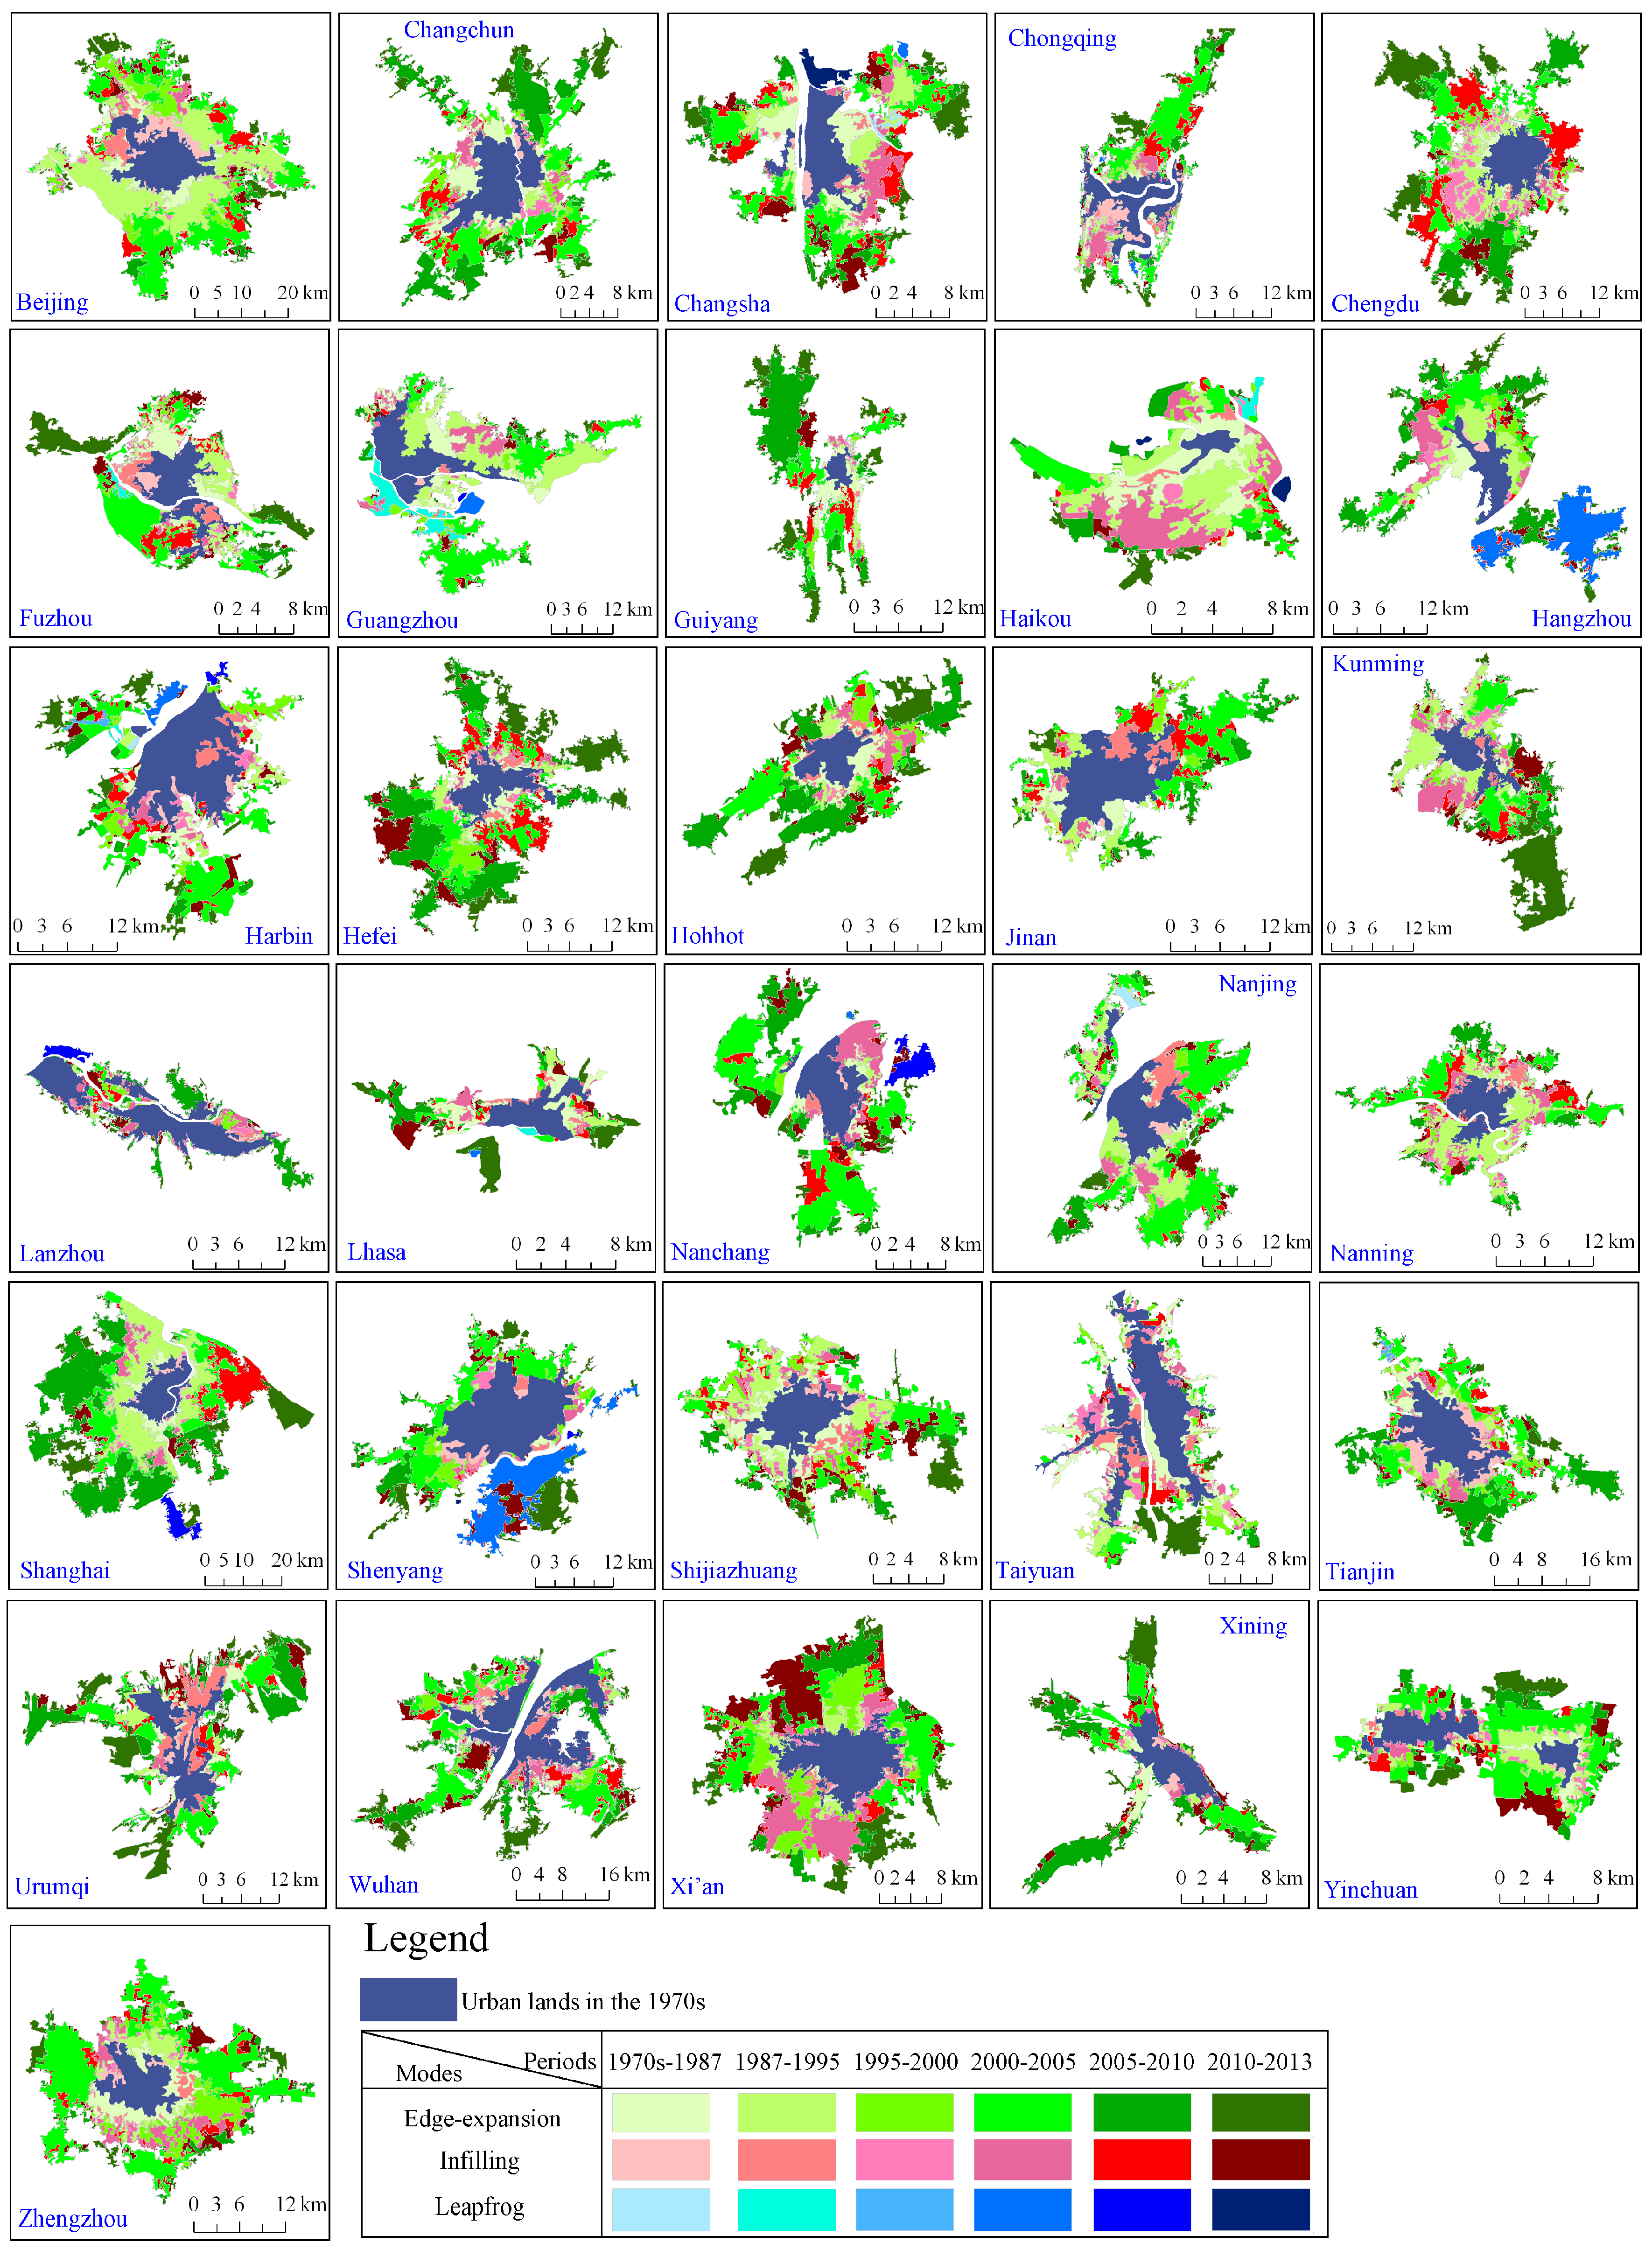
3.3. Urban Expansion Forms of Municipalities and Provincial Capitals

The period from the 1970s–2013 was divided into six short time periods (i.e., 1970s–1987, 1987–1995, 1995–2000, 2000–2005, 2005–2010, and 2010–2013) by appropriately considering the important time nodes of the 31 cities during the expansion process, by monitoring the time nodes of each city, and by balancing the time span division. As Figure 6 illustrates, the urban expansion forms of the 31 cities in the past four decades were mainly edge-expansion supported by the infilling form, whereas the leapfrog form contributed minimally to urban expansion. The central built-up area of the 31 cities expanded to a total of 13,219.19 km2. Among which, 73.16%, 24.00%, and 2.84% resulted from the edge-expansion, infilling, and leapfrog forms, respectively.
Although China ceaselessly improved and adjusted its urban development plan and strived for a sustainable urban development and compact urban expansion, edge-expansion remained the main form of urban expansion in municipalities and provincial capitals from the 1970s to 2013 (Figure 7). In the past four decades, the contribution rate of edge-expansion to the urban expansion of Chinese provincial and higher level cities was between 56.64% and 84.38%. The expansion rate of the 31 cities by the edge-expansion form evidently increased from 62.06 km2 per year in the 1970s–1987 period to 482.30 km2 per year in the 2010–2013 period (Table 1), and was clearly faster after the year 2000 than before it, with two slight reductions in the 1995–2000 period and after 2010. With the exception of Guangzhou, the expansion rates via the edge-expansion form in the other 30 cities were all higher in 2013 than in the 1970s (Figure 8). In addition, the expansion change trend via the edge-expansion form was closely related to the urban expansion process. That is, the periods of 1987–1995 and 2000–2005 were the two acceleration periods for edge-expansion in municipalities and provincial capitals. Expansion rates in the cities from 1987–1995 (70.97%) and 2000–2005 (87.10%) via the edge-expansion form clearly increased.
The infilling expansion form prevailed in municipalities and provincial capitals. Cities where the infilling form contributed highly to urban expansion were mainly distributed in Central China (Figure 6). The contribution rate of the infilling form to urban expansion ranged from 14.52% to 40.09%, which was considerably lower than that of the edge-expansion form but significantly higher than that of the leapfrog form (Figure 6 and Figure 7). As Figure 8 illustrates, the infilling expansion rate constantly increased from 17.58 km2 per year from 1970–1987 to 264.52 km2 per year from 2010–2013, i.e., an increase of 14.05 times (Table 1). Similar to that of the edge-expansion form, the rate of infilling expansion was faster after the year 2000 than before. With the exception of Zhengzhou and Shijiazhuang, where infilling expansion rate increased progressively in all the six periods, the expansion rate in the other 29 cities was fluctuant (Figure 8). Furthermore, the infilling expansion rate in the majority of the cities evidently increased in the 1987–1995 and 2000–2005 periods.
Urban expansion in the leapfrog form only occurred in 14 cities, namely, Guangzhou, Harbin, Changsha, Haikou, Shenyang, Lhasa, Hangzhou, Nanchang, Chongqing, Fuzhou, Lanzhou, Nanjing, Shanghai, and Tianjin; less than half of the total number of cities under monitoring (Figure 6 and Figure 7). The contribution rate of the leapfrog form to urban expansion was between 0.71% and 23.53%, and cities with a higher contribution rate were mainly distributed in East China, where urban expansion freedom was high. The rate of leapfrog expansion fluctuated (Table 1). Two peaks (1987–1995 and 2000–2005) occurred during the acceleration period of urban expansion. However, the variation amplitude of the leapfrog rate was considerably smaller than those of the other two expansion forms. The probability of leapfrog expansion appearing in all of the time periods was small, except in Harbin, where the frequency of leapfrog was higher, whereas the frequency in the other 13 cities was low (Figure 8). Moreover, the strength of the leapfrog form was closely related to urban expansion. Approximately 80.77% of leapfrog expansion occurred during the acceleration period of urban expansion (i.e., 1987–1995 and after 2000).

4. Discussion

4.1. Relationship between Urban Expansion Processes and National Macro Policies

Since the 1970s, urban lands in the municipalities and provincial capitals of China underwent different expansion stages, which adequately demonstrated the macro control function of government decisions and planning on urban expansion, as well as reflected the leading roles of economic growth, population growth, and industry agglomeration in urban expansion.
From the 1970s–1987, China was under the planned economy period, and economic development was restricted [47]. Although the “Reform and Opening Up” policy began to be implemented in 1978, the overall economic foundation remained weak during this stage. The urbanization process of municipalities and provincial capitals was under a stage driven by rural economic system reform, and urban expansion was slow.
Benefiting from the in-depth development of the “Reform and Opening Up” policy, the smooth implementation of the land use right transfer system, the successful transformation from a planned economy to a market economy [48], and the continuous reform of the urban household registration system [49], urbanization in China entered the dual-power-driven stage via township enterprises and urban reform in the 1980s, during which the urbanization process clearly accelerated. The expansion of the 31 cities accelerated from 1987–1995, and these cities entered the first expansion acceleration period.
Urban expansion is an irreversible process and is generally accompanied by a loss of cultivated land resources. In the 1990s, driven by urban construction, small town development, and economic development zone construction, urbanization in China was comprehensively promoted [50]. More people swarmed into municipalities and provincial capitals, and urban land demand became significant. The 31 cities lost significant amounts of cultivated land resources after only one period of accelerated expansion. From 1995–2000, China strengthened the protection of cultivated lands and issued a series of policies and regulations, such as the “Management Method of Construction Land Plan” and set the “Crime of Destroying Cultivated Land” [51], which restricted urban expansion to a certain degree. In addition, the 1997 Asian financial crisis seriously affected the Chinese economy and restricted the rate of urban expansion. Thus, urban expansion of the 31 cities slightly decreased from 1995–2000.
In 1999, China recovered from the effect of the financial crisis and successfully joined the World Trade Organization in the 21st century. The nationwide “real estate development upsurge” that emerged during the same period drove urban expansion in China further [52]. After the year 2000, the 31 cities entered the second rapid expansion period. However, with the general background of cultivated land protection policy becoming mature, and under the guidance and intervention of the macro policy on urban development [53], the pace of urban expansion failed to increase reasonably and suffered from frequent fluctuations. As illustrated in Figure 5, the urban expansion rate decreased from 2006–2007. With the exception of the intervention of the cultivated protection policy and the effect of the urban development macro policy, this period occurred before the global financial crisis in 2008, during which economic activity was reduced, the real estate industry was affected, and the urban expansion rate was decreased. The expansion area of municipalities and provincial capitals will remain significant in the future given the large urban area base. However, under the guidance of the new urbanization planning, the strategic idea of “accelerating the development of small–medium cities, developing small towns with emphasis, and promoting harmonious development among large and medium cities and small towns” will be implemented comprehensively [54]. The urban expansion rate of municipalities and provincial capitals may in turn slow down.

4.2. Spatial Differences of Urban Expansion

Urbanization in China was performed with unbalanced regional development. Therefore, urban expansion showed an obvious spatial difference. In the last 40 years, the urban expansion of municipalities and provincial capitals in China was obvious. Central built-up areas of the 31 sample cities expanded 5.12 times. Most cities with large central built-up areas had developed economies and were in the Yangtze River Delta, Pearl River Delta, and Beijing–Tianjin–Hebei regions, whereas cities with small central built-up areas were mainly located in Central and West China. The urban expansion rate in East China was the fastest, followed by that in Central China; West China had the slowest urban expansion rate. In the 1970s, relying on outstanding regional advantages, the urban expansion rate and urban land areas in East China were universally greater than those in Central and West China. With the implementation of the “Reform and Opening Up” policy and the transformation of the national development emphasis at the end of 1970, a large number of production factors, such as resources, funds, and talent in less developed areas in Central and West China ceaselessly flowed into the developed area in East China, restricting the development of Central and West China and accelerating their differences with East China to a certain degree [45]. A large population scale and a profound economic foundation provided sufficient power for the urban expansion in East China [43]. Therefore, the urban expansion rate in East China was much faster than that in Central and West China, especially in municipalities and provincial capitals. To strengthen the harmonious regional development and ease the unbalanced regional development, China started transferring regional development emphasis from the developed areas in East China to the less developed areas in Central and Western China in the 1990s. The “Develop the West” and “Rise of Central China” strategies were implemented [55], and development in Central and West China was emphasized. The spatial difference of urban expansion in the 31 cities is expected to narrow in the future.

4.3. Problems and Future Prospects of Urban Expansion Forms in Chinese Municipalities and Provincial Capitals

In the last 40 years, the aim of Chinese urban expansion has transformed from the original changing of the city appearance and improving the living conditions of people to the current blind pursuit of economic benefits brought about by the real estate industry, which resulted in urban lands in China expanding dramatically with 61.29% of municipalities and provincial capitals expanding by more than 4.5 times. It has been observed that urban expansion in most of municipalities and provincial capitals is extremely faster than the mega cities of North America and Europe. Mega cities in the western world expanded gradually, enabling them to effectively develop the necessary facilities for their people; however, due to rapid urban expansion, the local government in China is confronting diverse challenges to attaining sustainable development which could be more acute in the coming years if planning regulations are not enforced [56]. Urban expansion form is closely related to the sustainable development of cities, and it is a spatial consequence of the comprehensive effect of nature and man–made factors in cities [57]. It reflects the urban expansion process and is an important index for judging the rationality of urban expansion; its change will directly influence the planning and construction of urban traffic, communication, production, life, and public facilities [58]. In this study, UET was adopted to quantitatively analyze the spatiotemporal characteristics of the urban expansion form in municipalities and provincial capitals in China, providing scientific data support for urban planning and construction in China, and indicating the direction for the sustainable and healthy development of urban lands.
Generally, compared with cities in developed countries, cites in China exhibit more complex and less compact urban land forms [59], but their urban expansion still tends towards dispersion. Similar to some developing countries such as India [60] and Bangladesh [61], edge-expansion is the major urban expansion form in China, and it leads to extensive and unreasonable urban expansion and insufficient utilization of land resources. This expansion form is a critical problem for a developing country such as China, which has insufficient land resources and is under a rapid urbanization process. Although the urban expansion rate of the 31 cities via the edge-expansion form slowed down after 2010, the rate of this form was still faster than that of the other two forms. Urban expansion of municipalities and provincial capitals still tends towards dispersion. The changing trend of urban expansion forms in China confirms the findings of Bhatta (2009), that urban expansion in developing countries becomes dispersed [59], while contradicting the findings of Acioly and Davidson (1996), that more compact cities in developing countries appeared [62]. To improve urbanization quality, protect cultivated lands, and avoid the disordered expansion of cities, China has issued a series of measures to achieve a reasonable urban expansion [63]. In July 2014, 14 pilot cities were selected to delimit the urban expansion boundary and restrict the urban development scale. Among the 14 cities, 11 were municipalities and provincial capitals. Thus, the unreasonable expansion of municipalities and provincial capitals in China was particularly prominent and gained considerable emphasis. Under national macro regulation and control, construction in municipalities and provincial capitals may transfer from a spatial external extension to a reasonable urban land configuration, and edge-expansion rate is expected to slow down continuously in the future.
Leapfrog and infilling are the two supporting forms of urban expansion and their corresponding spatial distribution characteristics are closely coupled to regional division of China. That is, cities with a high contribution of leapfrog form of urban expansion are generally distributed in East China, whereas cities with a high contribution of infilling form of urban expansion are generally distributed in Central China. Leapfrog expansion is not a popular phenomenon, and it is generated because of historical reasons, resource distribution and development, urban economy development, and population evacuation demand. The leapfrog form only occurred in 14 out of the 31 cities that were monitored. The frequency of the leapfrog phenomenon and its corresponding expansion rate are also closely related to the urban expansion process; that is, the frequency and rate of leapfrog expansion during the accelerating expansion stage are greater than that in any other period.
Infilling is another important expansion form in addition to the edge-expansion form, and it is universal among the 31 monitored cities. As the edge-expansion rates slowed down after 2010, the infilling rates evidently increased. After the year 2000, as the land resources for urban expansion became increasingly deficient, the urban spatial patterns of municipalities and provincial capitals in China became stable, and reasonable and intensive urban expansion gained considerable attention. Given that infilling expansion can effectively improve the land utilization rate, shorten the connecting distance between cities, and ease the problems of motor vehicle exhaust discharge and photochemical smoke pollution, this form can reduce public facility construction expenses. However, for megacities such as Beijing, Shanghai, and Guangzhou, the compact urban spatial pattern will aggravate traffic congestion and air pollution [64]. Therefore, the issue of whether infilling expansion is preferable in megacities remains controversial.
In this study, we employed the visual interpretation method to complete a high-frequency and long-term monitoring of urban expansion in Chinese cities at the administrative level from the 1970s to 2013 based on multi-source remotely sensed imagery. A relatively high accuracy urban expansion database was provided for analyzing the processes and forms of urban expansion in Chinese municipalities and provincial capitals. However, the efficiency of this method is lower than the automatic classification method. Currently, urban expansion monitoring by using remote sensing and GIS technology with large scale, multiple cities and long timescales has become a necessary trend. To ensure information acquisition efficiency and urban expansion monitoring accuracy, the effective combination of the automatic classification method and the visual interpretation method will be widely and vigorously considered [65,66]. Additionally, some problems appeared when adopting the AEAC index. For example, due to abundant remotely sensed data used in the later stages while relatively less data was used in the early stages, the larger urban expansion rate fluctuation appeared in the later stages rather than in the early stages. Although this index is not perfect, the overall characteristics of urban expansion processes in municipalities and provincial capitals can be basically and intuitively reflected by adoption of the index, and urban expansion processes can be more objectively reflected by increasing the monitoring frequency in the early stages in future work.

5. Conclusions

Based on remote sensing and GIS, the urban expansion of municipalities and provincial capitals in China over the past four decades was constructed using the visual interpretation method. The urban expansion process was fully analyzed from the aspects of overall characteristics of urban expansion and urban expansion stage development, and the urban expansion forms of 31 sample cities were quantitatively analyzed by employing the index of UET. The conclusions are as follows:
(1)
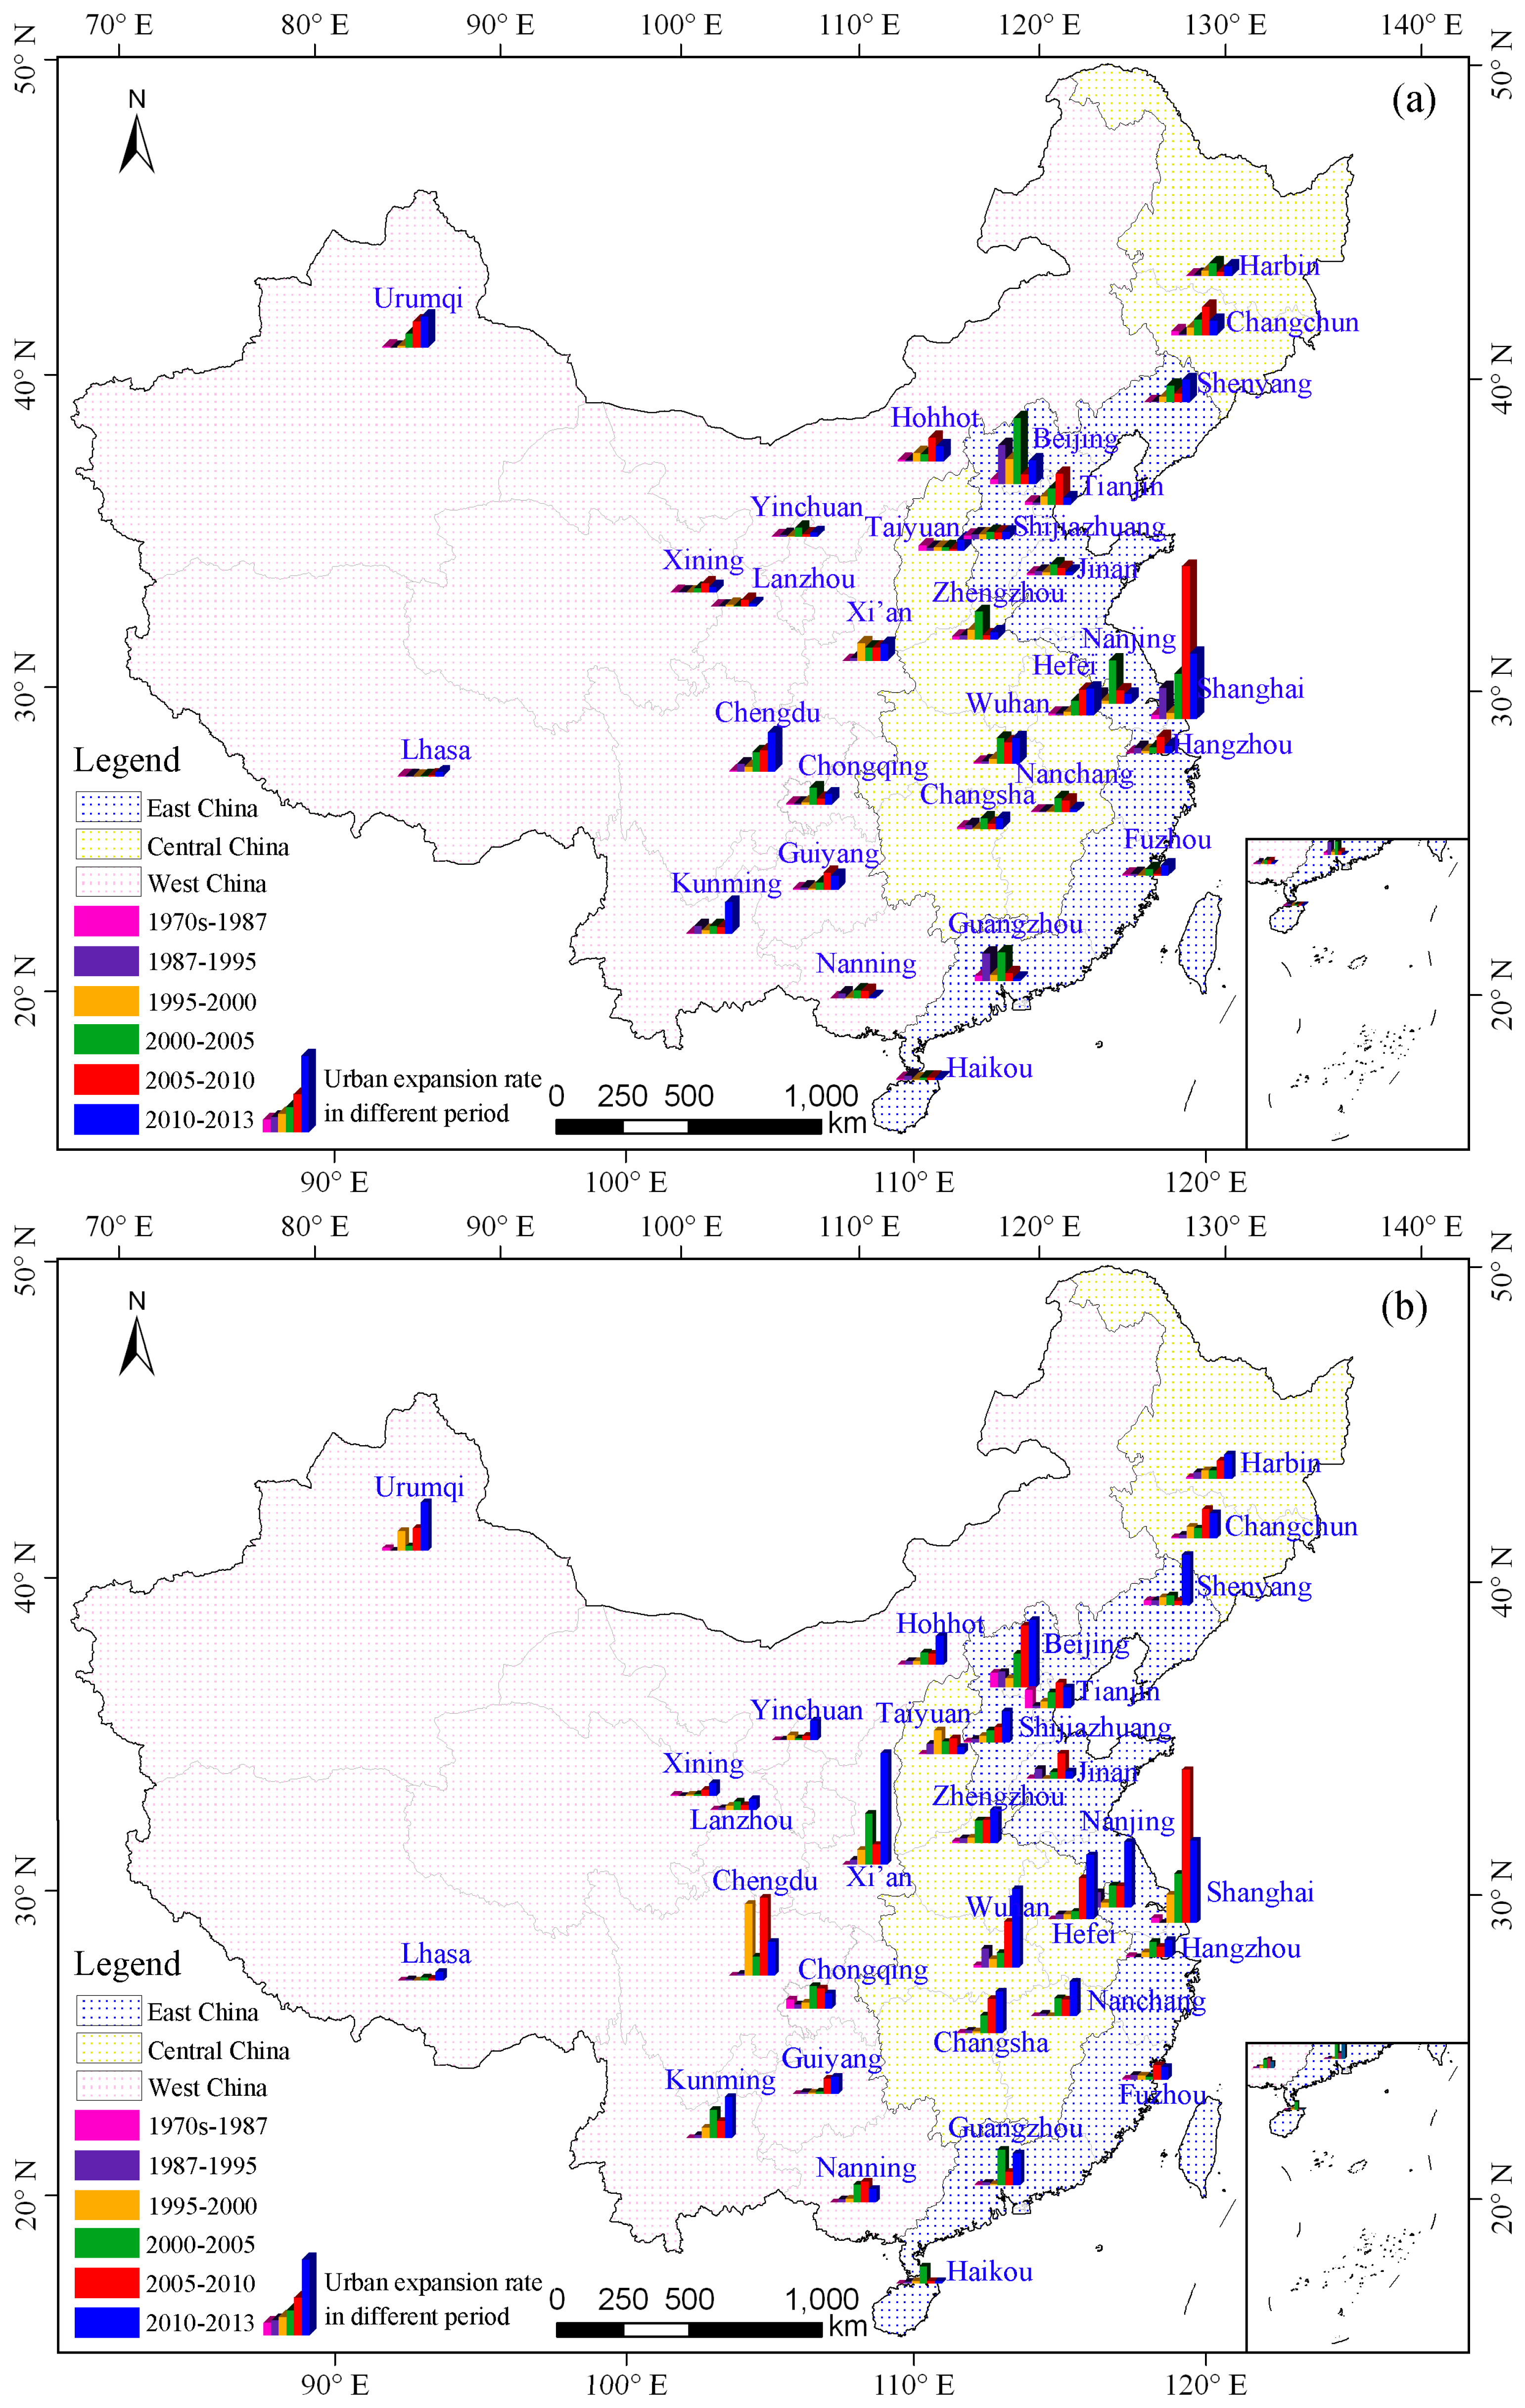
Urban expansion processes were closely related to national macro policies. Since the 1970s, urban lands in municipalities and provincial capitals in China have expanded dramatically from 2582.38 km2 in the 1970s to 15,801.57 km2 in 2013. Four urban expansion stages occurred successively, i.e., a slow expansion period from the 1970s–1987, an accelerating expansion period from 1987–1995, a slowdown expansion period from 1995–2000, and a fluctuating expansion period with a high rate after 2000. Urban expansion exhibited an apparent spatial difference. The expansion rate of cities in East China was fastest, followed by that of cities in Central China. The urban expansion rate was slowest in West China.
(2)
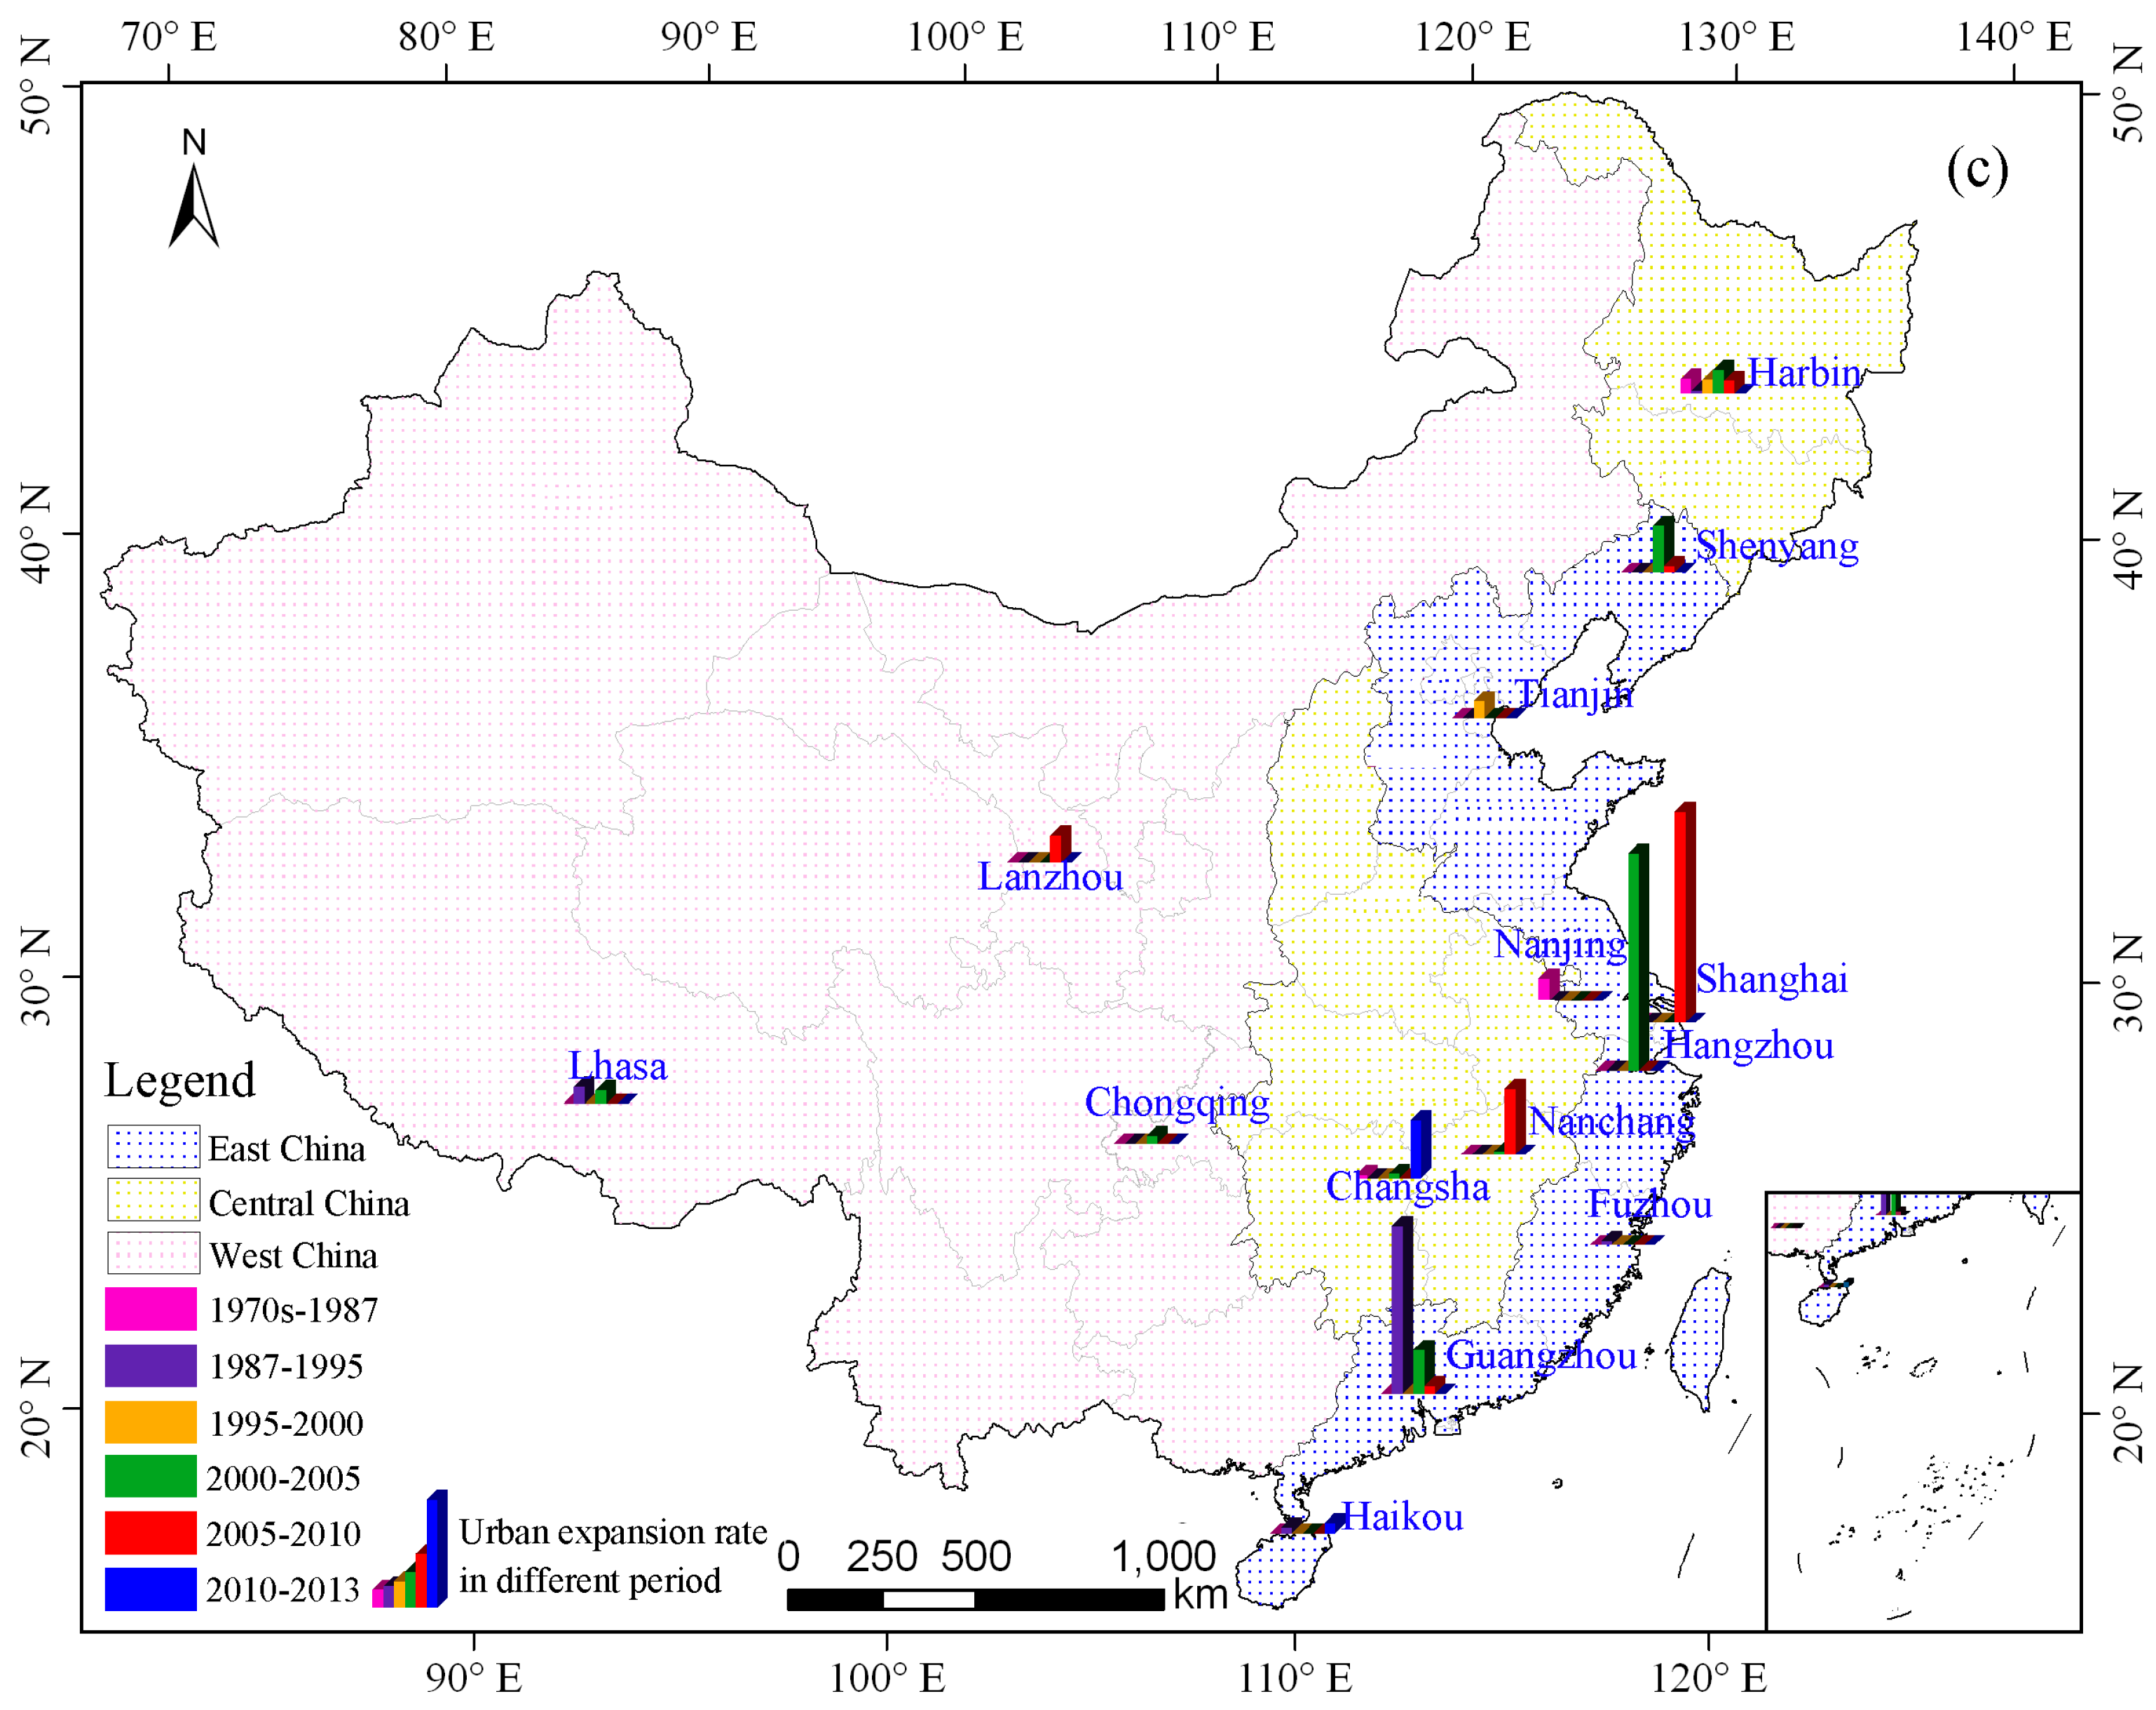
From the 1970s to 2013, the expansion form in China was mainly edge-expansion supported by infilling expansion, and the leapfrog form contributed little to urban expansion. The edge-expansion form surged before 2010 and gradually slowed down after 2010, and infilling expansion kept increasing during the past four decades. Meanwhile, the rate of urban expansion via leapfrog form fluctuated. Additionally, urban expansion rates via edge-expansion, infilling, and leapfrog forms were all closely related to the urban expansion process.

Acknowledgments

The authors thank all the scientists who have participated in the construction of the urban expansion database, and includes all scientists and students in the Renewable Resources Division in the Institute of Remote Sensing and Digital Earth CAS. This paper was written under the auspices of the National Science and Technology Support Projects of China (No. 2014BAL01B01C).

Author Contributions

Fang Liu and Xiao Wang conceived and designed the experiments, processed, and analyzed the data. Based on the processed data, Fang Liu drafted the initial manuscript. Zengxiang Zhang reviewed and commented on the manuscript.

Conflicts of Interest

The authors declare no conflict of interest.

Appendix A

Table A1. Image source, year, and sensor of the 31 sample cities.
CitiesLandsat MSSLandsat TM/ETM+CBERS CCDHJ–1 CCDLandsat 8 OLI
Beijing1973, 1975, 19781984, 1987, 1992, 1996, 1998, 1999, 2000, 2001, 2002, 2003, 2004, 2005, 2006, 2007, 2009, 2010, 2011200820122013
Changchun19761987, 1993, 1996, 1998, 2000, 2004, 2009, 2010, 20112006, 2008-2013
Changsha19731989, 1993, 1996, 1998, 2000, 2001, 2004, 2006, 2009, 2010200820122013
Chengdu1975, 19781988, 1992, 1997, 2000, 2001, 2002, 2006, 2007, 200920052010, 2012, 2013-
Chongqing1978, 19791986, 1988, 1995, 1998, 2000, 2001, 2002, 2004, 2005, 2006, 2009, 20102004, 20082011, 2012, 20132013
Fuzhou19731986, 1989, 1996, 2000, 2001, 2004, 2006, 2009, 201020082011, 20122013
Guangzhou1977, 1978, 19791989, 1990, 1996, 1998, 1999, 2000, 2004, 20092006, 20082010, 2011, 2012, 2013-
Guiyang19731990, 1991, 1993, 1994, 1998, 1999, 2000, 2001, 2002, 2005, 2006, 2007, 2009, 20102004, 20082011, 2012, 2013-
Haikou19731989, 1991, 1995, 1998, 2000, 2001, 2004, 2007, 2009, 2010200620112013
Hangzhou1976, 19781988, 1991, 1995, 1998, 1999, 2000, 2004, 2008, 2009, 201020062011, 20122013
Harbin19761989, 1996, 1998, 2000, 2004, 2006, 2009, 201020082011, 20122013
Hefei1973, 19791987, 1995, 1998, 2000, 2001, 2002, 2005, 2006, 2009, 201020082011, 20122013
Hohhot19761987, 1998, 2000, 2001, 2002, 2004, 2006, 2009, 2010, 2011200820122013
Jinan19791987, 1995, 2000, 2002, 2004, 2005, 2006, 2009, 2010, 2011200820122013
Kunming19741988, 1992, 1996, 2000, 2004, 2006, 2008, 2009, 2010-2011, 20122013
Lanzhou19781986, 1987, 1994, 1995, 1998, 1999, 2001, 2005, 2006, 2008, 2009, 2011-2010, 20122013
Lhasa19761991, 1999, 2000, 2002, 2003, 2005, 2006, 2008, 2009, 2010, 201120052012, 20132013
Nanchang19761989, 1995, 1998, 1999, 2000, 2004, 2006, 2009, 201020082011, 20122013
Nanjing19791986, 1988, 1996, 1998, 2001, 2004, 2009, 20102006, 20082011, 20122013
Nanning19731986, 1990, 1996, 1998, 1999, 2000, 2004, 2006, 2008, 2009, 2010-2011, 2012, 2013-
Shanghai 1975, 19791987, 1989, 1998, 2000, 2001, 2004, 2004, 2008, 2009, 20102006, 20082011, 20122013
Shenyang1977, 19791988, 1992, 1995, 1998, 1999, 2000, 2001, 2002, 2004, 2006, 2008, 2009, 2010-2011, 20122013
Shijiazhuang19791987, 1993, 1996, 1998, 2000, 2004, 2006, 2009, 201020082011, 20122013
Taiyuan19771987, 1990, 1996, 1998, 1999, 2000, 2004, 2006, 2009, 2010, 2011200820122013
Tianjin1978, 19791987, 1993, 1996, 1998, 2000, 2001, 2004, 2006, 2009, 201020082011, 20122013
Urumqi19751990, 2000, 2004, 2006, 2009, 2010, 2011-20122013
Wuhan19781989, 1991, 1995, 1998, 2000, 2001, 2002, 2006, 2009, 20102004, 20082011, 20122013
Xi’an1973, 19771987, 1988, 1996, 1998, 2000, 2002, 2004, 2006, 2008, 2009-2011, 20122013
Xining19771987, 1995, 1996, 1999, 2000, 2001, 2002, 2005, 2006, 2009, 20112004, 20082010, 20122013
Yinchuan19781987, 1991, 1996, 1999, 2000, 2005, 2006, 2009, 2010, 2011200820122013
Zhengzhou1976, 19791988, 1992, 1995, 1998, 2000, 2001, 2002, 2004, 2006, 2009, 201020082011, 20122013

References

  1. Sarvestani, M.S.; Ibrahim, A.L.; Kanaroglou, P. Three decades of urban growth in the city of Shiraz, Iran: A remote sensing and geographic information systems application. Cities 2011, 28, 320–329. [Google Scholar] [CrossRef]
  2. Zhang, Z.; Li, N.; Wang, X.; Liu, F.; Yang, L. A comparative study of urban expansion in Beijing, Tianjin and Tangshan from the 1970s to 2013. Remote Sens. 2016, 8. [Google Scholar] [CrossRef]
  3. United Nations Department of Economic and Social Affairs. World Urbanization Prospects; the 2014 Revision; United Nations Publications: New York, NY, USA, 2014; Available online: http://www.uesit.com.cn (accessed on 3 January 2014).
  4. Xu, X.; Min, X. Quantifying spatiotemporal patterns of urban expansion in China using remote sensing data. Cities 2013, 35, 104–113. [Google Scholar] [CrossRef]
  5. Camagni, R.; Gibelli, M.C.; Rigamonti, P. Urban mobility and urban form: The social and environmental costs of different patterns of urban expansion. Ecol. Econ. 2002, 40, 199–216. [Google Scholar] [CrossRef]
  6. Glaeser, E.L.; Kahn, M.E. Sprawl and urban growth. In Handbook of Regional and Urban Economics; North Holland: Amsterdam, The Netherlands, 2004; pp. 2481–2527. [Google Scholar]
  7. Morris, A.E.J. History of Urban Form before the Industrial Revolution, 1st ed.; Routledge: London, UK, 2013. [Google Scholar]
  8. Xu, X.Q.; Zhou, Y.X. Urban Geography, 1st ed.; Higher Education Press: Beijing, China, 1997. [Google Scholar]
  9. Berry, B.J. Internal structure of the city. Law Contemp. Probl. 1965, 30, 111–119. [Google Scholar] [CrossRef]
  10. Marquez, L.O.; Smith, N.C. A framework for linking urban form and air quality. Environ. Model. Softw. 1999, 14, 541–548. [Google Scholar] [CrossRef]
  11. Wilson, E.H.; Hurd, J.; Civco, D.; Prisloe, M.P.; Arnold, C. Development of a geospatial model to quantify, describe and map urban growth. Remote Sens. Environ. 2003, 86, 275–285. [Google Scholar] [CrossRef]
  12. Xu, C.; Liu, M.; Zhang, C.; An, S.; Yu, W.; Chen, J.M. The spatiotemporal dynamics of rapid urban growth in the Nanjing metropolitan region of China. Landsc. Ecol. 2007, 22, 925–937. [Google Scholar] [CrossRef]
  13. Li, P.L.; Li, Q.; Sun, L.P. Social Stratification in China Today, 1st ed.; Social Science Literature Press: Beijing, China, 2004. [Google Scholar]
  14. Chen, Z.; Lu, M. Toward Balanced Growth with Economic Agglomeration: Urban-Rural Integration and Spatial Agglomeration in the Process of Chinese Urbanization; Springer: Berlin/Heidelberg, Germany, 2015. [Google Scholar]
  15. Zhang, Z.X.; Zhao, X.L.; Liu, F.; Xu, J.Y.; Wen, Q.K.; Hu, S.G. Atlas of Urban Expansion by Remote Sensing in China, 1st ed.; Star Map Press: Beijing, China, 2014. [Google Scholar]
  16. Wang, W.; Yu, T.; Ciren, P.; Jiang, P. Assessment of human health impact from PM10 exposure in China based on satellite observations. J. Appl. Remote Sens. 2015, 9, 096027. [Google Scholar] [CrossRef]
  17. Guzy, M.R.; Smith, C.L.; Bolte, J.P.; Hulse, D.W.; Gregory, S.V. Policy research using agent-based modeling to assess future impacts of urban expansion into farmlands and forests. Ecol. Soc. 2008, 13, 37–42. [Google Scholar]
  18. Li, Q.; Lu, L.; Weng, Q.; Xie, Y.; Guo, H. Monitoring urban dynamics in the southeast USA using time-series DMSP/OLS nightlight imagery. Remote Sens. 2016, 8, 578. [Google Scholar] [CrossRef]
  19. Brueckner, J.K. Urban growth boundaries: An effective second-best remedy for unpriced traffic congestion? J. Hous. Econ. 2007, 16, 263–273. [Google Scholar] [CrossRef]
  20. Deng, X.; Huang, J.; Rozelle, S.; Uchida, E. Growth, population and industrialization, and urban land expansion of China. J. Urban Econ. 2008, 63, 96–115. [Google Scholar] [CrossRef]
  21. James, P.; Troped, P.J.; Hart, J.E.; Joshu, C.E.; Colditz, G.A.; Brownson, R.C.; Ewing, R.; Laden, F. Urban sprawl, physical activity, and body mass index: Nurses ‘health study and nurses’ health study II. Am. J. Public Health 2013, 103, 369–375. [Google Scholar] [CrossRef] [PubMed]
  22. Tan, M.H.; Lv, C.H. Distribution of China city size expressed by urban built-up area. Acta Geogr. Sin. 2003, 58, 285–293. [Google Scholar]
  23. Turner, B.L.; Lambin, E.F.; Reenberg, A. The emergence of land change science for global environmental change and sustainability. Proc. Natl. Acad. Sci. USA 2007, 104, 20666–20671. [Google Scholar] [CrossRef] [PubMed]
  24. Mu, F.Y.; Zhang, Z.X.; Chi, Y.B.; Liu, B.; Zhou, Q.B.; Wang, C.; Tan, W. Dynamic monitoring of built-up area in Beijing during 1973–2005 based on multi-original remotely sensed images. J. Remote Sens. 2007, 11, 257–268. [Google Scholar]
  25. Wu, K.Y.; Zhang, H. Land use dynamics, built-up land expansion patterns, and driving forces analysis of the fast-growing Hangzhou metropolitan area, eastern China (1978–2008). Appl. Geogr. 2012, 34, 137–145. [Google Scholar] [CrossRef]
  26. Arsanjani, J.J.; Helbich, M.; Kainz, W.; Boloorani, A.D. Integration of logistic regression, Markov chain and cellular automata models to simulate urban expansion. Int. J. Appl. Earth Obs. 2013, 21, 265–275. [Google Scholar] [CrossRef]
  27. Zhang, N.; Wang, X.; Chen, Y.; Dai, W.; Wang, X. Numerical simulations on influence of urban land cover expansion and anthropogenic heat release on urban meteorological environment in Pearl River Delta. Theor. Appl. Climatol. 2016, 126, 469–479. [Google Scholar] [CrossRef]
  28. Lin, T.J.; Xu, C. The State of China’s New Urbanization Development 2015, 1st ed.; Peking University Press: Beijing, China, 2015. [Google Scholar]
  29. He, C.; Okada, N.; Zhang, Q.; Shi, P.; Zhang, J. Modeling urban expansion scenarios by coupling cellular automata model and system dynamic model in Beijing, China. Appl. Geogr. 2006, 26, 323–345. [Google Scholar] [CrossRef]
  30. Yu, X.J.; Ng, C.N. Spatial and temporal dynamics of urban sprawl along two urban-rural transects: A case study of Guangzhou, China. Landsc. Urban Plan. 2007, 79, 96–109. [Google Scholar] [CrossRef]
  31. Liu, K.; Wang, J.; Tang, P. Sprawling urban form and expanding living space: A study on the relationship of residential space development and urban built-up area expansion in Nanjing, China. J. Asian Archit. Build. Eng. 2015, 14, 387–394. [Google Scholar] [CrossRef]
  32. Kuang, W. Simulating dynamic urban expansion at regional scale in Beijing–Tianjin–Tangshan Metropolitan Area. J. Geogr. Sci. 2011, 21, 317–330. [Google Scholar] [CrossRef]
  33. Tian, G.; Jiang, J.; Yang, Z.; Zhang, Y. The urban growth, size distribution and spatio-temporal dynamic pattern of the Yangtze River Delta megalopolitan region, China. Ecol. Model. 2011, 222, 865–878. [Google Scholar] [CrossRef]
  34. Ye, Y.; Zhang, H.; Liu, K.; Wu, Q. Research on the influence of site factors on the expansion of construction land in the Pearl River Delta, China: By using GIS and remote sensing. Int. J. Appl. Earth. Obs. 2013, 21, 366–373. [Google Scholar] [CrossRef]
  35. Yao, S.M.; Chen, Z.G.; Wang, B. A study on the spatial expansion patterns in China’s large coastal cities. Reg. Dev. 2012, 5, 96–104. [Google Scholar]
  36. Department of City Social Economy Investigation Bureau of Statistics of China. China City Statistical Yearbook 2014, 2nd ed.China Statistics Press: Beijing, China, 2015.
  37. Department of Population and Employment Statistics National Bureau of Statistics of China. China Population and Employment Statistics Yearbook 2014, 2nd ed.China Statistics Press: Beijing, China, 2015.
  38. Ministry of Construction of the People’s Republic of China. Standard for Basic Terminology of Urban Planning; China Architecture & Building Press: Beijing, China, 1999.
  39. Eum, J.H.; Scherer, D.; Fehrenbach, U.; Woo, J.H. Development of an urban land cover classification scheme suitable for representing climatic conditions in a densely built-up Asian megacity. Landsc. Urban Plan. 2011, 103, 362–371. [Google Scholar] [CrossRef]
  40. Liu, J.; Zhan, J.; Deng, X. Spatio-temporal patterns and driving forces of urban land expansion in China during the economic reform era. Ambio 2005, 34, 450–455. [Google Scholar] [CrossRef] [PubMed]
  41. Wang, L.; Li, C.; Ying, Q.; Cheng, X.; Wang, X.; Li, X.; Hu, L.; Liang, L.; Yu, L.; Huang, H. China’s urban expansion from 1990 to 2010 determined with satellite remote sensing. Chin. Sci. Bull. 2012, 57, 2802–2812. [Google Scholar] [CrossRef]
  42. Yang, K. Functions and characteristics of MGE software. Bull. Surv. Mapp. 1999, 7, 31–33. [Google Scholar]
  43. Zhang, Z.; Wang, X.; Zhao, X.; Liu, B.; Yi, L.; Zuo, L.; Wen, Q.; Liu, F.; Xu, J.; Hu, S. A 2010 update of national land use/cover database of China at 1:100000 scale using medium spatial resolution satellite images. Remote Sens. Environ. 2014, 149, 142–154. [Google Scholar] [CrossRef]
  44. Liu, J.; Zhang, Q.; Hu, Y. Regional differences of China’s urban expansion from late 20th to early 21st century based on remote sensing information. Chin. Geogr. Sci. 2012, 22, 1–14. [Google Scholar] [CrossRef]
  45. Shi, L.; Liu, F.; Zhang, Z.; Zhao, X.; Liu, B.; Xu, J.; Wen, Q.; Yi, L.; Hu, S. Spatial differences of coastal urban expansion in China from 1970s to 2013. Chin. Geogr. Sci. 2015, 25, 389–403. [Google Scholar] [CrossRef]
  46. Dai, X.C. The compact development and policy guidance in the process of urbanization in Taiwan. Urban Plan. Int. 2013, 28, 71–77. [Google Scholar]
  47. Zhang, Q.; Zou, H. Regional inequality in contemporary China. Ann. Econ. Financ. 2012, 13, 113–137. [Google Scholar]
  48. Ding, C. Land policy reform in China: Assessment and prospects. Land Use Policy 2003, 20, 109–120. [Google Scholar] [CrossRef]
  49. Quheng, D.; Gustafsson, B. The Hukou Converters—China’s lesser known rural to urban migrants. J. Contemp. China 2014, 23, 657–679. [Google Scholar] [CrossRef]
  50. Chen, M.; Zheng, Y. China’s regional disparity and its policy responses. China World Econ. 2008, 16, 16–32. [Google Scholar] [CrossRef]
  51. Tam, V.W. On the effectiveness in implementing a waste-management-plan method in construction. Waste Manag. 2008, 28, 1072–1080. [Google Scholar] [CrossRef] [PubMed]
  52. De Haan, A. The financial crisis and China’s harmonious society. J. Curr. Chin. Aff. 2010, 39, 69–99. [Google Scholar]
  53. Zhai, W.X.; Huang, X.J. Analysis on the effect of policies operation of cultivated land protection in China. China Land Sci. 2003, 2, 8–13. [Google Scholar]
  54. Liang, S. Research on China’s urban development strategy based on arable land preservation. J. Urban Plan. Dev. 2011, 137, 329–336. [Google Scholar] [CrossRef]
  55. Fan, S.; Kanbur, R.; Zhang, X. China’s regional disparities: Experience and policy. Rev. Dev. Financ. 2011, 1, 47–56. [Google Scholar] [CrossRef]
  56. Dewan, A.M.; Yamaguchi, Y. Using remote sensing and GIS to detect and monitor landuse and land cover change in Dhaka Metropolitan of Bangladesh during 1960–2005. Environ. Monit. Assess. 2009, 150, 237–249. [Google Scholar] [CrossRef] [PubMed]
  57. Wang, X.S.; Liu, J.Y.; Zhuang, D.F.; Wang, L.M. Spatial-temporal changes of urban spatial morphology in China. Acta Grogr. Sin. 2005, 60, 392–400. [Google Scholar]
  58. Liu, J.Y.; Zhang, Z.X.; Zhuang, D.F.; Wang, Y.M.; Zhou, W.C.; Zhang, S.W.; Li, R.D.; Jiang, N.; Wu, S.X. A study on the spatial-temporal dynamic changes of land-use and driving forces analyses of China in the 1990s. Geogr. Res. 2003, 22, 1–12. [Google Scholar]
  59. Huang, J.; Lu, X.; Sellers, J. A global comparative analysis of urban form: Applying spatial metrics and remote sensing. Landsc. Urban Plan. 2007, 82, 184–197. [Google Scholar] [CrossRef]
  60. Bhatta, B. Analysis of urban growth pattern using remote sensing and GIS: A case study of Kolkata, India. Int. J. Remote Sens. 2009, 30, 4733–4746. [Google Scholar] [CrossRef]
  61. Dewan, A.M.; Corner, R.J. Spatiotemporal analysis of urban growth, sprawl and structure. In Dhaka Megacity; Springer: Dordrecht, The Netherlands, 2014; pp. 99–121. [Google Scholar]
  62. Acioly, C.; Davidson, F. Density in urban development. Build. Issues 1996, 8, 3–25. [Google Scholar]
  63. Liu, J.Y.; Wang, X.S.; Zhuang, D.F.; Zhang, W.; Hu, W.Y. Application of convex hull identifying the types of urban land expansion. Acta Grogr. Sin. 2003, 58, 885–892. [Google Scholar]
  64. Tan, M.; Li, X.; Xie, H.; Lu, C. Urban land expansion and arable land loss in China—A case study of Beijing–Tianjin–Hebei region. Land Use Policy 2005, 22, 187–196. [Google Scholar] [CrossRef]
  65. Zhang, L.; Weng, Q. Annual dynamics of impervious surface in the Pearl River Delta, China, from 1988 to 2013, using time series Landsat data. ISPRS J. Photogramm. Remote Sens. 2016, 113, 86–96. [Google Scholar] [CrossRef]
  66. Xie, Y.; Weng, Q. Updating urban extents with nighttime light imagery by using an object-based thresholding method. Remote Sens. Environ. 2016, 187, 1–13. [Google Scholar] [CrossRef]
Figure 1. The location of the 31 sample cities in China. Notes: The elevation levels of China was acquired from the Advanced Spaceborne Thermal Emission and Reflection Radiometer Global Digital Elevation Model (ASTER GDEM), ranging from −484 m to 8776 m in land area.
Remotesensing 08 00930 g001
Figure 2. Satellite images and central built-up areas of Beijing, monitored during the period from 1973 to 2013.
Remotesensing 08 00930 g002
Figure 3. Urban expansion process of Beijing from the 1970s to 2013.
Remotesensing 08 00930 g003
Figure 4. Pace of urban expansion in the 31 sample cities from the 1970s to 2013.
Remotesensing 08 00930 g004
Figure 5. Average urban expansion areas of the 31 sample cities from the 1970s to 2013.
Remotesensing 08 00930 g005
Figure 6. The composition of three urban expansion forms in the 31 sample cities from the 1970s to 2013.
Remotesensing 08 00930 g006
Figure 7. Temporal evolution of urban expansion forms in the 31 sample cities from the 1970s to 2013.
Remotesensing 08 00930 g007
Figure 8. Urban expansion rate by the three forms in the 31 sample cities in six periods: (a) edge-expansion form; (b) infilling form; (c) leapfrog form.
Remotesensing 08 00930 g008aRemotesensing 08 00930 g008b
Table 1. Urban expansion rates of three forms (unit: km2 per year).
Urban Expansion Form1970s–19871987–19951995–20002000–20052005–20102010–2013
Edge-expansion62.06207.00147.37508.09531.12482.30
Infilling17.5836.2568.32126.54199.85264.52
Leapfrog1.097.521.6936.2118.053.90

