
Post-Earthquake Damage Inspection of Wood-Frame Buildings by a Polarimetric GB-SAR System


Abstract
:
1. Introduction
2. Materials and Methods
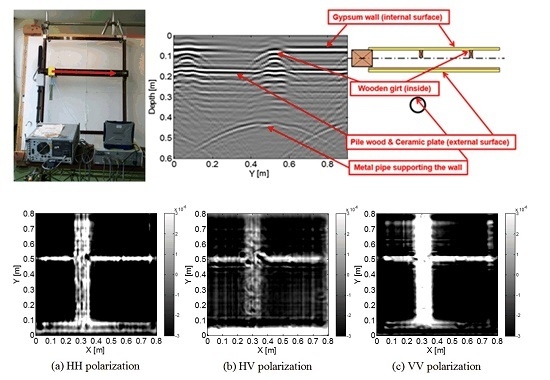
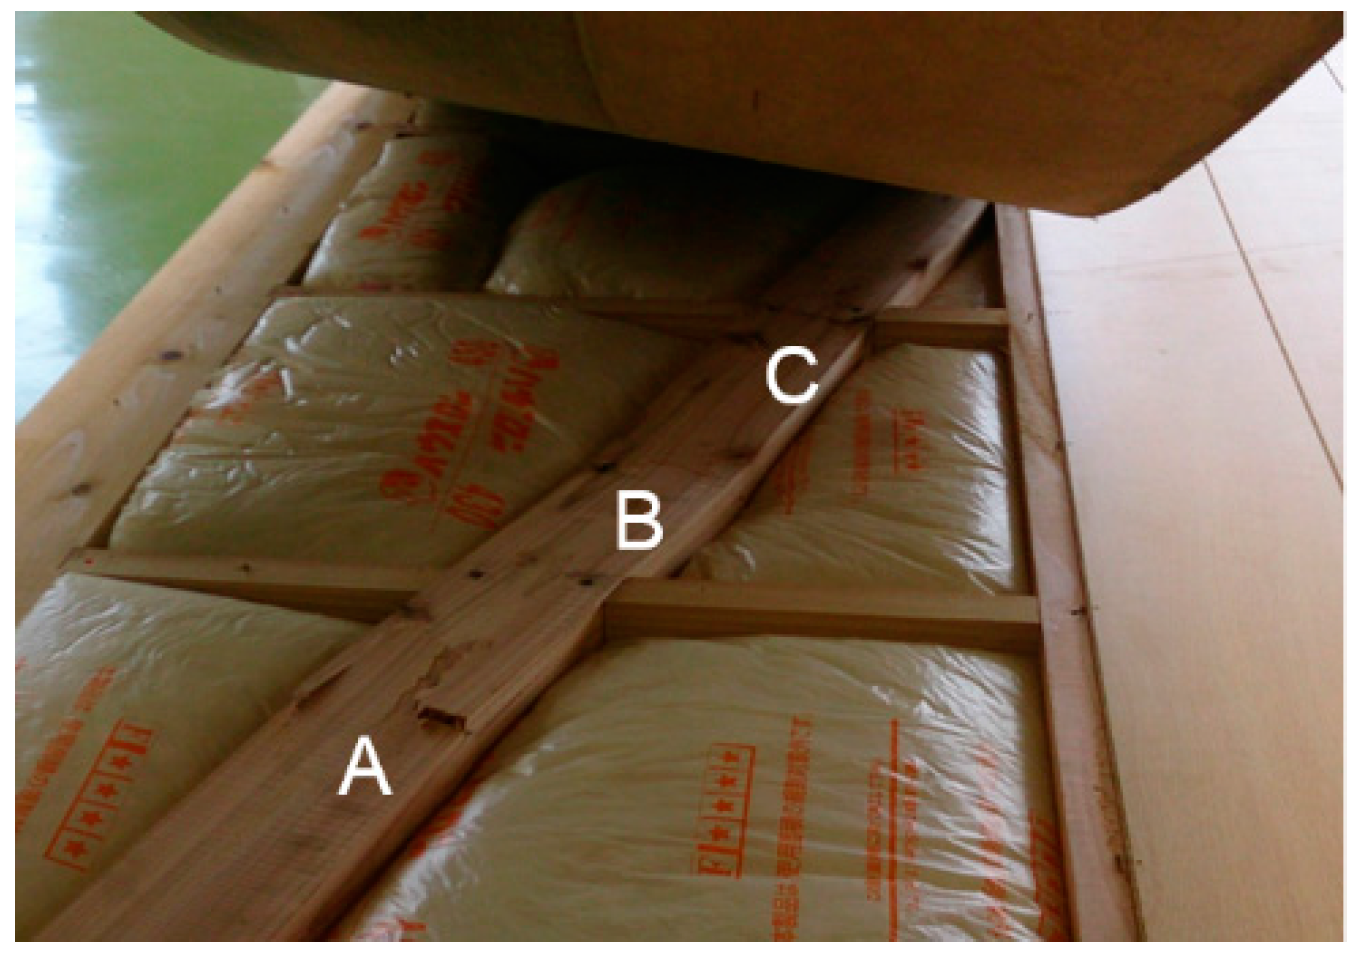
2.1. Wall Specimen of Damaged Wooden Structure
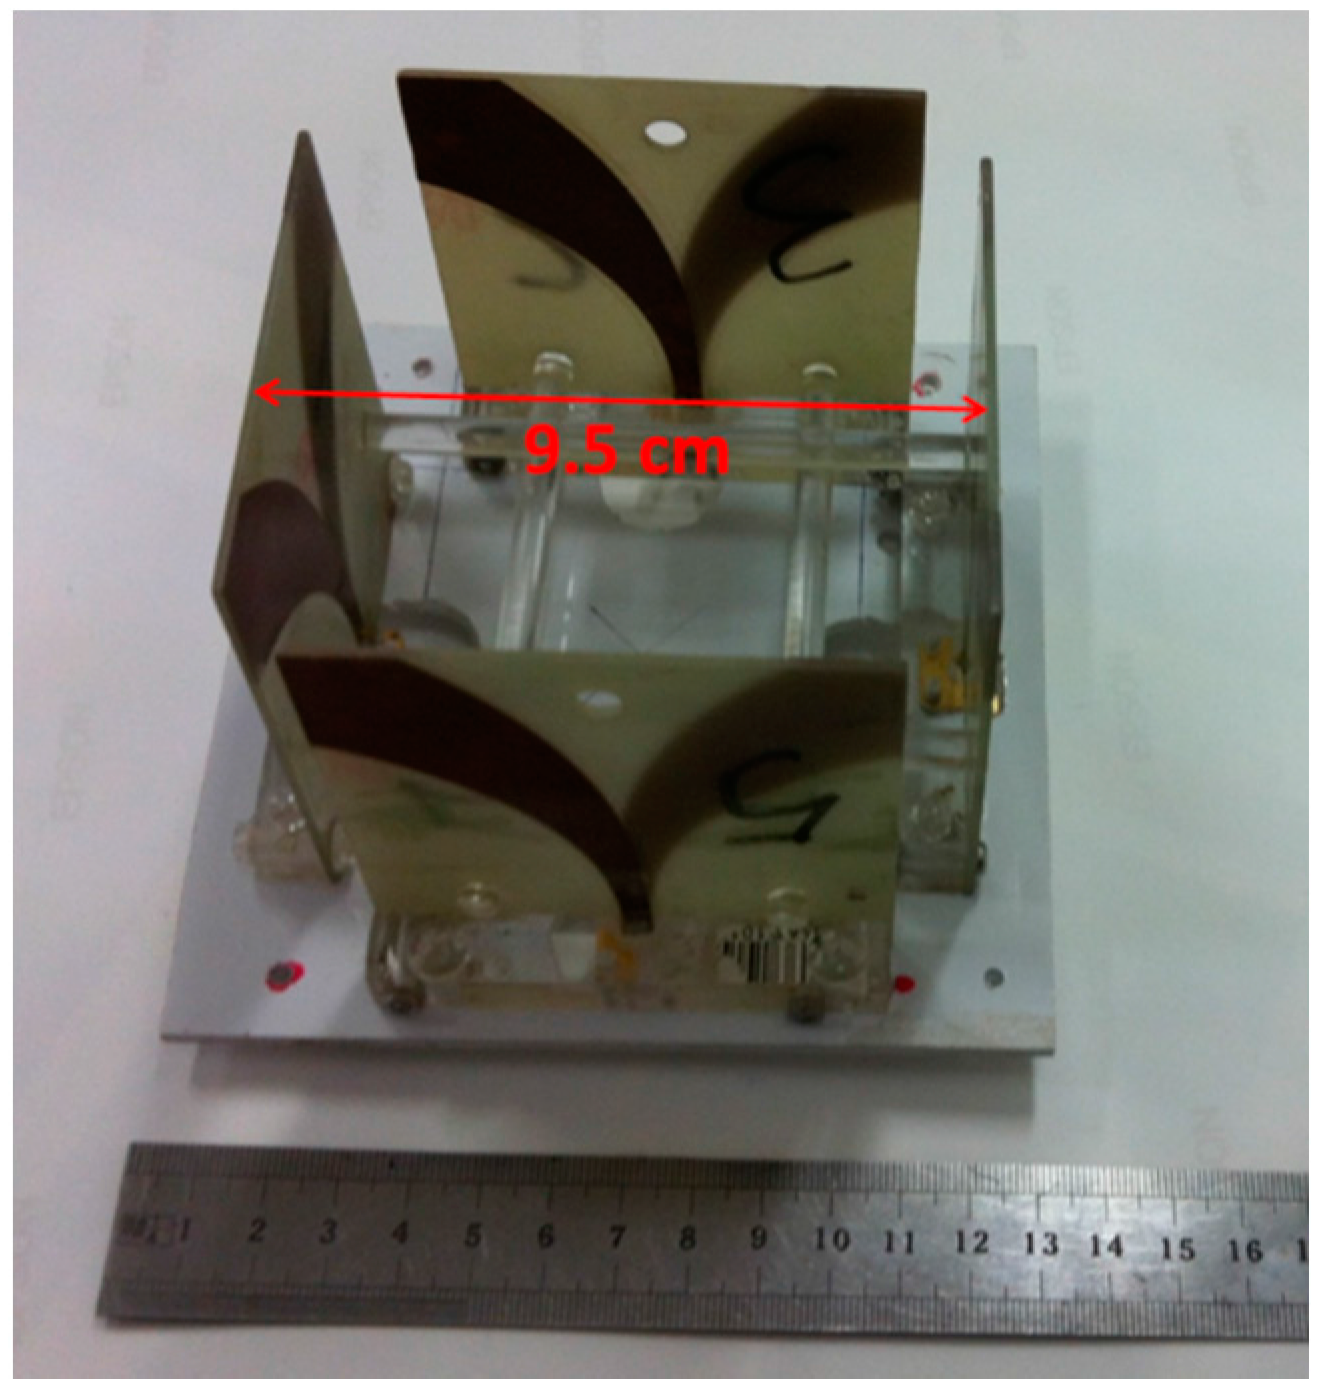
2.2. Polarimetric GB-SAR System
2.3. Signal Processing
2.3.1. Pulse Compression
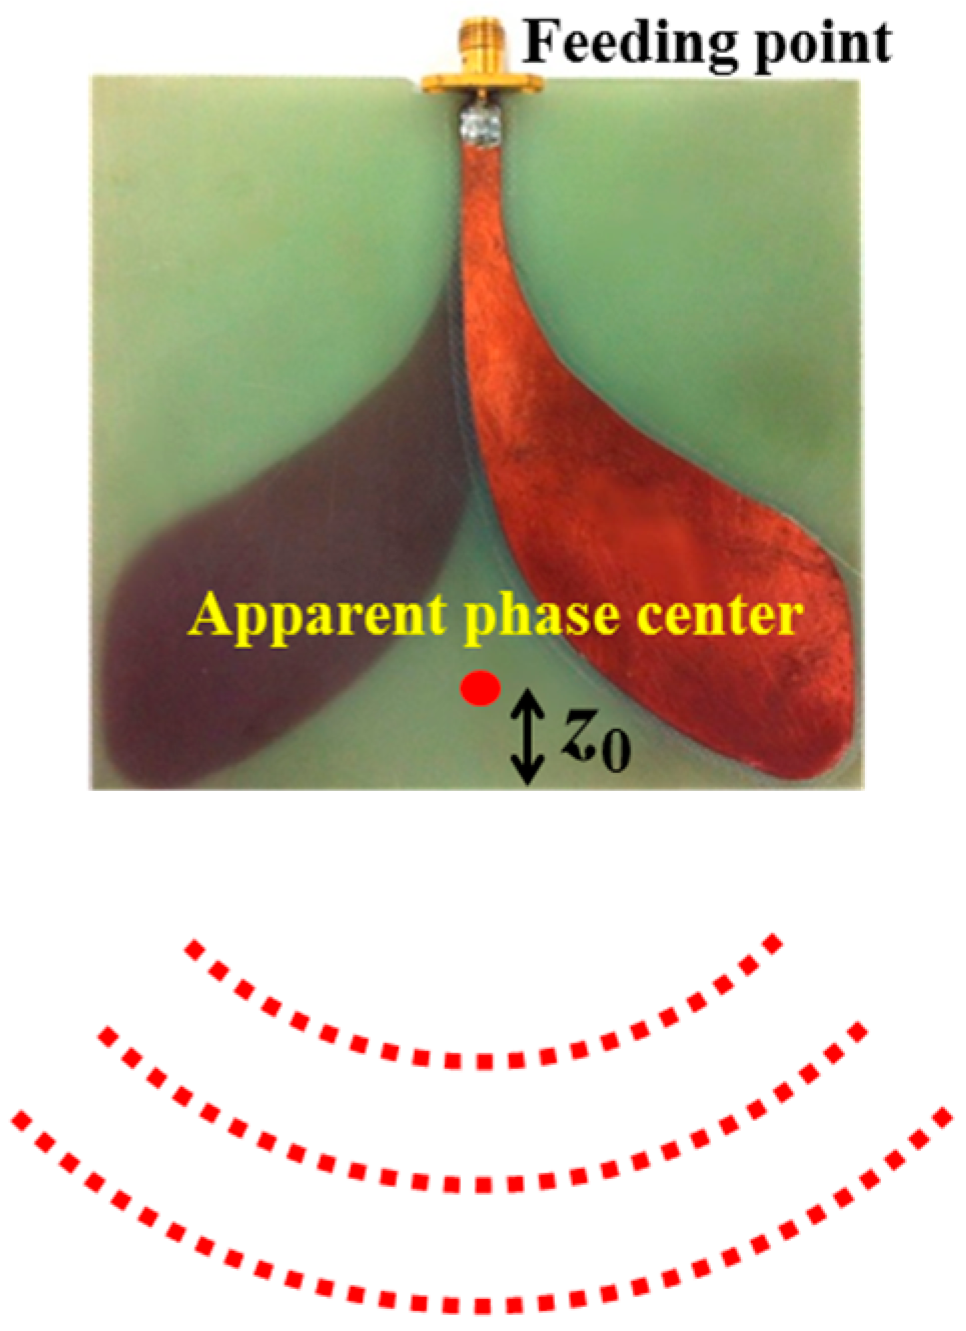
2.3.2. Antenna Phase Center Calibration
2.3.3. Bistatic SAR Processing
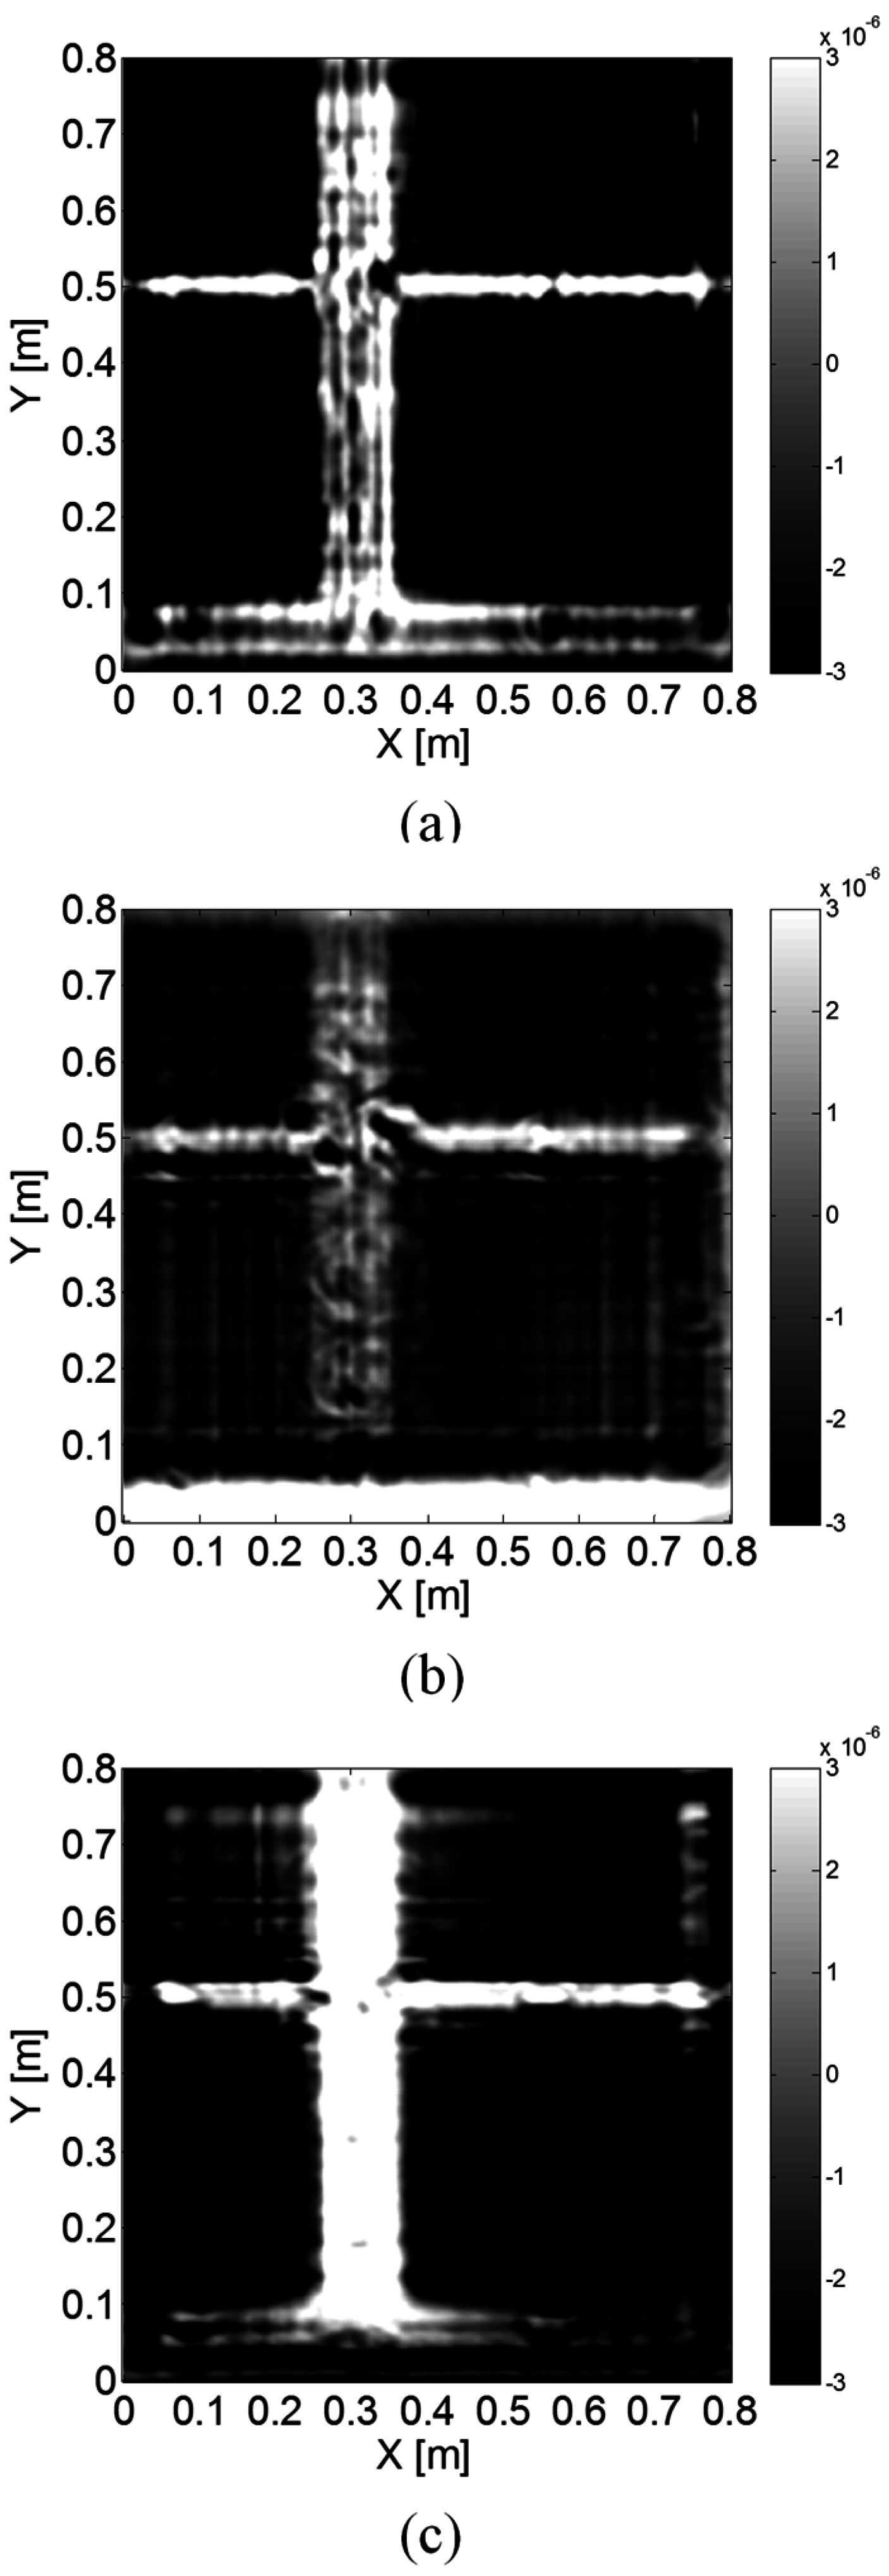
2.3.4. Polarimetric Imaging
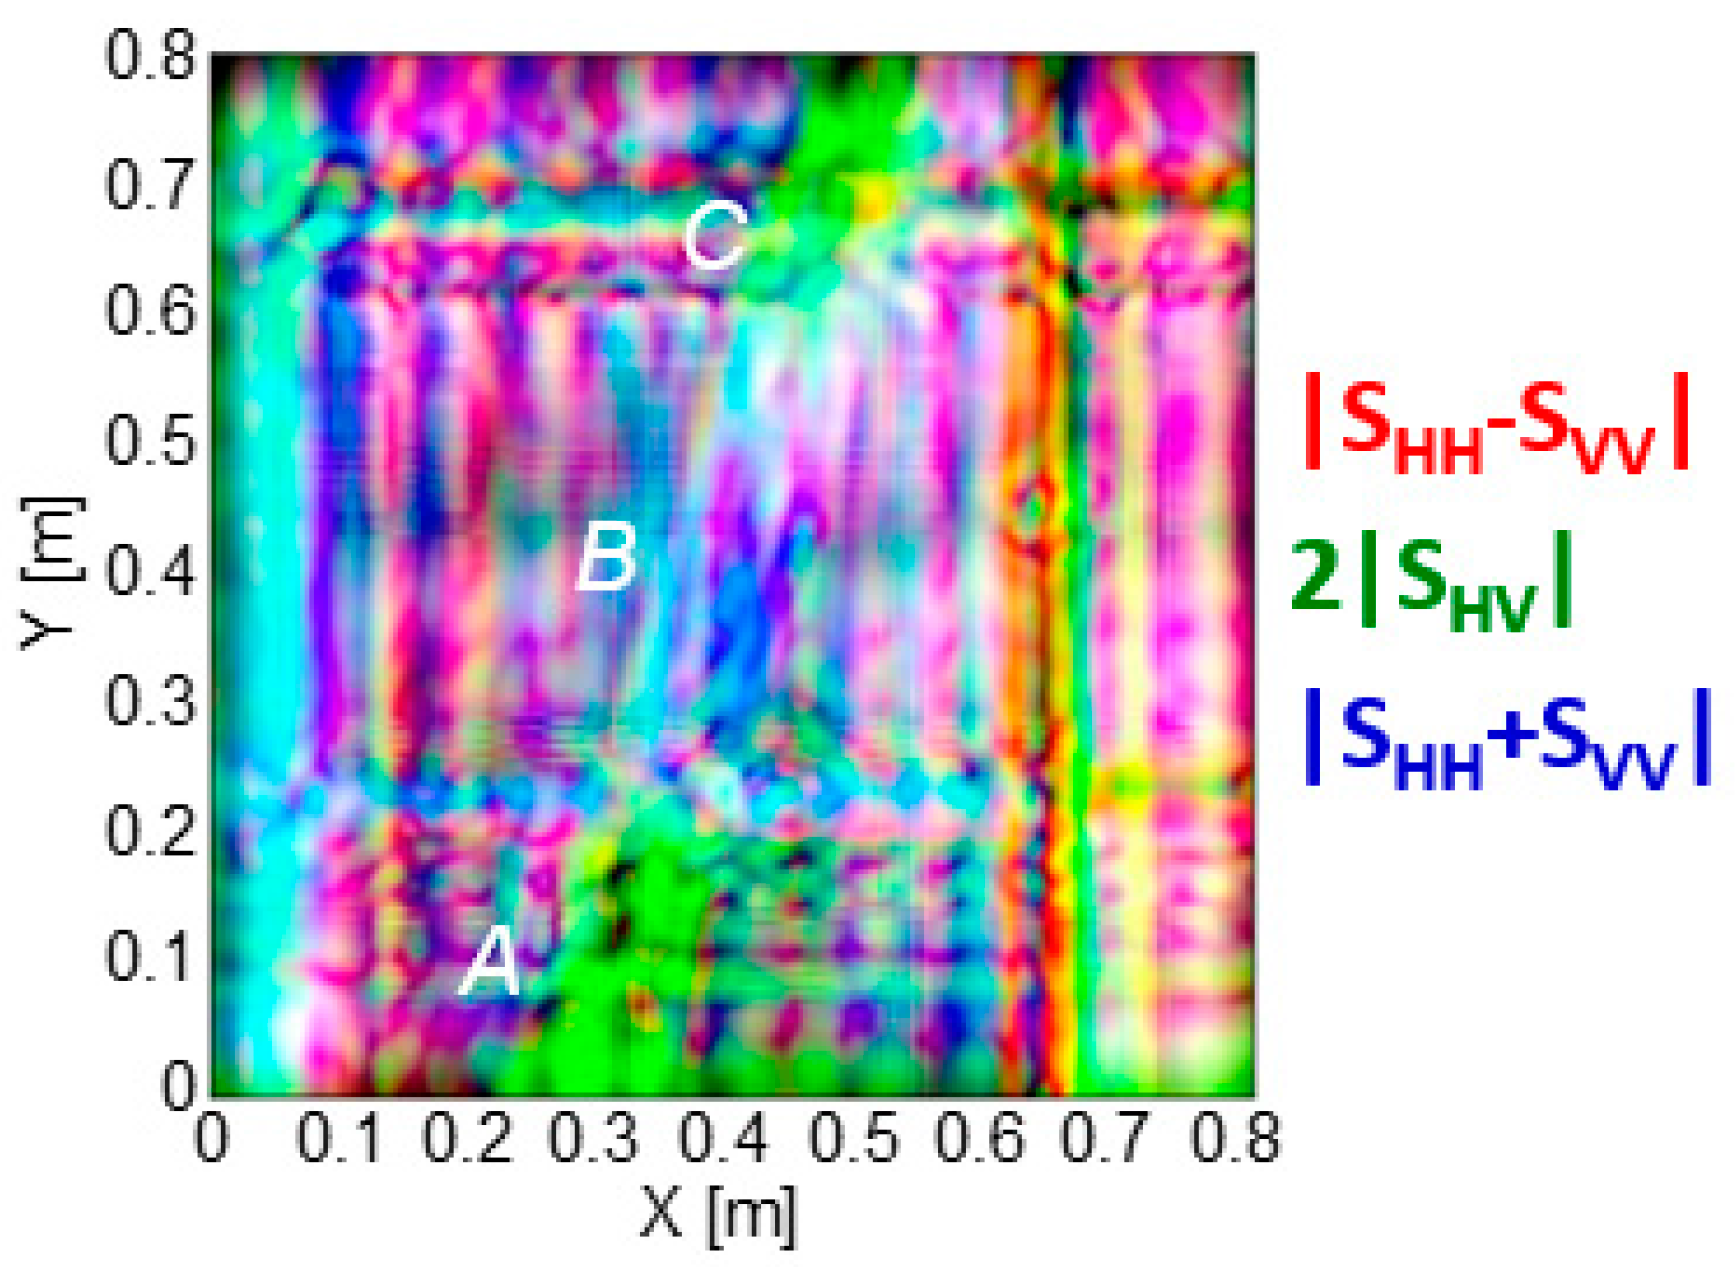
3. Results
3.1. Survey A
3.2. Survey B
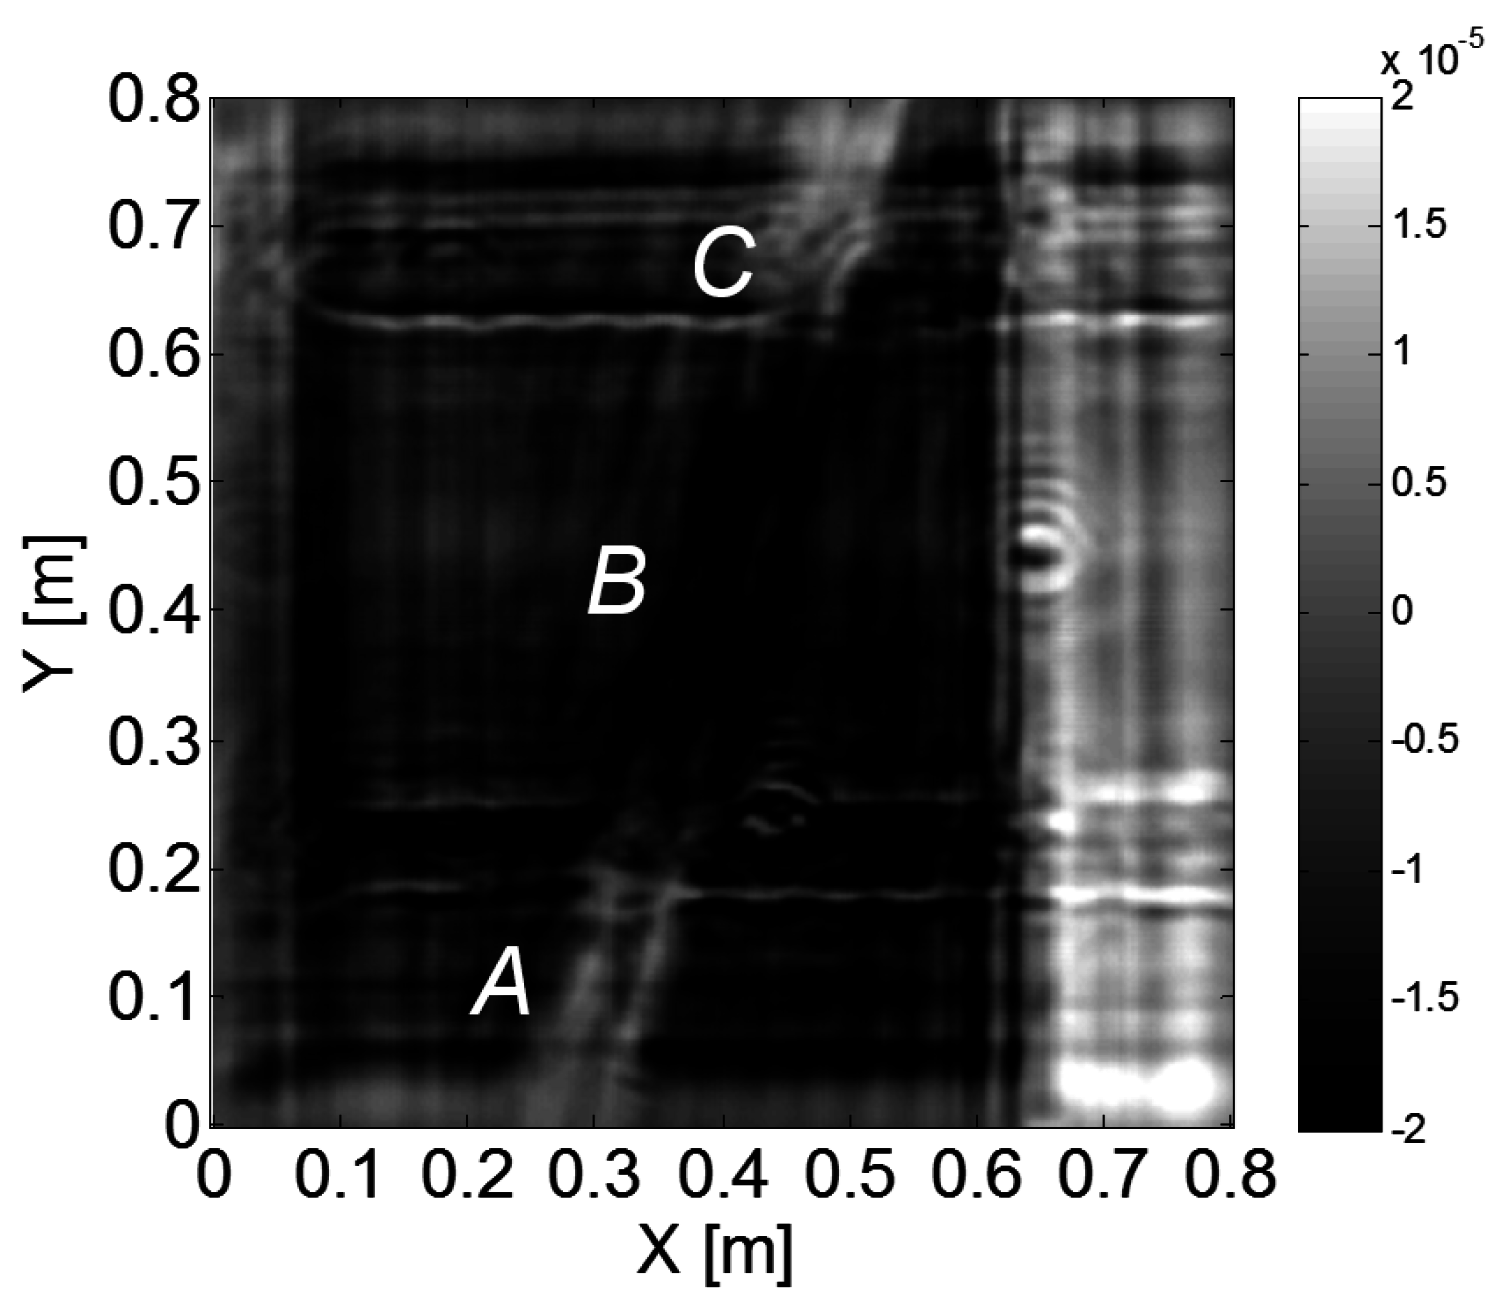
3.3. Survey C
4. Discussions
4.1. Strengths and Limitations of This Work
4.2. Feasibility and Further Improvements
5. Conclusions
Acknowledgments
Author Contributions
Conflicts of Interest
References
- Dong, L.; Shan, J. A comprehensive review of earthquake-induced building damage detection with remote sensing techniques. ISPRS J. Photogramm. Remote Sens. 2013, 84, 85–99. [Google Scholar] [CrossRef]
- Schweier, C.; Markus, M. Classification of collapsed buildings for fast damage and loss assessment. Bull. Earthq. Eng. 2006, 4, 177–192. [Google Scholar] [CrossRef]
- Vetrivel, A.; Gerke, M.; Kerle, N.; Vosselman, G. Identification of structurally damaged areas in airborne oblique images using a visual-bag-of-words approach. Remote Sens. 2016, 8, 231. [Google Scholar] [CrossRef]
- Sato, M.; Chen, S.-W.; Satake, M. Polarimetric SAR analysis of tsunami damage following the March 11, 2011 East Japan earthquake. Proc. IEEE 2012, 100, 2861–2875. [Google Scholar] [CrossRef]
- Zhai, W.; Shen, H.; Huang, C.; Pei, W. Building earthquake damage information extraction from a single post-earthquake PolSAR image. Remote Sens. 2016, 8, 171. [Google Scholar] [CrossRef]
- Meada, M.; Kang, D. Post-earthquake damage evaluation of RC buildings. J. Adv. Concr. Technol. 2009, 7, 327–335. [Google Scholar] [CrossRef]
- Consortium of Universities for Research in Earthquake Engineering. General Guidelines for the Assessment and Repair of Earthquake Damage in Residential Woodframe Buildings; CUREE: Richmond, CA, USA, 2010. [Google Scholar]
- Sousa, H.S.; Sørensen, J.D.; Kirkegaard, P.H.; Branco, J.M.; Lourenço, P.B. On the use of NDT data for reliability-based assessment of existing timber structures. Eng. Struct. 2013, 56, 298–311. [Google Scholar] [CrossRef] [Green Version]
- Santos-Assuncao, S.; Perez-Gracia, V.; Caselles, O.; Clapes, J.; Salinas, V. Assessment of complex masonry structures with GPR compared to other non-destructive testing studies. Remote Sens. 2014, 6, 8220–8237. [Google Scholar] [CrossRef]
- Suzuki, K.; Nagao, H. Deterioration diagnosis of wooden bridges by nondestructive testing method. Wood Preserv. 2005, 31, 12–19. [Google Scholar]
- Yanagida, H.; Tamura, Y.; Kim, K.-M.; Lee, J.J. Development of ultrasonic time-of-flight computed tomography for hard wood with anisotropic acoustic property. Janpanese J. Appl. Phys. 2007, 46, 5321–5325. [Google Scholar] [CrossRef]
- Suzuki, T.; Ohtsu, M. Damage estimation of concrete canal due to earthquake effects by acoustic emission method. Constr. Build. Mater. 2014, 67, 186–191. [Google Scholar] [CrossRef]
- Fujii, Y.; Fujiwara, Y.; Kigawa, R.; Suda, T.; Suzuki, Y. Characteristics and diagnosing technology of biodegradation in wooden historical buildings a case study on Amida-do in Higashi Hongan-ji Temple in Kyoto. In Proceedings of the World Conference on Timber Engineering (WCTE2010), Riva del Garda, Italy, 20–24 June 2010; pp. 19–24.
- Dogangun, A.; Tuluk, Ö.I.; Livaoglu, R.; Acar, R. Traditional wooden buildings and their damages during earthquakes in Turkey. Eng. Fail. Anal. 2006, 13, 981–996. [Google Scholar] [CrossRef]
- Ayoub, A. Seismic analysis of wood building structures. Eng. Struct. 2007, 29, 213–223. [Google Scholar] [CrossRef]
- Van de Lindt, J.W.; Gupta, R.; Pei, S.; Tachibana, K.; Araki, Y.; Rammer, D.; Isoda, H. Damage Assessment of a full-scale six-story wood-frame building following triaxial shake table tests. J. Perform. Constr. Facil. 2012, 26, 17–25. [Google Scholar] [CrossRef]
- Bucur, V. Techniques for high resolution imaging of wood structure : A review. Meas. Sci. Technol. 2003, 14, R91–R98. [Google Scholar] [CrossRef]
- Bucur, V. Nondestructive Characterization and Imaging of Wood; Springer: Berlin, Germany, 2003. [Google Scholar]
- Feng, X.; Yu, Y.; Liu, C.; Fehler, M. Combination of H-Alpha decomposition and migration for enhancing subsurface target classification of GPR. IEEE Trans. Geosci. Remote Sens. 2015, 53, 4852–4861. [Google Scholar] [CrossRef]
- Pieraccini, M.; Pisaneschi, M.; Noferini, L.; Atzeni, C. Polarimetric radar signature of masonry walls. NDT E Int. 2007, 40, 271–274. [Google Scholar] [CrossRef]
- Martínez-Sala, R.; Rodríguez-Abad, I.; Diez Barra, R.; Capuz-Lladró, R. Assessment of the dielectric anisotropy in timber using the nondestructive GPR technique. Constr. Build. Mater. 2013, 38, 903–911. [Google Scholar] [CrossRef]
- Balanis, C.A. Antenna Theory: Analysis and Design, 3rd ed.; Wiley-Interscience: New York, NY, USA, 2005. [Google Scholar]
- Gaballah, M.; Sato, M. A new approach to enhancement of ground penetrating radar target signals by pulse compression. Explor. Geophys. 2009, 40, 77–84. [Google Scholar] [CrossRef]
- Liu, H.; Sato, M. Determination of the phase center position and delay of a Vivaldi antenna. IEICE Electron. Express 2013, 10, 1–7. [Google Scholar] [CrossRef]
- Lee, J.-S.; Pottier, E. Polarimetric radar imaging: From basics to applications. In Optical Science and Engineering; CRC Press: Boca Raton, FL, USA, 2009. [Google Scholar]
- Moriyama, T.; Kasahara, H.; Yamaguchi, Y.; Yamada, H. Advanced polarimetric subsurface FM-CW radar. IEEE Trans. Geosci. Remote Sens. 1998, 36, 725–731. [Google Scholar] [CrossRef]
- Feng, X.; Zou, L.; Lu, Q.; Liu, C.; Liang, W.; Zhou, Z.-S. Calibration with high-order terms of polarimetric GPR. IEEE J. Sel. Top. Appl. Earth Obs. Remote Sens. 2012, 5, 717–722. [Google Scholar] [CrossRef]
- Núñez-Nieto, X.; Solla, M.; Novo, A.; Lorenzo, H. Three-dimensional ground-penetrating radar methodologies for the characterization and volumetric reconstruction of underground tunneling. Comput. Chem. Eng. 2014, 71, 551–560. [Google Scholar] [CrossRef]
- Diamanti, N.; Redman, D. Field observations and numerical models of GPR response from vertical pavement cracks. J. Appl. Geophys. 2012, 81, 106–116. [Google Scholar] [CrossRef]
- Liu, H.; Chen, J.; Zou, L.; Takahashi, K.; Sato, M. Development of an array GPR system for large-scale archaeological investigations. In Proceedings of the 11th SEGJ International Symposium, Yokohama, Japan, 18–21 November 2013; pp. 107–110.
- Liu, H.; Zhang, Y.; Qiu, C.; Han, F.; Liu, Q.H. Reverse-time migration and full waveform inverson applied to a stationary MIMO GPR system. In Proceedings of the 2016 International Geoscience and Remote Sensing Symposium (IGARSS2016), Beijing, China, 2016; pp. 1–4.
- Yamaguchi, Y.; Moriyama, T.; Ishido, M.; Yamada, H. Four-component scattering model for polarimetric SAR image decomposition. IEEE Trans. Geosci. Remote Sens. 2005, 43, 1699–1706. [Google Scholar] [CrossRef]


| Frequency Range | 1 GHz–20 GHz |
|---|---|
| Polarimetric Combination | HH/HV/VH/VV |
| Antenna Moving Step | 5 mm |
| Scan Area | 80 cm × 80 cm |
© 2016 by the authors; licensee MDPI, Basel, Switzerland. This article is an open access article distributed under the terms and conditions of the Creative Commons Attribution (CC-BY) license (http://creativecommons.org/licenses/by/4.0/).
Share and Cite
Liu, H.; Koyama, C.; Zhu, J.; Liu, Q.; Sato, M. Post-Earthquake Damage Inspection of Wood-Frame Buildings by a Polarimetric GB-SAR System. Remote Sens. 2016, 8, 935. https://doi.org/10.3390/rs8110935
Liu H, Koyama C, Zhu J, Liu Q, Sato M. Post-Earthquake Damage Inspection of Wood-Frame Buildings by a Polarimetric GB-SAR System. Remote Sensing. 2016; 8(11):935. https://doi.org/10.3390/rs8110935
Chicago/Turabian StyleLiu, Hai, Christian Koyama, Jinfeng Zhu, Qinghuo Liu, and Motoyuki Sato. 2016. "Post-Earthquake Damage Inspection of Wood-Frame Buildings by a Polarimetric GB-SAR System" Remote Sensing 8, no. 11: 935. https://doi.org/10.3390/rs8110935