Article

Climate-Induced Extreme Hydrologic Events in the Arctic

1
National Institute for Environmental Studies, 16-2 Onogawa, Tsukuba, Ibaraki 305-8506, Japan
2
Melnikov Permafrost Institute, SB RAS, 36 Merzlotnaya Str., Yakutsk 677010, Russia
3
Institute for Space-Earth Environmental Research, Nagoya University, Nagoya 464-8601, Japan
4
Graduate School of Environmental Studies, Nagoya University, Nagoya 464-8601, Japan
*
Author to whom correspondence should be addressed.
Remote Sens. 2016, 8(11), 971; https://doi.org/10.3390/rs8110971
Submission received: 30 August 2016 / Revised: 17 November 2016 / Accepted: 21 November 2016 / Published: 23 November 2016
(This article belongs to the Special Issue Remote Sensing of Land Degradation and Drivers of Change)

Abstract

:
The objectives were (i) to evaluate the relationship between recent climate change and extreme hydrological events and (ii) to characterize the behavior of hydrological events along the Alazeya River. The warming rate of air temperature observed at the meteorological station in Chersky was 0.0472 °C·year−1, and an extraordinary increase in air temperatures was observed in 2007. However, data from meteorological stations are somewhat limited in sparsely populated regions. Therefore, this study employed historical remote sensing data for supplementary information. The time-series analysis of the area-averaged Global Precipitation Climatology Project (GPCP) precipitation showed a positive trend because warming leads to an increase in the water vapor content in the atmosphere. In particular, heavy precipitation of 459 ± 113 mm was observed in 2006. On the other hand, the second-highest summer National Oceanic and Atmospheric Administration (NOAA) Advanced Very High Resolution radiometer (AVHRR) brightness temperature (BT) was observed in 2007 when the highest air temperature was observed in Chersky, and the anomaly from normal revealed that the summer AVHRR BTs showed mostly positive values. Conversely, riverbank, lakeshore and seashore areas were much cooler due to the formation, expansion and drainage of lakes and/or the increase in water level by heavy precipitation and melting of frozen ground. The large lake drainage resulted in a flood. Although the flooding was triggered by the thermal erosion along the riverbanks and lakeshores—itself induced by the heat wave in 2007—the increase in soil water content due to the heavy precipitation in 2006 appeared to contribute the magnitude of flood. The flood was characterized by the low streamflow velocity because the Kolyma Lowlands had a very gentle gradient. Therefore, the flood continued for a long time over large areas. Information based on remote sensing data gave basic insights for understanding the mechanism and behavior of climate-induced extreme hydrologic events.

Graphical Abstract

1. Introduction

Arctic regions are undergoing rapid warming due to the increase in greenhouse gas emissions from human activities [1]. The warming in the Arctic has altered the energy balance between land surface and atmosphere, resulting in widespread melting of snow and ice [2,3], as well as an increase in the frequency of cumulonimbus cloud formation and thunderstorm activity [4,5]. These changes have increased river discharge in the region [6], resulting in an increased probability of occurrence of extreme hydrological events, such as lake drainage and flood [7]. In fact, the economic costs associated with floods have continued to increase in recent decades in Siberia [8]. Moreover, most climate change scenarios indicate that more extreme hydrological events are expected in the future [1]. Consequently, assessing how climate change can increase the incidence of extreme hydrological events is becoming very important. However, the magnitude and type of such events depends on a variety of local factors, including climate (air temperature, precipitation, snow depth and snowfall duration) and geomorphology (basin size, location and topography). Without a knowledge of the underlying mechanisms and complex sequence of hydrological processes, risk mitigation strategies are not reliable.
Permafrost degradation is one of the specific consequences of changes in the Arctic climate, as warming leads to a reduction in the stability of permafrost [9,10,11]. Melting of ground ice in permafrost and deepening of active layer above permafrost strongly affects the surface water storage and river discharge [12,13]. Furthermore, the thawing of ice-rich permafrost results in the formation, expansion and drainage of lakes (termed thaw lakes or thermokarst lakes). Although lake dynamics have been common since the Holocene in ice-rich permafrost dominated lowlands [14,15], the changes in the size and number of lakes have been substantial over the last decades [16,17,18]. A number of studies have reported that the catastrophic lake drainage events termed by Mackay [19] are observed frequently in Canada and Alaska [9,18,19,20]. Such catastrophic lake drainage events often occur rapidly, in hours or days [16,18,19]. Therefore, drainage from lakes with large volumes of water can indeed be catastrophic. Consequently, settlements in lake-dominated regions are potentially at risk of flood. However, the mechanism controlling the catastrophic lake drainage is not fully understood, because many factors, such as precipitation [21], evapotranspiration [20], and thermal erosion by permafrost degradation [22,23], are intricately intertwined. A lack of long-term meteorological observation data in the Arctic makes it difficult to clarify the processes in response to climate change. Relatively few field-based studies have been conducted to reveal catastrophic lake drainage using meteorological station data and related information, such as water level and water temperature [16,24]. To this end, satellite remote sensing data, with its considerable spatial coverage and data archives, is considered to be well-suited for accurately clarifying the relationship between recent climate change and the catastrophic lake drainage. Satellite-derived meteorological data, such as land surface temperature (LST) and precipitation, have started to replace meteorological station data as inputs for climate models at regional to global scales [25]. Furthermore, remote sensing data can be used to detect the spatial extent of lake and river by measuring the difference in signal between water bodies and the surrounding land surface areas [16,18].
The objectives of this study are (i) to evaluate the relationship between recent climate change and extreme hydrologic events, such as lake drainage and flood; and (ii) to characterize the behavior of hydrologic events along the Alazeya River in far northeastern Siberia by using several formats of remote sensing data. Understanding and awareness of hazard risks under climate change are important to prepare sustainable hazard risk management. Specifically, two simple analyses were conducted to assess the effects of extreme hydrologic events caused by climate change. Trend analysis using satellite-derived meteorological data over thirty years was used to assess the long-term trends of climate change, and change detection analysis of land surface attributes was used to assess the spatio-temporal changes in lake and flood inundation.

2. Materials and Methods
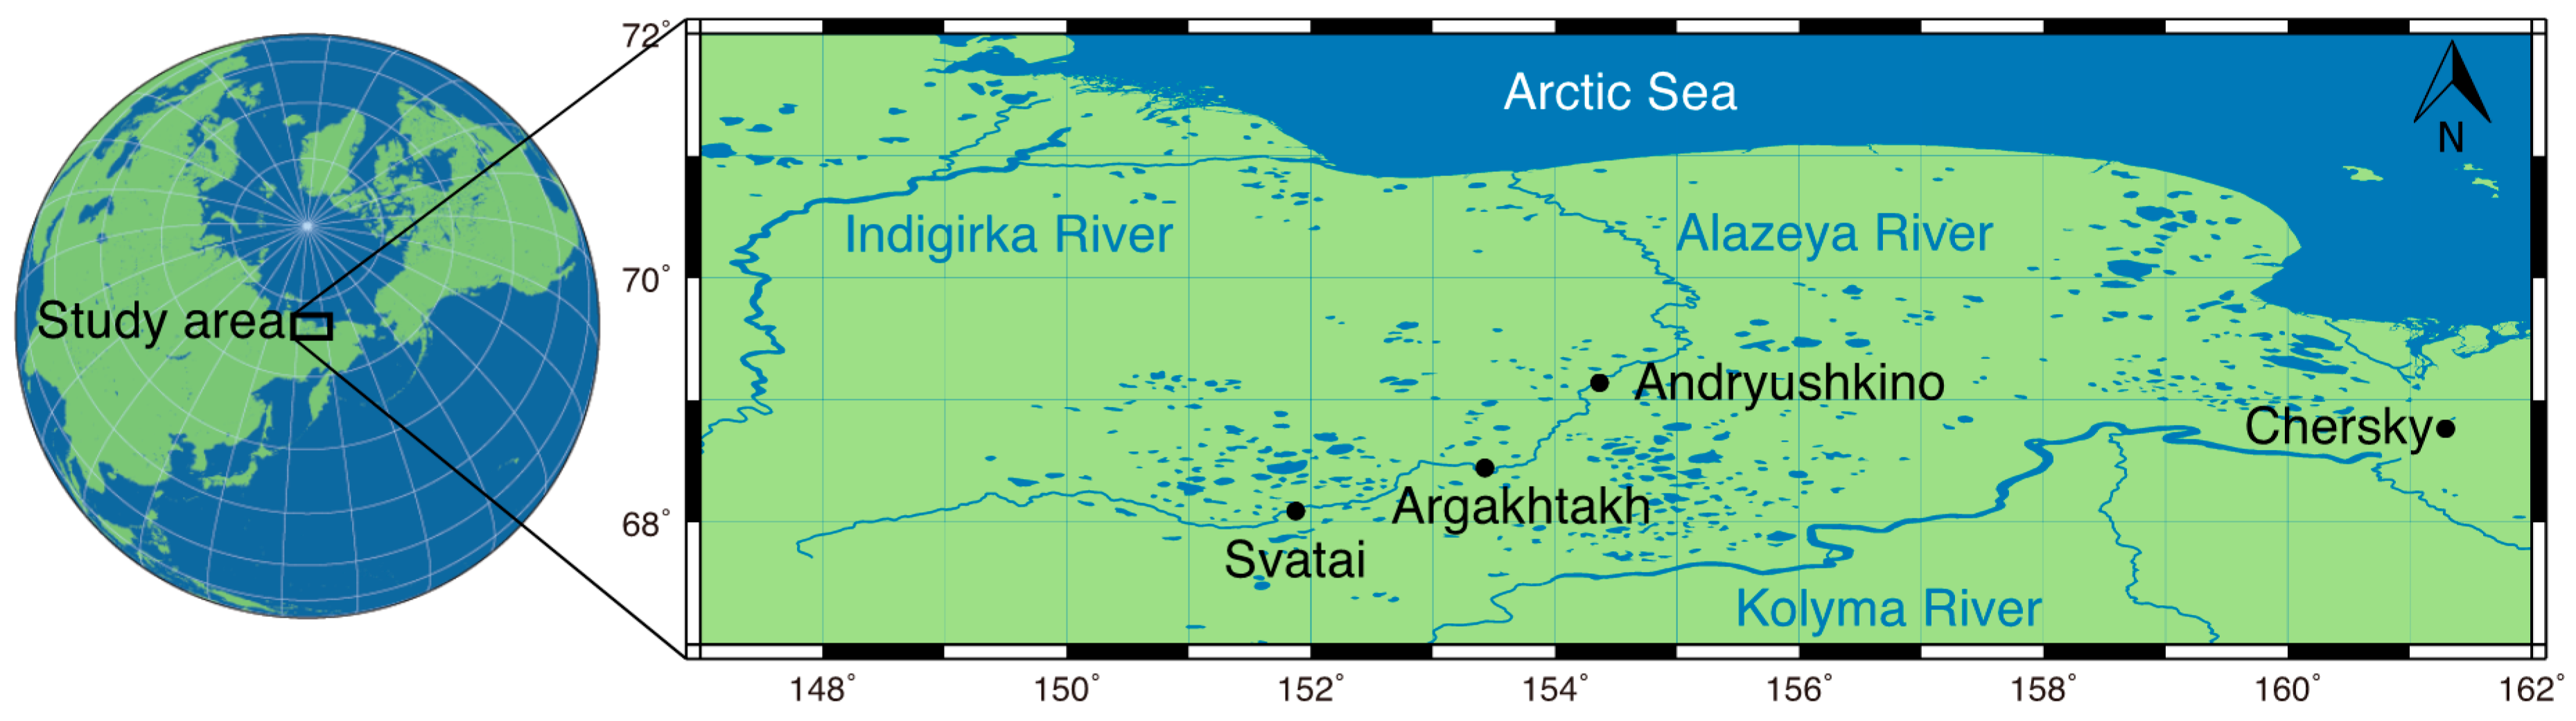
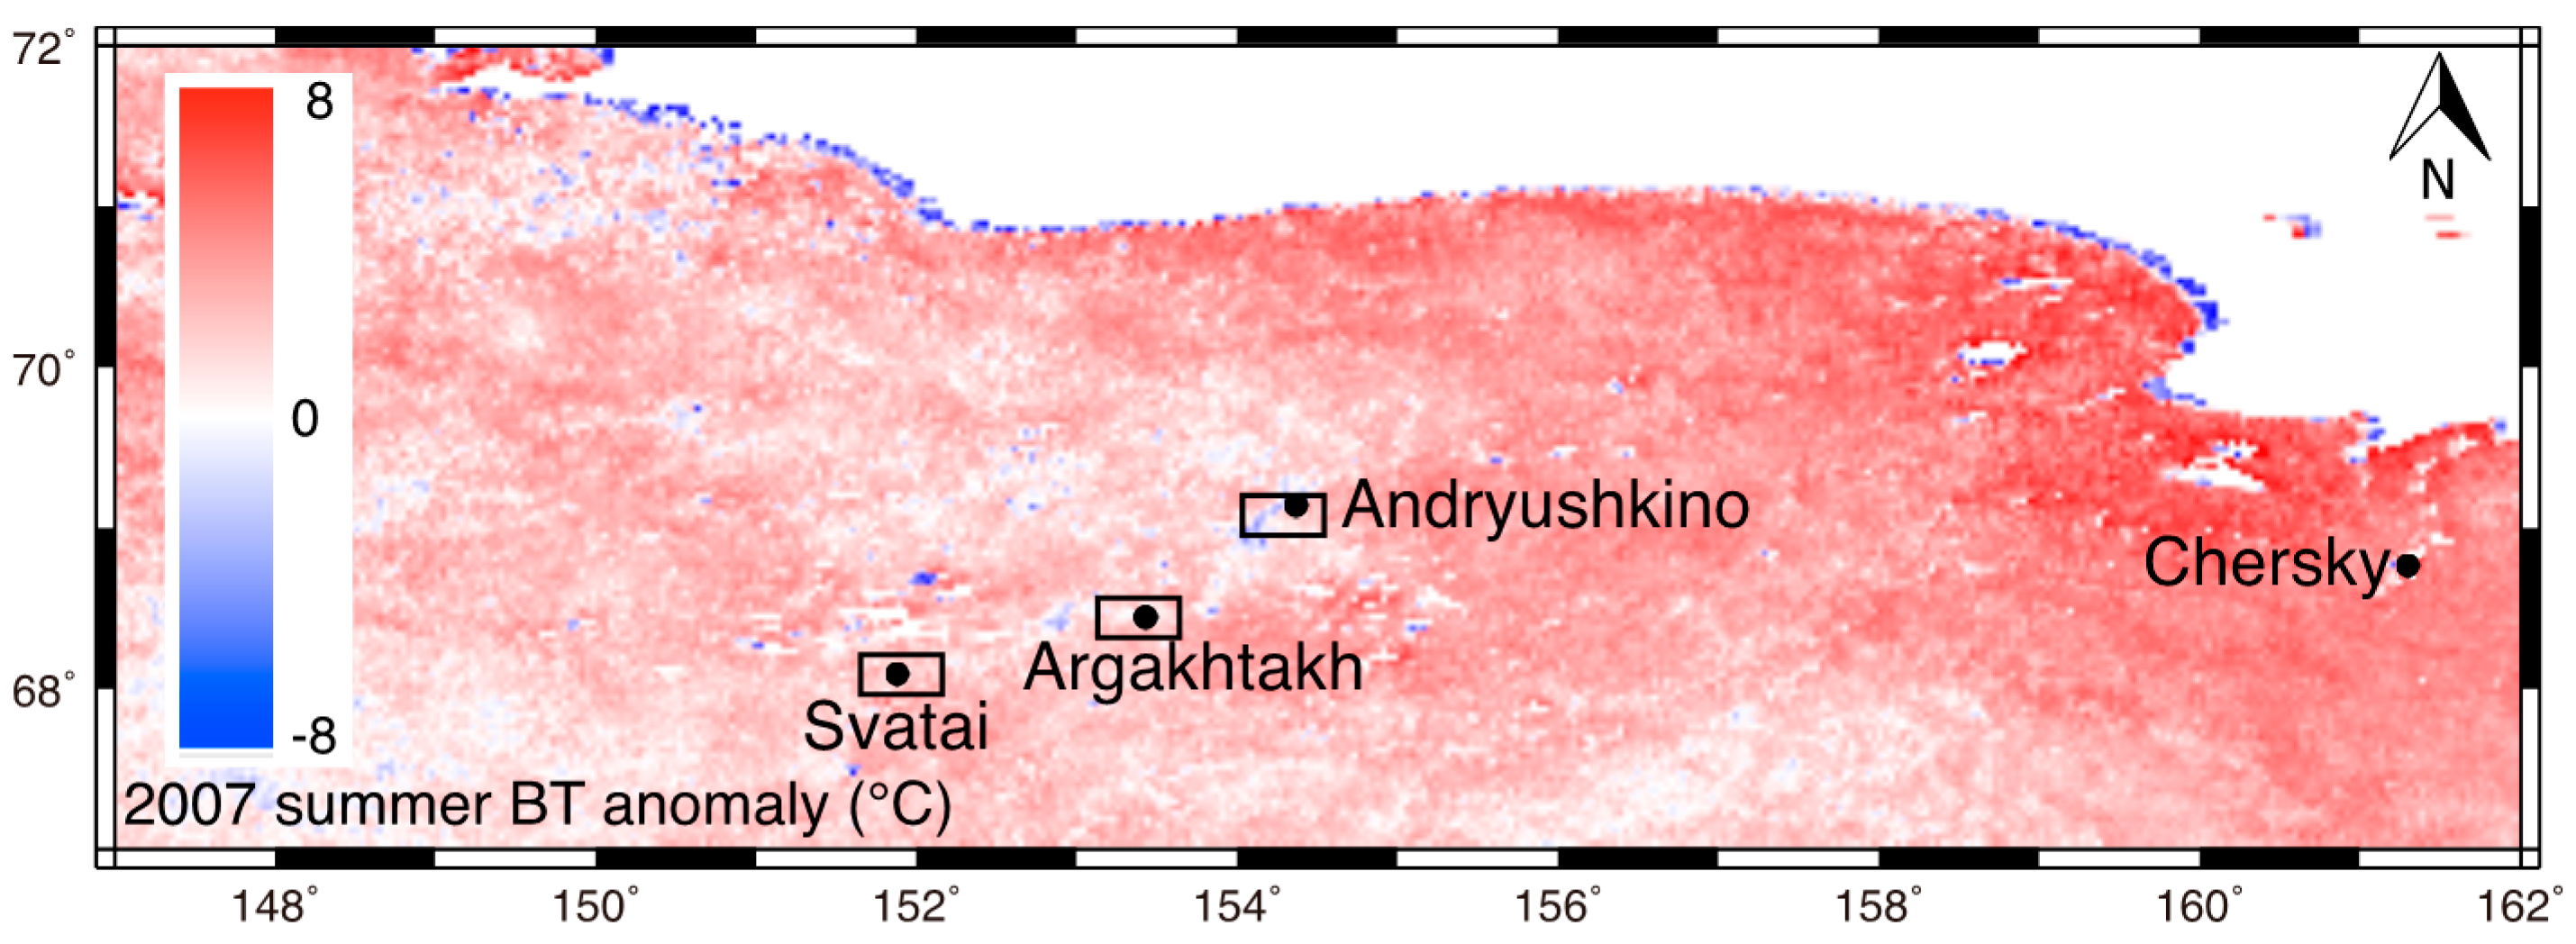
2.1. Study Area

The study area is located between 67°N and 72°N latitude and between 147°E and 162°E longitude in the Kolyma Lowlands (Figure 1). Permafrost in the region is continuous, with a thickness reaching up to 500 m and an active layer with a thickness ranging from 0.3 to 1 m [26]. The region is also characterized by having tens of thousands of alases and thermokarst lakes. The climate is strictly continental with extremely cool winters, fairly warm summers, and low amounts of precipitation. The landscape is almost flat without altitude, slope or aspect, and is characterized mainly by tundra vegetation with boreal larch forest.
The Alazeya River flows 1590 km northeast and then north before emptying into the Arctic Ocean. It is frozen from November to May and the discharge is mainly driven by snow melt, which peaks in May/June. To assess the potentially different effects of thermokarst dynamics in the region, three large villages, Svatai (68.06°N, 151.80°E, 32 m above sea level, asl), Argakhtakh (68.47°N, 153.36°E, 22 m asl) and Andryushkino (69.17°N, 154.50°E, 10 m asl) on the upper, middle and lower reaches of the Alazeya River, respectively, were considered in this study. Although the horizontal distance between Svatai in the upper river reaches and Andryushkino in the lower river reaches is approximately 170 km, the vertical distance is only 22 m.

2.2. Meteorological Station Data

Meteorological station data were obtained from the National Climatic Data Center (NCDC) database at the National Oceanic and Atmospheric Administration (NOAA). A total of 29,455 meteorological stations are distributed globally, but heterogeneously, closely reflecting the human activities, land cover types and climates. Metropolitan areas, such as those in the USA, Europe, eastern Australia, and Japan have sufficiently dense networks of meteorological stations. However, meteorological stations are sparsely distributed in rural areas with harsh climates, such as Siberia, Central Asia, South America and Africa. In this study, the area shown in Figure 1 was serviced by a total of fifteen meteorological stations. However, most of these meteorological stations were either relatively new or had stopped operating, and the only station that had collected data continuously for more ten years was the one in Chersky (68.75°N, 161.28°E, 28 m asl). The distance from Chersky to the center of three villages along the Alazeya River is approximately 330 km (Figure 1).
The database provides daily information for 18 meteorological parameters, including air temperature, wind speed, wind gust and amount of precipitation. Most of the meteorological station data goes back to the 1970s, with some going back to the 1930s and earlier. However, the data for some of the regions is incomplete due to interruptions caused by data restrictions and communication problems. In this study, daily mean air temperature in Chersky was extracted for the long-term trend analysis. Precipitation data often contained large gaps, so they were omitted from this analysis.

2.3. Trend Analysis by Using Satellite-Derived Meteorological Data

The polar-orbiting NOAA Advanced Very High Resolution Radiometer (AVHRR) satellite series has provided long-term time series data since 1981. Data is acquired twice-daily at 04:00 and 14:00 at a spatial resolution of 1.1 km. In this study, the brightness temperature (BT), estimated using the thermal infrared band (channel 4; 10.3–11.3 μm) of AVHRR was used as an alternative for LST. The composite BT data, which were smoothed weekly to minimize the effect of cloud contamination, were obtained from the NOAA National Environmental Satellite, Data, and Information Service (NESDIS). The LST can be directly calculated from BT by using a radiative transfer equation. However, the accuracy of this calculation degrades due to uncertainties in the soil moisture, the annual biophysical cycle of vegetation, and the appearance of snow and ice [27]. Thus, in this study, estimates of LST from BT were abandoned as knowledge of the surface parameters (emissivities of soil and vegetation) in the study area were considered insufficient. Moreover, the observation period of this study was confined to the summer months of June–September to avoid the effects of snow and ice. To calculate the trend line, linear regression analysis was performed using the area-average summer BT, which covers the terrestrial shown in Figure 1 (67°N–72°N, 147°E–162°E).
The Global Precipitation Climatology Project (GPCP; ver. 2.2) is a monthly precipitation dataset for the years 1979–2015 with a spatial resolution of 2.5° [28]. The GPCP product is derived by combining the precipitation gauge observations and multi-satellite-sensor estimations, taking advantage of the strengths of each data type. The precipitation gauge observations are based on the comprehensive precipitation database of the Global Precipitation Climatology Centre (GPCC). The microwave sensor estimations are based on Special Sensor Microwave/Imager (SSMI) and Special Sensor Microwave Imager/Sounder (SSMIS) from the series of Defense Meteorological Satellite Program (DMSP) satellites. The infrared-sensor estimates are primarily based on geosynchronous and low Earth-orbit satellites operated by NESDIS, the Japanese Meteorological Agency, and the European Organization for the Exploitation of Meteorological Satellites. Additional estimates are obtained based on Television and Infrared Observation Satellite (TIROS) Operational Vertical Sounder (TOVS), Advanced Infrared Sounder (AIRS), and Outgoing Long-wave Radiation (OLR) measurements. Similarly, a trend line was also calculated by using the area-averaged annual GPCP precipitation.

2.4. Change Detection Analysis of Land Surface Attributes

The Phased Array type L-band Synthetic Aperture Radar (PALSAR) was used to monitor the spatio-temporal changes in the area of flood inundation (water body area). L-band SAR can be used under any weather conditions and at any time of the day or night. PALSAR data consists of multiple observation modes with variable polarization, resolution, swath width and off-nadir angle. The fine resolution mode gives approximately 10 m of spatial resolution in both range and azimuth (70 km of swath width). The ScanSAR mode offers more than 250 km width of SAR images at the spatial resolution of 100 m. Ortho-rectified HH (horizontal transmitting, horizontal receiving) polarized PALSAR data were collected for areas measuring 20 km × 20 km around the three villages in the study area (Svatai, Argahtah and Andryushkino) along the Alazeya River from 2006 to 2009 from the Global Earth Observation Grid (GEO Grid) database under National Institute of Advanced Industrial Science and Technology (AIST). The decision-tree classification method was selected to separate water bodies from other classes, because it is a simple but efficient algorithm. Target classes were separated by learning simple decision rules inferred from the data features. There were two peaks in the histogram of the backscattering coefficient. The first peak corresponded to water bodies, and the second peak corresponded to other classes. In this study, the minimum values between two peaks were defined as decision boundaries (or threshold values).

3. Results

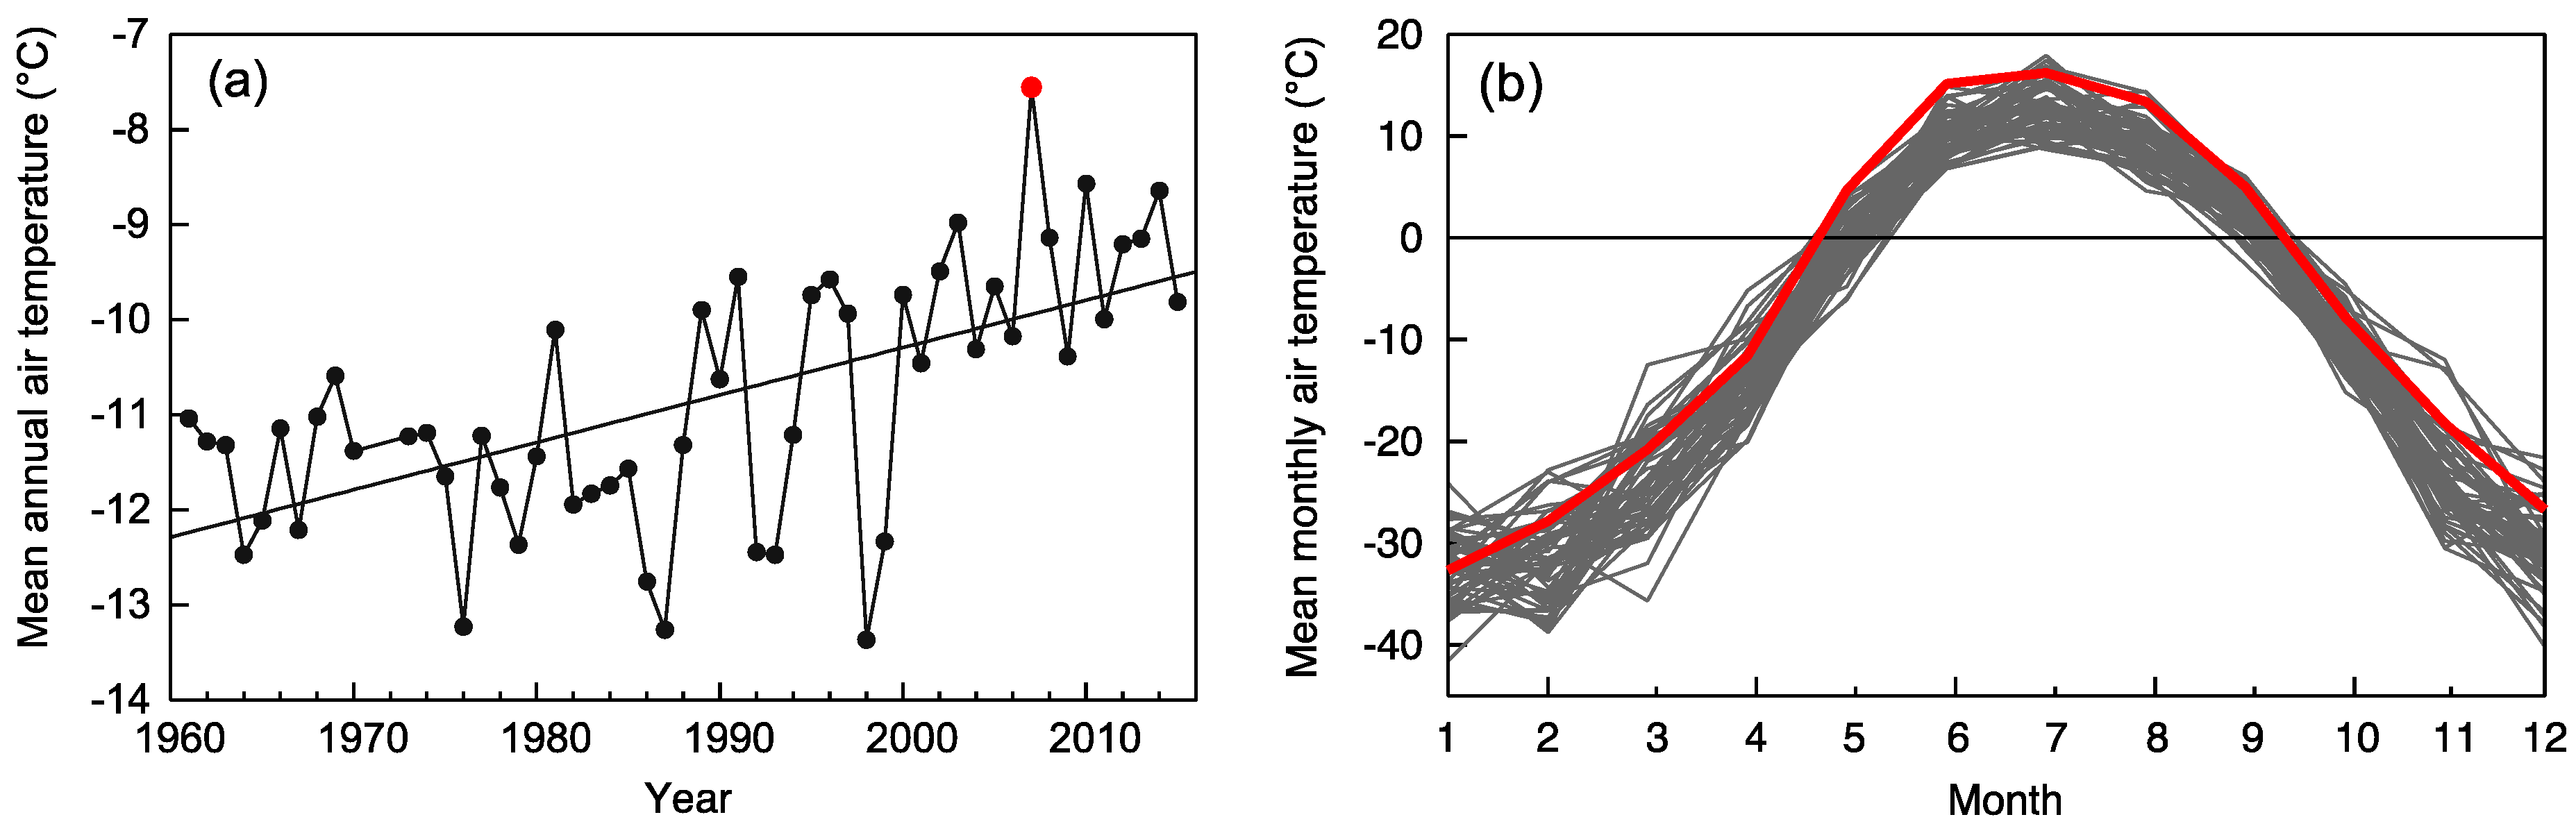
3.1. Meteorological Station Data in Chersky

Figure 2 shows the changes in air temperature recorded by the Chersky meteorological station from 1960 to 2015. Mean annual air temperature increased gradually from −12 °C in the 1960s to −10 °C in the 2000s, with a marked increase observed in year-on-year variation (Figure 2a). In addition, a positive trend of 0.0472 °C·year−1 was observed during the last half century. The highest mean annual air temperature of −7.56 °C was observed in 2007. The air temperature in 2007 was constantly high throughout the year (Figure 2b). It was higher than 10 °C in summer (June–August), and it was around −30 °C in winter (December–February). Moreover, the longest period with air temperature greater than freezing point (>0 °C) was 144 days in 2007; and the average number for the years 1960 to 2015 was 129 days.
Although most of the meteorological stations in the study area had precipitation data records, these data were not used in this study as a large amount of precipitation data was missing. It meant that the annual precipitation could not be calculated.

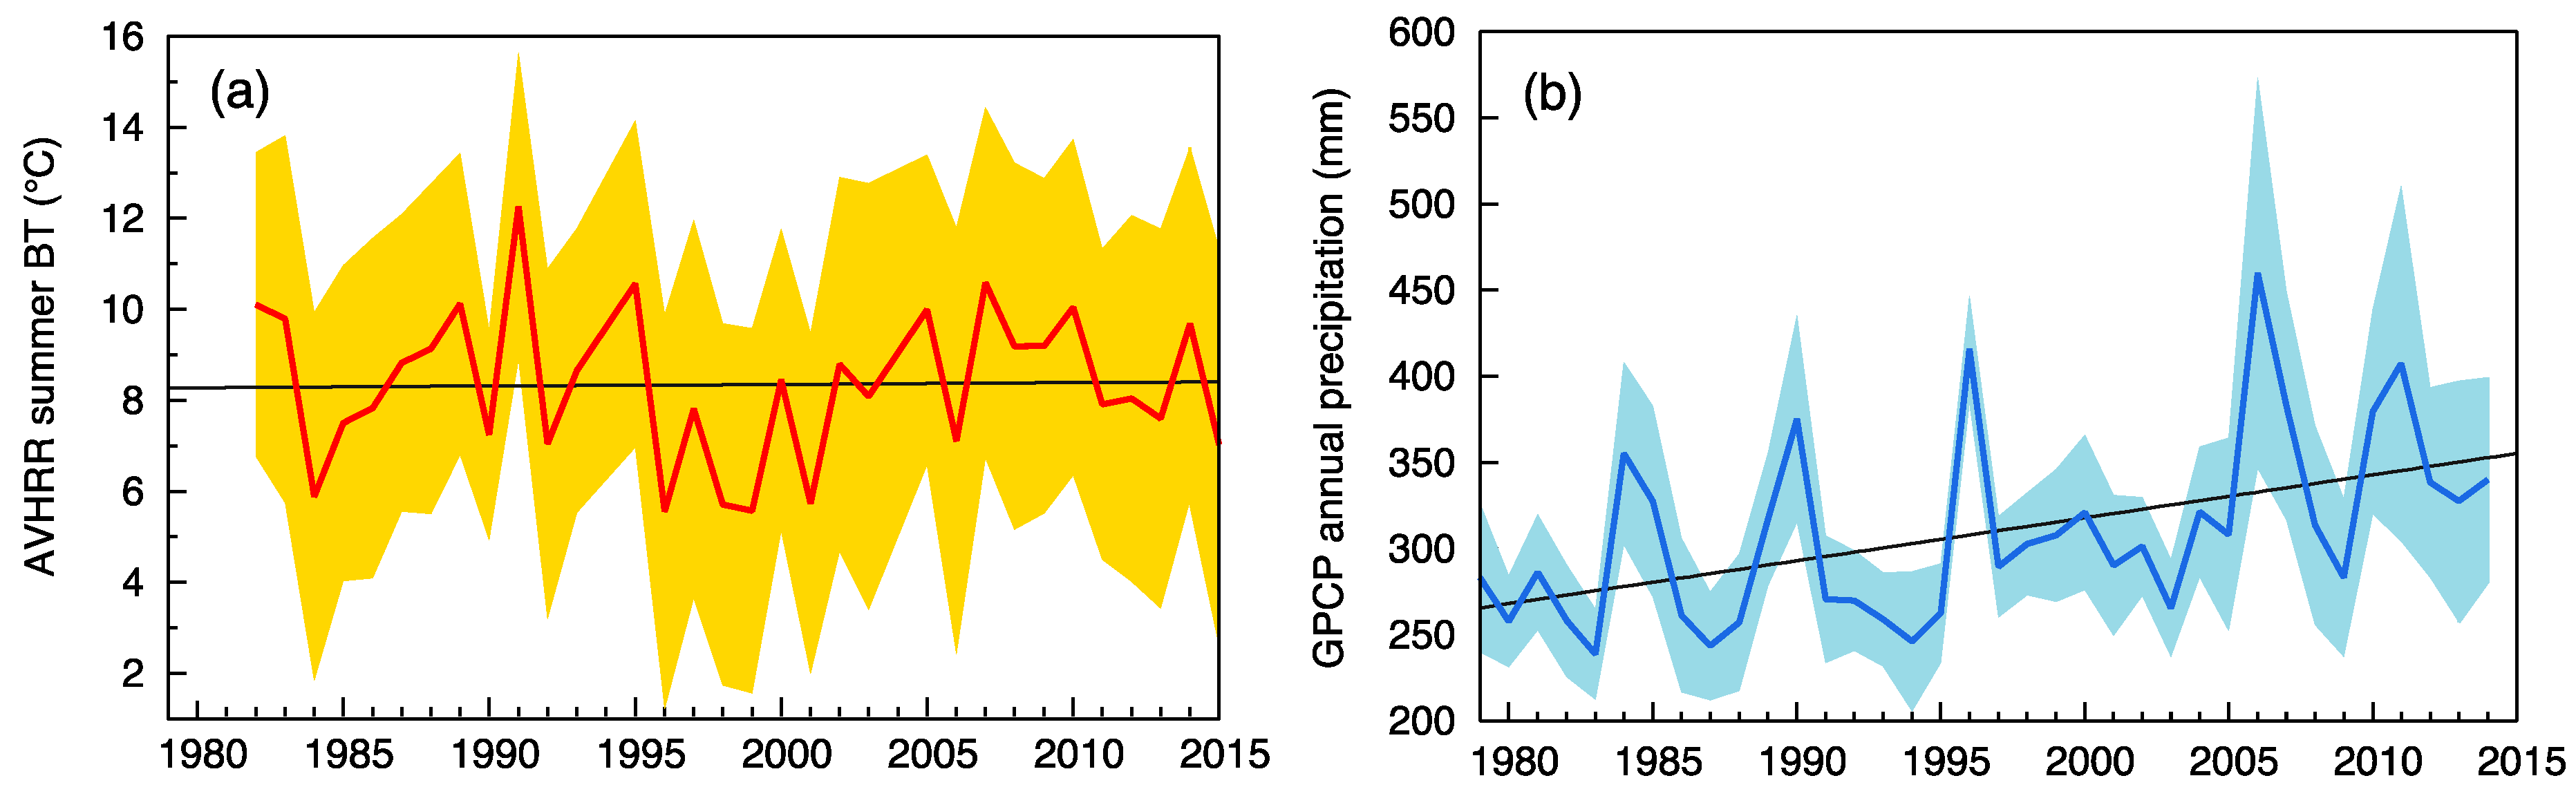
3.2. Satellite-Derived Meteorological Data for the Kolyma Lowlands

The existence of long-term records of satellite-derived AVHRR BT and GPCP precipitation data meant that the area-averaged AVHRR BT and GPCP precipitation data could be calculated, and consequently, that spatially representative warming trends in the Kolyma Lowlands could be identified (Figure 3). Time-series analysis of AVHRR BT data for the summer period of June–September did not show a clear trend. Specifically, the area-averaged summer AVHRR BT was constant in each year around 8.2 °C (Figure 3a). However, the summer AVHRR BT exhibited considerable variability. The summer AVHRR BT mainly varied depending on latitudinal gradient. The summer AVHRR BT was lower at higher latitudes. In addition, there were large differences in the summer AVHRR BT between land surface and water surface. The summer AVHRR BT on the water surface was much lower than that on the land surface, ranging from 0 °C to 8 °C.
Figure 4 shows the anomaly map of summer AVHRR BT in 2007 when the highest mean annual air temperature was observed in Chersky (Figure 2a) with respect to the 1982–2015 baseline. While the anomaly of the summer AVHRR BT in 2007 was positive over a wide area, small patches with large negative value were frequently observed near riverbanks, lakeshores and seashores where land cover transitioned from land to a water body due to the formation, expansion and drainage of thermokarst lake and/or the increase in water level by heavy precipitation and melting of frozen ground.
The time-series analysis of annual GPCP precipitation data showed a positive trend (Figure 3b). Annual GPCP precipitation was typically low due to the continental climate, ranging from 250 to 300 mm. However, precipitation exceeding 350 mm was frequently observed at 5- to 10-year time intervals and the magnitude and frequency of heavy precipitation tended to increase over time. The highest annual GPCP precipitation, at 459 ± 113 mm (average ± standard deviation), was observed in 2006, and the highest air temperature was observed in the following year (i.e., 2007) in Chersky (Figure 2a).

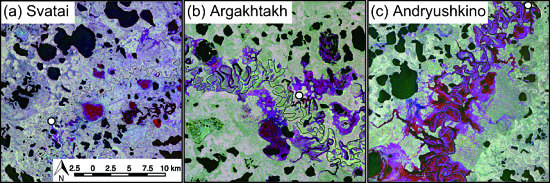
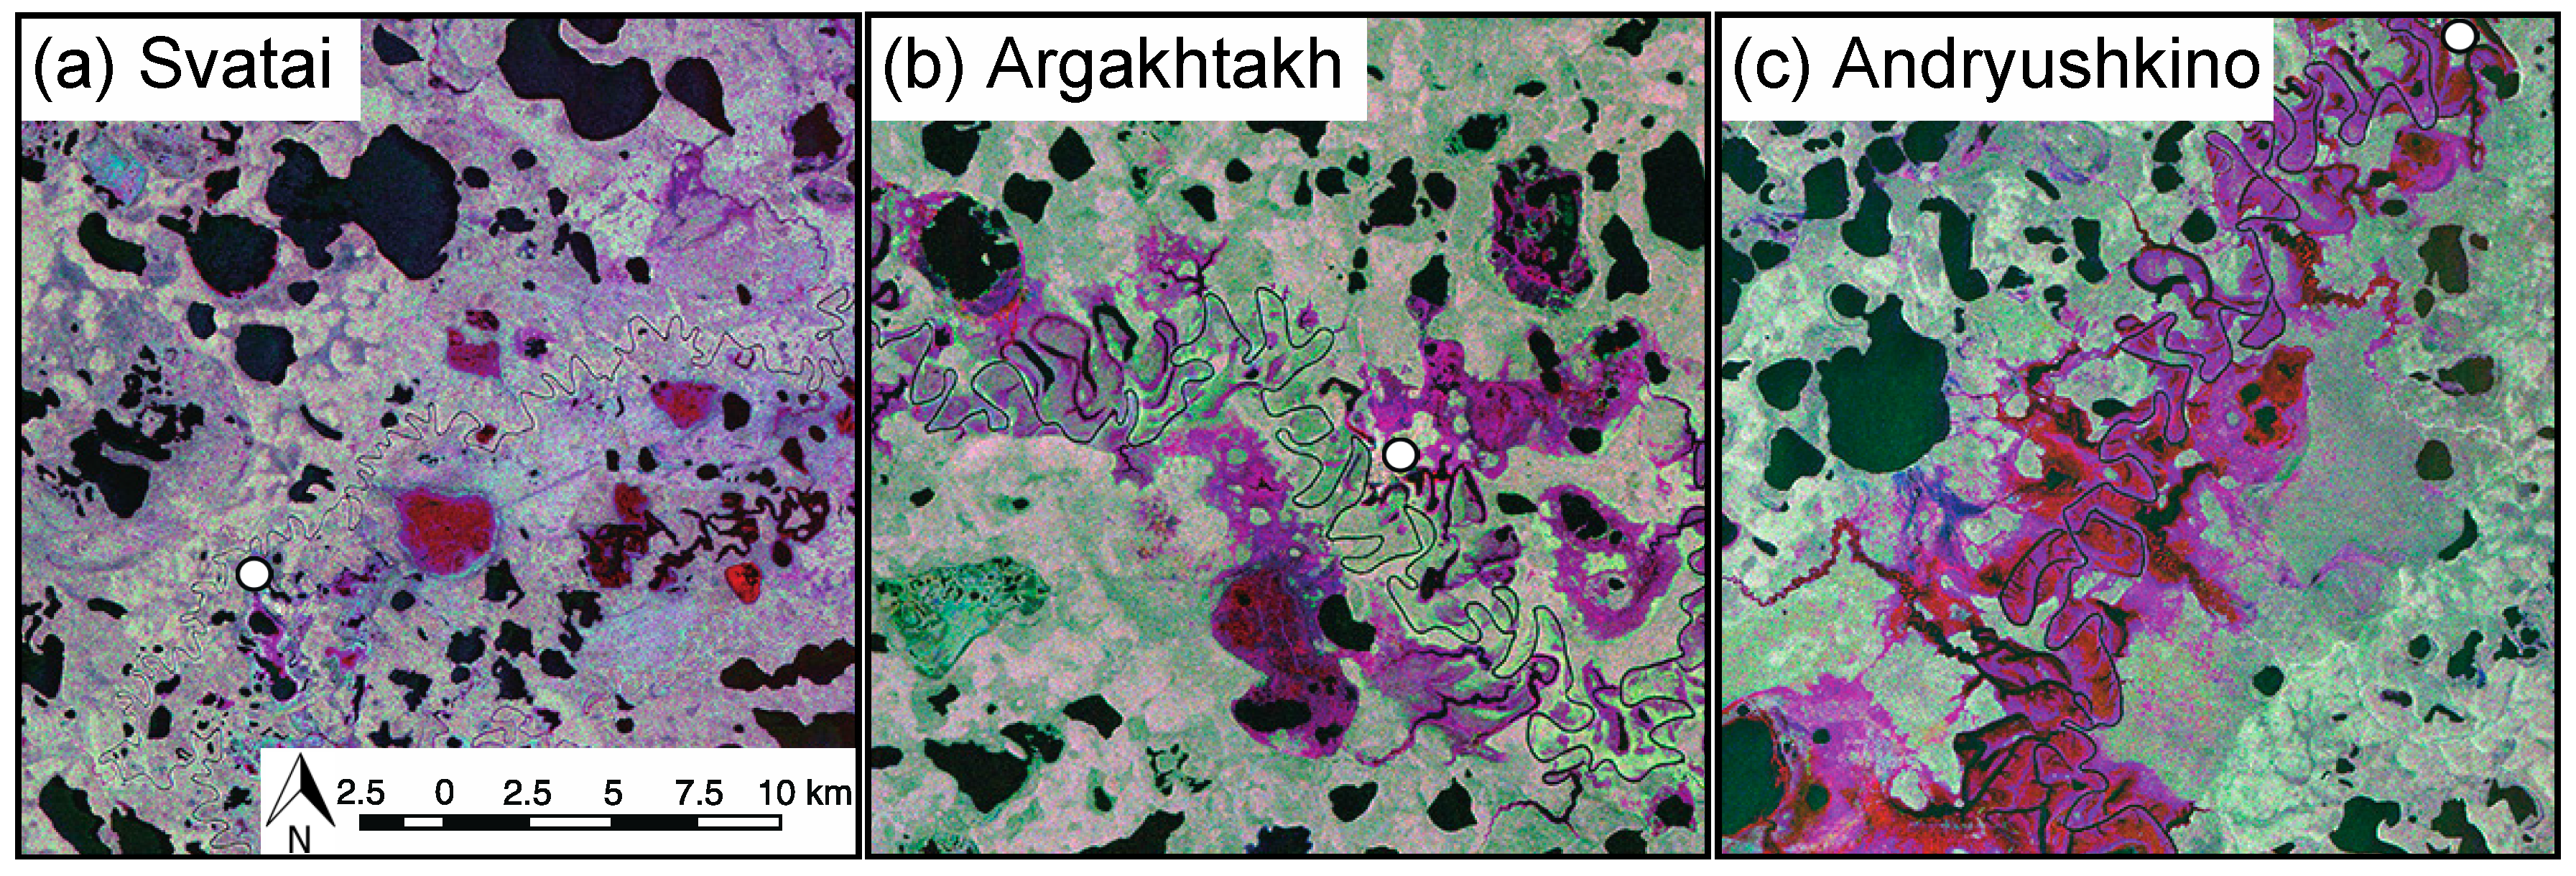
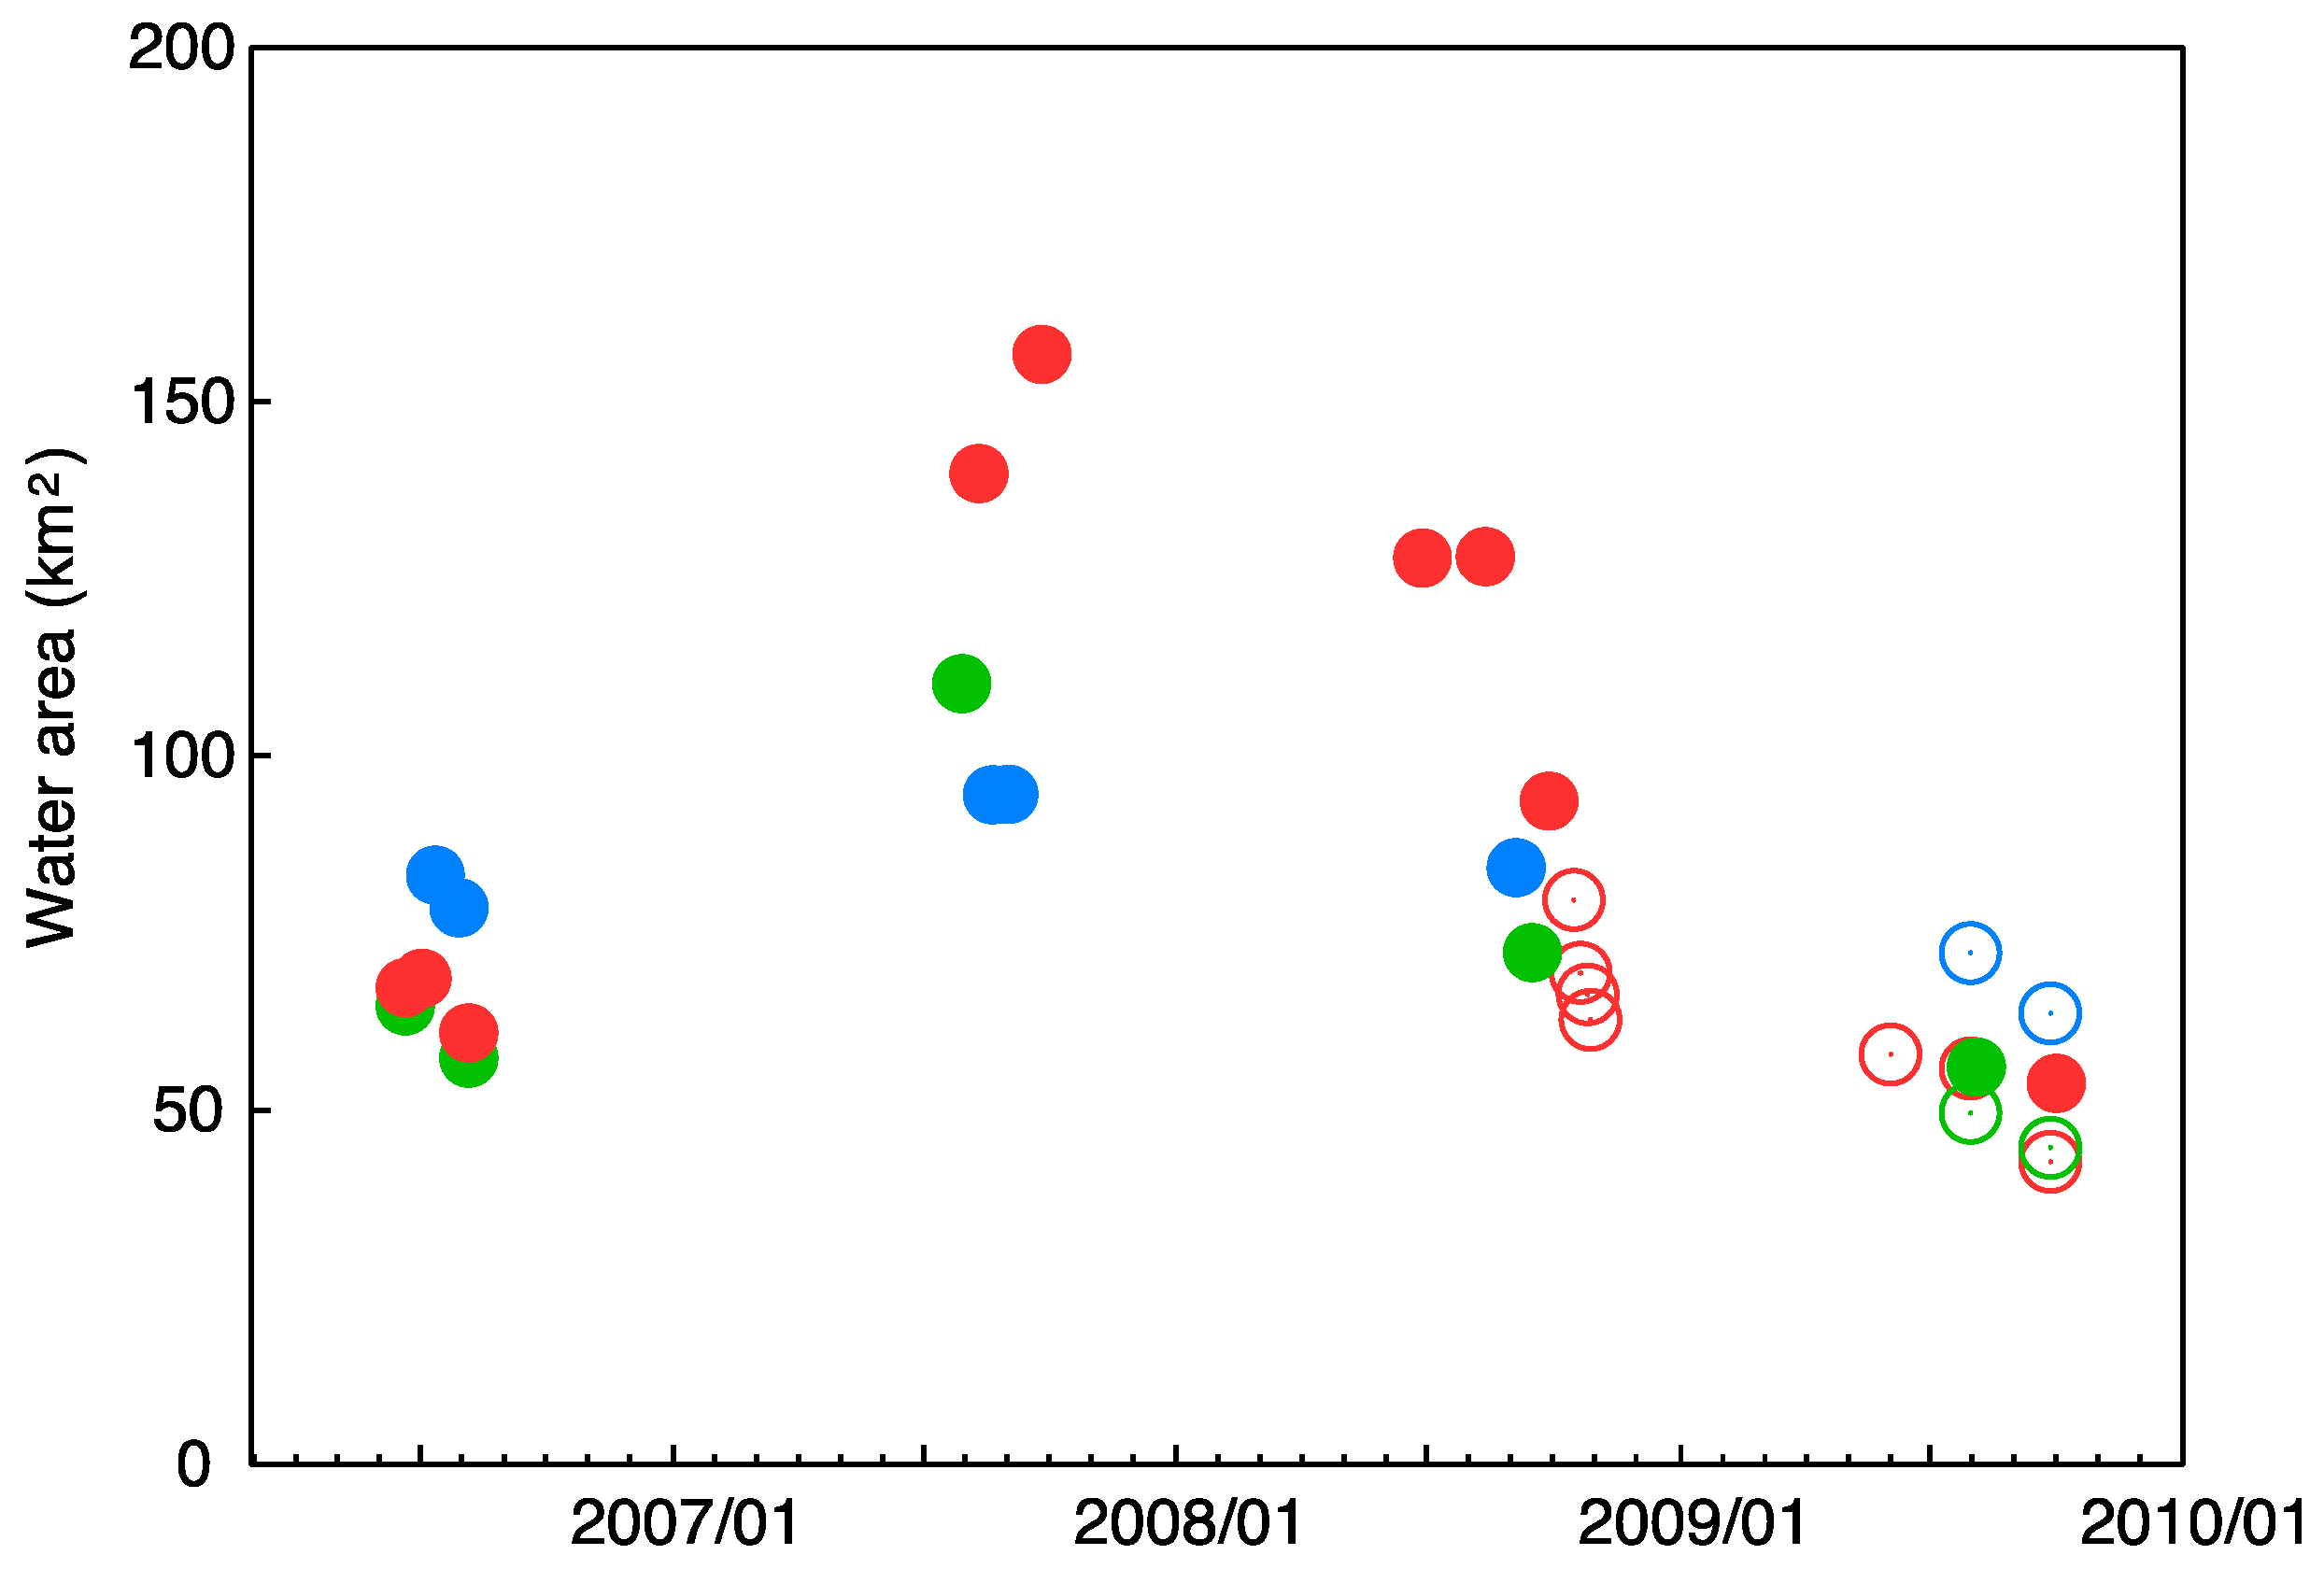
3.3. Detection of the Lake Drainage by PALSAR

Monitoring of the lake drainage was conducted at villages located upstream (Svatai), midstream (Argakhtakh) and downstream (Andryushkino) on the Alazeya River by using PALSAR. Figure 5 shows examples of inundated areas visualized as an RGB (red, green, blue) composite for three different years (R:G:B = 2006:2007:2008). The grayish-colored areas are land and the black areas are water bodies, such as rivers and lakes. Dark-blue, purple and red areas show inundated areas in 2006, 2007 and 2007–2008, respectively. The timing, duration and extent of inundation differed between locations.
Around Svatai, the formation of lakes and accumulation of water were monitored in 2007 (Figure 5a, R:G:B = 2006/07/30:2007/08/21:2008/09/04). However, a flood event was not monitored. A flood event occurred between Svatai and Argahtah. Therefore, the water area around Svatai was relatively constant throughout the three years at approximately 80 km2 in the 20 km × 20 km area shown in Figure 5 (Figure 6).
Around Argakhtakh in the middle reaches of the Alazeya River, the expansion and drainage of lakes were monitored in 2007 (Figure 5b, R:G:B = 2006/08/06:2007/07/30:2008/08/04). The drainage water, which overflowed from lakes, caused the flood (Figure 5b and Figure 7). As a result, the water area increased from approximately 70 km2 in 2006 to 110 km2 in 2007 (Figure 6). The area remained inundated for several months. During that time, the village of Argakhtakh was surrounded by the flood water (Figure 8). However, almost all the flood water flowed downstream in the next year (Figure 6).
Further downstream, in the village of Andryushkino, an exceptionally severe flood was monitored for two years during 2007 and 2008 (Figure 5c, R:G:B = 2006/08/06:2007/09/26:2008/08/13). The width of the river increased to more than 5 km. In the vicinity of Andryushkino, the water area increased from approximately 70 km2 in 2006 to 160 km2 in 2007; the area of 130 km2 remained flooded until the summer of 2008 (Figure 6). Although the flooded area then decreased rapidly in size in the autumn of 2008, it took more than one year before conditions were restored to their original state. These findings imply that the flood waters were frozen in the winter of 2007 around Andryushkino, and that flooding resumed after breakup of the river-ice in the spring of 2008. Around Andryushkino, the flood continued for a long time over a large area; therefore, the negative anomaly of the summer AVHRR BT was shown clearly (Figure 4).

4. Discussions

4.1. Recent Climate Change in Arctic Regions

The rate of warming observed at the meteorological station in Chersky was 0.0472 °C·year−1 over the latter half of the last century (Figure 2a), which was more than double that of the global average [1]. This finding corroborates other studies that have shown that global warming is accelerating at high northern hemisphere latitudes [29]. Moreover, an extraordinary increase in air temperatures was observed in 2007, not only in Chersky but also in many Arctic and sub-Arctic regions [30]. Indeed, several studies have suggested that increases in air temperatures have important consequences for the hydrological cycle [31], and the hydrological cycle in 2007 was quite anomalous. The warming resulted in the second-lowest Arctic sea ice extent being observed in September 2007; the lowest sea ice extent occurred in September 2012, and the ten lowest Arctic sea ice extents have all occurred during the last decade [32]. This phenomenon of decreases in the sea ice extent may be explained as a part of a positive ice-albedo feedback mechanism in which the extent of ice and snow coverage decreases in response to a decrease in surface albedo, which in turn promotes further solar heating of a water body [33]. Furthermore, the melting of Arctic sea ice leads to an increase in the water vapor content in the atmosphere over the Arctic region, which in turn affects changes in the amount, frequency and intensity of precipitation in the region [34]. Our results also showed increasing positive trends in both precipitation amount and air temperature (Figure 2a and Figure 3b). According to Shiklomanov and Lammers [6], river discharge from the large Russian basins (e.g., Yenisey, Ob and Lena) into the Arctic Ocean peaked in 2007 due to the increase in precipitation across the northern parts of the basins and intensive permafrost thawing. Consequently, the economic costs associated with the implementation of flood countermeasures in 2007 reached approximately 2% of the revenue of the Sakha Republic of the Russian Federation [8]. As extreme hydrological events become more frequent and increasingly severe as climate warms, it is expected that new records (in terms of economic costs) due to water-related disasters will be established in the near future. We therefore need to concentrate our efforts on understanding the causes underlying extreme hydrological events in order to develop solutions that will reduce the risks associated with these hazards.

4.2. Availability of Remote Sensing Data for Arctic Monitoring

The availability of meteorological station data in Arctic regions is limited by the low spatial coverage of stations and lack of historical data. Furthermore, although meteorological station data are considered to be valuable, they are representative of relatively small areas. Extreme hydrological events often do not occur in the areas where meteorological stations are located. Extrapolation from a nearby station and interpolation in networks (e.g., spline interpolation, Kriging or polynomial surface trend analysis) are often used as spatial complements [35]. However, extrapolation and interpolation from spatially limited datasets to vast areas can lead to large biases due to localized disparities in climate and geographic heterogeneity. Satellite-derived meteorological data were collected as supplementary information to represent the spatial heterogeneity and temporal dynamics in the Kolyma Lowlands (Figure 3). The spatial variability observed in satellite-derived meteorological data were presented as the mean and standard deviation, and the large archive facilitated the analysis of a regional time-series.
The time-series analysis of the area-averaged GPCP precipitation data showed positive increasing trends in the Kolyma Lowlands (Figure 3b). Similarly, the time-series analysis of precipitation derived from reanalyses datasets, such as MERRA (Modern Era Retrospective-analysis for Research and Analysis), CFSR (Climate Forecast System Reanalysis) and ERA-Interim (European Centre for Medium-Range Weather Forecasts Re-Analysis Interim), also showed a positive increasing trend in precipitation over most of Siberia [36]. Our results therefore corroborated those of previous studies, which showed that eastern Siberia became wetter due to heavy precipitation during 2006 and 2008 (e.g., [3,5]). The GPCP precipitation product offers the potential to apply relatively accurate estimates in areas with sparsely distributed meteorological stations. On the other hand, the time-series analysis of area-averaged summer AVHRR BT did not show a positive increasing trend (Figure 3a), although a positive trend was observed in the interannual air temperature variability at the meteorological station in Chersky (Figure 2a). The area-averaged summer AVHRR BT might be sensitive to precipitation. When the GPCP precipitation was high, the summer AVHRR BT tended to be low (Figure 3). However, the second-highest summer AVHRR BT was observed in 2007 when the highest air temperature was observed in Chersky. Moreover, when anomalies are considered, the summer AVHRR BT in 2007 was warmer than normal in most areas, with the exception of several riverbank, lakeshore and seashore areas (Figure 4). The large negative anomalies of the summer AVHRR BT were most apparent along the riverbank, lakeshore and seashore where the surface land cover changed from terrestrial to water body as a result of formation, expansion and drainage of lake and/or the increase in water level by heavy precipitation and melting of frozen ground. The large negative anomaly of summer AVHRR BT might therefore be used as a potential signal to detect extreme hydrologic events in Arctic regions.
Remote sensing is also well suited for detecting changes in land cover directly. For example, several studies have demonstrated methods for assessing the extent of floods by using high temporal frequency data before and after the change or disturbance event [37,38]. However, the increases in cumulonimbus cloud and thunderstorm activity in the Arctic can make it difficult to monitor land surface attributes on the targeted dates. When cumulonimbus clouds are present, optical sensors only record the reflectance at the tops of clouds. However, microwave sensors, such as PALSAR, have come to play an increasingly important role in cloud-prone areas because the longer wavelength pulses can penetrate cloud cover. However, the disadvantage of these sensors is that they obtain images less frequently, which means that events with limited spatio-temporal scales (e.g., flash floods) may not be detected. Fortunately, the long-term flood that occurred in the Alazeya River was detectable, even at the 46-day repeat cycle of PALSAR. Combining optical and microwave sensors will maximize the potential advantages associated with both observation strategies.

4.3. The Behavior of the Extreme Hydrologic Event in the Kolyma Lowlands

Warmer and wetter climates resulted in the development of extreme hydrologic events in the Kolyma Lowlands. The most serious extreme hydrologic event occurred in 2007 along the Alazeya River (Figure 5). The soil water content in the surface active layer increased, not only due to inflows of meltwater from the ice-rich permafrost, but also due to precipitation. The large amounts of precipitation penetrated the soil and entered lakes in 2006 (Figure 3b). The soil water content in surface active layer remained high through to 2007, because of the impermeable permafrost layer below the active layer constrained drainage of soil water. Moreover, a heat wave in 2007 accelerated the formation, expansion and drainage of a lake (Figure 5 and Figure 7). The increase in thermal erosion along the riverbanks and lakeshores culminated in the development of a flood as the bulkhead between the main river channel and lakes was destroyed by thermal erosion. The large floodplain is visible as the reddish area in Figure 5. A large amount of water was transported into the river, especially at Andryushkino (Figure 5c and Figure 7). Although the trigger of the flood was thermal erosion along the riverbanks and lakeshores, itself induced by the heat wave in 2007, the increase in soil water content due to the heavy precipitation in 2006 appeared to contribute the magnitude of flood. For the same reason and at the same time in 2007, similar lake drainage events were also reported in Yukon, Canada [39,40].
The occurrence of flood is highly affected by the vertical profile of the soil, such as soil water content and the composition and permeability of permafrost in the Arctic. The topology of the landscape, and particularly the slope is also an important factor, as it can dictate the extent of a flooding. The Kolyma Lowlands have a very gentle gradient and the change in vertical distance is several tens of meters per 100 km of horizontal distance. This means that the streamflow velocity of the Alazeya River is very low. A consequence of this slow flow and very gentle gradient meant that the areas around the villages of Argahtah and Andryushkino remained inundated for several months and for more than one year, respectively (Figure 5 and Figure 6). In this case, the severity of the flood was not only the magnitude but also the length of time that the areas remained inundated. Moreover, the permafrost thaw-induced damage to roads, airfields, and other transport infrastructures made it difficult to evacuate quickly and safely. In sparsely populated regions, a structural approach to flood risk management cannot be justified on environmental and economic grounds. Remote sensing is well suited for increasing awareness of flood risk under climate change, and for providing basic information to reduce the risks.

5. Conclusions

This study examined the relationship between recent climate change and extreme hydrologic event, such as lake drainage and flood, along the Alazeya River in the Kolyma Lowlands. The warming rate of air temperature in Chersky was more than double that of the global average. However, data from meteorological stations are somewhat limited. Therefore, this study employed historical remote sensing data as supplementary information to represent the spatial heterogeneity and temporal dynamics of meteorological data in the Kolyma Lowlands. Time-series analysis of area-averaged GPCP precipitation data showed that the Kolyma Lowlands became wetter because the warming led to an increase in the water vapor content in the atmosphere. The magnitude and frequency of heavy precipitation tended to increase over time. In particular, a heavy precipitation of 459 ± 113 mm was observed in 2006. On the other hand, time-series analysis of area-averaged summer AVHRR BT did not show any clear trends. The summer AVHRR BT might be sensitive to precipitation. When the GPCP precipitation was high, the summer AVHRR BT tended to be low. However, the second-highest summer AVHRR BT was observed in 2007, when the highest air temperature was observed in Chersky. Furthermore, the anomaly from normal showed that the summer AVHRR BTs were mostly positive in 2007, with the exception of several riverbank, lakeshore and seashore areas. Conversely, the riverbank, lakeshore and seashore areas were much cooler due to the change in land cover from terrestrial to water body. The lake drainages were monitored along the Alazeya River due to warmer and wetter climates, which resulted in a flood when the bulkhead between the main river channel and lakes was destroyed by thermal erosion. Although the trigger of the flood was likely due to thermal erosion in 2007, an increase in soil water content due to heavy precipitation in 2006 appeared to exacerbate the magnitude of flood. The flood was characterized by low streamflow velocity because the Kolyma Lowlands had a very gentle gradient. Therefore, the flood continued for a long time over a large area.
The Kolyma lowlands were becoming warmer and wetter due to recent climate change. The satellite-derived meteorological data, such as temperature and precipitation, were useful for monitoring the local weather in sparsely populated regions. Moreover, the remote sensing data were also useful for monitoring the extent and dynamics of extreme hydrological events. We found the changes in climate were tightly linked to the extreme hydrological events through the lake drainage and thermal erosion of permafrost soil. The hazard risk management plan should be updated in consideration of climate change. Information based on remote sensing data will give basic insights to understand the mechanism and behavior of extreme hydrologic event. Such insights will facilitate efforts to manage hazard risk.

Acknowledgments

This work was partly supported by Research Project No.C-07 of the Research Institute for Humanity and Nature (RIHN) entitled ‘Global Warming and the Human–Nature Dimension in Siberia: Social Adaptation to the Changes of the Terrestrial Ecosystem, with an Emphasis on Water Environments’ (Principal Investigator: Tetsuya Hiyama).

Author Contributions

Semen Gotovtsev designed the overall study. Toru Sakai, Semen Gotovtsev, Leonid Gagarin and Tetsuya Hiyama conducted fieldwork. Toru Sakai analyzed the data and wrote the paper. Tsuneo Matsunaga, Shamil Maksyutov, Semen Gotovtsev, Leonid Gagarin, Tetsuya Hiyama and Yasushi Yamaguchi contributed to discussion and interpretation of the results. All the authors contributed to editing and reviewing the manuscript.

Conflicts of Interest

The authors declare no conflict of interest.

References

  1. Intergovernmental Panel on Climate Change (IPCC). Climate Change 2013: The Physical Science Basis; Cambridge University Press: Cambridge, UK, 2013; p. 1535. [Google Scholar]
  2. Fedorov, A.N.; Gavriliev, P.P.; Konstantinov, P.Y.; Hiyama, T.; Iijima, Y.; Iwahana, G. Estimating the water balance of a thermokarst lake in the middle of the Lena River basin, eastern Siberia. Ecohydrology 2014, 7, 188–196. [Google Scholar] [CrossRef]
  3. Iijima, Y.; Ohta, T.; Kotani, A.; Fedorov, A.N.; Kodama, Y.; Maximov, T.C. Sap flow changes in relation to permafrost degradation under increasing precipitation in an eastern Siberian larch forest. Ecohydrology 2014, 7, 177–187. [Google Scholar] [CrossRef]
  4. Sun, B.; Groisman, P.Y.; Mokhov, I.I. Recent changes in cloud-type frequency and inferred increases in convection over the United States and the former USSR. J. Clim. 2001, 14, 1864–1880. [Google Scholar] [CrossRef]
  5. Iijima, Y.; Nakamura, T.; Park, H.; Tachibana, Y.; Fedorov, A.N. Enhancement of Arctic storm activity in relation to permafrost degradation in eastern Siberia. Int. J. Climatol. 2016. [Google Scholar] [CrossRef]
  6. Shiklomanov, A.I.; Lammers, R.B. Record Russian river discharge in 2007 and the limits of analysis. Environ. Res. Lett. 2009, 4, 045015. [Google Scholar] [CrossRef]
  7. Trenberth, K.E. Changes in precipitation with climate change. Clim. Res. 2011, 47, 123–138. [Google Scholar] [CrossRef]
  8. Takakura, H. The local conceptualization of river ice thawing and the spring flood of Lena River under the global warming. In Proceedings of the 1st International Conference Global Warming and the Human-Nature Dimention in Siberia, Kyoto, Japan, 7–9 March 2012.
  9. Smith, L.C.; Sheng, Y.; MacDonald, G.M.; Hinzman, L.D. Disappearing Arctic lakes. Science 2005, 308, 1429. [Google Scholar] [CrossRef] [PubMed]
  10. Schuur, E.A.G.; Bockheim, J.; Canadell, J.G.; Euskirchen, E.; Field, C.B.; Goryachkin, S.V.; Hagemann, S.; Kuhry, P.; Lafleur, P.M.; Lee, H.; et al. Vulnerability of permafrost carbon to climate change: Implications for the global carbon cycle. BioScience 2008, 58, 701–714. [Google Scholar] [CrossRef]
  11. Lyon, S.W.; Destouni, G.; Giesler, R.; Humborg, C.; Mörth, M.; Seibert, J.; Karlsson, J.; Troch, P.A. Estimation of permafrost thawing rates in a sub-arctic catchment using recession flow analysis. Hydrol. Earth Syst. Sci. 2009, 13, 595–604. [Google Scholar] [CrossRef] [Green Version]
  12. Yang, D.; Kane, D.L.; Hinzman, L.D.; Zhang, X.; Zhang, T.; Ye, H. Siberian Lena River hydrologic regime and recent change. J. Geophys. Res. Atmos. 2002, 107. [Google Scholar] [CrossRef]
  13. Yoshikawa, K.; Hinzman, L.D. Shrinking thermokarst ponds and groundwater dynamics in discontinuous permafrost near council, Alaska. Permafr. Periglac. Process. 2003, 14, 151–160. [Google Scholar] [CrossRef]
  14. Hinkel, K.M.; Eisner, W.R.; Bockheim, J.G.; Nelson, F.E.; Peterson, K.M.; Dai, X. Spatial extent, age, and carbon stocks in drained thaw lake basins on the Barrow Peninsula, Alaska. Arct. Antarct. Alp. Res. 2003, 35, 291–300. [Google Scholar] [CrossRef]
  15. Mackay, J.R. Periglacial features developed on the exposed lake bottoms of seven lakes that drained rapidly after 1950, Tuktoyaktuk Peninsula area, western Arctic coast, Canada. Permafr. Periglac. Process. 1999, 10, 39–63. [Google Scholar] [CrossRef]
  16. Jones, B.M.; Arp, C.D. Observing a catastrophic thermokarst lake drainage in northern Alaska. Permafr. Periglac. Process. 2015, 26, 119–128. [Google Scholar] [CrossRef]
  17. Karlsson, J.M.; Jaramillo, F.; Destouni, G. Hydro-climatic and lake change patterns in Arctic permafrost and non-permafrost areas. J. Hydrol. 2015, 529, 134–145. [Google Scholar] [CrossRef]
  18. Lantz, T.C.; Turner, K.W. Changes in lake area in response to thermokarst processes and climate in Old Crow Flats, Yukon. J. Geophys. Res. Biogeosci. 2015, 120, 513–524. [Google Scholar] [CrossRef]
  19. Mackay, J.R. Catastrophic lake drainage, Tuktoyaktuk Peninsula area, District of Mackenzie. Geol. Surv. Can. 1988, 88, 83–90. [Google Scholar]
  20. Riordan, B.; Verbyla, D.; McGuire, A.D. Shrinking ponds in subarctic Alaska based on 1950–2002 remotely sensed images. J. Geophys. Res. Biogeosci. 2006, 111, G04002. [Google Scholar] [CrossRef]
  21. Tarasenko, T.V. Interannual variations in the areas of thermokarst lakes in central Yakutia. Water Resour. 2013, 40, 111–119. [Google Scholar] [CrossRef]
  22. Marsh, P.; Russell, M.; Pohl, S.; Haywood, H.; Onclin, C. Changes in thaw lake drainage in the western Canadian Arctic from 1950 to 2000. Hydrol. Process. 2009, 23, 145–158. [Google Scholar] [CrossRef]
  23. Jones, B.M.; Grosse, G.; Arp, C.D.; Jones, M.C.; Walter Anthony, K.M.; Romanovsky, V.E. Modern thermokarst lake dynamics in the continuous permafrost zone, northern Seward Peninsula, Alaska. J. Geophys. Res. Biogeosci. 2011, 116, G00M03. [Google Scholar] [CrossRef]
  24. Sjöberg, Y.; Coon, E.K.; Sannel, A.B.K.; Pannetier, R.; Harp, D.; Frampton, A.; Painter, S.L.; Lyon, S.W. Thermal effects of groundwater flow through subarctic fens: A case study based on field observations and numerical modeling. Water Resour. Res. 2016, 52, 1591–1606. [Google Scholar]
  25. De Wit, A.J.W.; van Diepen, C.A. Crop growth modelling and crop yield forecasting using satellite-derived meteorological inputs. Int. J. Appl. Earth Obs. Geoinf. 2008, 10, 414–425. [Google Scholar] [CrossRef]
  26. Romanovsky, V.E.; Smith, S.L.; Christiansen, H.H. Permafrost thermal state in the polar northern hemisphere during the international polar year 2007–2009: A synthesis. Permafr. Periglac. Process. 2010, 21, 106–116. [Google Scholar] [CrossRef]
  27. Li, Z.-L.; Tang, B.-H.; Wu, H.; Ren, H.; Yan, G.; Wan, Z.; Trigo, I.F.; Sobrino, J.A. Satellite-derived land surface temperature: Current status and perspectives. Remote Sens. Environ. 2013, 131, 14–37. [Google Scholar] [CrossRef]
  28. Huffman, G.J.; Adler, R.F.; Bolvin, D.T.; Gu, G. Improving the global precipitation record: GPCP version 2.1. Geophys. Res. Lett. 2009, 36, 153–159. [Google Scholar] [CrossRef]
  29. Cohen, J.; Screen, J.A.; Furtado, J.C.; Barlow, M.; Whittleston, D.; Coumou, D.; Francis, J.; Dethloff, K.; Entekhabi, D.; Overland, J.; et al. Recent Arctic amplification and extreme mid-latitude weather. Nat. Geosci. 2014, 7, 627–637. [Google Scholar] [CrossRef] [Green Version]
  30. Bekryaev, R.V.; Polyakov, I.V.; Alexeev, V.A. Role of polar amplification in long-term surface air temperature variations and modern Arctic warming. J. Clim. 2010, 23, 3888–3906. [Google Scholar] [CrossRef]
  31. Barnett, T.P.; Adam, J.C.; Lettenmaier, D.P. Potential impacts of a warming climate on water availability in snow-dominated regions. Nature 2005, 438, 303–309. [Google Scholar] [CrossRef] [PubMed]
  32. Parkinson, C.L.; Comiso, J.C. On the 2012 record low Arctic sea ice cover: Combined impact of preconditioning and an August storm. Geophys. Res. Lett. 2013, 40, 1356–1361. [Google Scholar] [CrossRef]
  33. Manabe, S.; Stouffer, R.J. Sensitivity of a global climate model to an increase of CO2 concentration in the atmosphere. J. Geophys. Res. Ocean. 1980, 85, 5529–5554. [Google Scholar] [CrossRef]
  34. Ye, H.; Fetzer, E.J.; Behrangi, A.; Wong, S.; Lambrigtsen, B.H.; Wang, C.Y.; Cohen, J.; Gamelin, B.L. Increasing daily precipitation intensity associated with warmer air temperatures over northern Eurasia. J. Clim. 2016, 29, 623–636. [Google Scholar] [CrossRef]
  35. Hijmans, R.J.; Cameron, S.E.; Parra, J.L.; Jones, P.G.; Jarvis, A. Very high resolution interpolated climate surfaces for global land areas. Int. J. Climatol. 2005, 25, 1965–1978. [Google Scholar] [CrossRef]
  36. Serreze, M.C.; Barrett, A.P.; Stroeve, J. Recent changes in tropospheric water vapor over the arctic as assessed from radiosondes and atmospheric reanalyses. J. Geophys. Res. Atmos. 2012, 117. [Google Scholar] [CrossRef]
  37. Pavelsky, T.M.; Smith, L.C. Spatial and temporal patterns in Arctic river ice breakup observed with MODIS and AVHRR time series. Remote Sens. Environ. 2004, 93, 328–338. [Google Scholar] [CrossRef]
  38. Sakai, T.; Hatta, S.; Okumura, M.; Hiyama, T.; Yamaguchi, Y.; Inoue, G. Use of Landsat TM/ETM+ to monitor the spatial and temporal extent of spring breakup floods in the Lena River, Siberia. Int. J. Remote Sens. 2015, 36, 719–733. [Google Scholar] [CrossRef]
  39. Turner, K.W.; Wolfe, B.B.; Edwards, T.W.D. Characterizing the role of hydrological processes on lake water balances in the Old Crow Flats, Yukon territory, Canada, using water isotope tracers. J. Hydrol. 2010, 386, 103–117. [Google Scholar] [CrossRef]
  40. Wolfe, B.B.; Turner, K.W. Near-record precipitation causes rapid drainage of Zelma Lake, Old Crow Flats, northern Yukon Territory. Meridian 2008, 7–12. [Google Scholar]
Figure 1. Location of study area in the Kolyma lowlands.
Remotesensing 08 00971 g001
Figure 2. Time series of mean (a) annual and (b) monthly air temperatures observed at the meteorological station in Chersky for the period 1960–2015. The red line indicates the air temperatures in 2007, and the gray lines show the air temperatures for the other years.
Remotesensing 08 00971 g002
Figure 3. Time series of area-averaged (a) brightness temperature (BT) calculated using Advanced Very High Resolution Radiometer (AVHRR) data during the summer period (June–September) and (b) annual precipitation calculated using the Global Precipitation Climatology Project (GPCP) data, which combines meteorological observations and satellite estimates. The average (solid line) and standard deviation (shaded area) of AVHRR summer BT and GPCP annual precipitation data are shown for the region shown in Figure 1 (67°N–72°N, 147°E–162°E).
Remotesensing 08 00971 g003
Figure 4. AVHRR summer BT anomaly in 2007 with respect to the 1982–2015 baseline. Red/blue areas indicate higher/lower than normal summer BT values. Black rectangles show the area of Phased Array type L-band Synthetic Aperture Radar (PALSAR) images shown in Figure 5.
Remotesensing 08 00971 g004
Figure 5. Inundated areas around three villages on the Alazeya River visualized as a RGB composite from different three-year PALSAR images (R:G:B=2006:2007:2008). (a) Svatai (upper reaches); (b) Argakhtakh (middle reaches); and (c) Andryushkino (lower reaches). Black areas show continuous water bodies (e.g., rivers and lakes) for the three years. Dark-blue, purple and red areas show the inundated areas in 2006, 2007, and 2007 and 2008, respectively. White circles show the location of the villages.
Remotesensing 08 00971 g005
Figure 6. Water area detected by PALSAR data during the summer season from 2006 to 2009 in the 20 km × 20 km area shown in Figure 5. Blue, green and red dots show the villages of Svatai, Argahtah and Andryushkino, respectively. Closed and open circles show fine and ScanSAR modes of PALSAR, respectively.
Remotesensing 08 00971 g006
Figure 7. Lake after drainage.
Remotesensing 08 00971 g007
Figure 8. Argakhtakh village surrounded by the flood in 2007.
Remotesensing 08 00971 g008

