
Wind Resource Assessment for High-Rise BIWT Using RS-NWP-CFD


1
Korea Institute of Energy Research, Daejeon 34129, Korea
2
CEDIC Co. Ltd., Seoul 08506, Korea
3
Chungnam Institute, Gongju 32589, Korea
*
Author to whom correspondence should be addressed.
Remote Sens. 2016, 8(12), 1019; https://doi.org/10.3390/rs8121019
Submission received: 29 July 2016
/
Revised: 26 November 2016
/
Accepted: 8 December 2016
/
Published: 13 December 2016
(This article belongs to the Special Issue Remote Sensing of Wind Energy)
Abstract
:In this paper, a new wind resource assessment procedure for building-integrated wind turbines (BIWTs) is proposed. The objective is to integrate wind turbines at a 555 m high-rise building to be constructed at the center of Seoul, Korea. Wind resource assessment at a high altitude was performed using ground-based remote sensing (RS); numerical weather prediction (NWP) modeling that includes an urban canopy model was evaluated using the remote sensing measurements. Given the high correlation between the model and the measurements, we use the model to produce a long-term wind climate by correlating the model results with the measurements for the short period of the campaign. The wind flow over the high-rise building was simulated using computational fluid dynamics (CFD). The wind resource in Seoul—one of the metropolitan cities located inland and populated by a large number of skyscrapers—was very poor, which results in a wind turbine capacity factor of only 7%. A new standard procedure combining RS, NWP, and CFD is proposed for feasibility studies on high-rise BIWTs in the future.
1. Introduction
In the Bible, the Tower of Babel was a symbol of the aspiration of humans to reach God’s realm. Pyramids built by the ancient Egyptians were also a reflection of such desire. The Great Pyramid of Giza, whose height is 145 m and which was built around BC 2560, was the tallest building in the world until it was replaced by the 160 m high Lincoln Cathedral in England in AD 1311. Since then the emergence of the highest buildings has been chronicled since then as follows: Eiffel Tower in Paris, France (300 m) in 1889; Empire State Building in New York, NY, USA (381 m) in 1930; Ostankino Tower in Moscow, Russia (537 m) in 1967; CN Tower in Toronto, Canada (553 m) in 1975; and Burj Khalifa in Dubai, UAE (830 m) in 2007 [1].
This landmark race continues in southeast and east Asia as well: Petronas Twin Towers in Kuala Lumpur, Malaysia (452 m) in 1996; Jin Mao Tower in Shanghai, China (421 m) in 1998; Taipei World Financial Center 101 in Taipei, Taiwan (509 m) in 2005; and Lotte World Tower in Seoul, Korea (555 m) in 2016.
Note that the concept of sustainable architecture, which is contrary to ultra high-rise architectures, started in the 21st century. Sustainable architecture refers to the conscious minimization of the negative effects on the environment by making building materials, energy use, and space utilization efficient so that the actions and decisions we make today will not limit the opportunities for the next generations [2,3]. In other words, a new paradigm wherein buildings shall provide symbolism such as ecological design or sustainability—instead of concentrating on the tallest building race—has begun. As a result, the so-called building-integrated ideas, wherein renewable energy as a symbol of sustainable and eco-friendly energy is integrated in buildings, have been implemented.
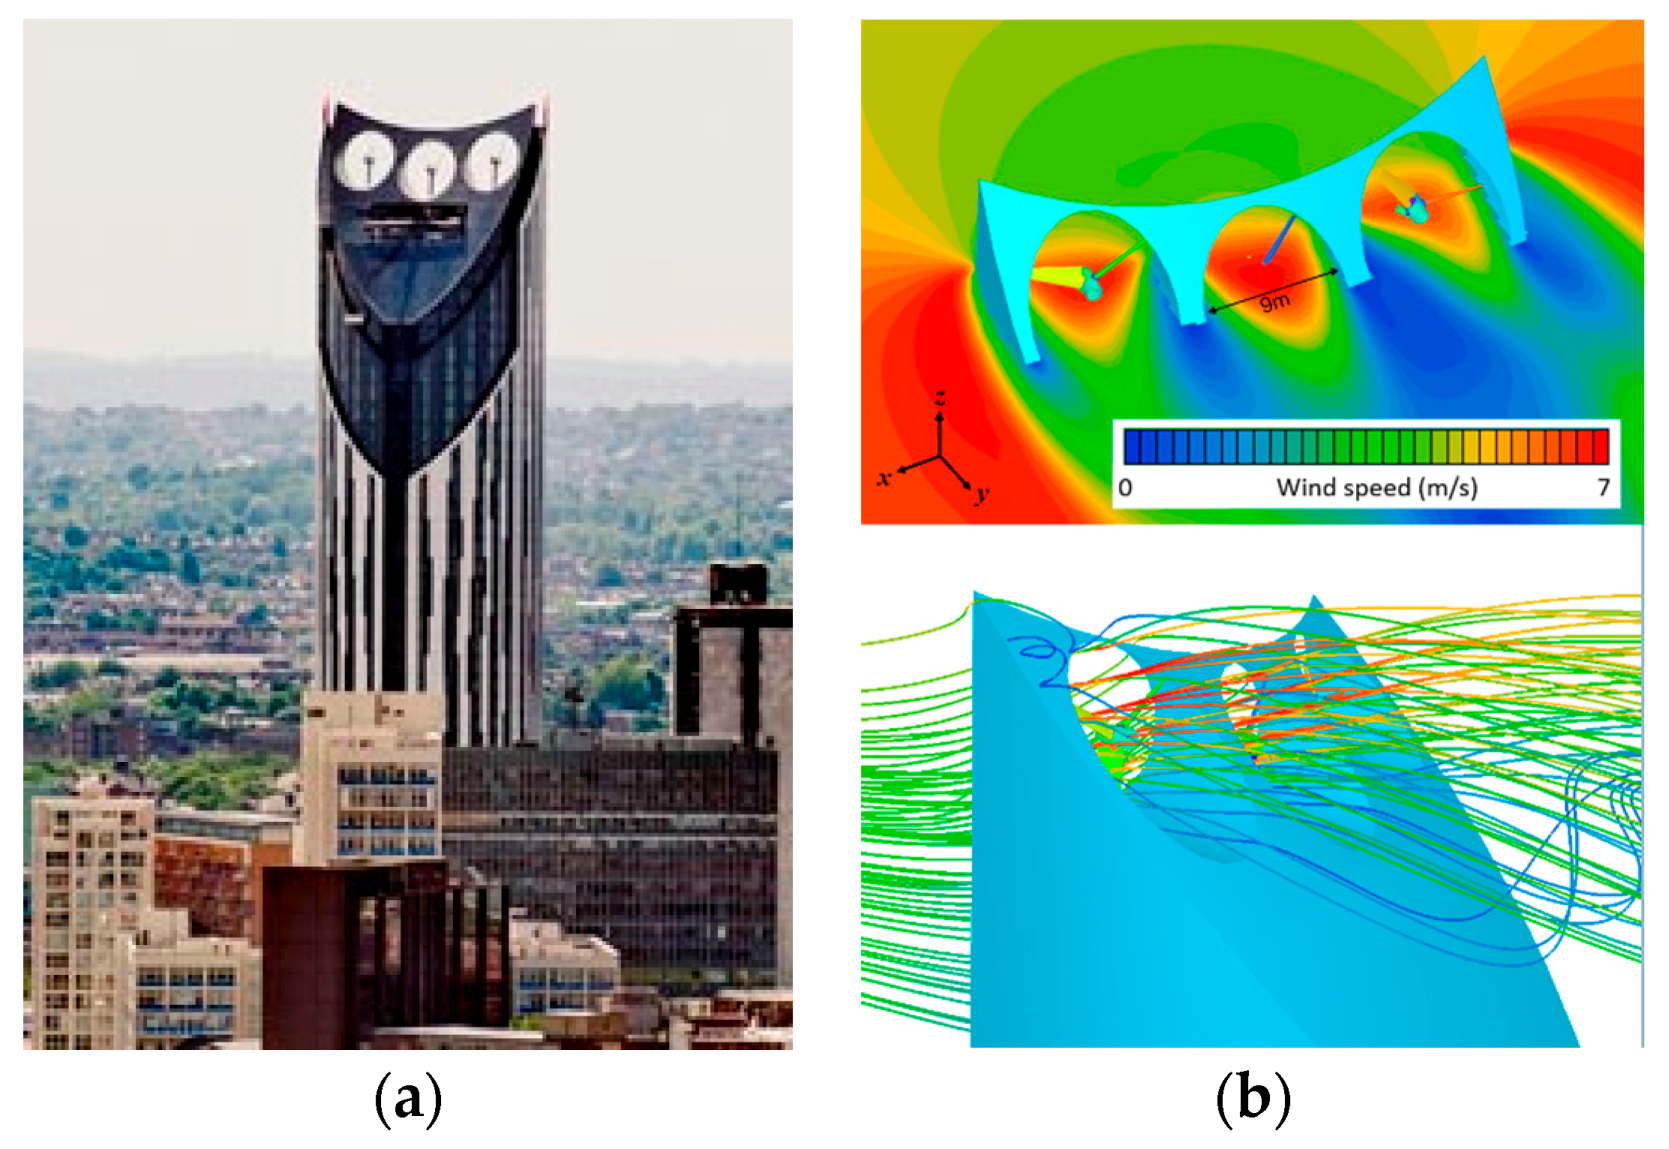
The Bahrain World Trade Center, which was completed in 2008 and is regarded as the first modern BIWT, is a 240 m-high, 50-story twin tower complex. It is a structure with symmetrical triangular-shaped twin buildings whose shape and layout were designed to make use of wind energy beyond the mere integration of wind turbine in the building. It is regarded as building-augmented wind turbine (BAWT), which is a more aggressive concept than BIWT [4].
As shown in the building photo and on analysis result via CFD (by the authors; see Figure 1), 3-blade horizontal-axis wind turbines with diameter of 29 m and capacity of 225 kW were installed at the bridges connecting the triangular twin towers, which are symmetrical with an interior angle of about 120°. Since the building is located at the coast, the Venturi effect occurs wherein in-between distance reduced by an angle made by the twin towers when the sea breeze blows. The building was designed to increase the efficiency of wind power generation through the accelerated wind. About 1.3 GWh per year—which accounts for 13% of the energy consumption of the building—is generated by wind power, for capacity factor of approximately 22%.
The Hess Tower in Houston, Texas, USA was completed in 2009 (Figure 2). As a 147 m-high, 20-story building, it was regarded as BIWT wherein 10 vertical-axis wind turbines were installed on top [5]. This building drew attention because a fragment of the part of a wind turbine damaged by strong wind fell, with the dangerous event being covered in the local community newspaper. The Hess Tower case suggests that BIWTs installed in high-rise buildings should consider all accident factors including gusts and lightning.
The Pearl River Tower in Guangzhou, China is a typical example of BIWTs and building-integrated photovoltaic (BIPV) in Asia. As a 309 m-high, 71-story building completed in 2011, it was designed to increase the wind speed via the nozzle effect by making flow passages in the building as shown in Figure 3. A total of four 8 m-high vertical-axis wind turbines are installed inside the building, each at the internal passage on the left and right sides [6].
Built in 2011, the Strata SE1 in London is a 148 m-high, 43-story residential building wherein three rooftop horizontal-axis wind turbines with 19 kW capacity were integrated (Figure 4). It has been awarded several architectural design prizes, but the press was not impressed, claiming that the wind turbines rarely rotated. The citizens believe the wind turbine should work continuously, but the wind is generally low [7].
This study was conducted to integrate renewable energy in the Lotte World Tower, a 555 m high-rise building to be constructed in Seoul, Korea as the sixth tallest building in the world. Seoul is one of the largest metropolitan cities with around 10 million citizens. Seoul is characterized by its inland location as well as weakening wind compared to onshore.
In this study, wind resource assessment was performed to evaluate the performance of a 555 m high-rise BIWT to be built at the center of Seoul. At such height, it is very complicated to perform in-situ measurements. Therefore, ground-based remote sensors such as LIDAR and SODAR were employed to perform wind resource assessment. Furthermore, a numerical weather prediction (NWP) model and measure-correlate-predict (MCP) method were utilized to extend the short-term data measured via remote sensing to more than one-year data. A three-dimensional geographical information system (GIS) database and CFD were also employed to predict the effect of the building on the flow.
2. Analysis Methods
2.1. Analysis Procedure
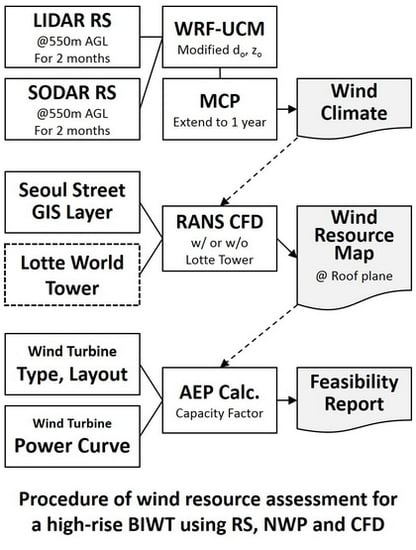
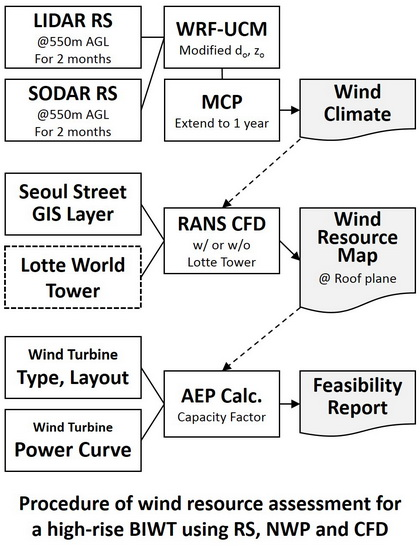
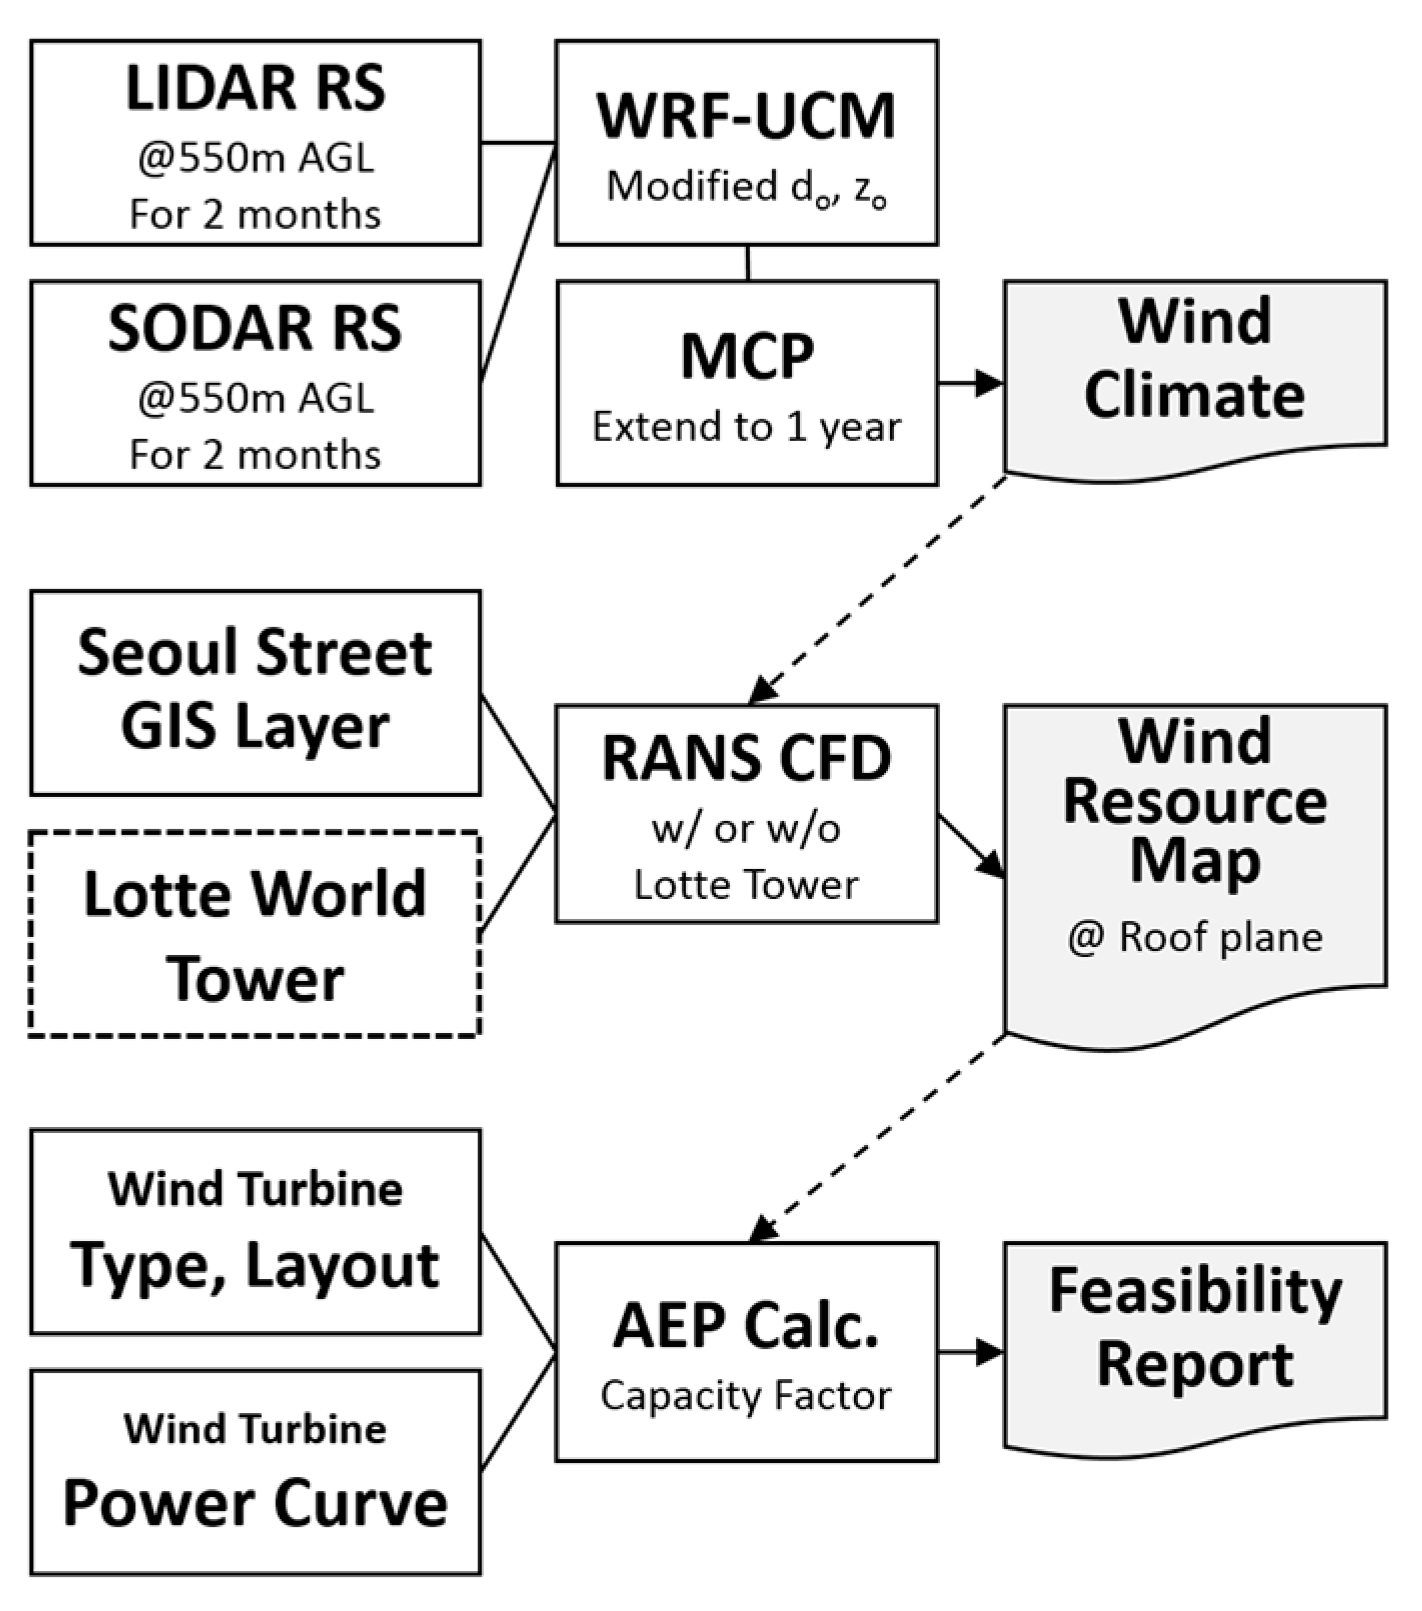
Figure 5 shows the procedure for wind resource assessment to implement BIWTs at the upper part of high-rise buildings.
The remote sensing campaign in this study lasted for two months only due to various constraints. An MCP method is therefore applied. In this study, an NWP, namely Weather Research Forecasting–Urban Canopy Model (WRF–UCM) was used and evaluated against the RS data. The RS data were then utilized as reference data, and long-term wind climate data were reconstructed through an MCP method.
The second step is to create a wind resource map that can show the spatial variability of the wind resource at the installation area to determine the turbines’ layout.
For wind resource mapping, first, wind flow fields at the target area by wind direction are simulated using CFD. If 16 wind directional sectors are considered, a total of 16 wind directions are to be simulated. Next, 16 simulation results are synthesized by applying frequencies of occurrence by each of the wind directions and 1 m/s wind speed intervals obtained from the wind climate as weighting factors. The procedure can be described as:
where, is the synthesized wind speed, is the wind at a directional sector i and wind speed bin j, and is the frequency of occurrence by each directional and wind speed bin.
The third step is to select a type of wind turbine and determine an optimum layout. Although energy production can be maximized if a wind turbine is installed at the highest wind power density location, wake losses shall also be taken into account.
2.2. Remote Sensing Campaign
The remote sensing campaign, which consisted on measuring the wind resource at 555 m altitude, was performed at the rooftop (yellow triangle in Figure 6) of Lotte Hotel, which is 270 m away from the lot (dashed line in Figure 6) of the Lotte World Tower in the west direction near the Han River at the center of Seoul. A Leosphere WindCube LIDAR WLS70 and a Sintec MPAS SODAR were deployed at the rooftop of the 145 m-high Lotte Hotel, and measurements were conducted for two months from 9 March to 8 May 2009.
2.3. Numerical Weather Prediction
Since wind resource assessment requires measurements of at least one year including seasonal variability, short-term remote sensing measurements are extended through an MCP method that uses NWP data. NWP was conducted considering the urban canopy layer in order to secure reliable reference data.
WRF–UCM is a mesocale-microscale coupled model that takes into account the interaction of the physical processes in an urban canopy [8]. The model assumes two-dimensional buildings and road types for detailed city landuse. The single-layer land surface model, i.e. the lower boundary condition of WRF–UCM, employed the Seoul building height layer provided by the National Spatial Information Clearinghouse of Korea. Here, the lower boundary condition was modified by applying the surface roughness estimation method proposed by Macdonald et al. (1998) [9]. Specifically, the displacement height (do) of the urban canopy was calculated and added to the terrain elevation. In addition, surface roughness (zo) was calculated; if it was larger than the roughness height defined at the land cover, the value was substituted.
2.4. Computational Fluid Dynamics
The wind flow field around the Lotte World Tower will be considerably distorted once the building is complete. The wind flow field was simulated using the Reynolds-Averaged Navier-Stokes (RANS) CFD software SC/Tetra v12. SC/Tetra is a flow solver based on a finite volume method and employs the SIMPLEC algorithm for pressure-velocity coupling and the 2nd-order QUICK upwind scheme for convection terms.
The design draft of the Lotte World Tower is a tapered column shape with square cross section, whose edges are round as shown in Figure 7. The cross-sectional area decreases in a stepwise manner with increasing altitude. This design is intended to prevent resonance by shifting the Karman vortex shedding frequency by altitude. The rooftop, where the wind turbines are supposed to be installed, has a truss structure consisting of a square cone at the center and 16 columns surrounding the outer border. From the top view, the lower structures protruding on three sides excluding the left side are shelves to protect pedestrians by preventing downwash from flowing down the building as a result of wind colliding with the building.
The computational domain was set to 6 km × 6 km × 2.5 km around the Lotte World Tower and Figure 8 shows the central part of the domain (3 km × 1.5 km area). The 90 million unstructured hybrid mesh is used to model complex urban buildings. For a validation simulation, the main wind direction (WNW) with/without the Lotte World Tower was simulated. Considering the periodic geometrical characteristics of the urban canopy and a relatively short computational domain, periodic boundary conditions were imposed on inlet and outlet planes instead of an atmospheric boundary layer inlet condition. The constant pressure condition is imposed on the upper free boundary and slip conditions are assigned to side boundaries. The WRF–UCM result was used as an initial condition.
3. Analysis Results
3.1. Remote Sensing Campaign
Figure 9 shows the mean wind speed profiles measured using LIDAR (from 10-min data) and SODAR (from 30-min data) for the campaign period, where the data recovery rate (DRR; dashed lines) decreased with increasing altitude. Slight distortion of wind shear over 400 m above ground level is observed in LIDAR data between the raw data (lines with white circles) and the concurrent data (lines with black circles) which is about 50% of the raw data. In SODAR data, minor difference is shown between the raw and concurrent data below 500 m aboveground where DRR is over 50% [12].
3.2. Numerical Weather Prediction
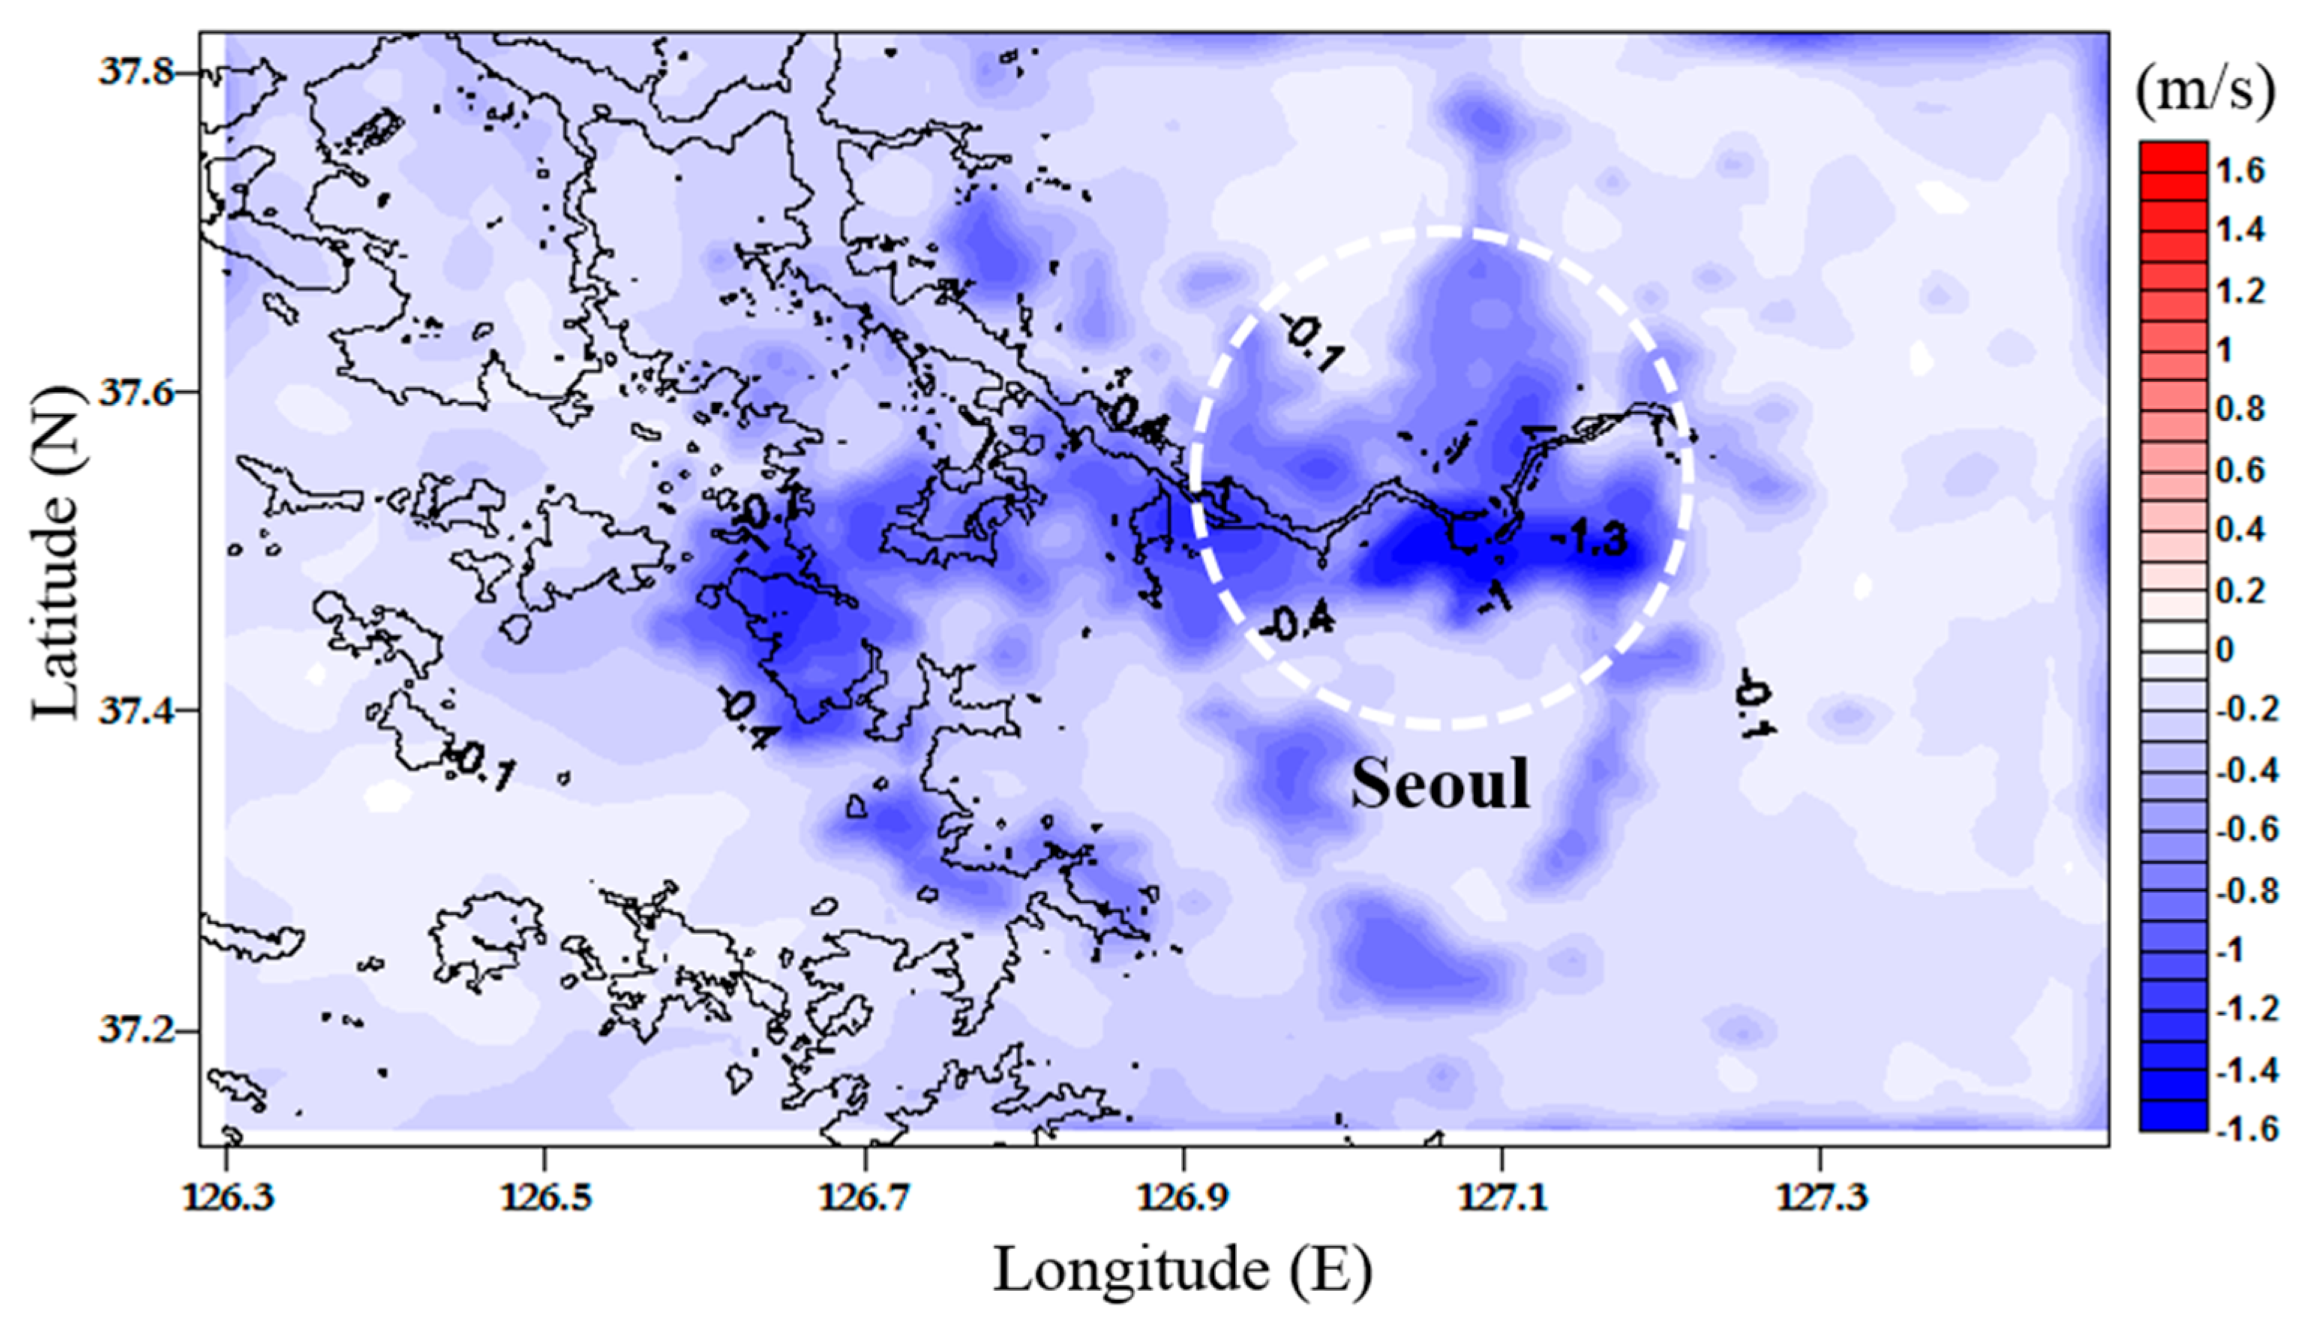
Figure 10 shows the simulation results at 12:00 p.m. when the westward wind blew to the inland from the west sea. The figure shows a difference in wind speed between two cases, either applying the urban canopy model or not. Wind speed in Seoul—marked by the dashed white circle—shows clear reduction.
Figure 11 shows the comparison among mean wind speed profiles measured by the 1-h averaged LIDAR and SODAR and simulation results using 1-h averaged WRF and WRF–UCM during the remote sensing campaign period. The LIDAR profiles agree better with the WRF–UCM results than the SODAR profiles, while WRF results are noticeably the highest.
Figure 12 presents scatter plots comparing remote sensing measurements and numerical weather prediction during the campaign period at 400 m aboveground. The wind direction showed goodness-of-fit and R2 = 0.84 for both 1-h averaged LIDAR and SODAR, whereas for the wind speed this was R2 = 0.67 and 0.61 for LIDAR and SODAR, respectively. Through this comparison, since LIDAR measurement data and WRF–UCM simulation data were matched at the level of R2 = 0.67, WRF–UCM data were considered to be utilized in the long-term correction of short-term remote sensing measurement data.
3.3. Long-Term Correction
Short-term data were corrected to long-term data via MCP using statistical correlation in the overlapped period between the reference data (WRF–UCM) and the short-term LIDAR measurements. Here, the variance ratio algorithm, which produced consistently reliable predictions among the MCP algorithms, was employed [13].
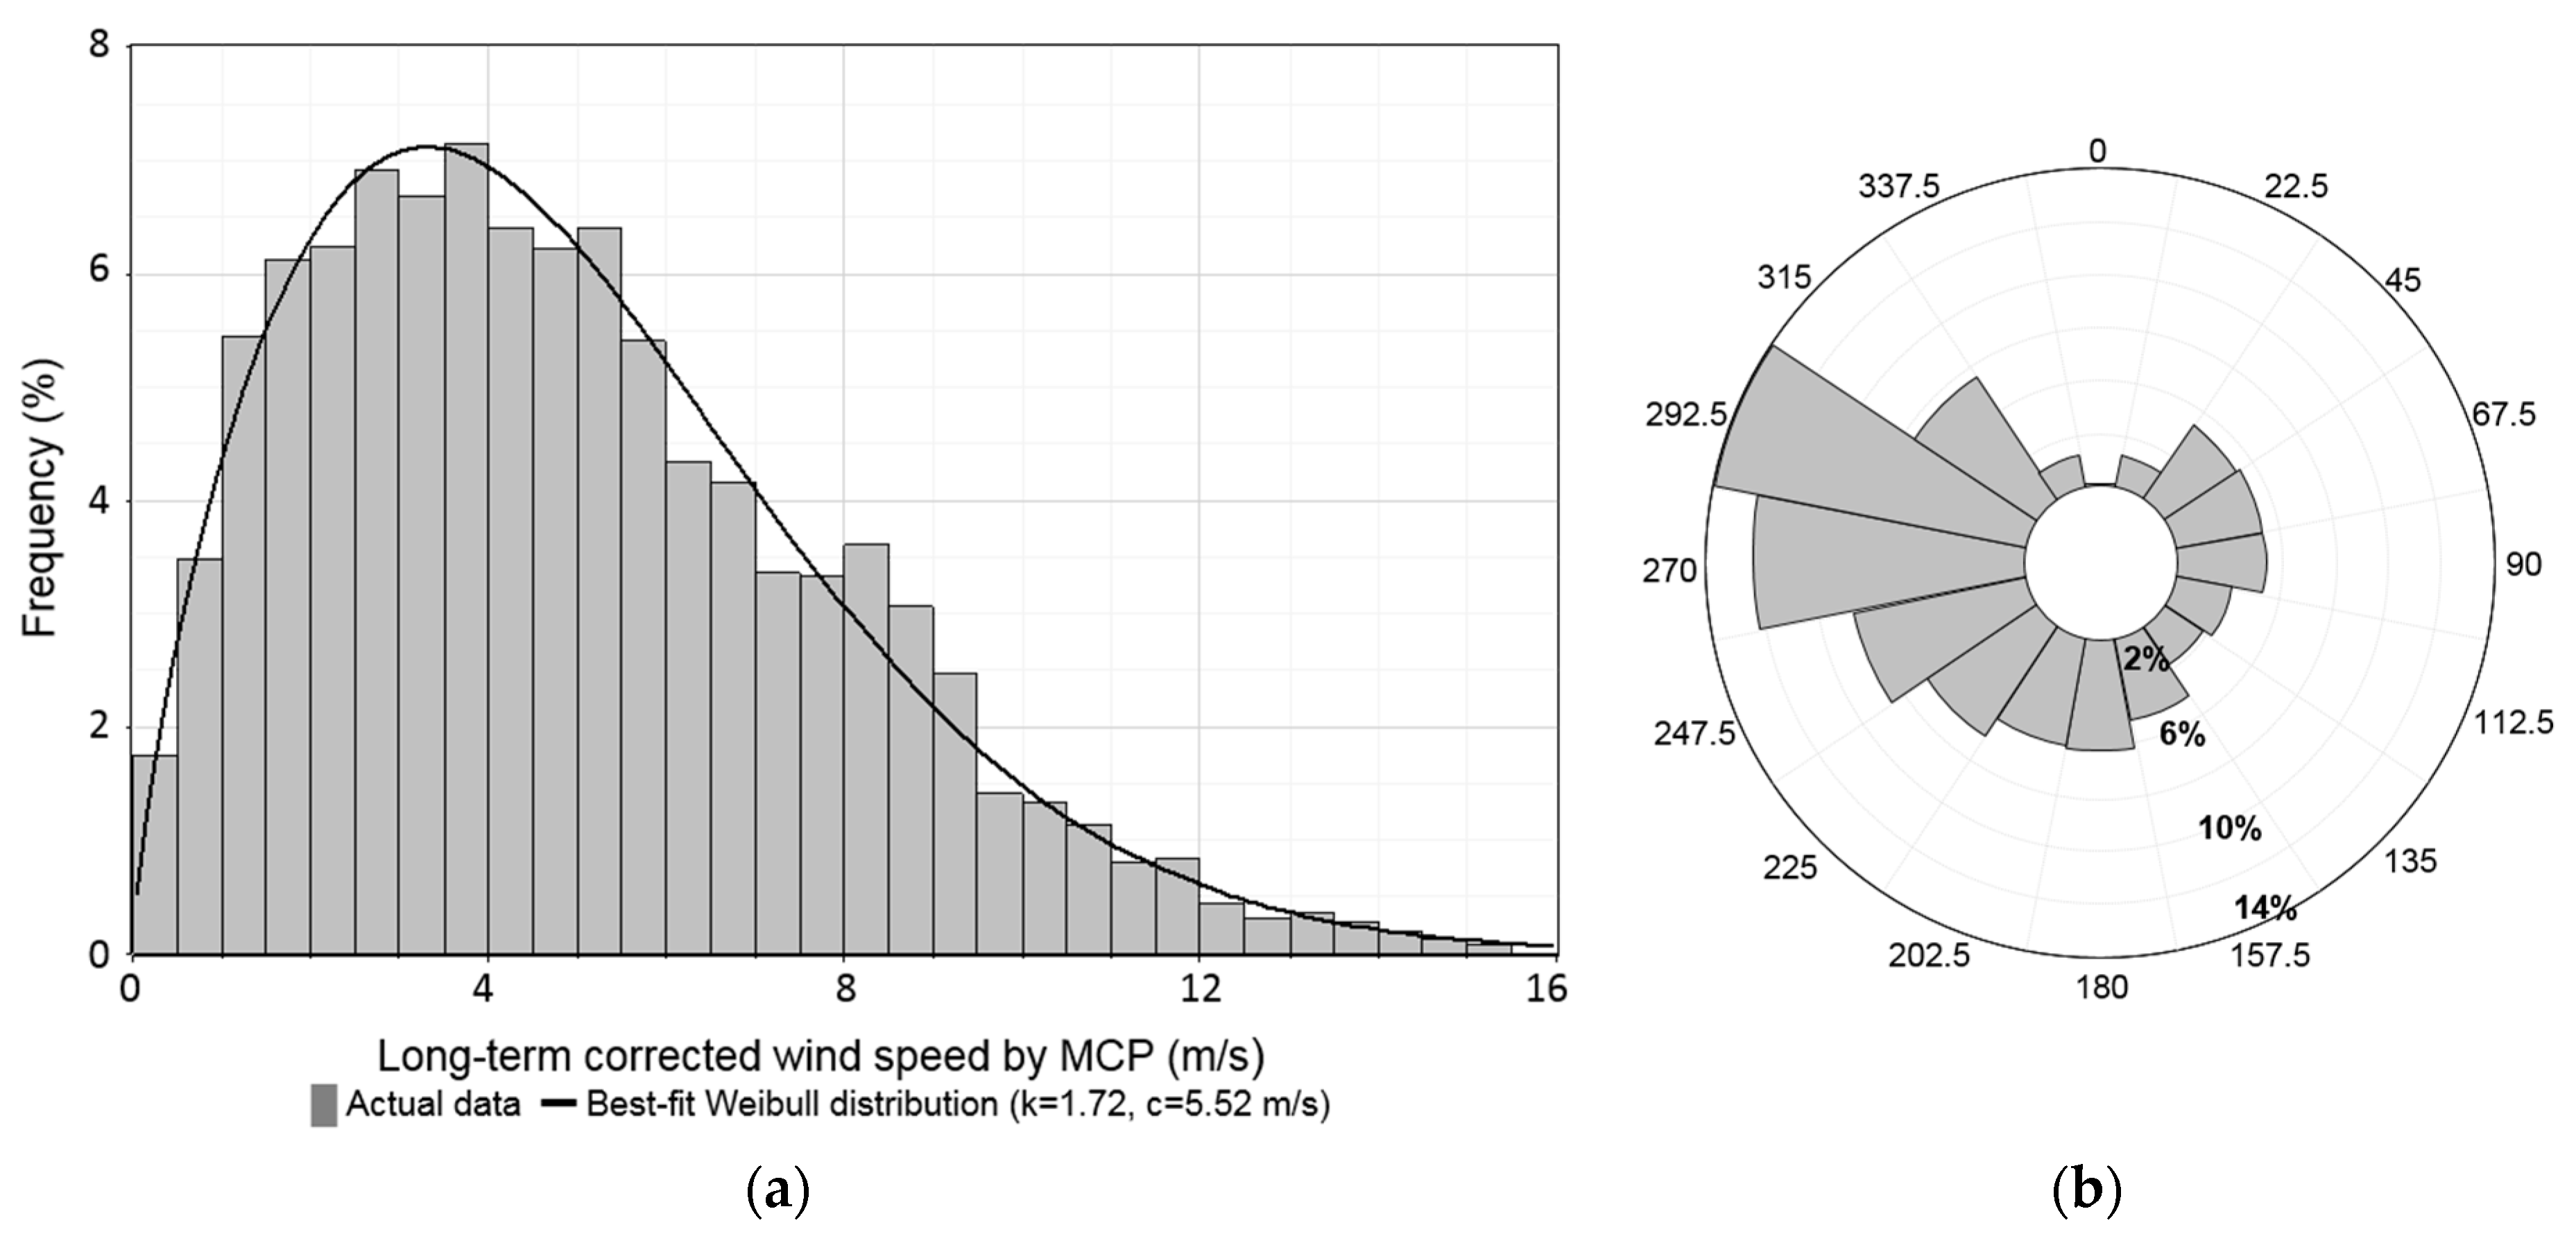
The wind climate, which was extended to one-year data via MCP, at 555 m altitude at the future the Lotte World Tower is as follows (see Figure 13):
- Mean wind speed = 4.9 m/s;
- Wind power density = 160 W/m2 (wind class 1, poor);
- Weibull distribution scale factor c = 5.5 m/s, shape factor k = 1.72; and
- Prevailing wind direction WNW.
3.4. Computational Fluid Dynamics
Figure 14 shows the comparison of simulation results of the main wind direction case, revealing horizontal wind speed variability at the pedestrian level and vertical cross-sectional wind speed variability along the main wind direction (WNW) before and after the construction of the Lotte World Tower.
The CFD analysis results considering only the Lotte World Tower and including all surrounding buildings show that the rooftop of the Tower is impacted by surrounding building groups to a low degree (less than 3% of wind speed), although the pedestrian level wind speeds are largely augmented by the Lotte World Hotel (about 75% of area; left contour plots in Figure 14). This can also be seen in the wind speed variability at the right vertical cross-sectional plots in Figure 14.
The computation load can be significantly reduced by excluding the surrounding buildings. As shown in Figure 15, only three wind directions need to be simulated using the symmetry of the cross-section (in the horizontal, vertical, and diagonal axes). With the CFD analysis on three wind sectors and its projection to 13 other directional sectors, individual wind maps are obtained for a total of 16 wind directional sectors and then weighted using the wind climate in Figure 13.
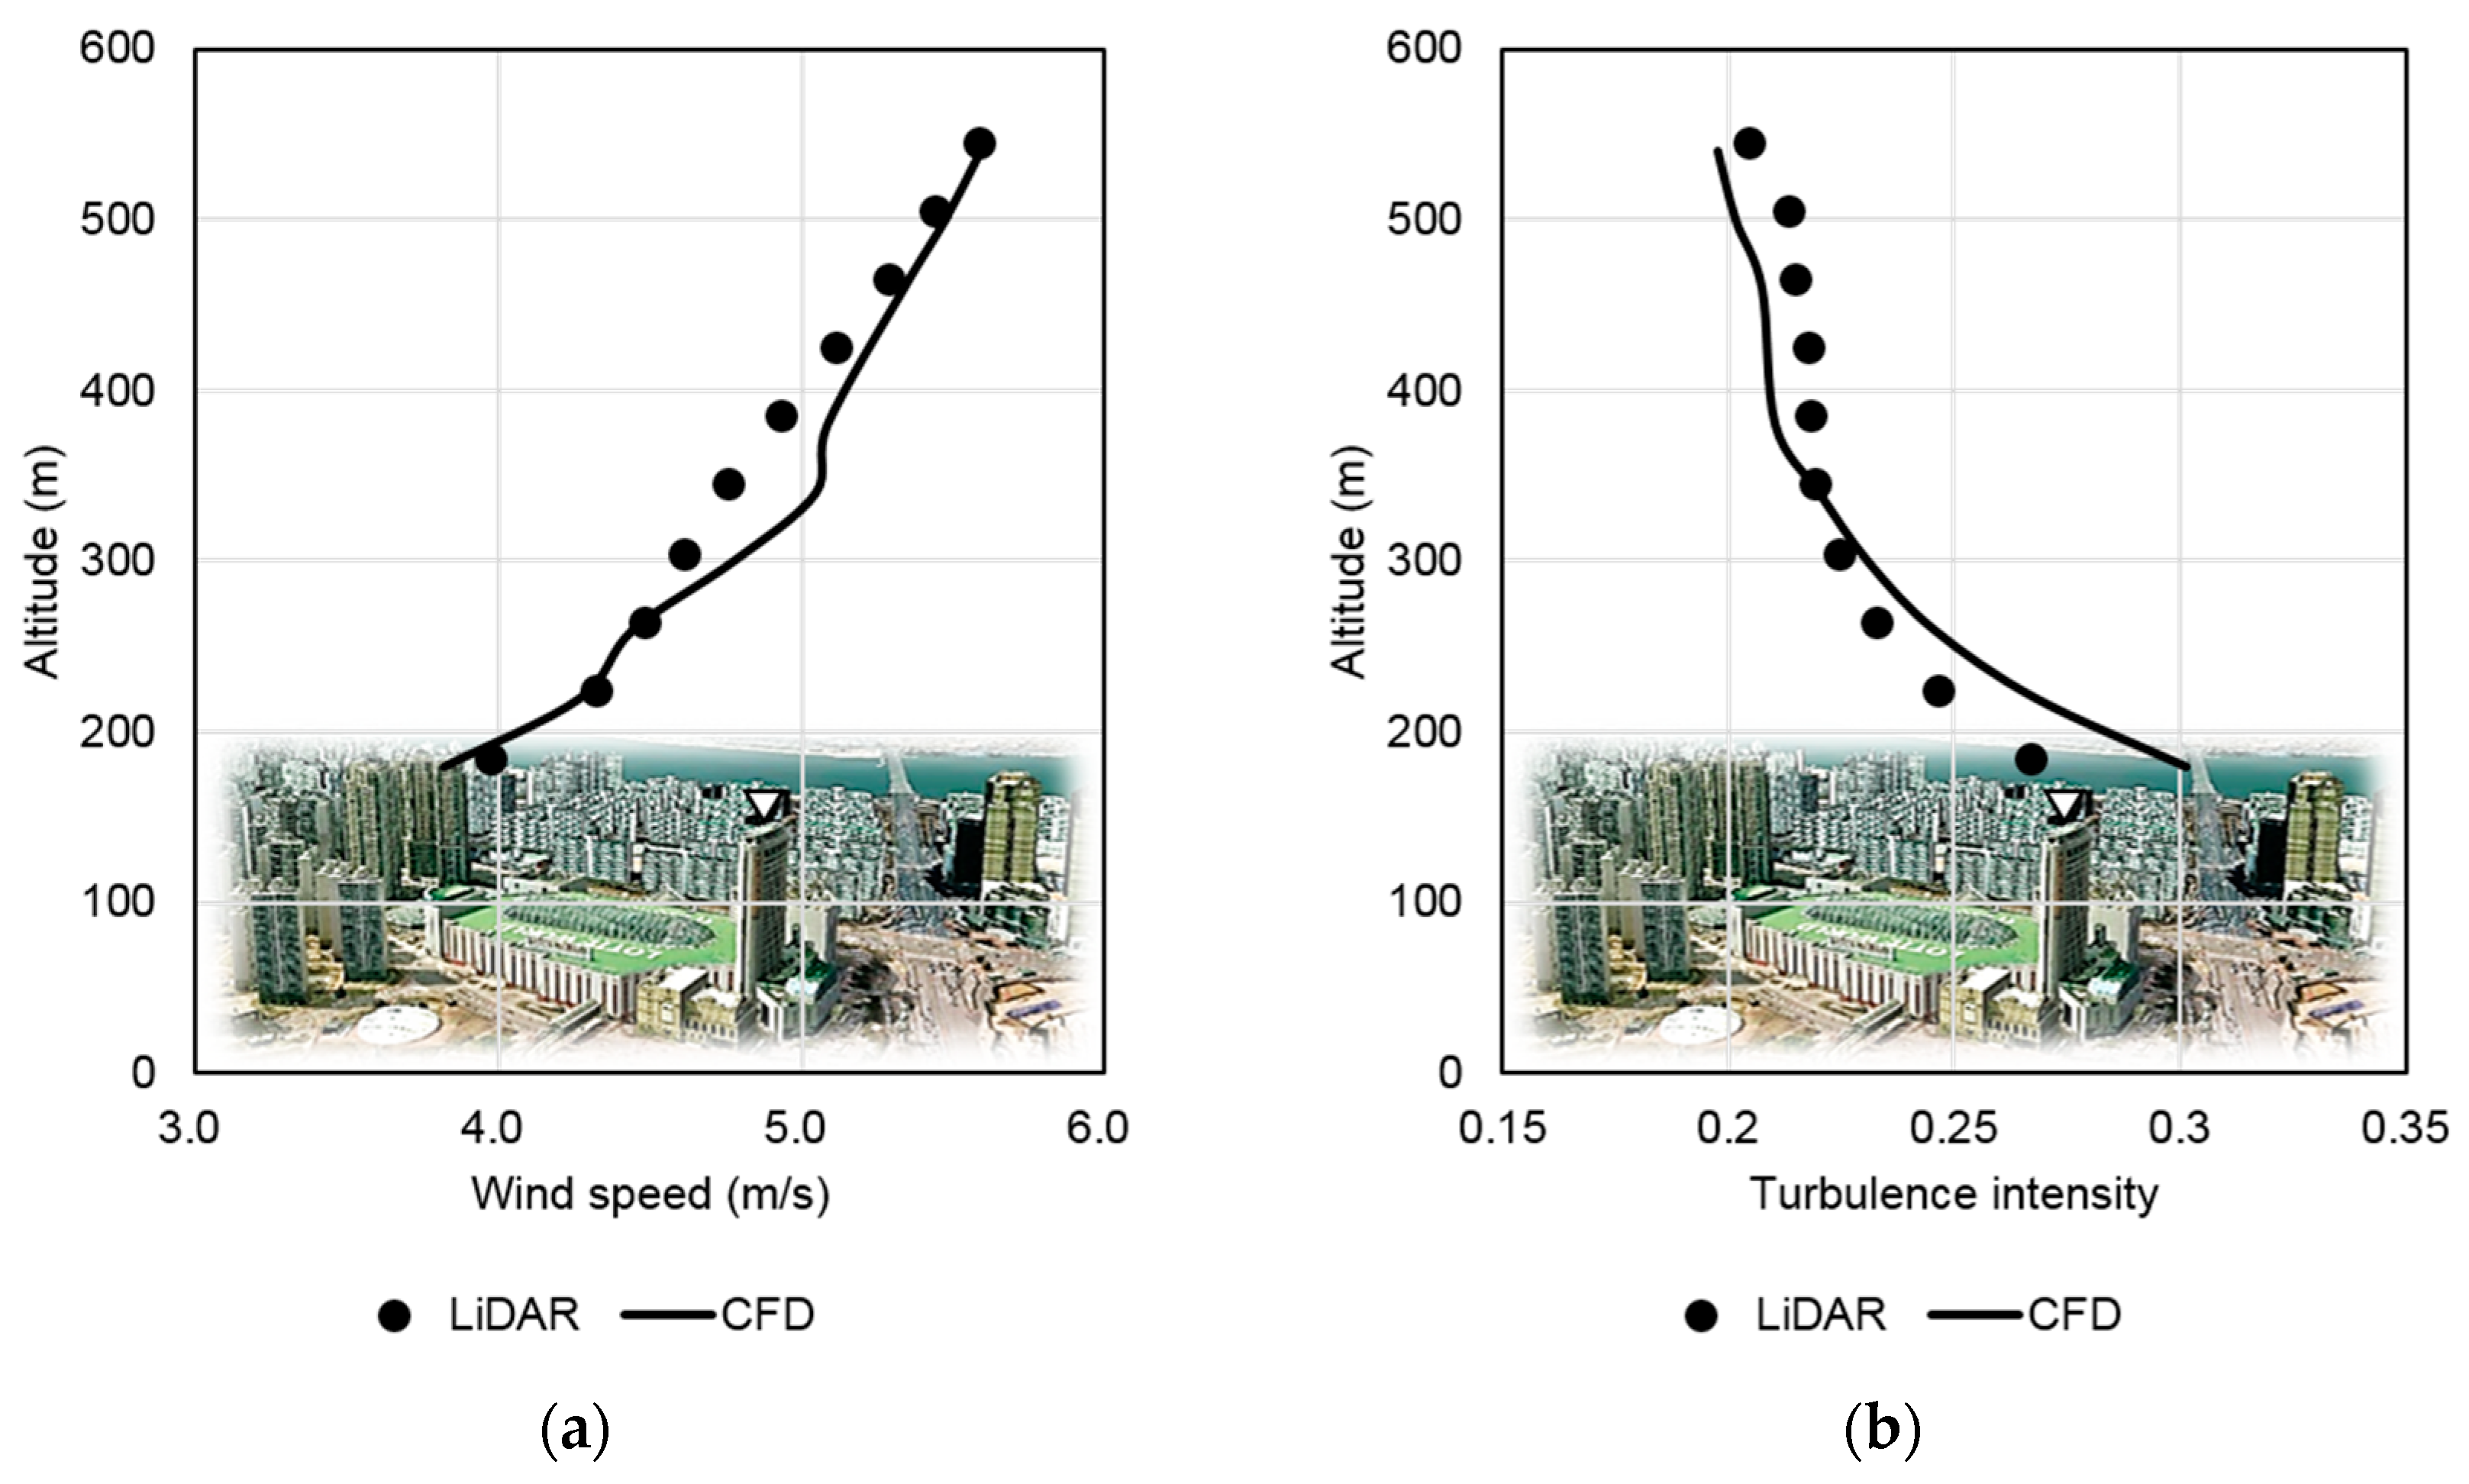
Figure 16 shows the evaluation of the CFD results with the LIDAR measurements when the Lotte World Tower is not simulated. The wind speed and turbulence intensity profiles show good agreement.
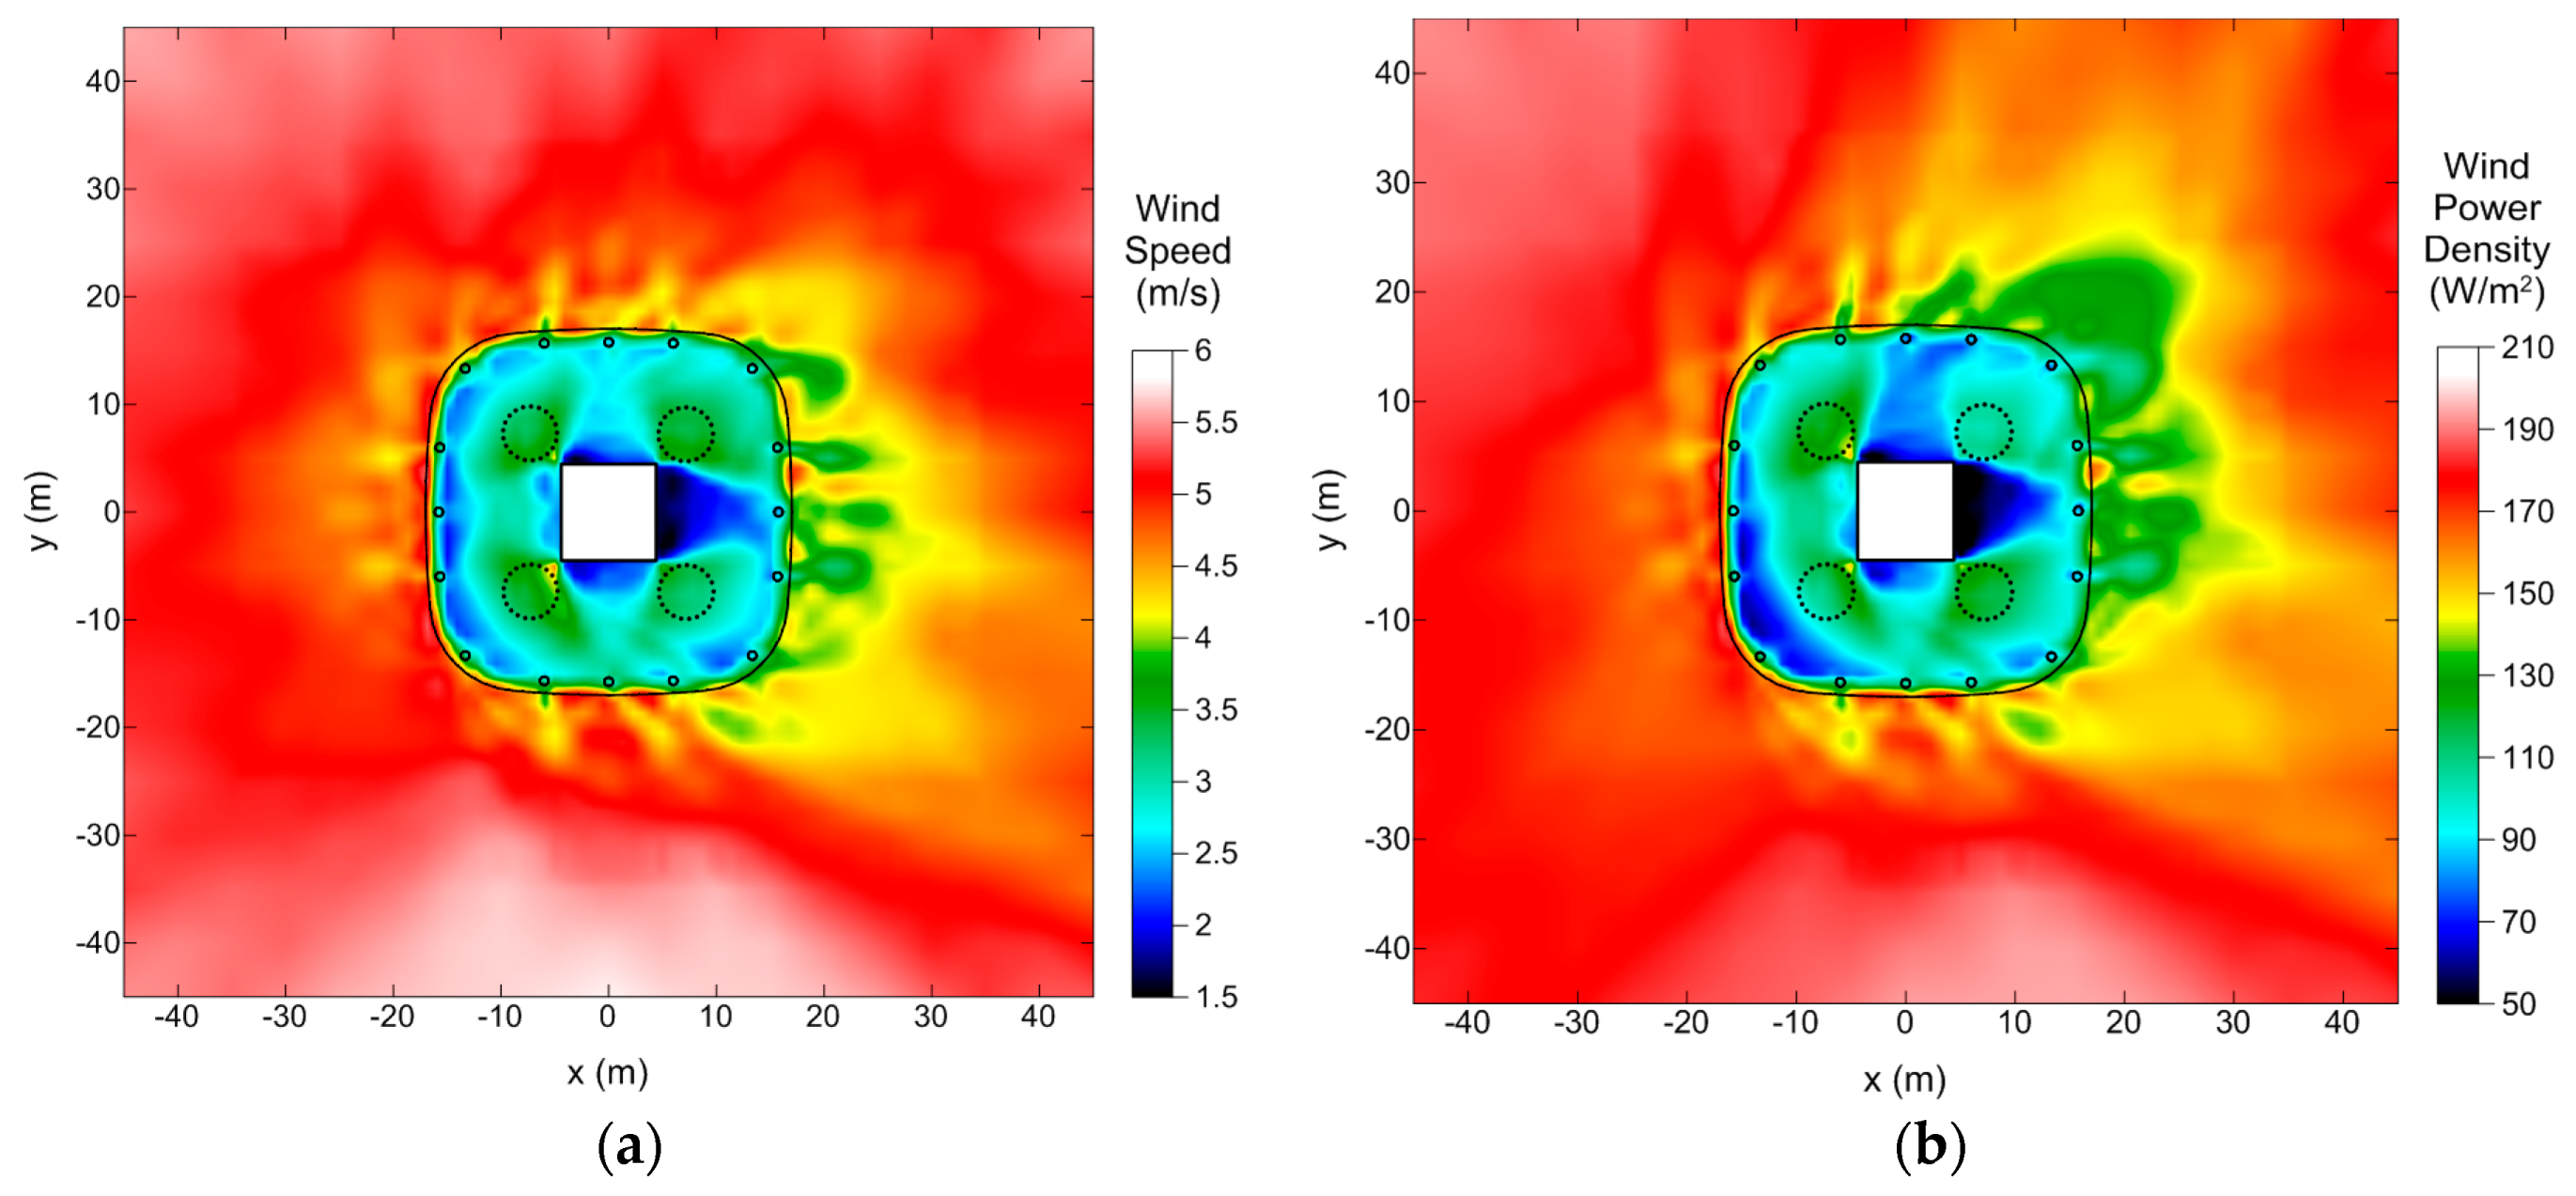
Figure 17 presents a wind resource map at 2 m above the rooftop horizontal plane of the Lotte World Tower revealing the variability of the annual mean wind speed and wind power density. A low wind speed area is identified due to the wake from the square cone located at the center of the rooftop; shelter is also observed from the 16 columns at the external walls in the rooftop. Thus, the four areas marked by the dashed circle are found to be appropriate positions for wind turbine installation because wind speeds and wind power density are some of the highest within a rooftop area. Note that the horizontal axes west–east and south–north are labeled as x-axis and y-axis, respectively. The z-axis directs vertically upward from the ground. The origin is the center of the Tower on the ground.
The BIWT examples discussed in the introduction made efforts to change the building shapes to increase wind speed, but the cone at the center in the rooftop of the Lotte World Tower and columns installed around the external walls reduce the wind instead.
Figure 18 shows the CFD result for the main wind direction when changing the cross-sectional square shape of the cone of the center in the rooftop to a circle. It is noticeable that the low-wind speed wake zone decreases dramatically when changing the cross-section to a circle.
Figure 19a presents a wind power density map when changing the cross section to circular cone. Compared to the square cone case in Figure 17b, the wake area around the cone disappears, and a relatively high wind power density is found.
Figure 19b illustrates the ratio in wind power density between the circular and square cone cases. In particular, wind power density in (+) shape layout is significantly improved compared to (×) shape layout of wind turbines. Using this result, the (+) shape layout of wind turbines for the circular cone case is determined.
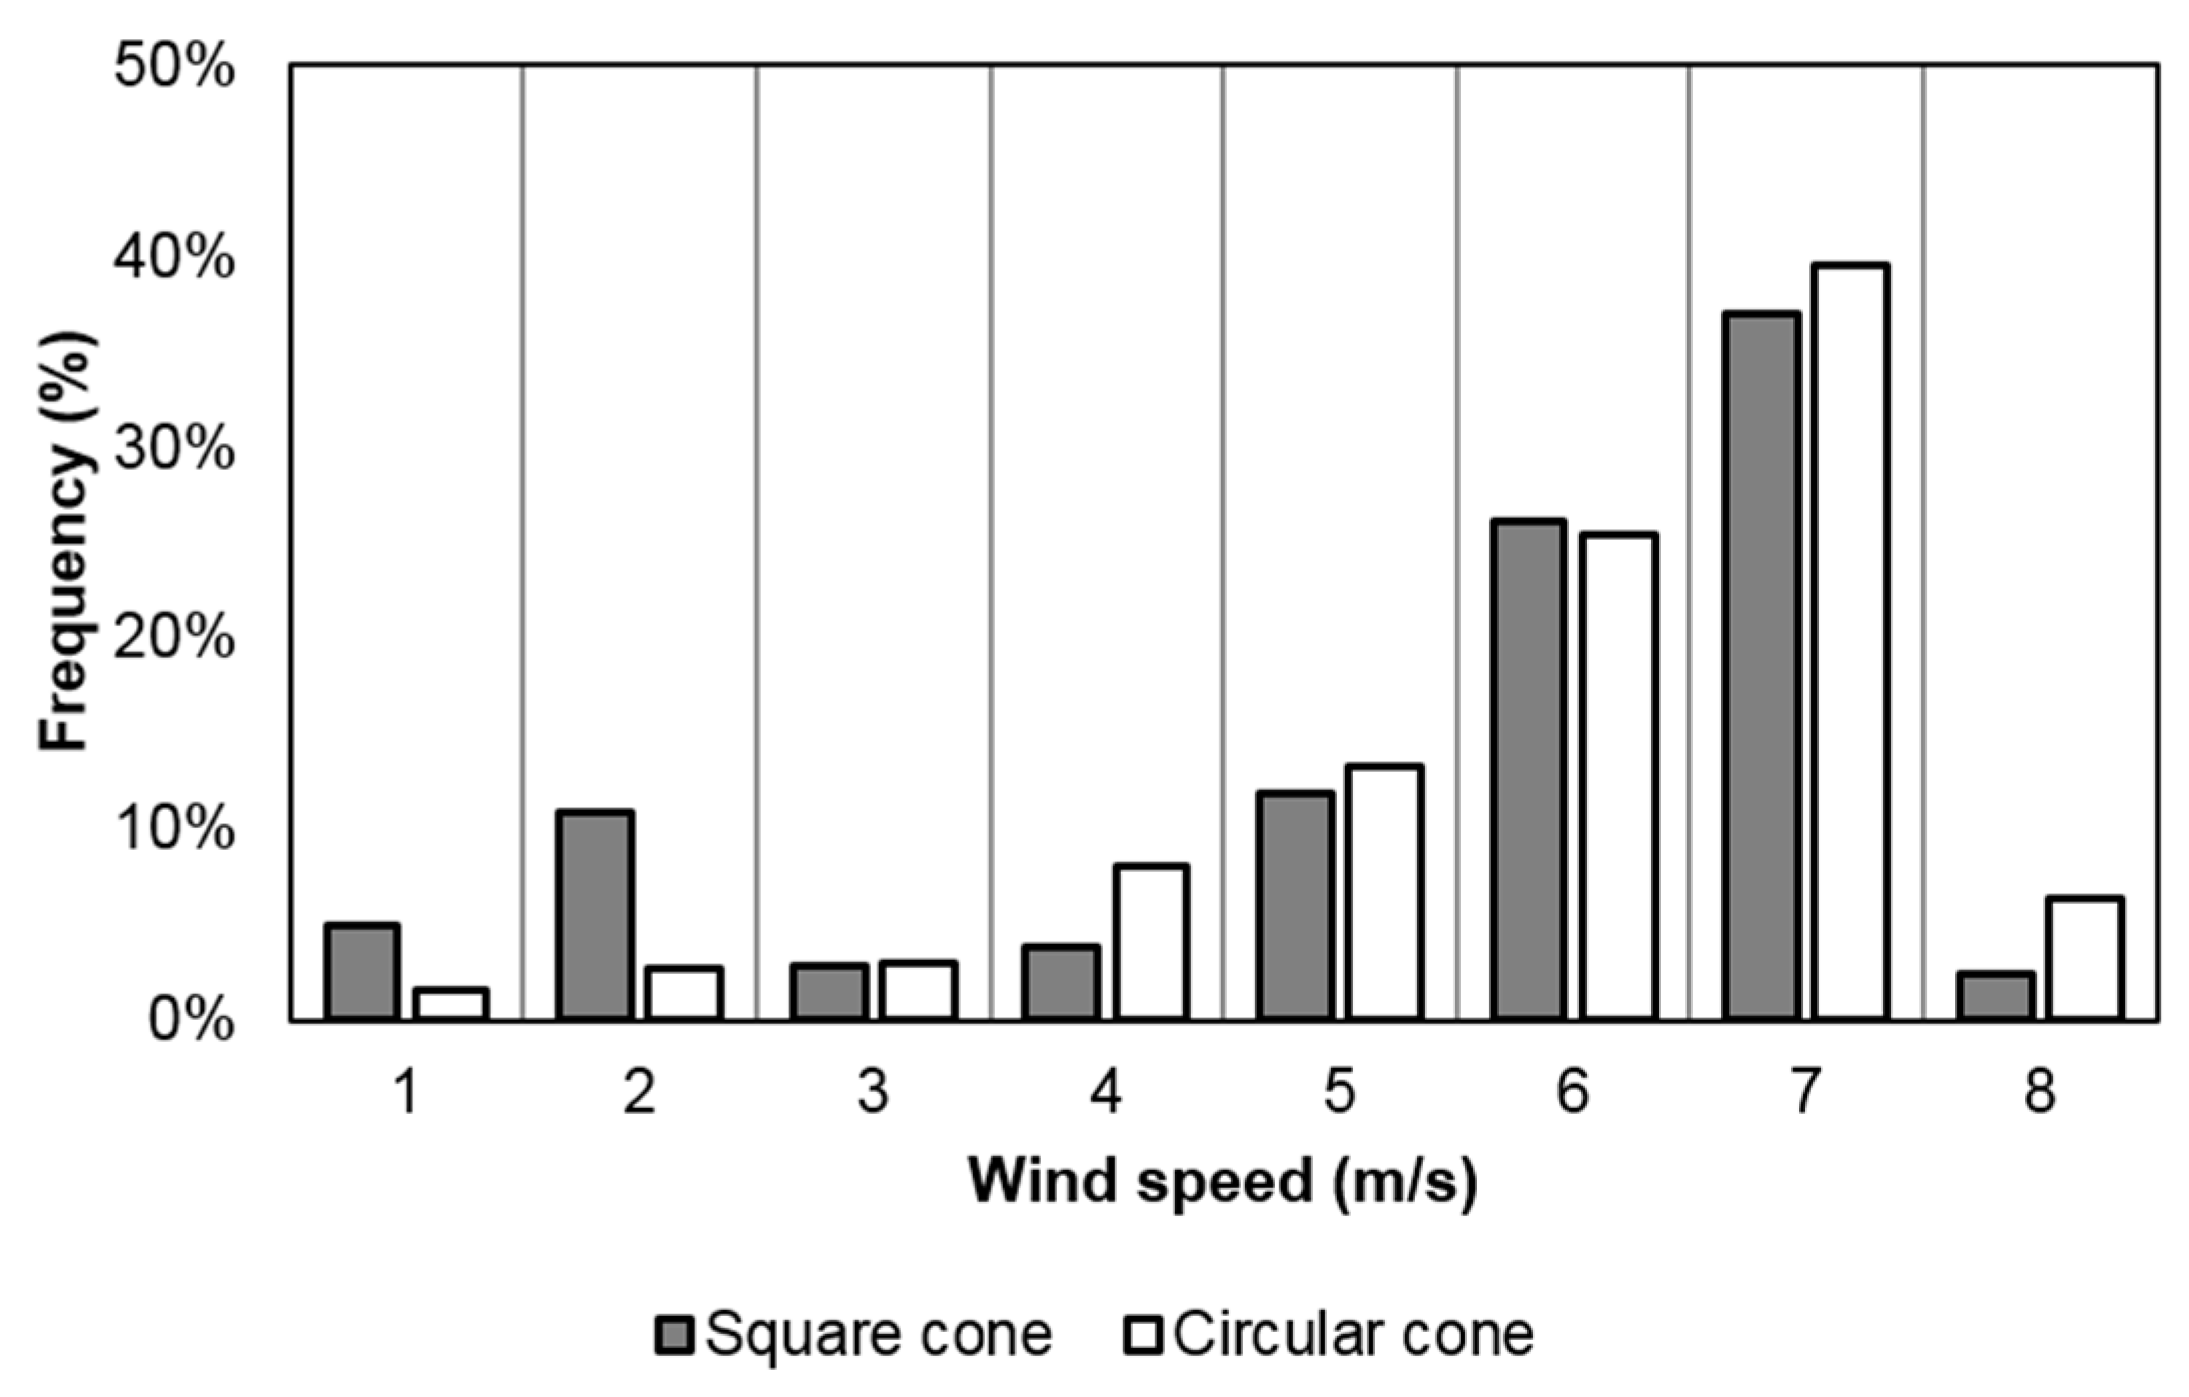
Figure 20 shows the quantitative comparison of probability distribution of wind speed for all sectors between the square and circular cone cases. For the circle case, the frequency of wind speeds below 2 m/s decreases, whereas it increases above 7 m/s compared to the square case.
3.5. Energy Production Calcuations
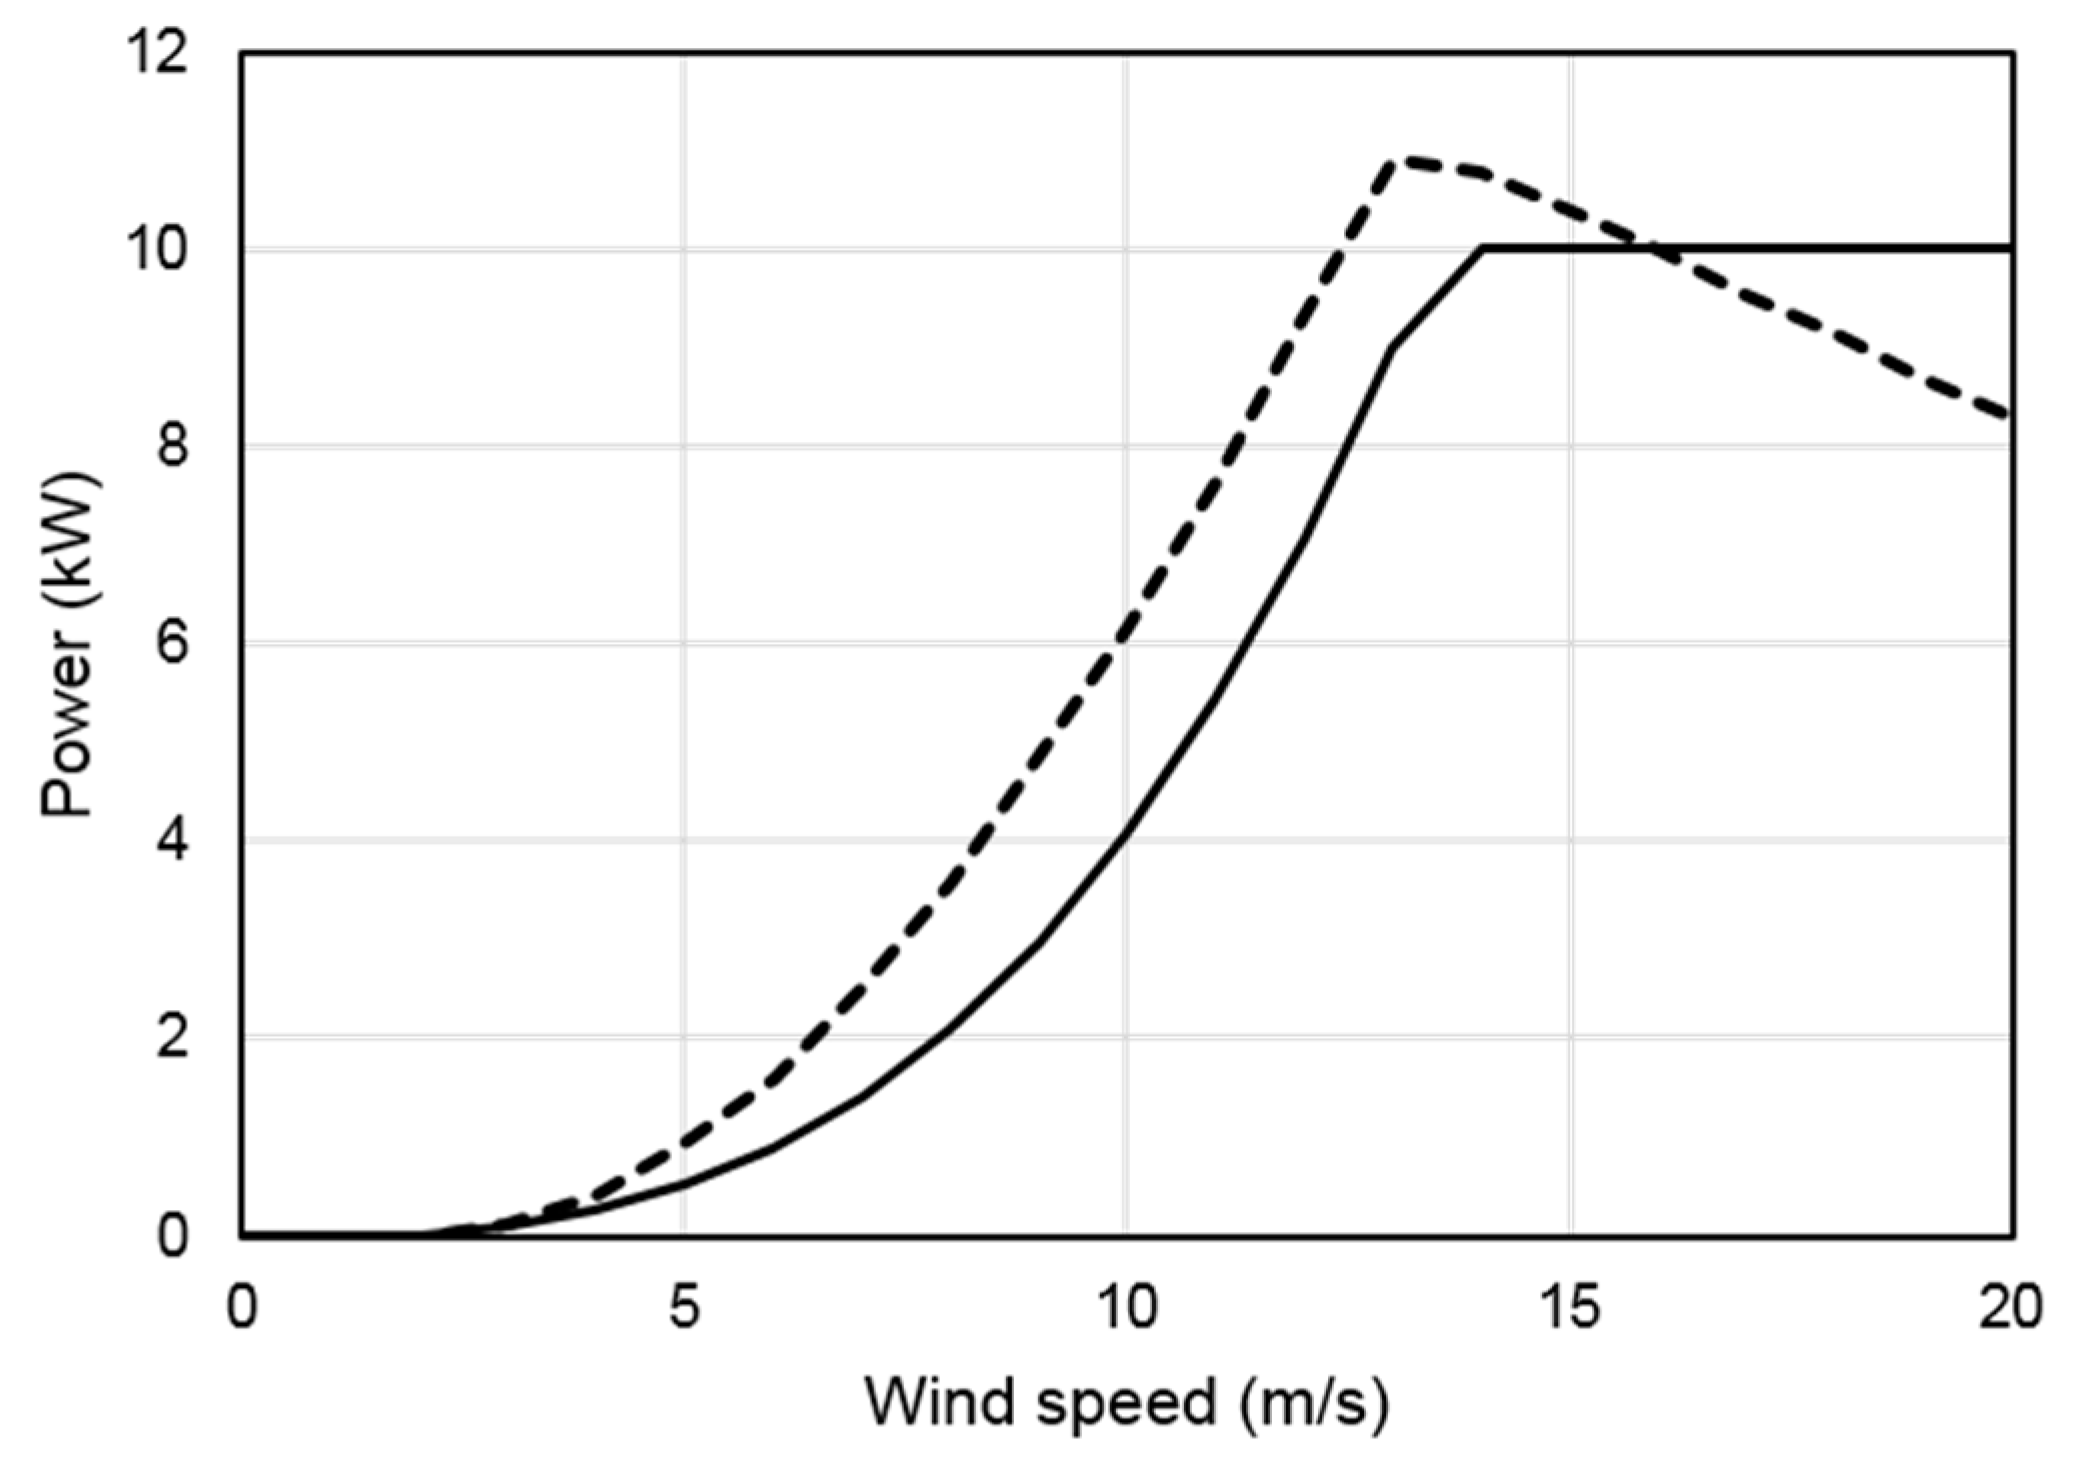
The reference wind turbines, 10 kW GWE-10KH (height: 4.2 m, diameter: 5.3 m) made by Geum-Poong Energy, Inc. (Jeongeup, Korea) is selected, which is a vertical-axis wind turbine, and Excel-S 10 kW (rotor diameter 6.7 m) made by Bergey WindPower Co. (Norman, USA), a horizontal-axis wind turbine. The power curves of the two wind turbines are presented in Figure 21.
Table 1 and Table 2 summarize the annual energy production (AEP) and capacity factor results, respectively, when the vertical-axis wind turbine and horizontal-axis wind turbine are used. Note that the calculation assumed 100% availability and 0% of all type of losses. The AEP significantly increases with only a change in the cross-sectional shape of the structure. More specifically, the AEP for the vertical-axis wind turbine case was increased to 28%, and that for the horizontal-axis wind turbine case, to 27%. The capacity factor of the vertical-axis wind turbine is only 2/3 of that of the horizontal-axis wind turbine.
The capacity factor of the simulated BIWTs can reach only 6.4%. The AEP corresponds to the consumption of 17 persons (1.3 MWh/person in South Korea).
4. Discussion
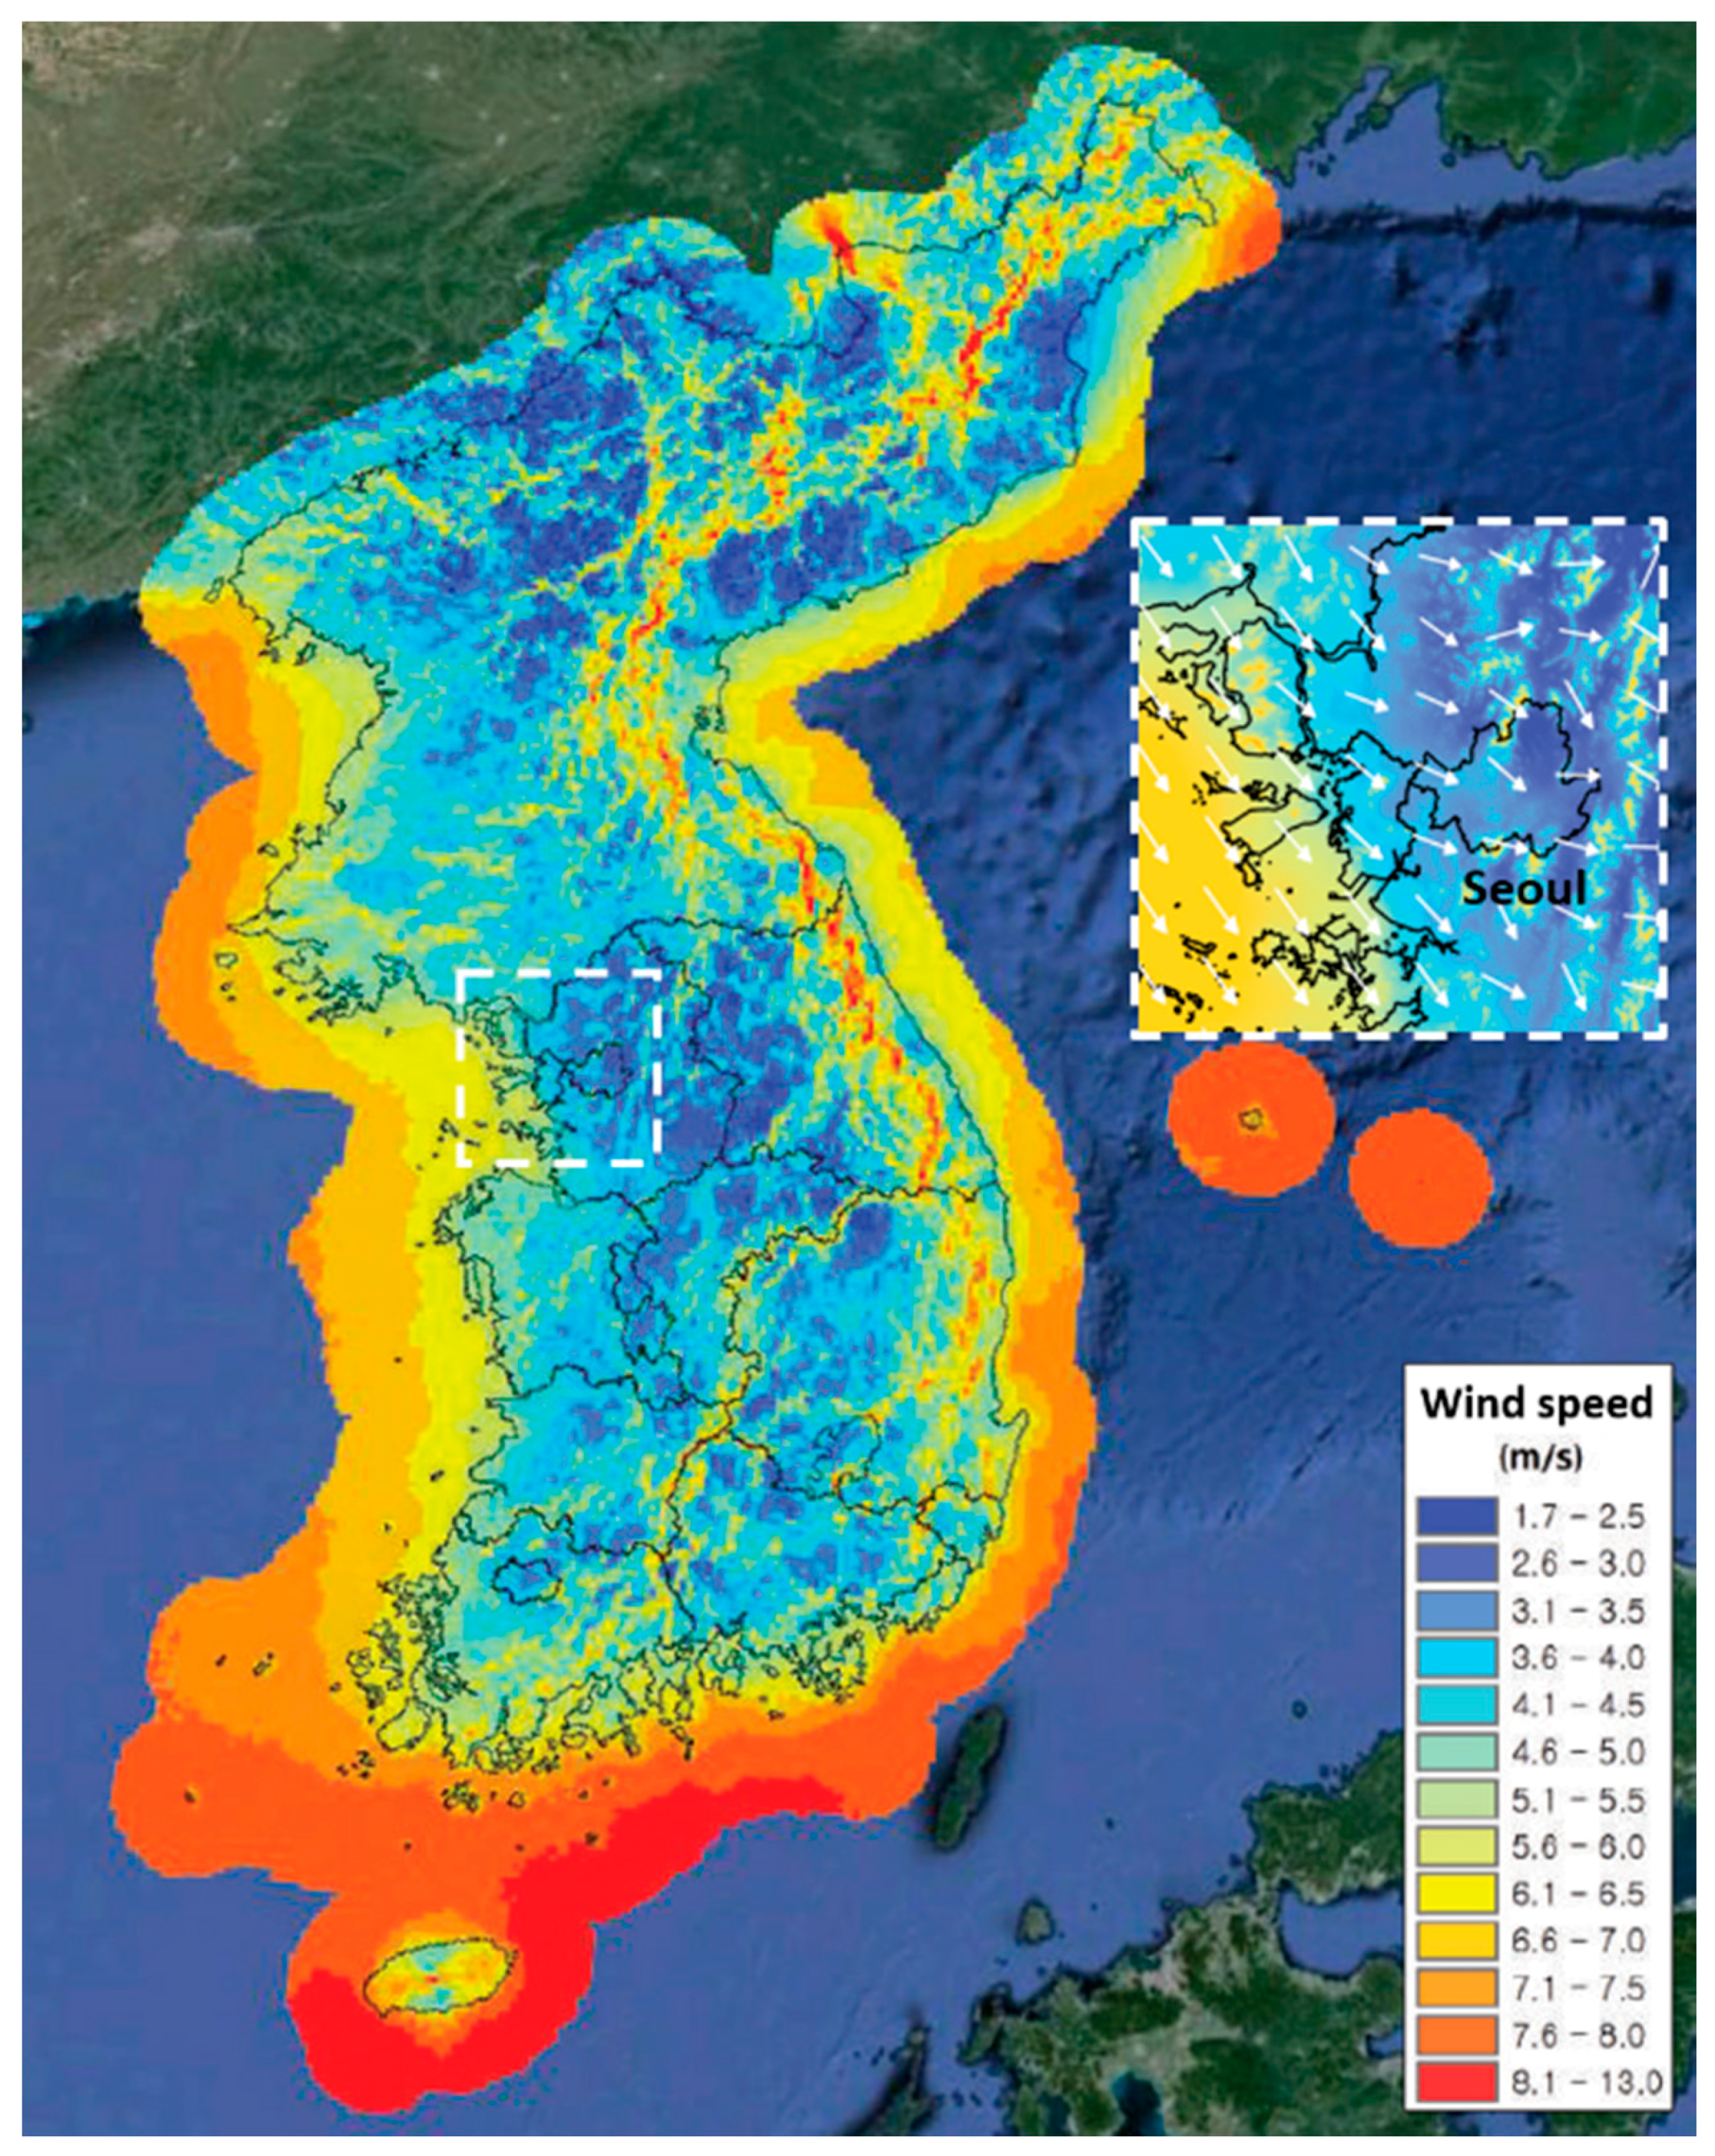
The wind resource in Seoul is weak mainly due to weak synoptic conditions. According to the wind systems in the Korean Peninsula [14], a synoptic wind system is formed where WNW winds blow to the Seoul region along Han River and northwesterly winds approximate from the west sea.
As shown in the wind resource map [15] of Figure 22, as upwind in Seoul, which was wind blow from the west sea at 7 m/s or higher, was infiltrated into the inland, it was weakened into low wind speed due to geographical forcing caused by urban canopy in Seoul metropolitan in particular as well as friction with the land as shown in Figure 10. A mean wind speed and wind power density were changed into weak wind power resource as 4.1 m/s and 108 W/m2 at the location around the Lotte World Tower.
5. Conclusions
Based on our findings, the BIWTs were not considered at the Lotte World Tower. However, we established a procedure for wind resource assessment for high-rise BIWTs by combining RS, NWP, and CFD.
The data recovery rate of ground-based remote sensing decreased dramatically. It is very important to perform reconstruction of full wind climate data for at least one year using long-term correction via NWP and MCP methods. Moreover, it is anticipated to perform longer remote-sensing measurements to mitigate uncertainties caused by seasonal variation of wind climate.
Wind conditions can change considerably depending on the building shape, CFD simulation is therefore needed to analyze the effect of building shape accurately. Modifying the building shape results in up to 30% improvement in the power density and large changes in spatial variability.
The wind resource around the Lotte World Tower is very poor despite its high altitude (555 m) because it is located inland of the Korean Peninsula. However, it should be noted that the surrounding buildings of the Lotte World Tower do not directly influence the wind speed at 555 m according to the CFD simulation.
Changes in building shape resulted in a capacity factor of only 7%, thus the BIWTs are not economically feasible.
Acknowledgments
This work was conducted under the framework of Research and Development Program of the Korea Institute of Energy Research (KIER; GP2014-0030).
Author Contributions
Hyun-Goo Kim assumed responsibility for the wind resource assessment of BIWT by compiling the RS, NWP, and CFD results and wrote the paper; Wan-Ho Jeon contributed to CFD simulation; and Dong-Hyeok Kim conceived and designed the LIDAR and SODAR remote-sensing campaign. All authors read and approved the manuscript.
Conflicts of Interest
The authors declare no conflict of interest.
Abbreviations
The following abbreviations are used in this manuscript:
| AEP | Annual Energy Production |
| BAWT | Building-Augmented Wind Turbine |
| BIWT | Building-Integrated Wind Turbine |
| CFD | Computational Fluid Dynamics |
| DRR | Data Recovery Rate |
| MCP | Measure-Correlate-Predict |
| NWP | Numerical Weather Prediction |
| RANS | Reynolds-Averaged Navier-Stokes |
| RS | Remote Sensing |
| WRF | Weather Research Forecasting |
| UCM | Urban Canopy Model |
References
- Rouse, R. The Pyramids of Egypt. 2016. Available online: https://public.tableau.com/en-us/s/gallery/pyramids-egypt (accessed on 12 December 2016).
- Ken, B. Sustainable Architecture and Simulation Modelling; Dublin Institute of Technology: Dublin, Ireland, 2001. [Google Scholar]
- Doerr Architecture. Definition of Sustainability and the Impacts of Buildings. 2003. Available online: http://www.doerr.org/services/sustainability.html (accessed on 12 December 2016).
- Smith, R.F.; Killa, S. Bahrain World Trade Center (BWTC): The first large-scale integration of wind turbines in a building. Struct. Des. Tall Spec. Build. 2007, 16, 429–439. [Google Scholar] [CrossRef]
- Cochran, B.C.; Damiani, R.R. Integrating Wind Energy into the Design of Tall Buildings—A Case Study of the Houston Discovery Tower. In Proceedings of the American Wind Energy Association’s WINDPOWER 2008 Conference & Exhibition, Houston, TX, USA, 1–4 June 2008.
- Li, Q.S.; Shu, Z.R.; Chen, F.B. Performance assessment of tall building-integrated wind turbines for power generation. Appl. Energy 2016, 165, 777–788. [Google Scholar] [CrossRef]
- Stuart, A.; Mark, W. Strata SE1, London, UK: The First In-House Wind Generator. Struct. Eng. Int. 2011, 21, 37–40. [Google Scholar]
- Chen, F.; Kusaka, H.; Bornstein, R.L.; Ching, J.; Grimmond, C.S.B.; Grossman-Clarke, S.; Loridan, T.; Manning, K.W.; Martilli, A.; Miao, S.; et al. The integrated WRF/urban modelling system: Development, evaluation, and applications to urban environmental problems. Int. J. Climatol. 2011, 31, 273–288. [Google Scholar] [CrossRef]
- Macdonald, R.W.; Griffiths, R.F.; Hall, D.J. An improved method for estimation of surface roughness of obstacle arrays. Atmos. Environ. 1998, 32, 1857–1864. [Google Scholar] [CrossRef]
- Kato, M.; Launder, B.E. The modeling of turbulence flow around stationary and vibrating square cylinders. In Proceedings of the 9th Symposium on Turbulence Shear Flows, Kyoto, Japan, 16–18 August 1993.
- Lien, F.S.; Yee, E.; Cheng, Y. Simulation of mean flow and turbulence over a 2D building array using high-resolution CFD and a distributed drag force approach. J. Wind Eng. Ind. Aerodyn. 2004, 92, 117–158. [Google Scholar] [CrossRef]
- Gryning, S.E.; Floors, R.R.; Peña, A.; Batchvarova, E.; Brümmer, B. Weibull wind-speed distribution parameters derived from a combination of wind-lidar and tall-mast measurements over land, coastal and marine sites. Bound. Layer Meteorol. 2016, 159, 329–348. [Google Scholar] [CrossRef] [Green Version]
- Rogers, A.L.; Rogers, J.W.; Manwell, J.F. Comparison of the performance of four measure-correlate-predict algorithms. J. Wind Eng. Ind. Aerodyn. 2005, 93, 243–264. [Google Scholar] [CrossRef]
- Kim, J.S.; Kim, H.G.; Park, H.D. Surface wind regionalization based on similarity of time-series wind vectors. Asian J. Atmos. Environ. 2016, 10, 80–89. [Google Scholar] [CrossRef]
- Korea Institute of Energy Research. Korea New and Renewable Energy Resource Atlas, 2nd ed.; Ministry of Science, ICT and Future Planning, New and Renewable Energy Resource Center: Daejeon, Korea, 2015; Available online: http://www.kier-solar.org/pdf/getFile.do?type=WIND (accessed on 12 December 2016).
Figure 1.
The Bahrain World Trade Center: (a) photo from the front of the wind turbines; and (b) contour plot of wind speed on a horizontal cross-sectional plane at 100 m aboveground (CFD by the authors).
Figure 1.
The Bahrain World Trade Center: (a) photo from the front of the wind turbines; and (b) contour plot of wind speed on a horizontal cross-sectional plane at 100 m aboveground (CFD by the authors).
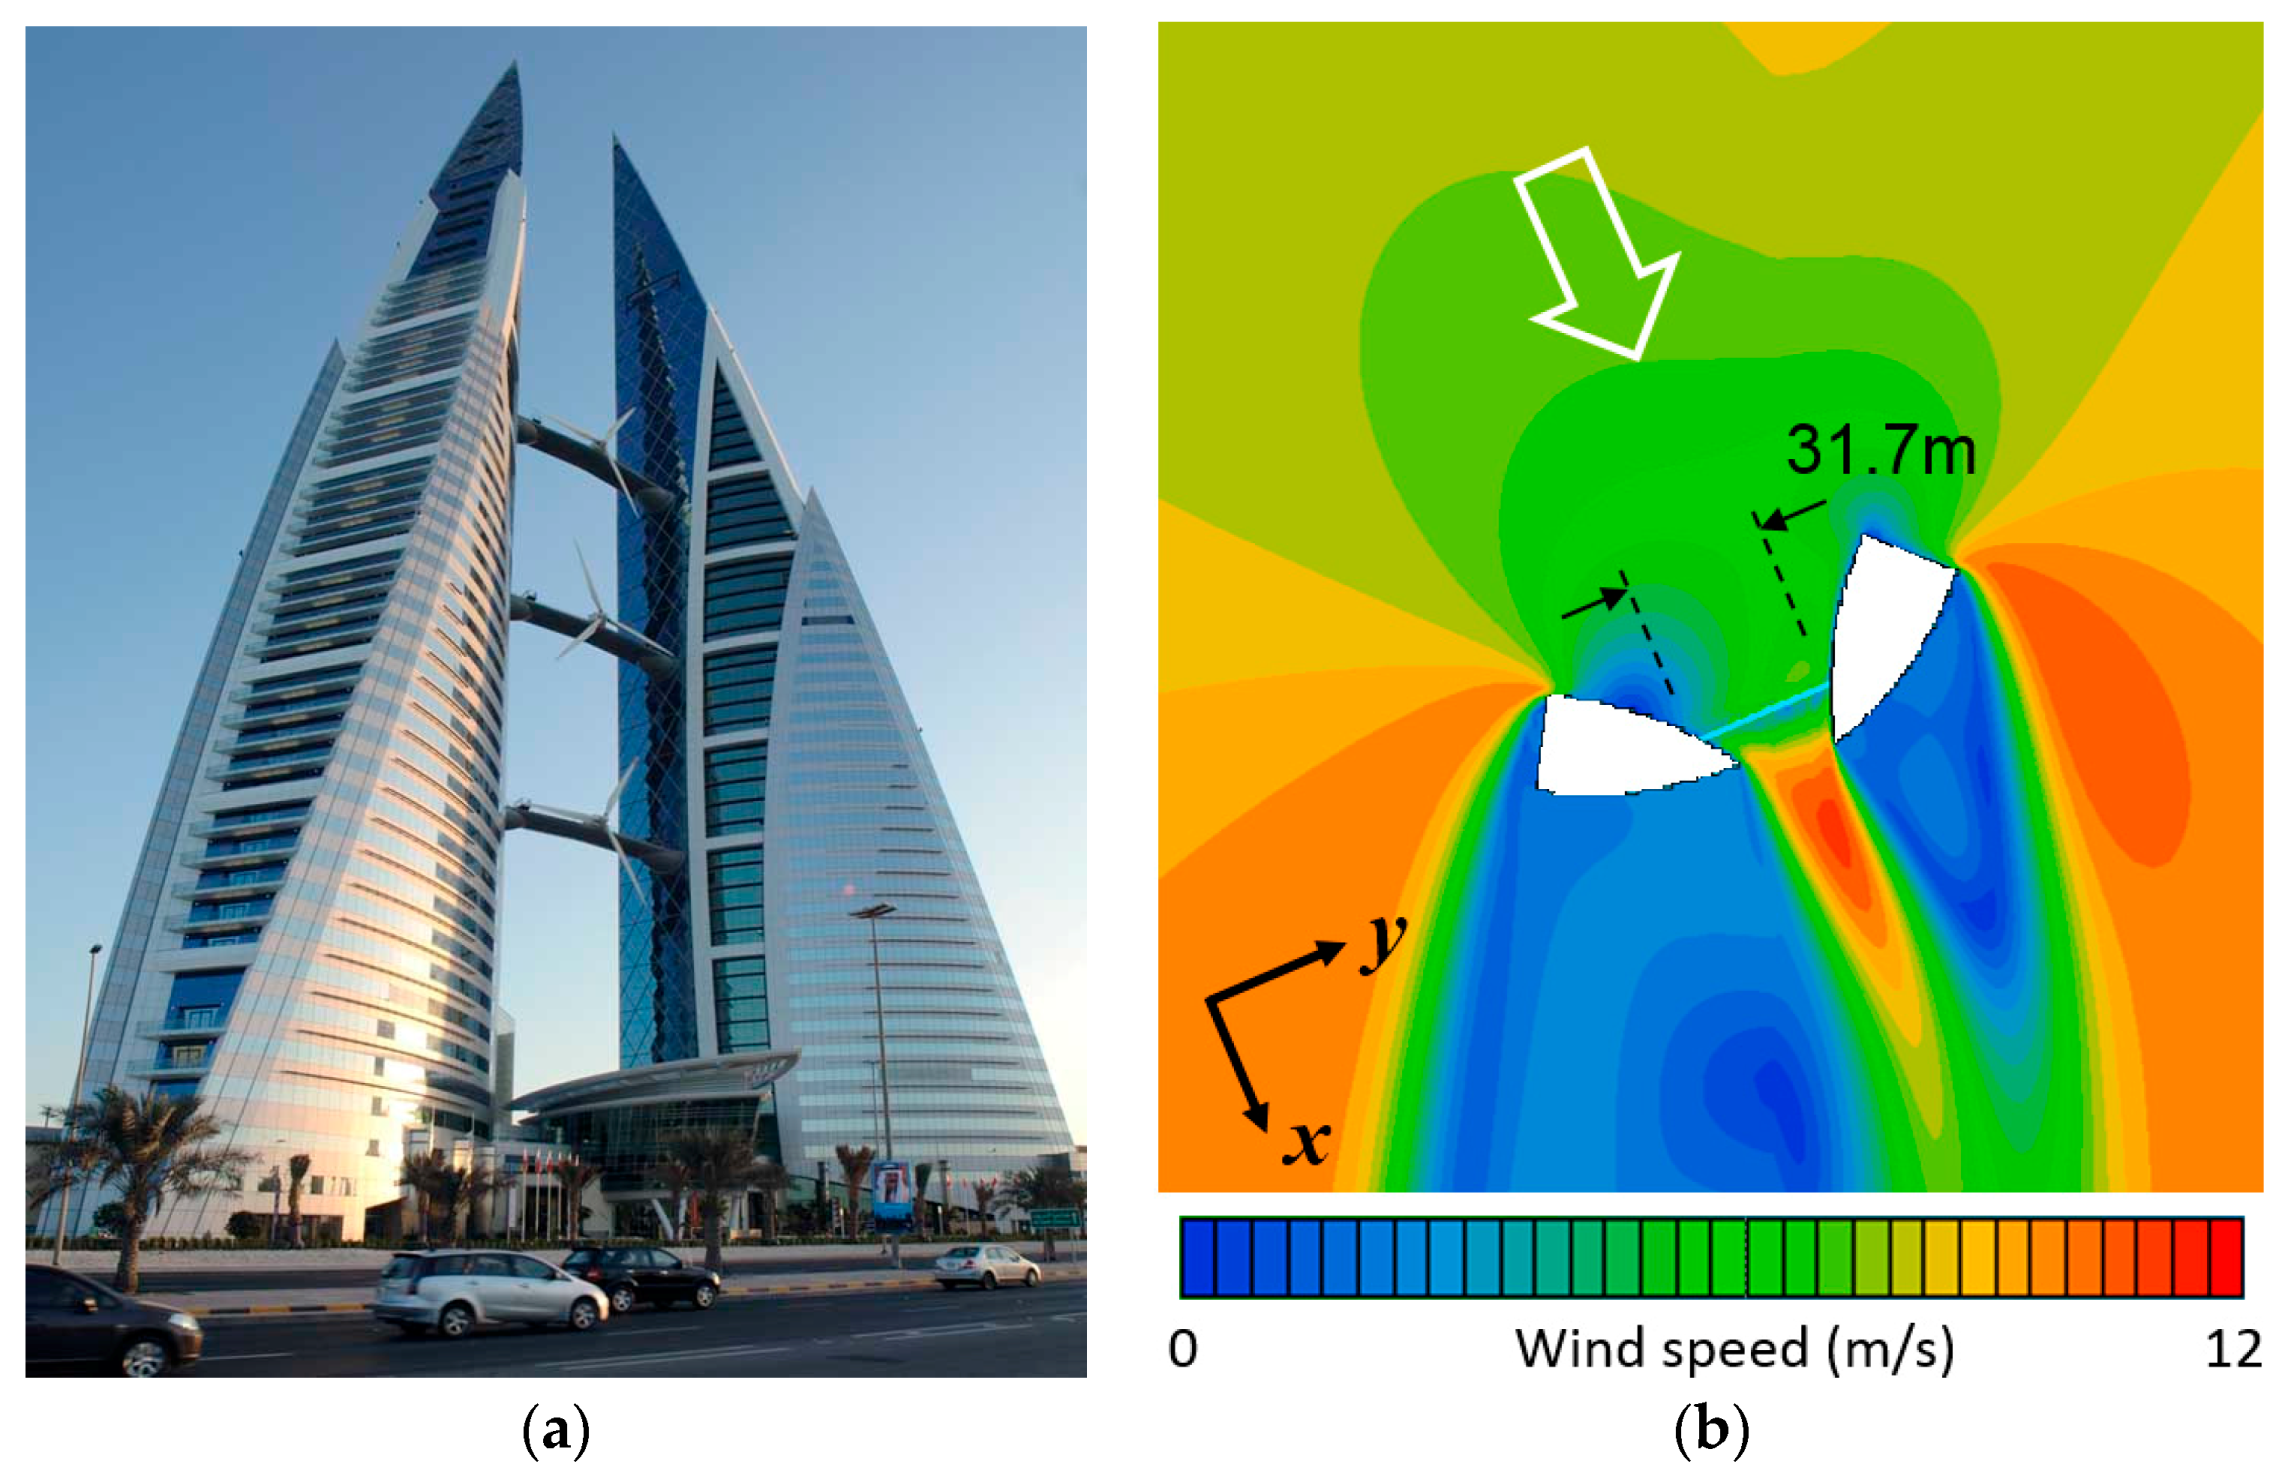
Figure 2.
The Hess Tower: (a) photo from the front of the wind turbines; and (b) contour plot of wind speed on a vertical cross-sectional plane (CFD by the authors).
Figure 2.
The Hess Tower: (a) photo from the front of the wind turbines; and (b) contour plot of wind speed on a vertical cross-sectional plane (CFD by the authors).
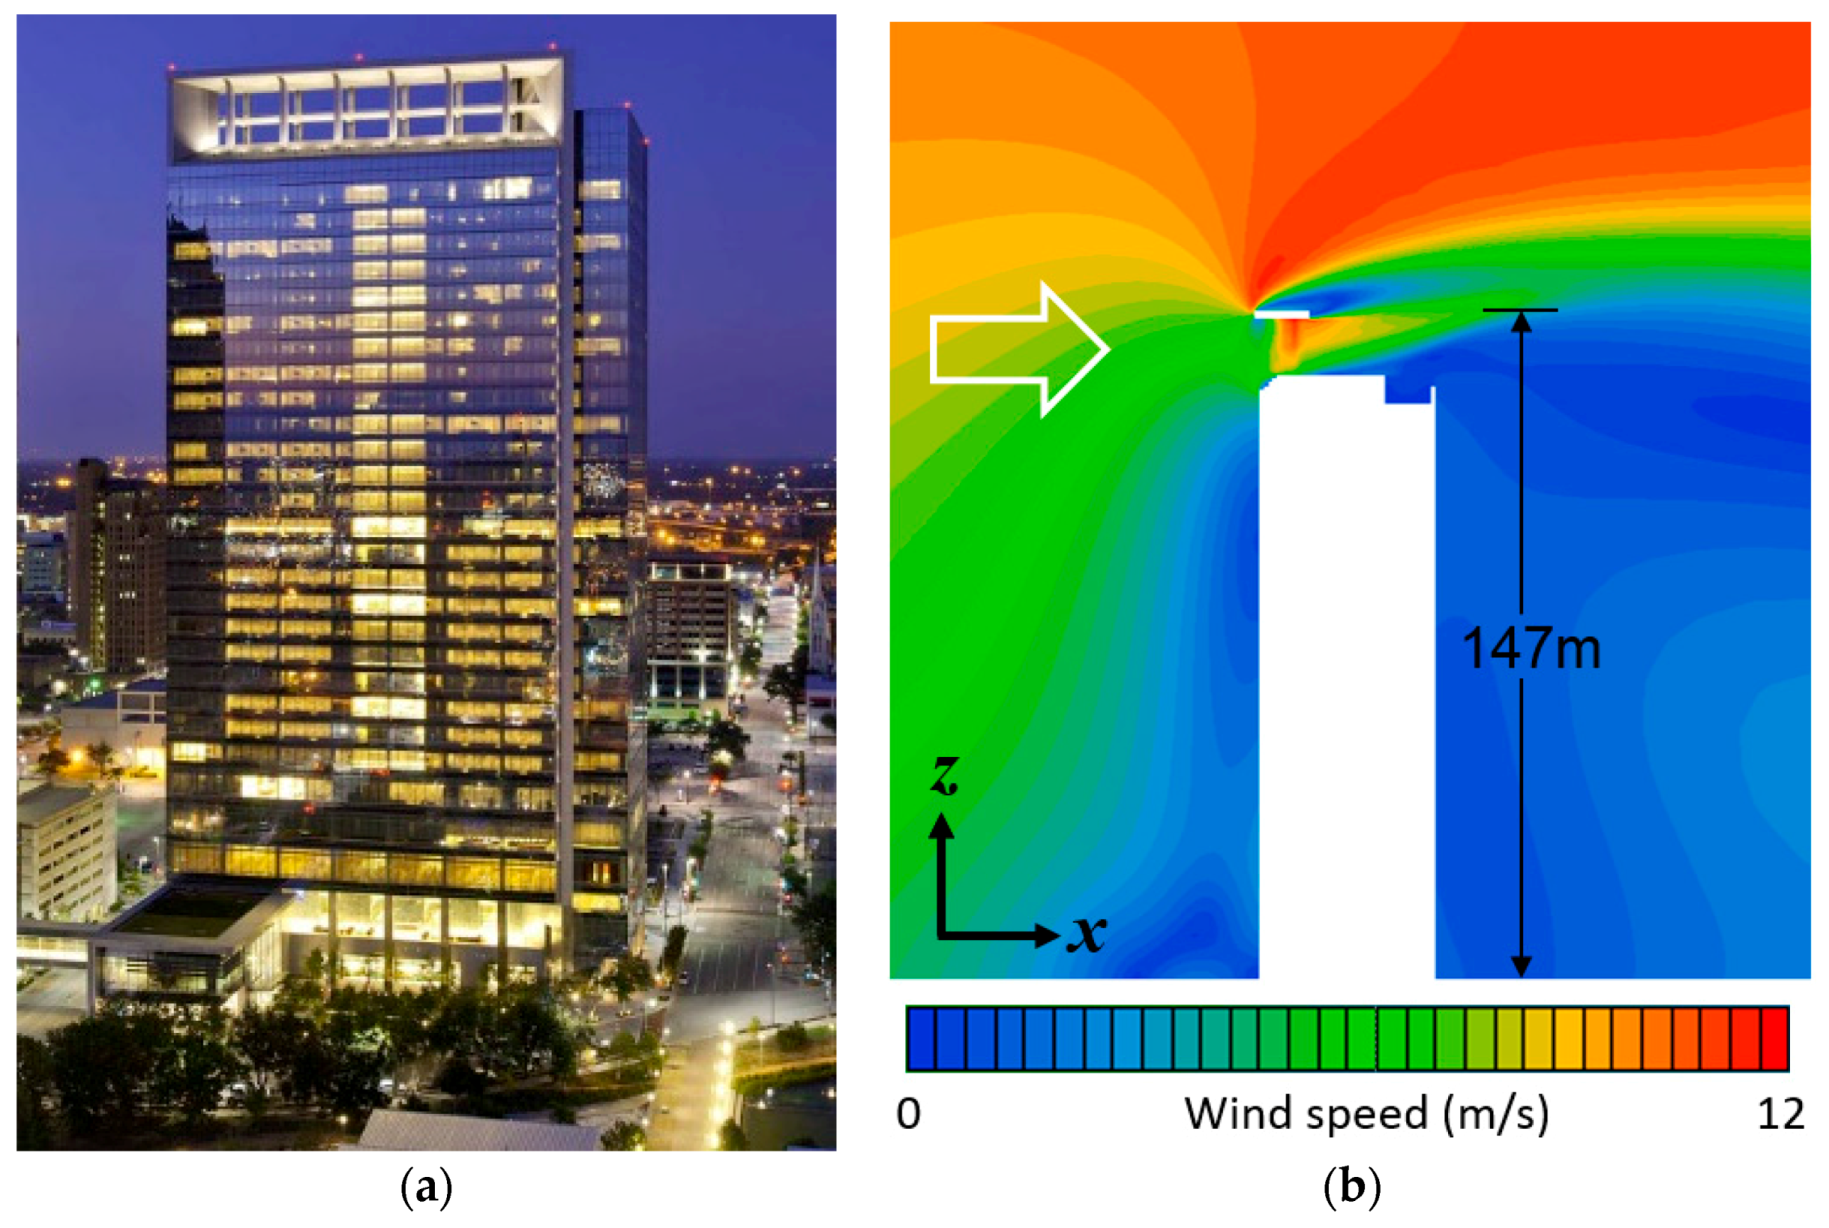
Figure 3.
The Pearl River Tower: (a) photo of front view; (b) wind penetration structure; and (c) contour plot of wind speed on a horizontal cross-sectional plane (CFD by the authors).
Figure 3.
The Pearl River Tower: (a) photo of front view; (b) wind penetration structure; and (c) contour plot of wind speed on a horizontal cross-sectional plane (CFD by the authors).
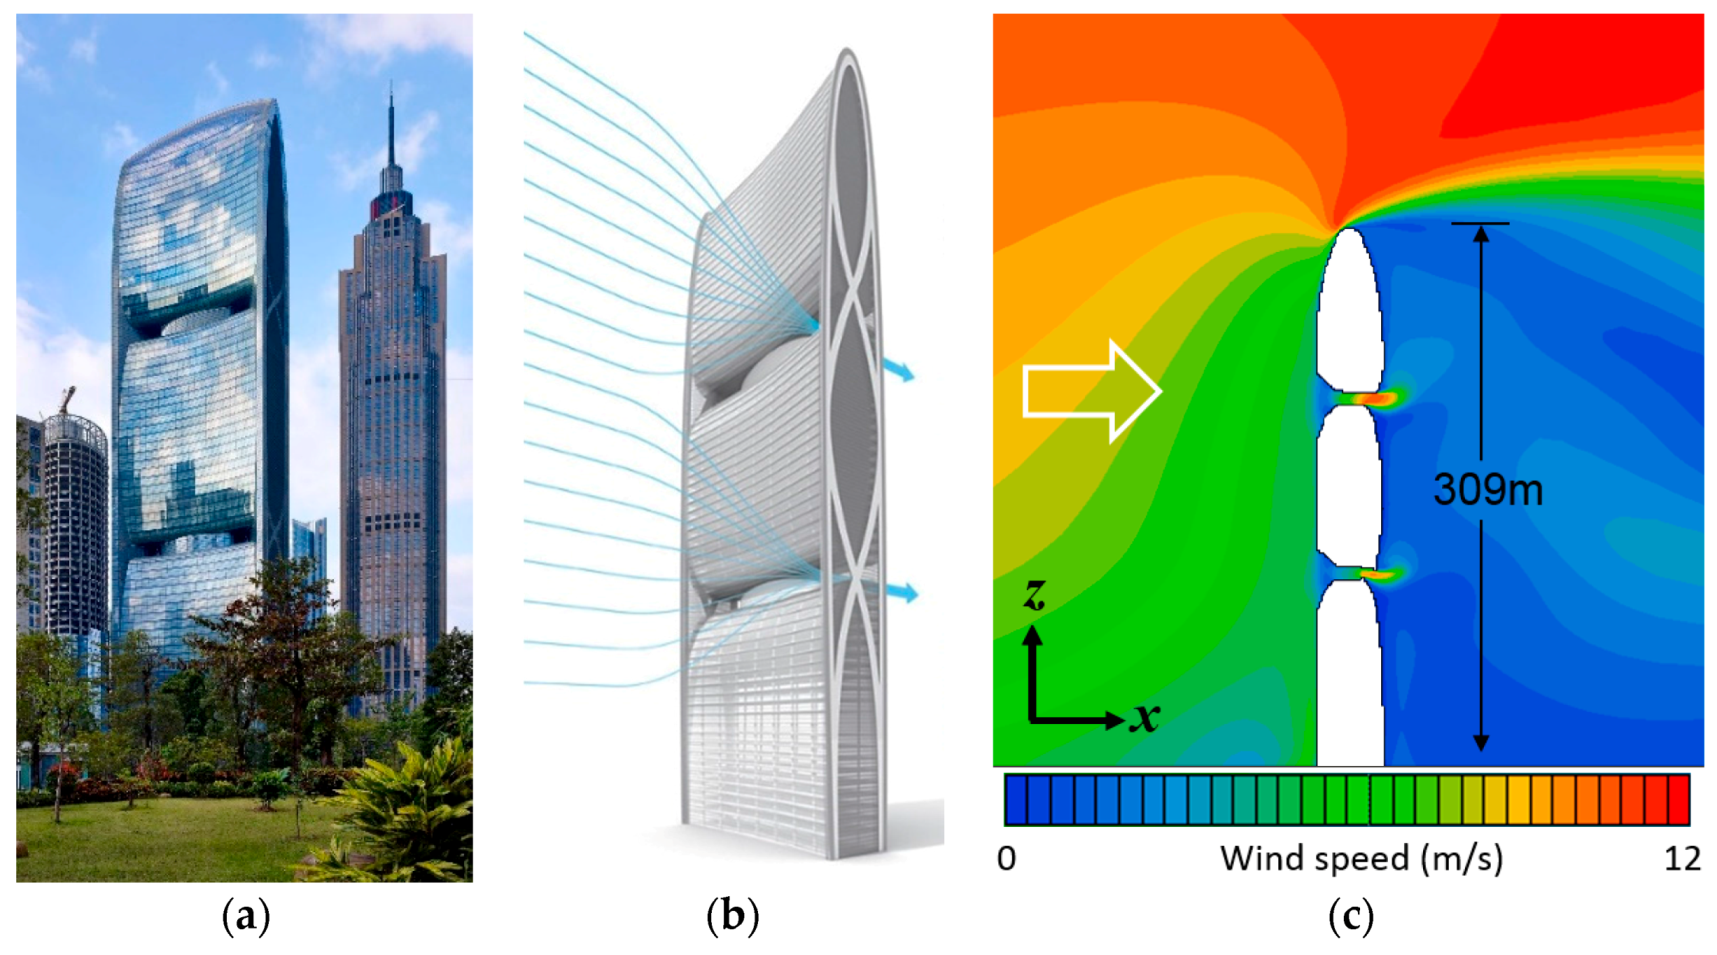
Figure 4.
The Strata SE1 Apartment: (a) photo from the rear of the wind turbines; and (b) contour plot of wind speed on a horizontal cross-sectional plane (top) and streamlines passing through holes (bottom; CFD by the authors).
Figure 4.
The Strata SE1 Apartment: (a) photo from the rear of the wind turbines; and (b) contour plot of wind speed on a horizontal cross-sectional plane (top) and streamlines passing through holes (bottom; CFD by the authors).

Figure 5.
Procedure of wind resource assessment for a high-rise BIWT by using RS–NWP–CFD.

Figure 6.
Virtual landscape around the Lotte World Tower in Seoul (white dashed line indicates the Lotte World Tower under construction, and yellow triangle indicates the RS campaign site).
Figure 6.
Virtual landscape around the Lotte World Tower in Seoul (white dashed line indicates the Lotte World Tower under construction, and yellow triangle indicates the RS campaign site).
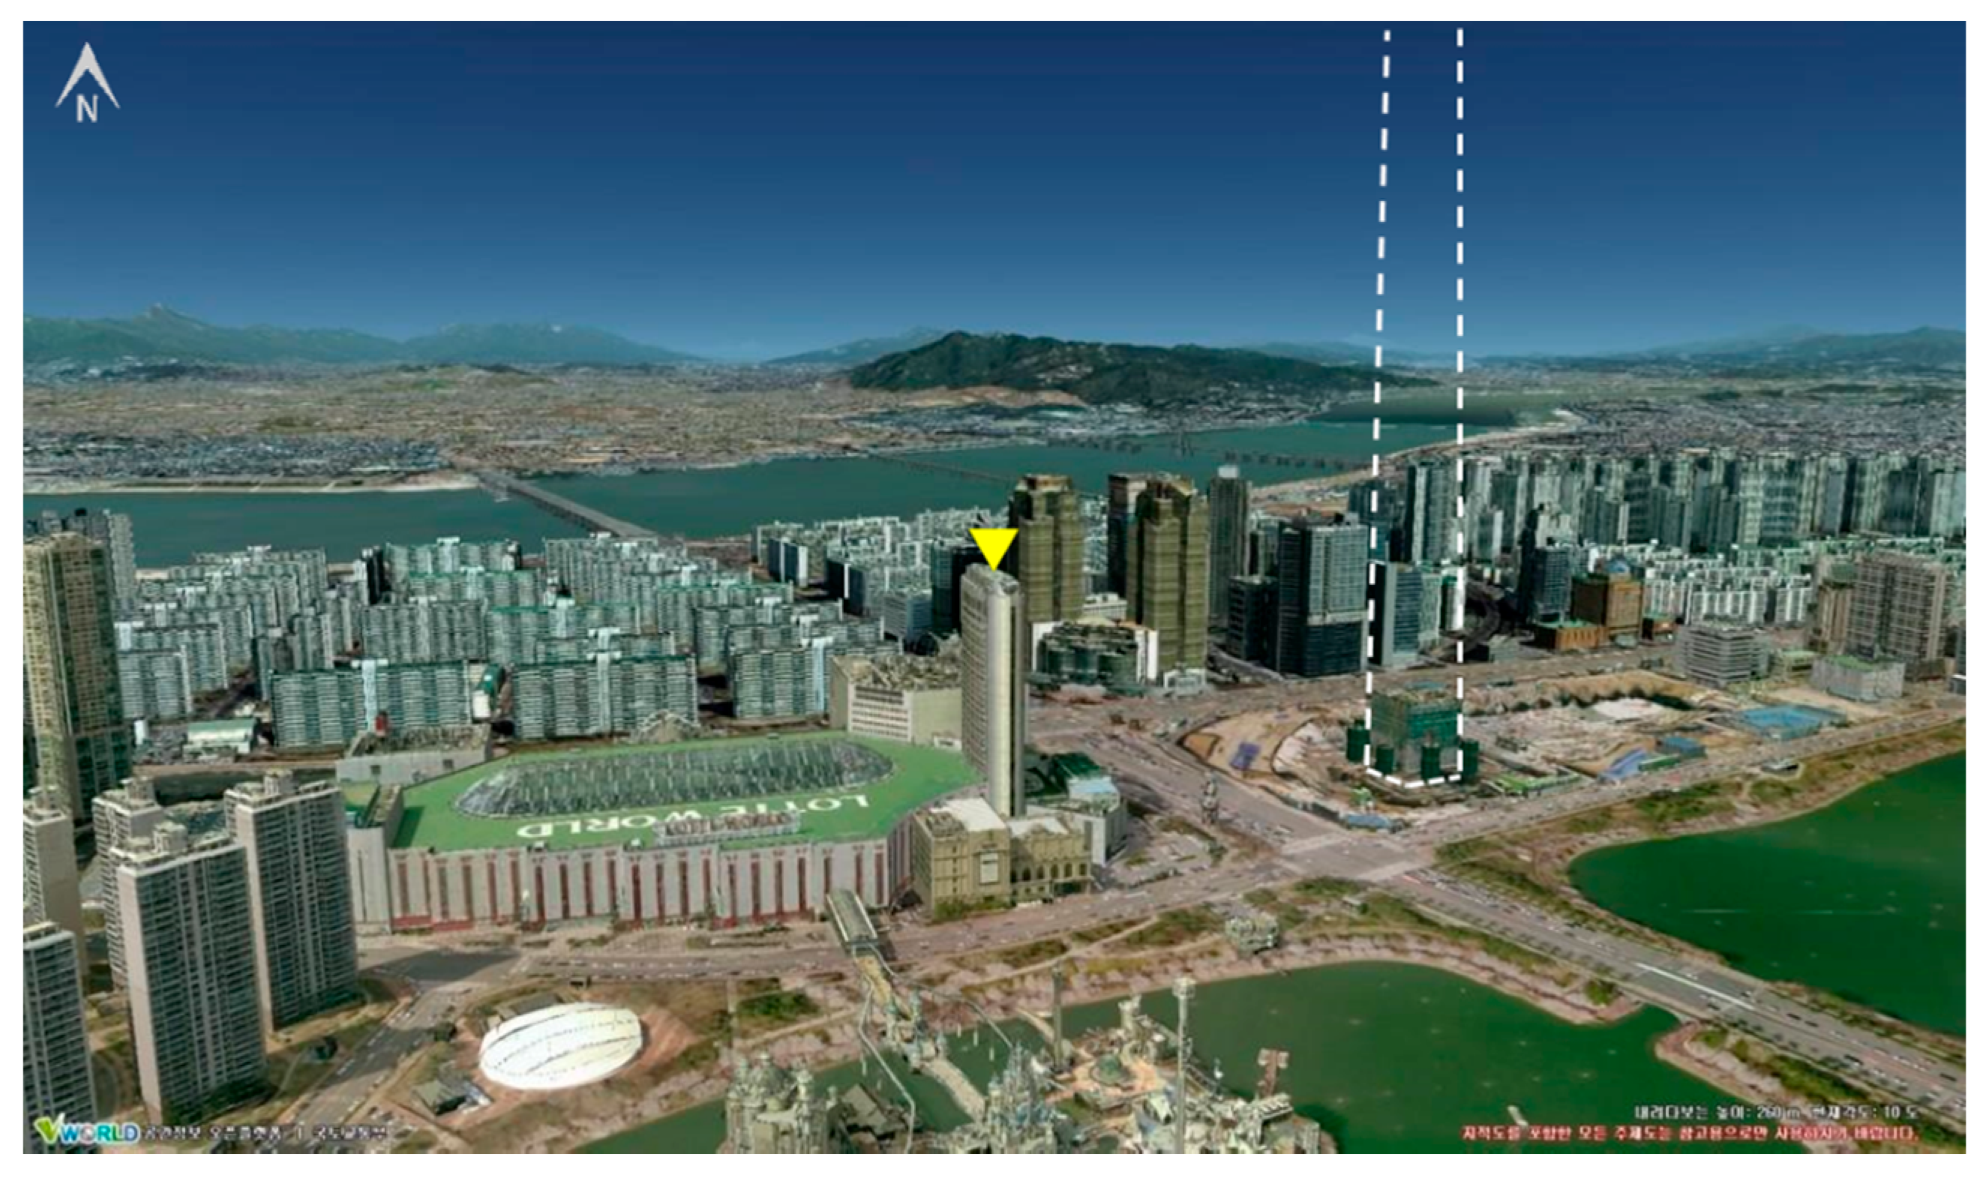
Figure 7.
Dimensions of the Lotte World Tower design and rooftop structure: (left) side view; (right-top) perspective view of rooftop structure; and (right-bottom) top view.
Figure 7.
Dimensions of the Lotte World Tower design and rooftop structure: (left) side view; (right-top) perspective view of rooftop structure; and (right-bottom) top view.
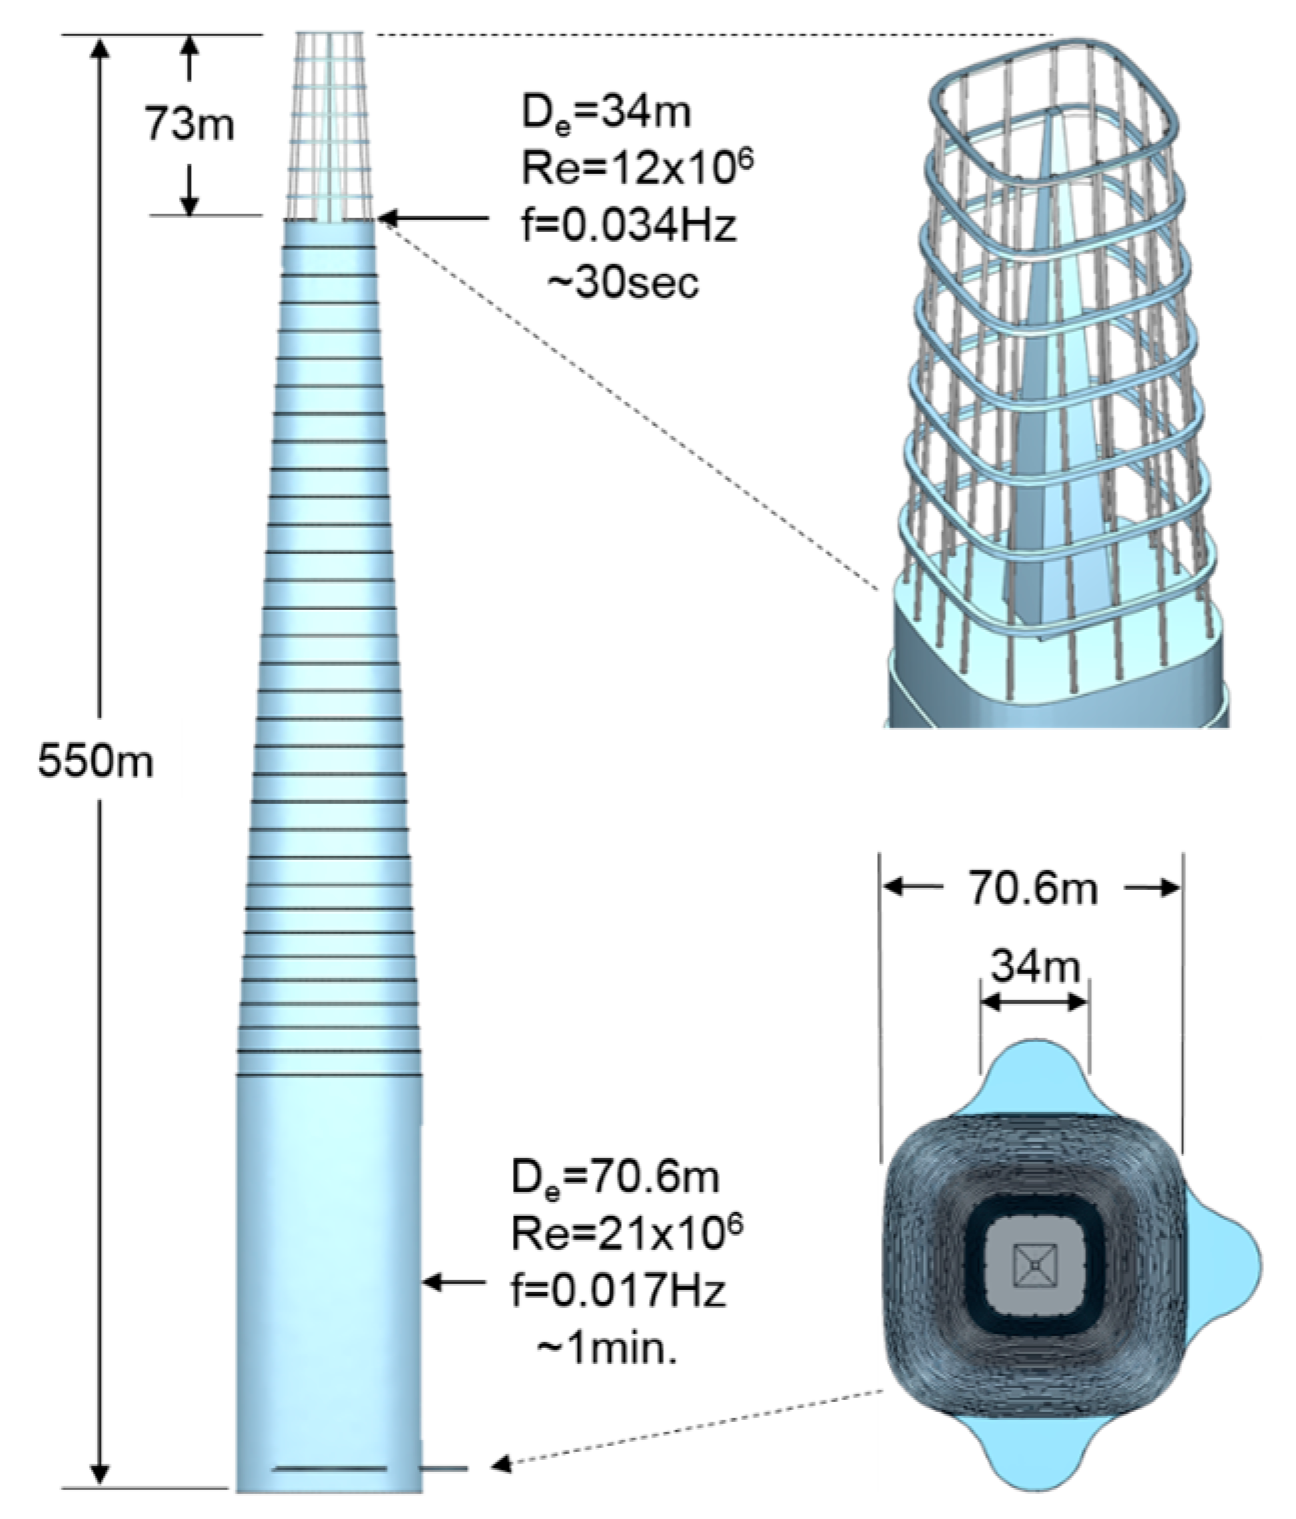
Figure 8.
Computation domain around the Lotte World Tower (left); and the pedestrian-level wind flow streamlines (right).
Figure 8.
Computation domain around the Lotte World Tower (left); and the pedestrian-level wind flow streamlines (right).
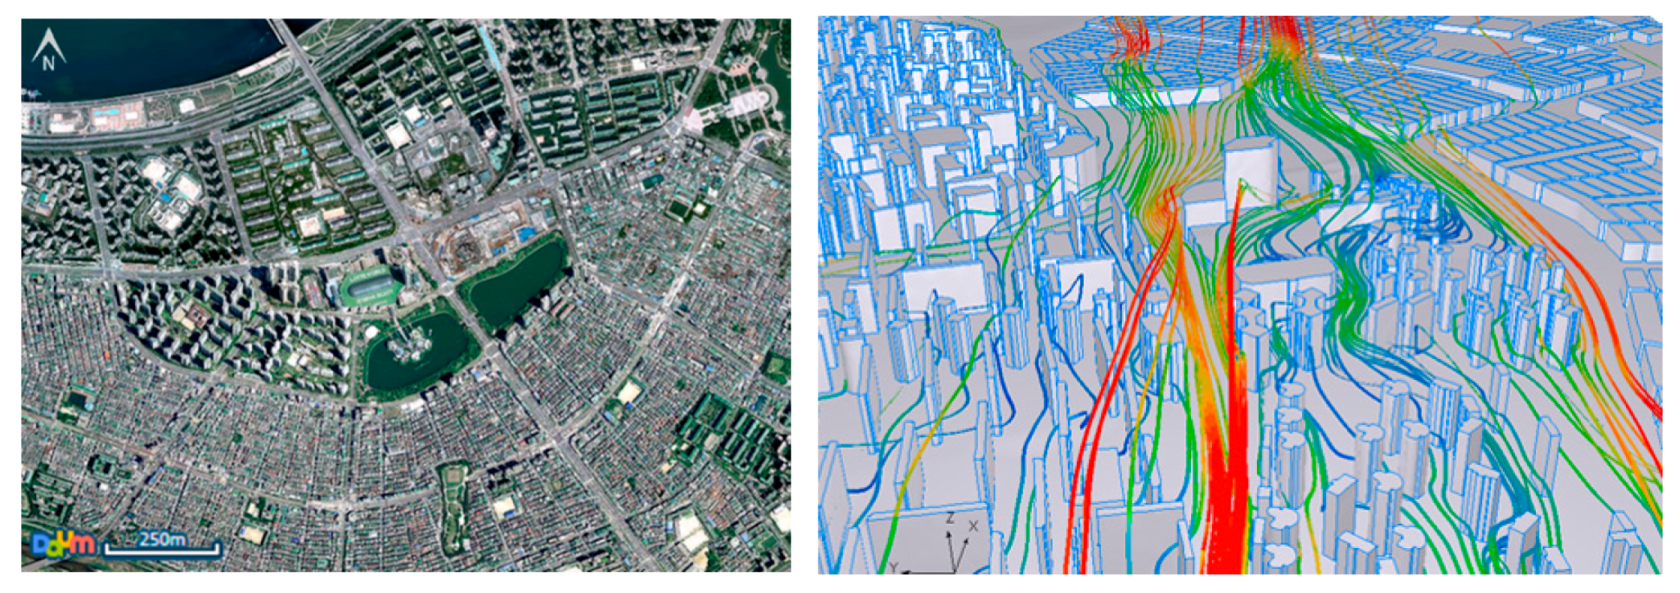
Figure 9.
Mean wind speed and data recovery rate profiles observed by the remote sensing equipment (mean for the campaign period): (a) LIDAR (10-min readings); and (b) SODAR (30-min readings).
Figure 9.
Mean wind speed and data recovery rate profiles observed by the remote sensing equipment (mean for the campaign period): (a) LIDAR (10-min readings); and (b) SODAR (30-min readings).
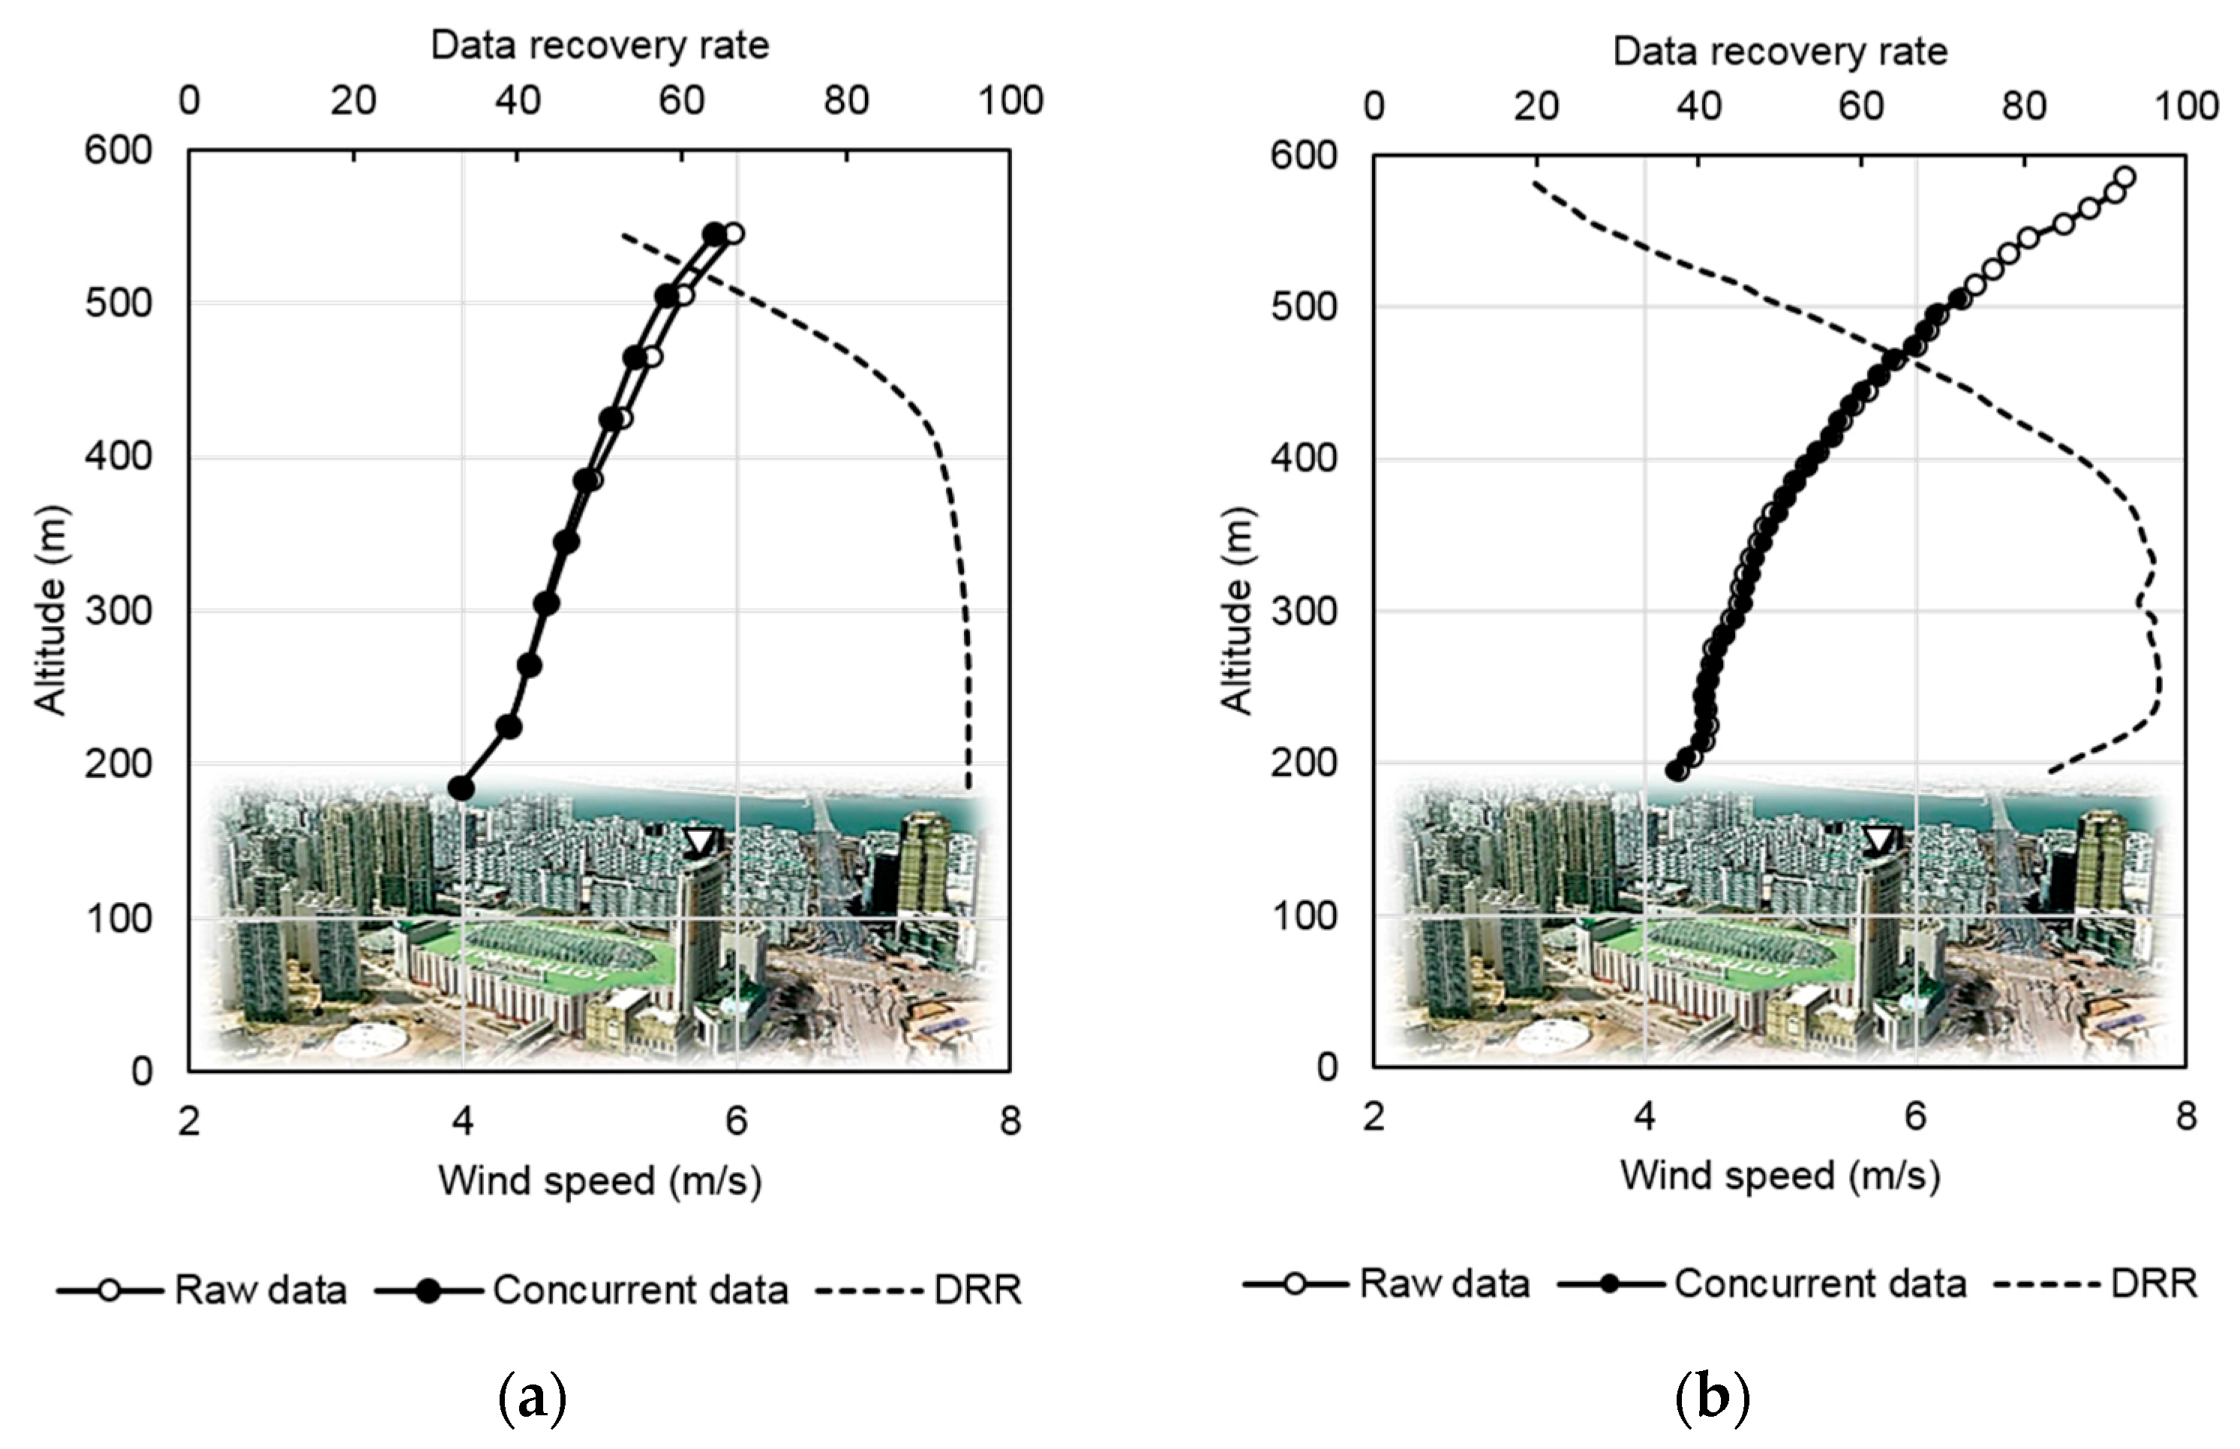
Figure 10.
Wind speed difference between WRF and WRF–UCM simulation at 12:00 p.m. (negative value means that WRF over-predicted wind speed than WRF–UCM).
Figure 10.
Wind speed difference between WRF and WRF–UCM simulation at 12:00 p.m. (negative value means that WRF over-predicted wind speed than WRF–UCM).

Figure 11.
Comparison of wind speed profiles of remote sensing measurements (LIDAR and SODAR: lines) and numerical weather predictions (WRF and WRF–UCM: symbols).
Figure 11.
Comparison of wind speed profiles of remote sensing measurements (LIDAR and SODAR: lines) and numerical weather predictions (WRF and WRF–UCM: symbols).
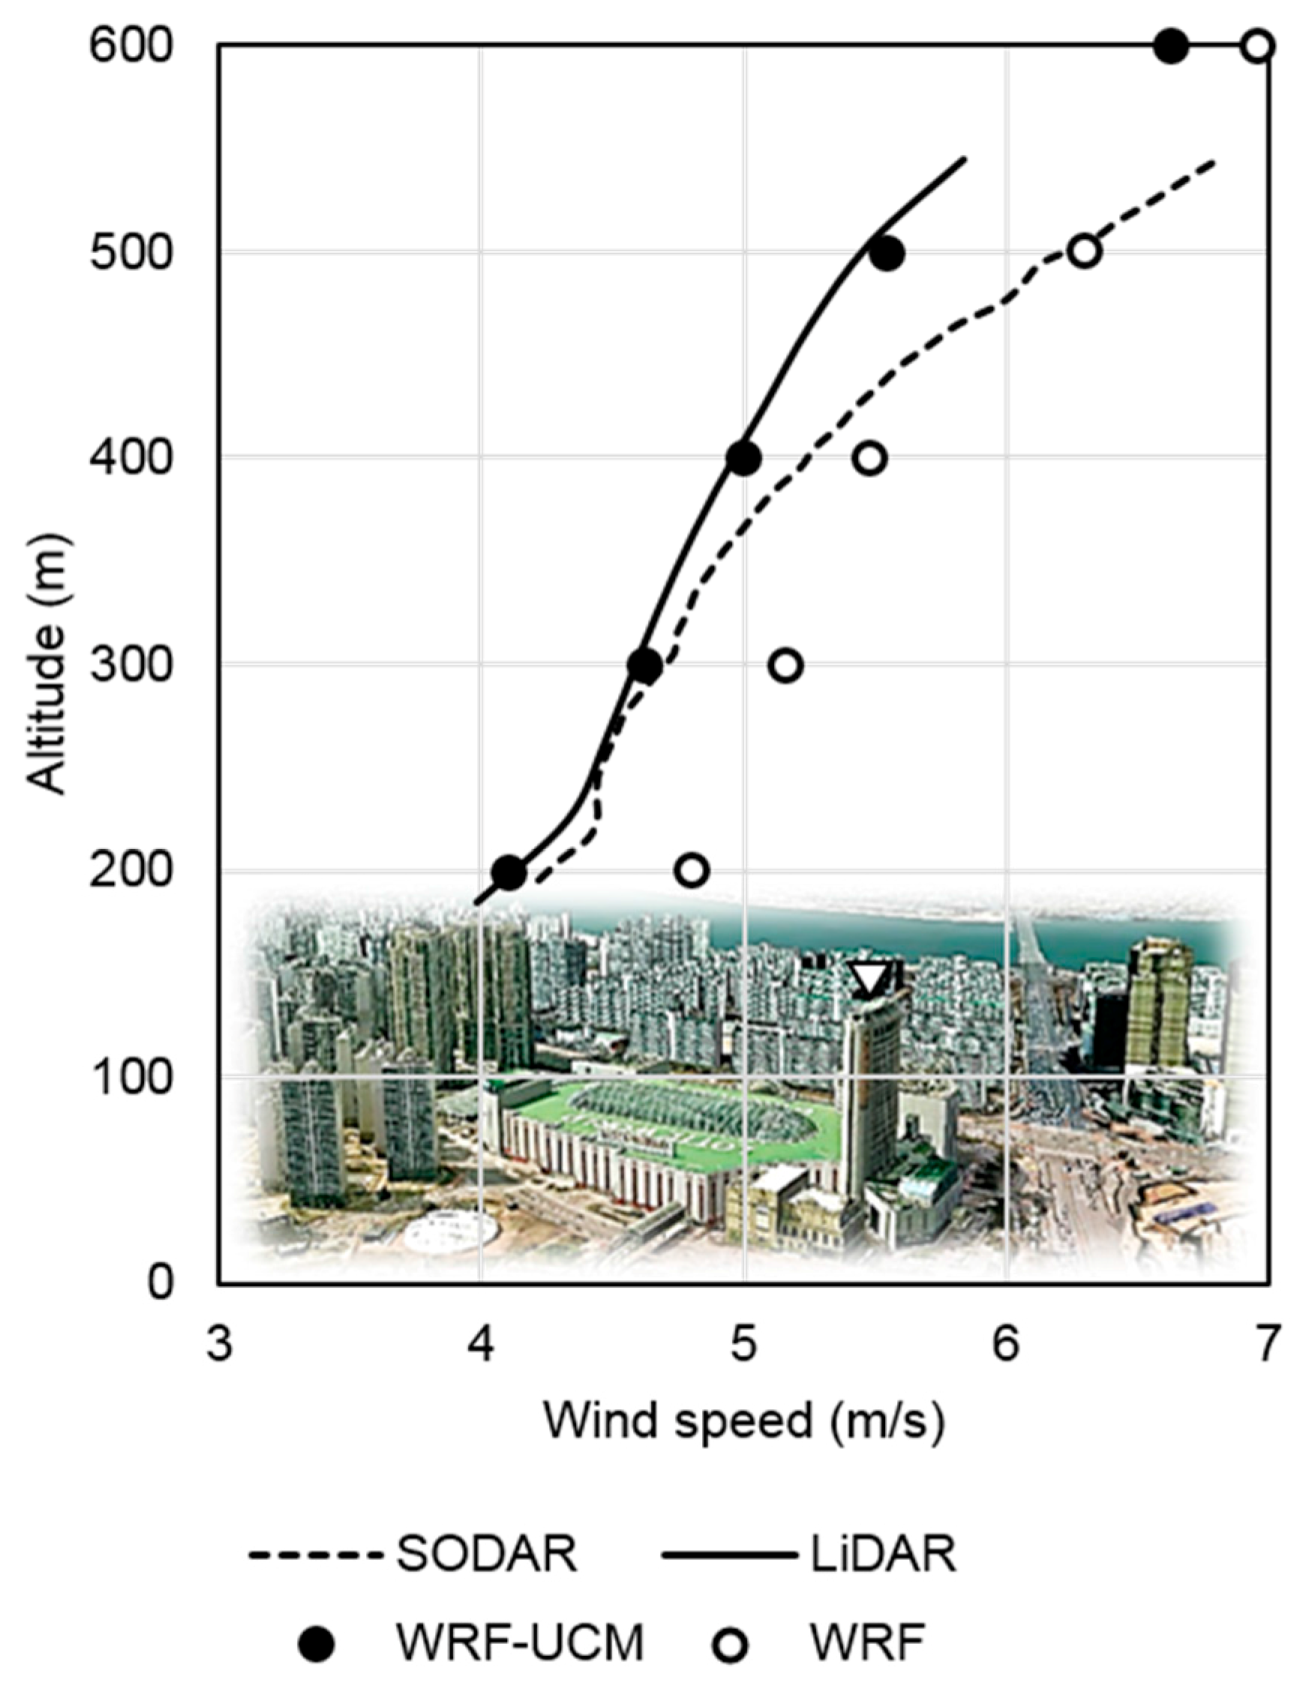
Figure 12.
Comparison of numerical weather prediction and remote sensing measurements for the campaign period at 400 m aboveground: (a) wind speed; and (b) wind direction.
Figure 12.
Comparison of numerical weather prediction and remote sensing measurements for the campaign period at 400 m aboveground: (a) wind speed; and (b) wind direction.
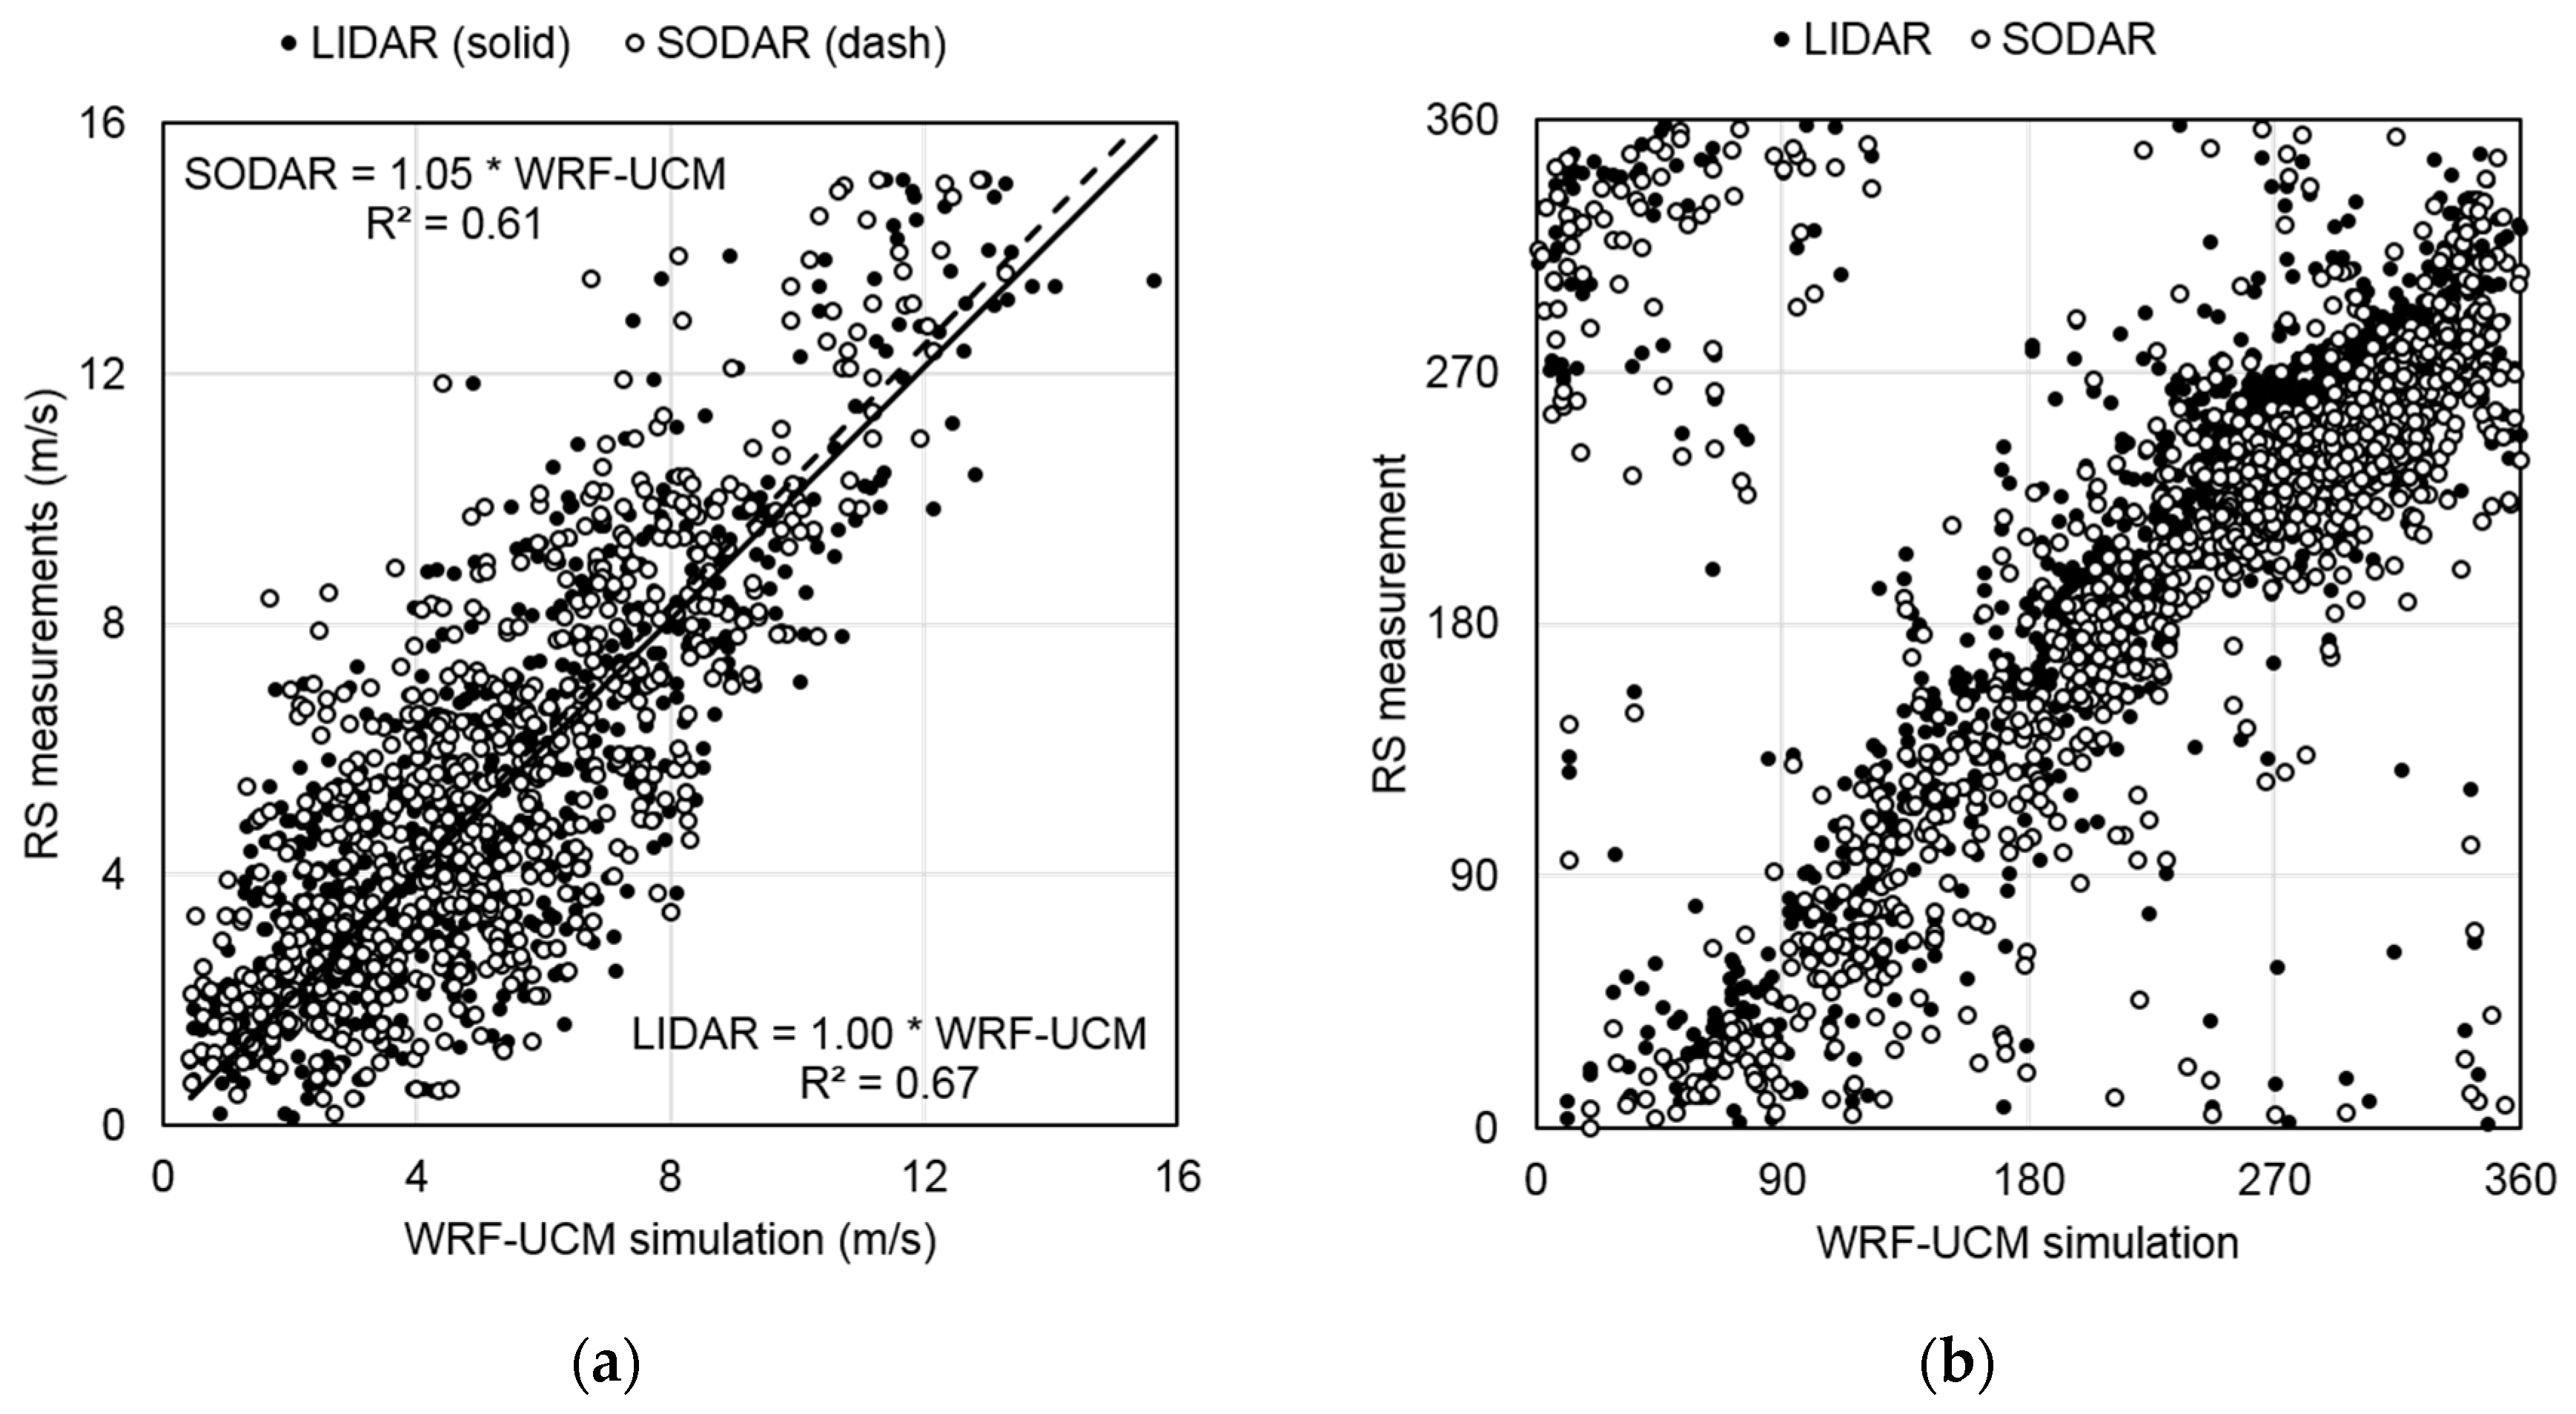
Figure 13.
Wind climate at 555 m above ground level: (a) probability distribution of wind speed; and (b) wind rose.
Figure 13.
Wind climate at 555 m above ground level: (a) probability distribution of wind speed; and (b) wind rose.

Figure 14.
Computation results of pedestrian-level wind speed around the Lotte World Tower: horizontal (left column); and vertical (right column) cross-sectional wind speed variability: (a) without the Tower; and (b) with the Tower.
Figure 14.
Computation results of pedestrian-level wind speed around the Lotte World Tower: horizontal (left column); and vertical (right column) cross-sectional wind speed variability: (a) without the Tower; and (b) with the Tower.
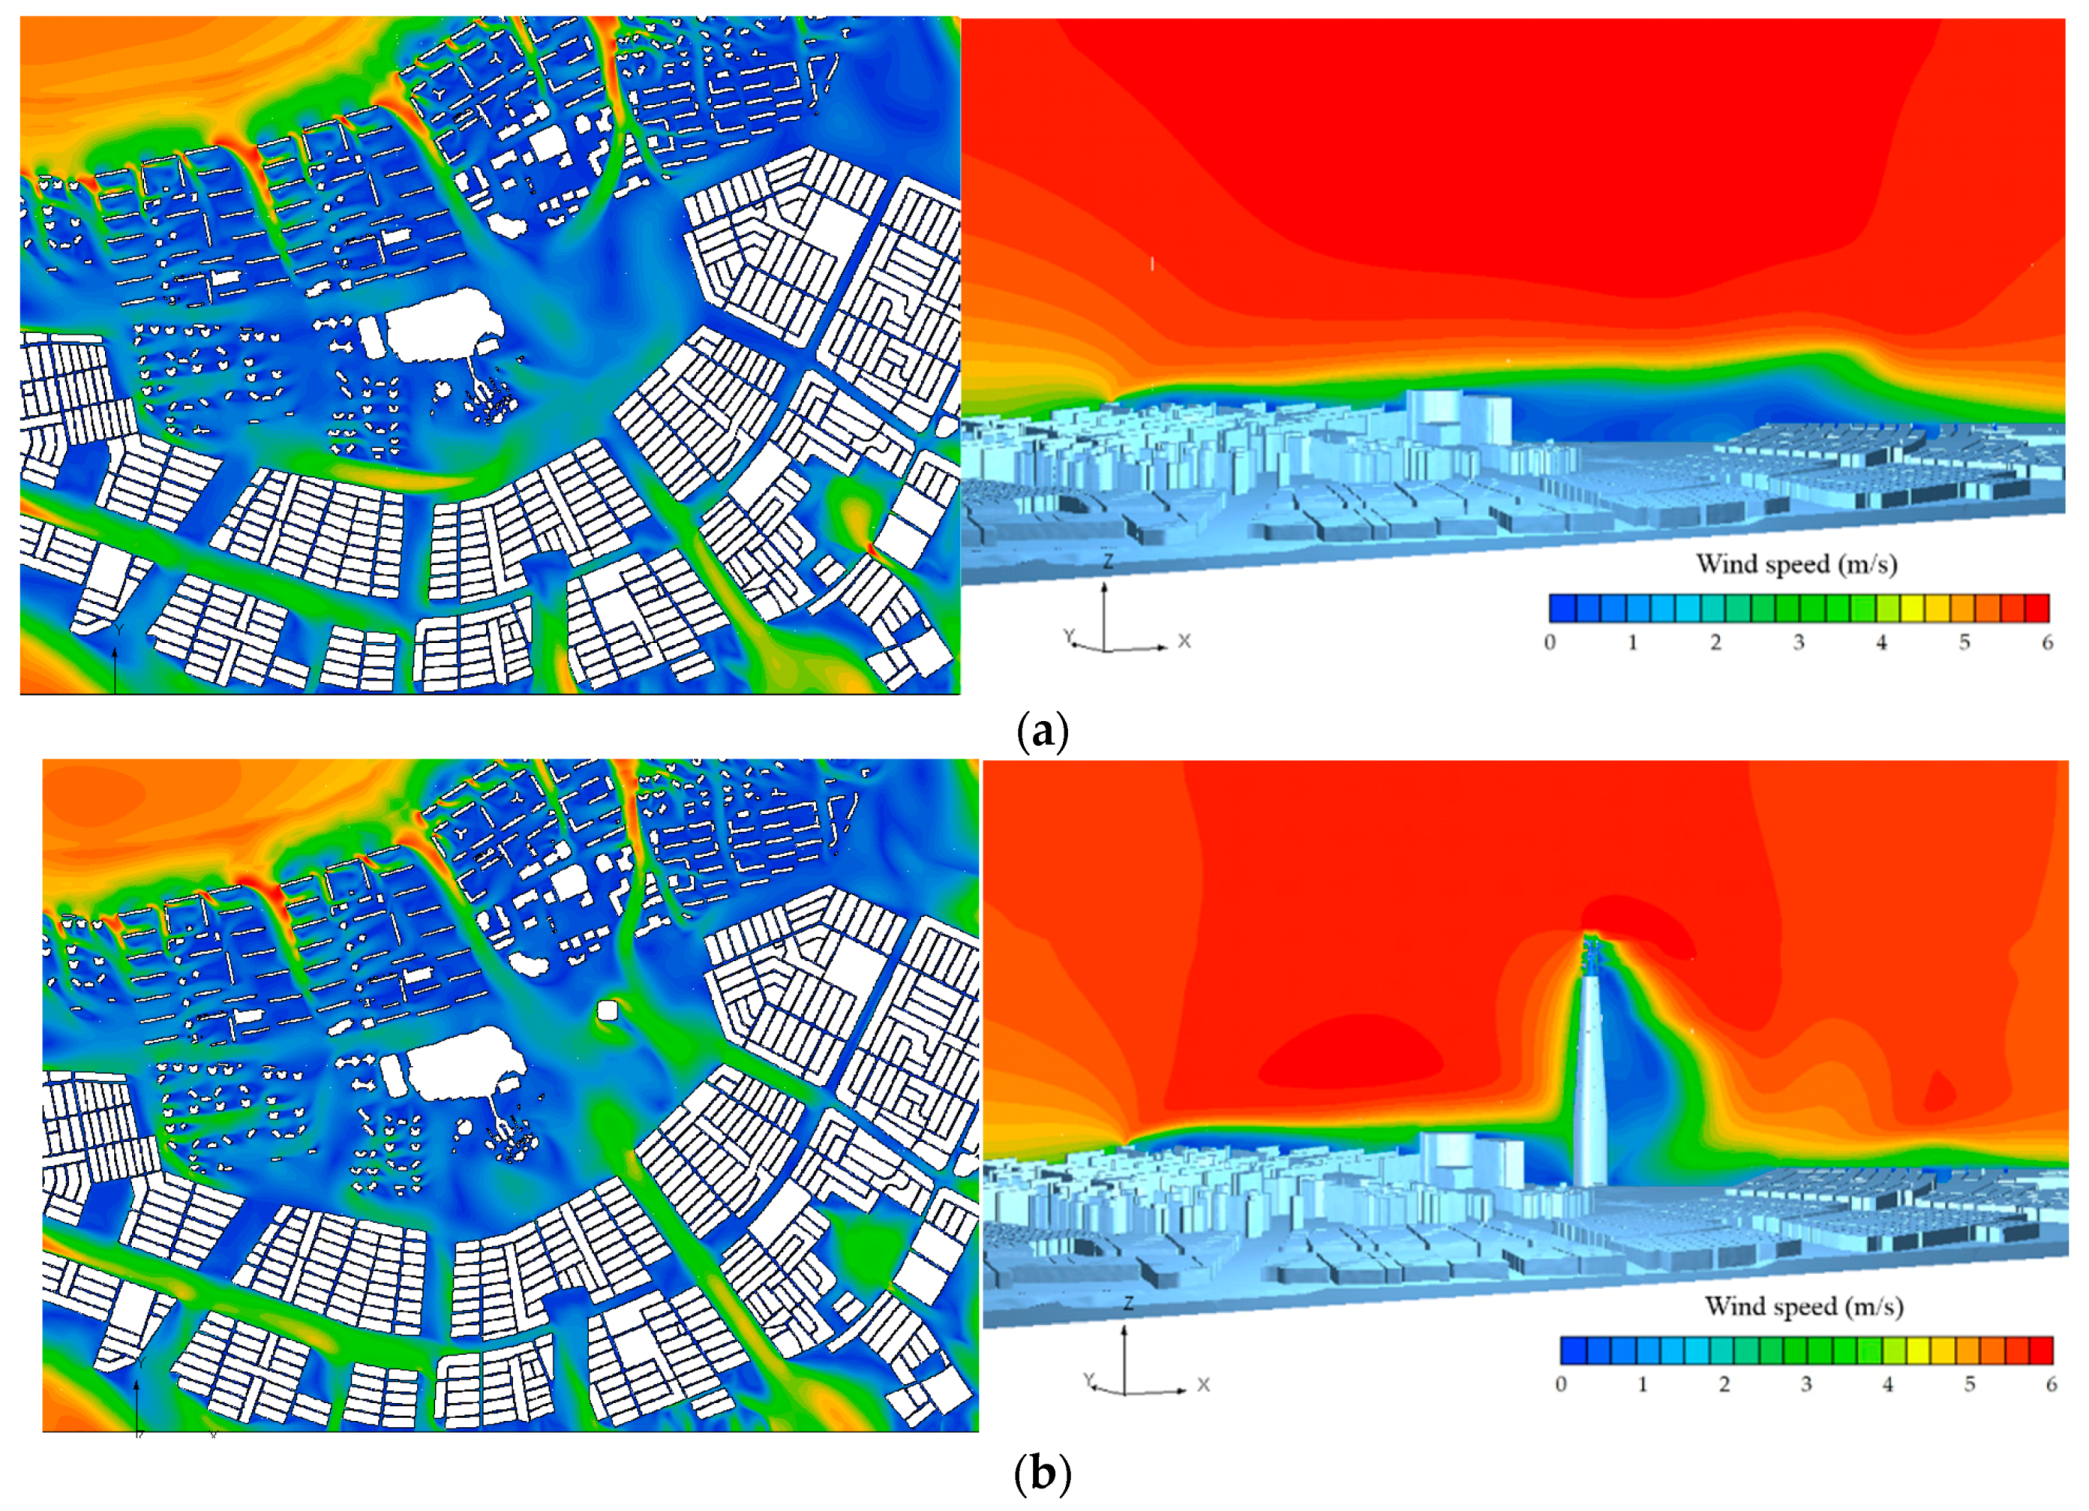
Figure 15.
Wind directional sectors around the Lotte World Tower (top view) for wind resource mapping.
Figure 15.
Wind directional sectors around the Lotte World Tower (top view) for wind resource mapping.
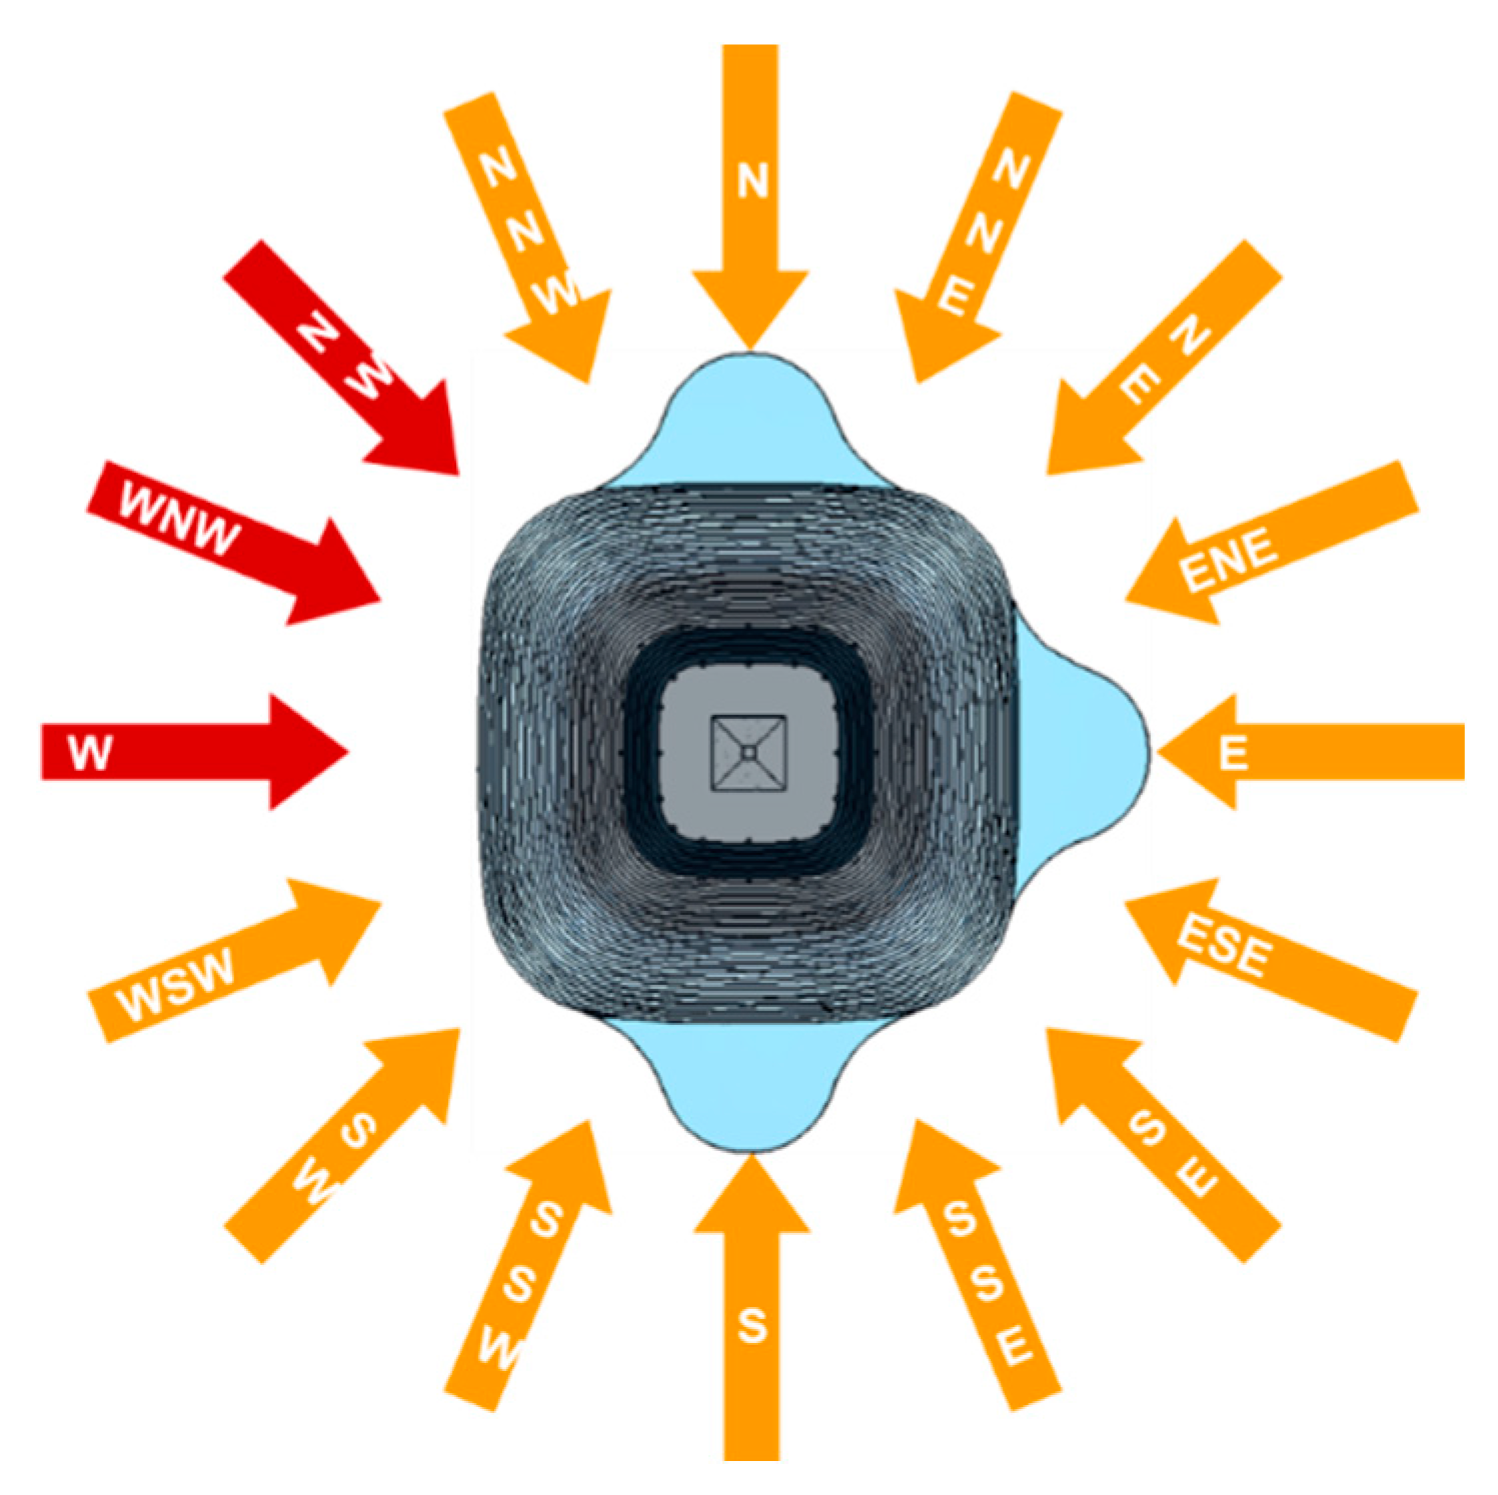
Figure 16.
Comparison of the CFD simulations and the LIDAR measurements at the Lotte World Tower position: (a) mean wind speed profiles; and (b) turbulence intensity profiles.
Figure 16.
Comparison of the CFD simulations and the LIDAR measurements at the Lotte World Tower position: (a) mean wind speed profiles; and (b) turbulence intensity profiles.

Figure 17.
Wind resource map at 2 m above the Lotte World Tower roof (dimensions in meters): (a) mean wind speed map; and (b) wind power density map.
Figure 17.
Wind resource map at 2 m above the Lotte World Tower roof (dimensions in meters): (a) mean wind speed map; and (b) wind power density map.

Figure 18.
Wind speed contours at 2 m above the Lotte World Tower roof for the main wind direction (dimensions in meters): (a) square cone structure; and (b) circular cone structure.
Figure 18.
Wind speed contours at 2 m above the Lotte World Tower roof for the main wind direction (dimensions in meters): (a) square cone structure; and (b) circular cone structure.
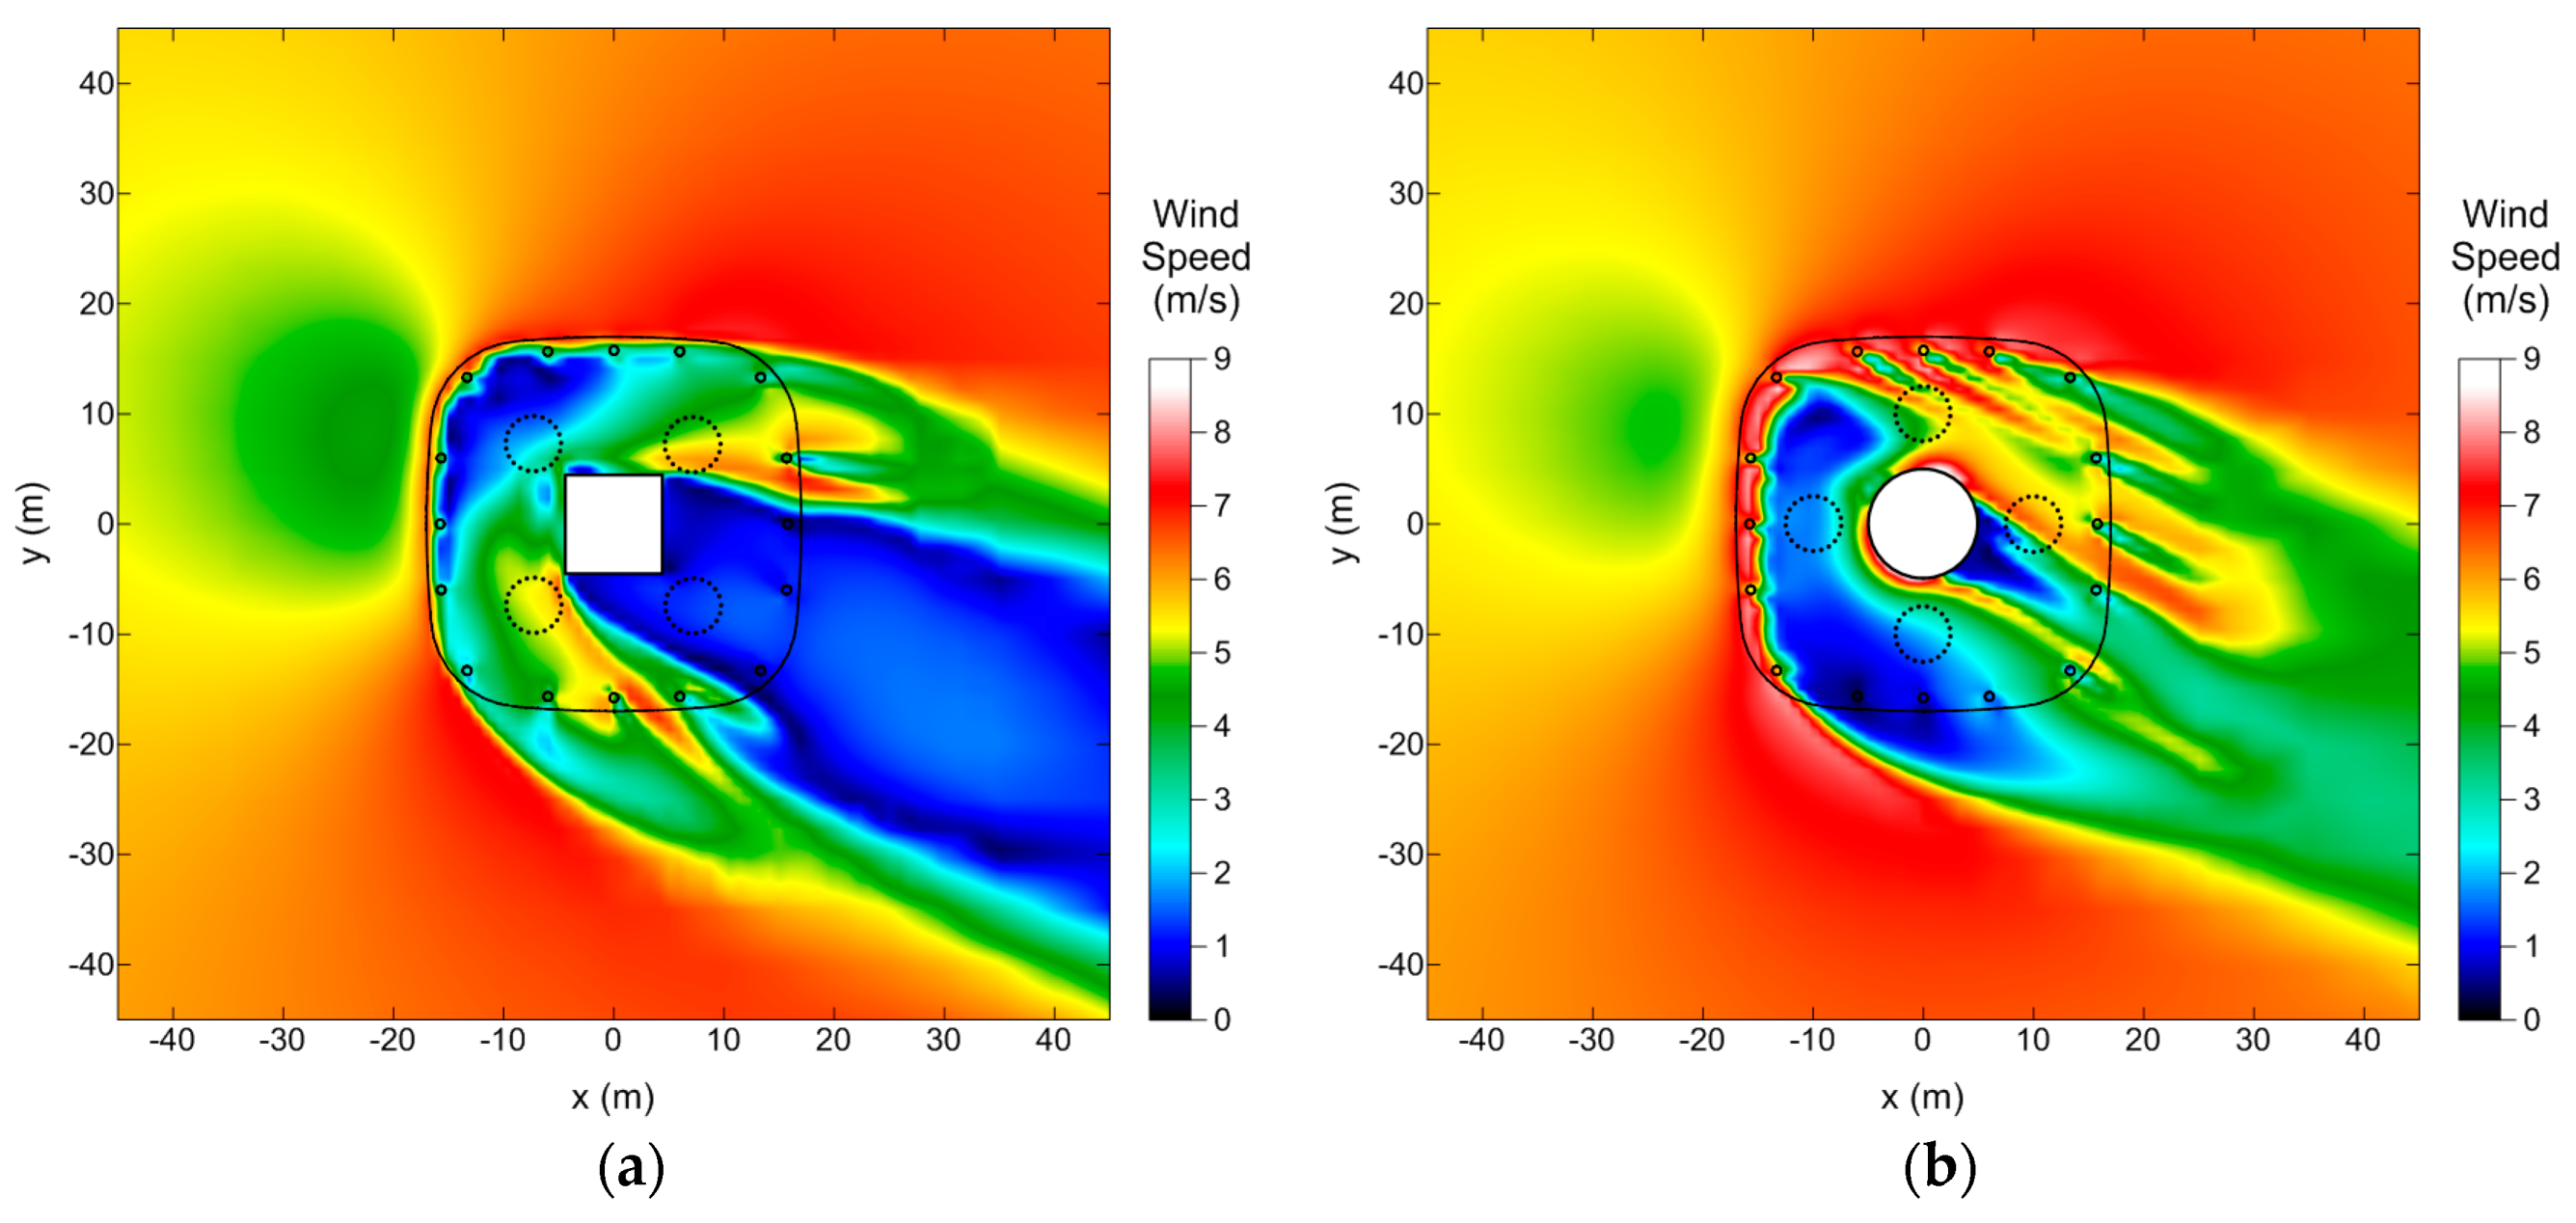
Figure 19.
Wind resource map at 2 m above the Lotte World Tower roof (dimensions in meters): (a) wind power density map for circular cone structure; and (b) difference map of wind power density between the square and the circular cone cases.
Figure 19.
Wind resource map at 2 m above the Lotte World Tower roof (dimensions in meters): (a) wind power density map for circular cone structure; and (b) difference map of wind power density between the square and the circular cone cases.
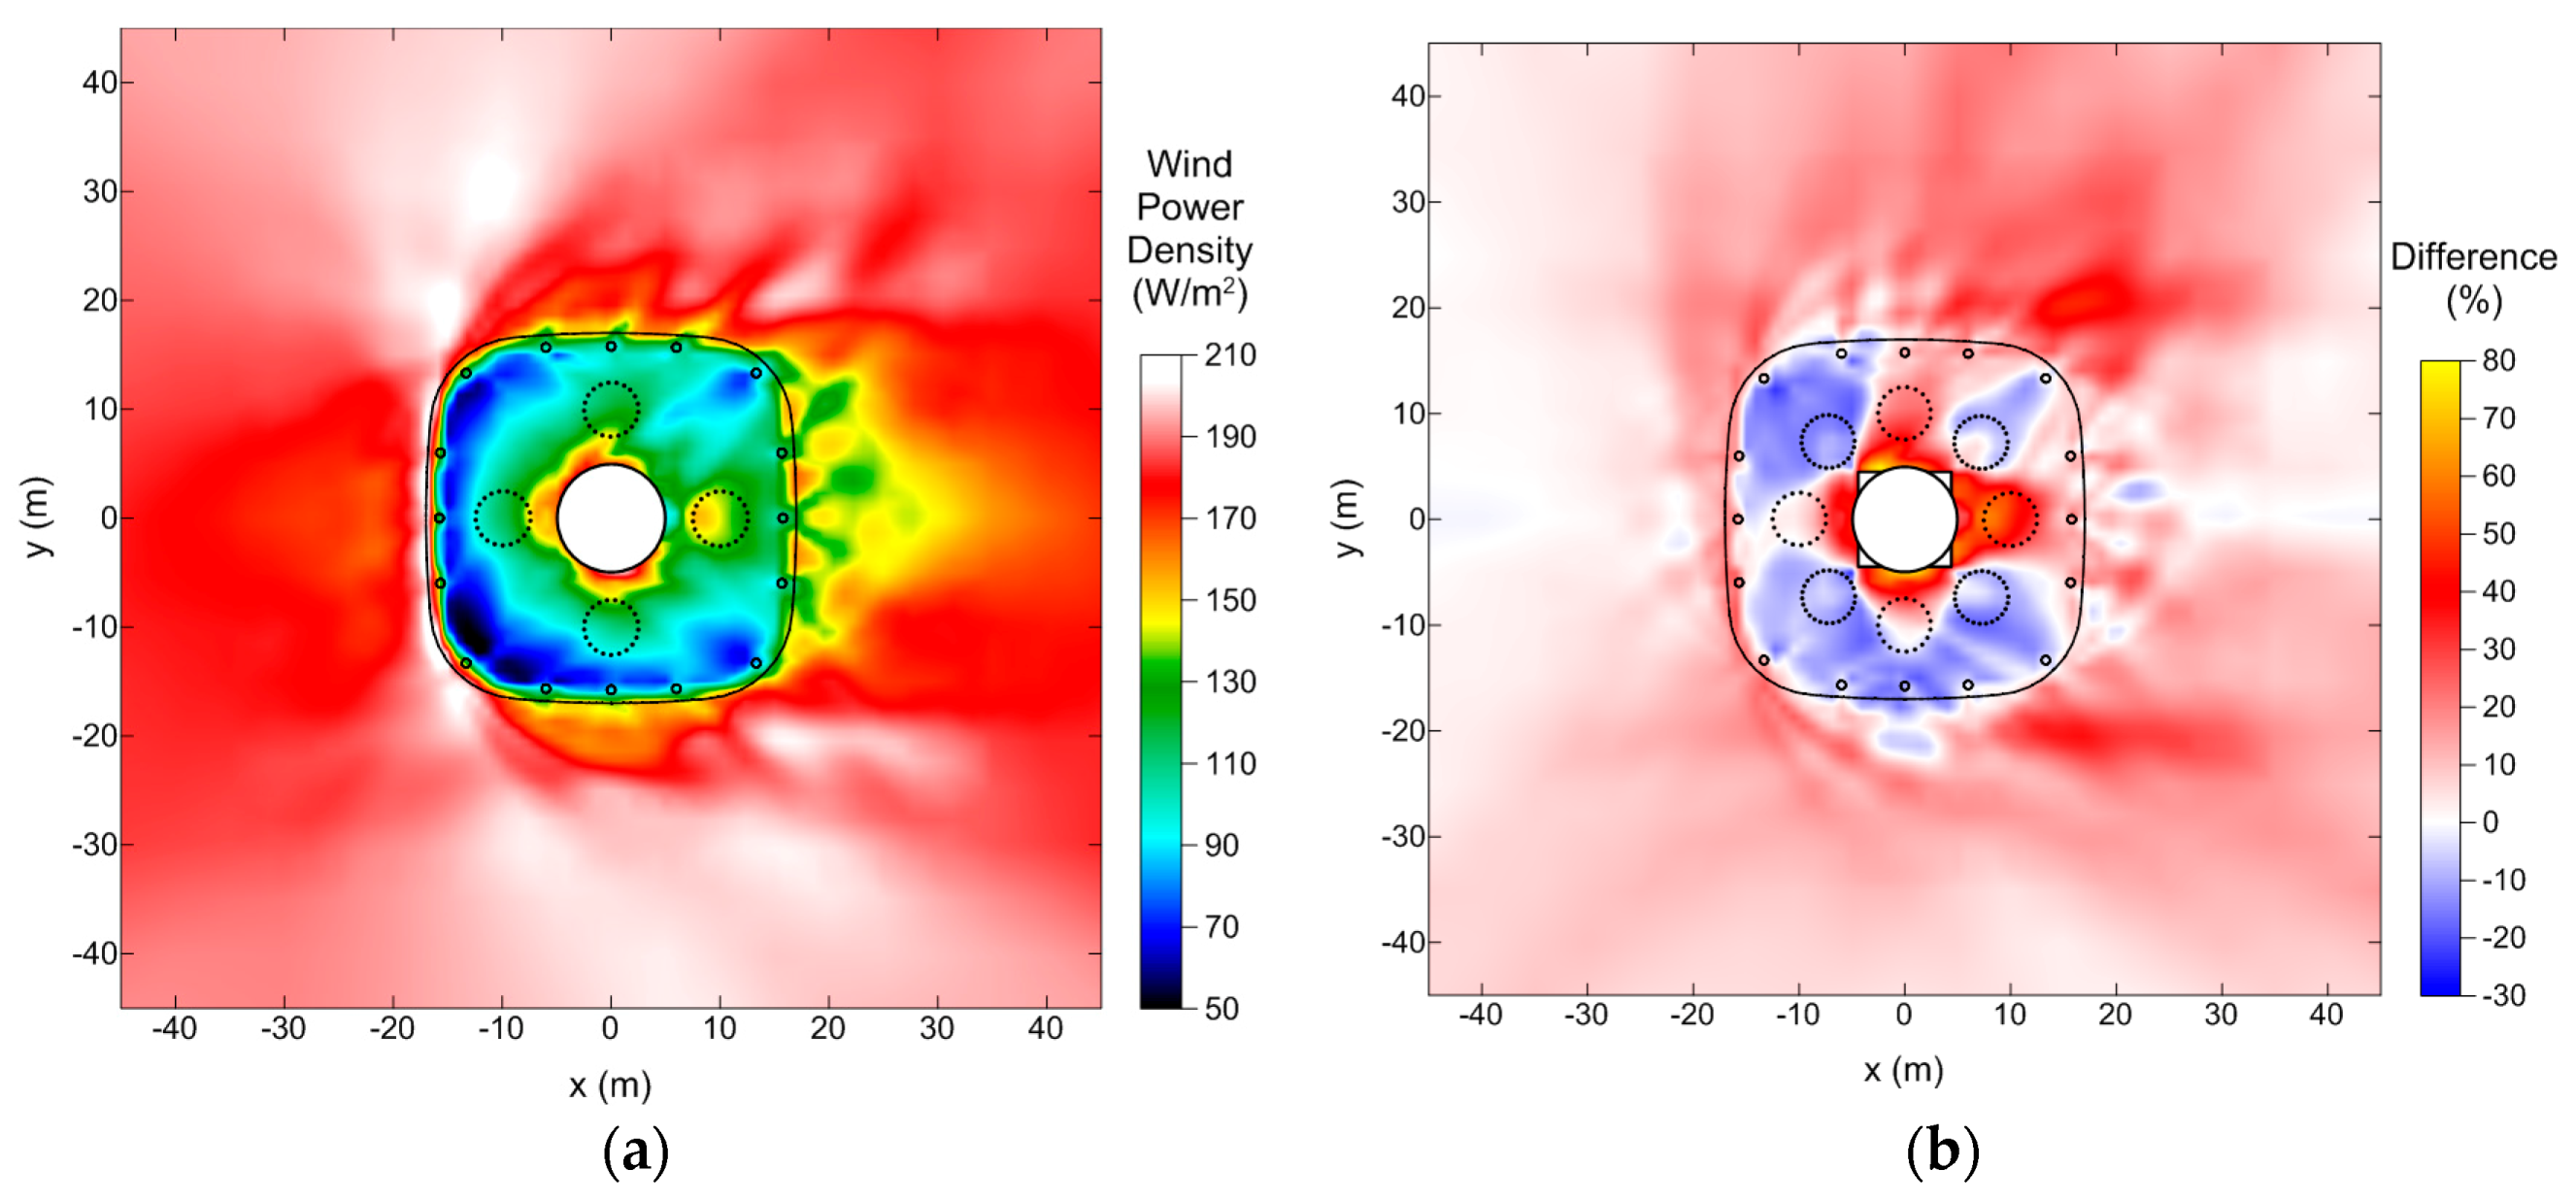
Figure 20.
Probability distribution of wind speed for the square and circular cone cases.

Figure 21.
Power curves of two small wind turbines (solid line: GWE-10KH; dashed line: Excel-S).

Figure 22.
Wind resource map of the Korean Peninsula by Korea Institute of Energy Research (mean wind speed at 80 m aboveground).
Figure 22.
Wind resource map of the Korean Peninsula by Korea Institute of Energy Research (mean wind speed at 80 m aboveground).


| Wind Turbine GWE-10KH | Square Cone Case | Circular Cone Case | ||
|---|---|---|---|---|
| AEP (MWh) | Capacity Factor | AEP (MWh) | Capacity Factor | |
| WT#1 | 2.81 | 3.21% | 3.01 | 3.44% |
| WT#2 | 3.14 | 3.58% | 3.43 | 3.91% |
| WT#3 | 3.28 | 3.74% | 5.09 | 5.81% |
| TW#4 | 2.18 | 2.49% | 3.09 | 3.53% |
| Overall | 11.4 | 3.26% | 14.6 | 4.18% |
| Wind Turbine Excel-S | Square Cone Case | Circular Cone Case | ||
|---|---|---|---|---|
| AEP (MWh) | Capacity Factor | AEP (MWh) | Capacity Factor | |
| WT#1 | 4.53 | 5.17% | 4.89 | 5.47% |
| WT#2 | 4.63 | 5.28% | 5.12 | 4.84% |
| WT#3 | 4.98 | 5.68% | 7.67 | 8.76% |
| TW#4 | 3.59 | 4.10% | 4.77 | 5.45% |
| Overall | 17.7 | 5.06% | 22.4 | 6.38% |
© 2016 by the authors; licensee MDPI, Basel, Switzerland. This article is an open access article distributed under the terms and conditions of the Creative Commons Attribution (CC-BY) license (http://creativecommons.org/licenses/by/4.0/).
Share and Cite
MDPI and ACS Style
Kim, H.-G.; Jeon, W.-H.; Kim, D.-H. Wind Resource Assessment for High-Rise BIWT Using RS-NWP-CFD. Remote Sens. 2016, 8, 1019. https://doi.org/10.3390/rs8121019
AMA Style
Kim H-G, Jeon W-H, Kim D-H. Wind Resource Assessment for High-Rise BIWT Using RS-NWP-CFD. Remote Sensing. 2016; 8(12):1019. https://doi.org/10.3390/rs8121019
Chicago/Turabian StyleKim, Hyun-Goo, Wan-Ho Jeon, and Dong-Hyeok Kim. 2016. "Wind Resource Assessment for High-Rise BIWT Using RS-NWP-CFD" Remote Sensing 8, no. 12: 1019. https://doi.org/10.3390/rs8121019
Note that from the first issue of 2016, this journal uses article numbers instead of page numbers. See further details here.