1. Introduction
With a launch expected in the latter half of 2018, the ICESat-2 satellite will provide a global distribution of geodetic measurements from a space-based laser altimeter of both the terrain surface and relative canopy heights, which will provide a significant benefit to society through a variety of applications ranging from forest structural mapping to improved global digital terrain models. The Earth’s land surface is a complex mosaic of geomorphic units and land cover types resulting in large variations in terrain height, slope, roughness, vegetation height and reflectance, often with the variations occurring over very small spatial scales. Documentation of these landscape properties is a first step in understanding the interplay between the formative processes and response to changing conditions. Characterization of the landscape is also necessary to establish boundary conditions for models that are sensitive to these properties, such as predictive models of atmospheric change that depend on land-atmosphere interactions. Topography, or land surface height, is the fundamental component for many relative height applications, both to the scientific and commercial sectors. The most accurate global elevation product was produced by the Shuttle Radar Topography Mission (SRTM) launched in 2000; however, elevation data are limited to non-polar regions. Furthermore, the accuracy of SRTM-derived heights range from 5–10 m, depending on the amount of topography and vegetation cover over a particular area [
1,
2].
In addition to producing a global terrain product, monitoring the amount and distribution of above ground vegetation and carbon pools enables improved characterization of the global carbon budget. The quantification of the global carbon pools has been a focus of research in the recent past with a goal to understand forest change due to growth, degradation and deforestation [
3,
4,
5]. Uncertainties in the global carbon budget are directly related to the limited knowledge of vegetation structure, specifically canopy height [
6]. Airborne LiDAR has been used for small studies to capture canopy height, and in those studies, canopy height variation for multiple forest types is measured with uncertainties ranging from 1–9 m depending on the ecosystem and type of study [
6,
7,
8]. Although the spatial extent and changes to forests can be mapped with existing satellite remote sensing data, the lack of information on forest vertical structure and biomass limits the knowledge of biomass/biomass change within the global carbon budget. A space-based LiDAR mission can provide a baseline for global carbon stocks [
4,
9]. In 2011, the ecosystem community outlined the need for a global biomass and 3D vegetation structure product for science and policy decisions [
6]. By 2021, there will be several spaceborne systems dedicated to quantifying the carbon stocks, including NASA’s Global Ecosystem Dynamics Instrument (GEDI) and NASA’s NISAR (the collaborative NASA and Indian Space Research Organization SAR mission). Canopy height measurements from ICESat-2 will complement these other NASA missions through the quantification of global forest carbon stocks.
ICESat-2 will provide the community global elevation measurements to support multiple scientific disciplines. The ICESat-2 scientific goals are similar to those of its predecessor, ICESat, particularly for cryospheric and ecological applications. However, the differences of the ICESat-2 onboard technology from that of ICESat were driven by the goal of providing elevation and slope information with enhanced spatial coverage. The data acquisition operational scenario planned for ICESat-2 over the mid-latitudes will provide a global distribution of geodetic measurements of both the surface and vegetation; creating a terrain and canopy height product intended to enhance existing geophysical data resources and provide opportunities for further understanding of our environment.
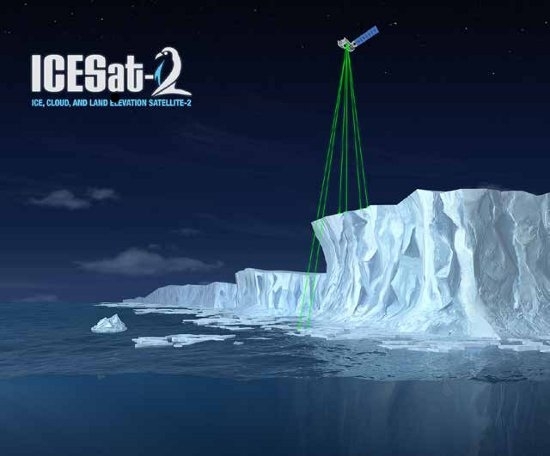
The Advanced Topographic Laser Altimeter System (ATLAS) instrument will operate at 532 nm in the green range of the electromagnetic (EM) spectrum and will have a laser repetition rate of 10 kHz and a laser pulse width of <2 ns. Although a space-based laser propagating at a 532-nm wavelength is subject to more atmospheric attenuation than 1064 nm, wavelength-specific differences of ground and canopy characteristics between 532 nm and 1064 nm from airborne data have been reported as relatively minor [
10]. The combination of the laser repetition rate and satellite velocity will result in a center to center separation of 70 cm for each laser footprint on the surface. Based on the altitude of the spacecraft (~496 km) and the divergence properties of the laser, the footprint diameter is estimated to be 13 m at the start of the mission and will gradually increase to 17 m as the laser divergence increases toward the end of the mission [
11,
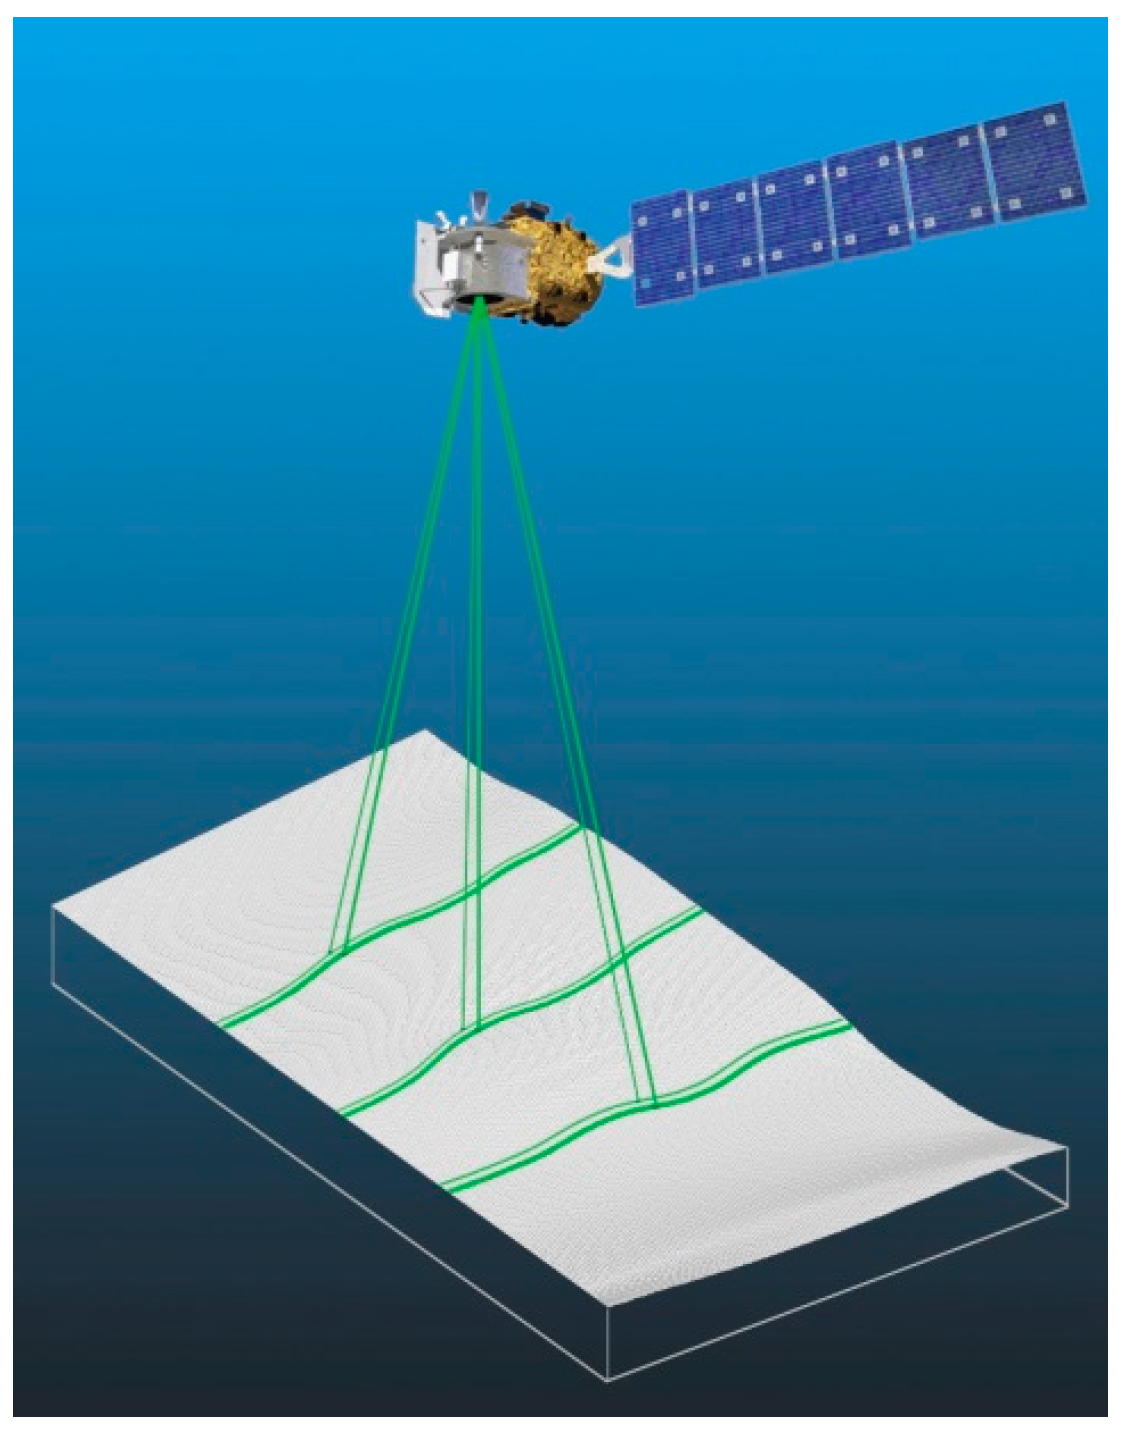
12] due to inherent loss of laser energy and degradation of the optics. Each Gaussian laser pulse is split by a diffractive optical element within ATLAS’s optical path to generate six individual beams, transmitted in a three pair configuration (
Figure 1). The beams within each pair have different transmit energies, which constitute the label of the ‘strong’ beam and the ‘weak’ beam based on the 4:1 energy ratio. This relative energy difference is anticipated to provide compensation for the detector dynamic range given variations in surface reflectance. Due to the relatively low surface reflectance from vegetation at 532 nm, the signal from the weak beam may be too weak to be detected. The beam pairs are separated by ~3.3 km in the across-track direction, and the strong and weak beams are separated by ~2.5 km in the along-track direction. As ICESat-2 moves along its orbit, the ATLAS beams describe six tracks on the Earth’s surface; the array is rotated slightly with respect to the satellite’s flight direction so that tracks for the fore and aft beams in each column produce pairs of tracks, each separated by approximately 90 m. Once on-orbit, ICESat-2 will begin its measurement collection along a planned reference ground track for an orbital repeat cycle of 91 days. However, once the initial 91-day cycle is completed, ICESat-2 will maneuver for off-nadir pointing over the mid-latitudes during subsequent cycles, which will ultimately provide a uniform distribution of measurements over the optimal three-year operational lifetime of the satellite. The planned distribution once complete should have a spatial separation between collection tracks of 1 km at the Equator. As a note to the reader, ICESat-2 will not be in the same orbit as ICESat.
The ICESat-2 mission will provide several geophysical data products specific to the measured surface type (e.g., ice sheets, ocean and land) and format (e.g., along-track and gridded). The land product, ATL08, will contain the along-track terrain and canopy heights, canopy cover and other descriptive parameters derived from the ATLAS measurements. Height estimates from ATL08 are poised for comparison to other geodetic data and supply the foundation for higher level data products. As such, this effort presents the expected performance of ICESat-2 for vegetation characterization over specific ecosystems, but will also highlight the interpretation approach for these anticipated datasets and how they might be leveraged for additional scientific objectives and realizations.
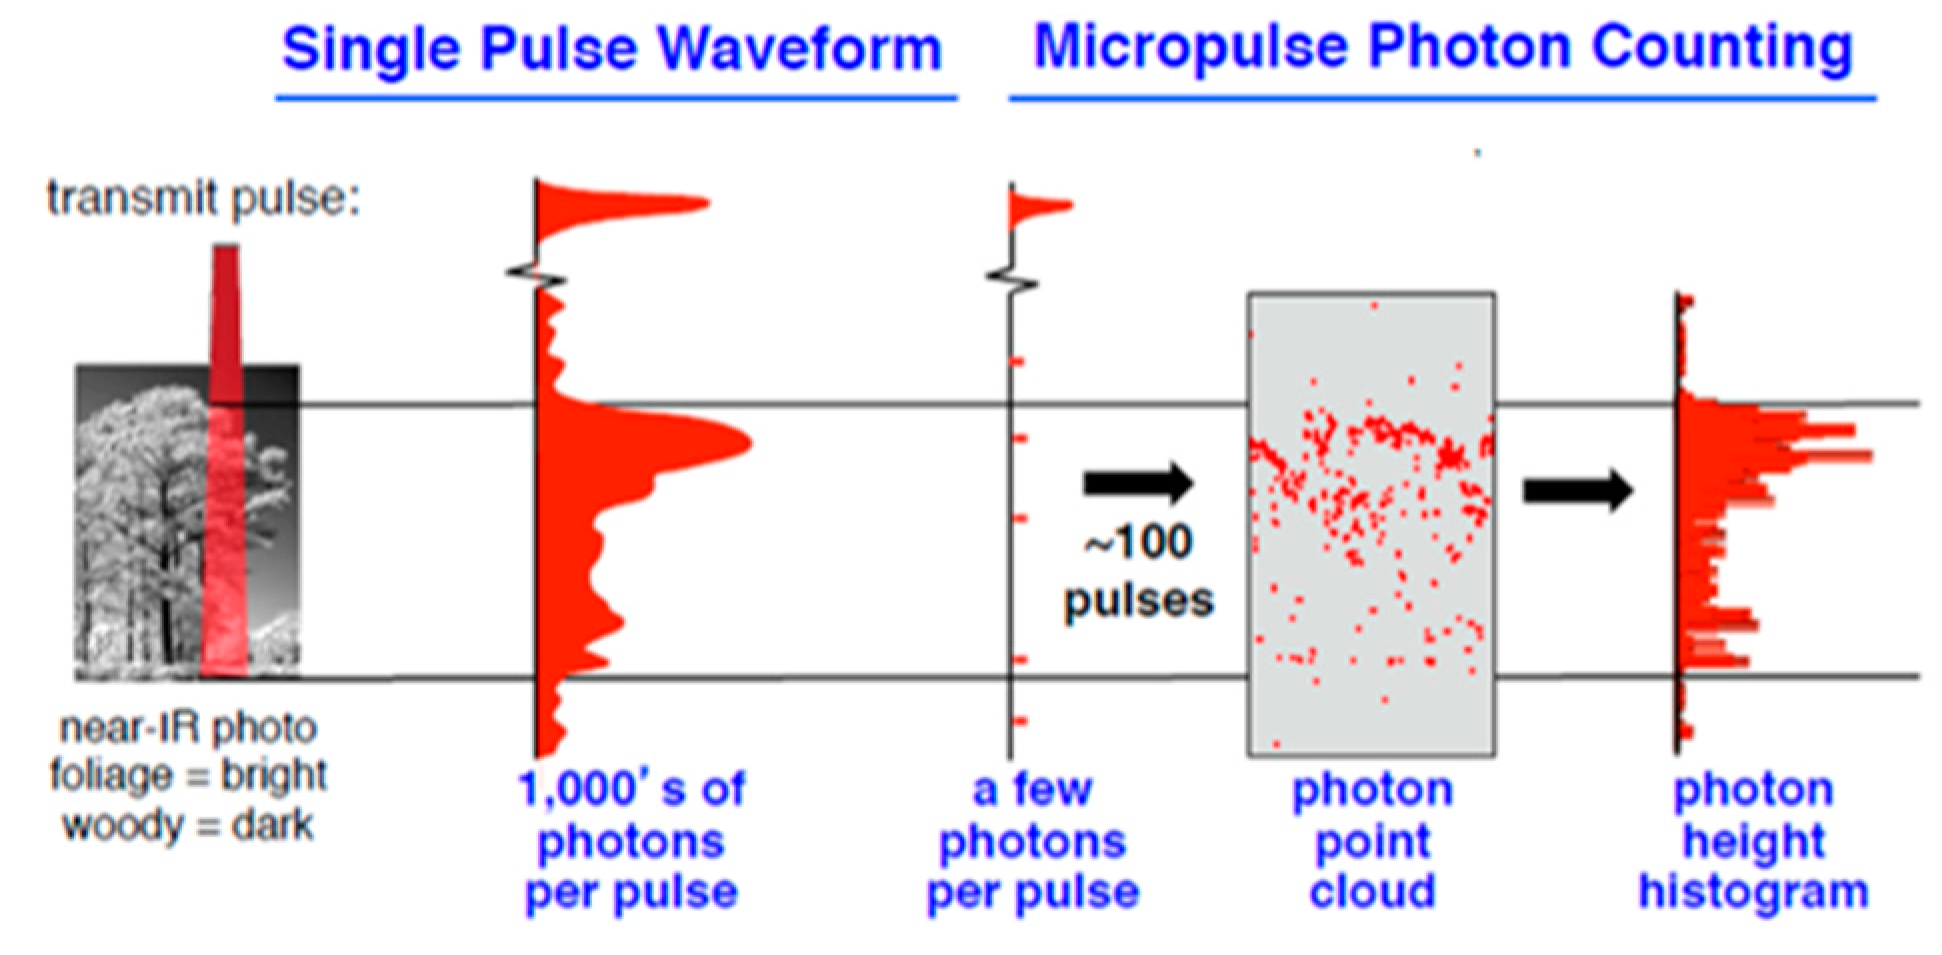
ATLAS will use a multi-beam, micro-pulse laser and single-photon detection capabilities to measure the range between the instrument and the reflective surface. Of primary interest to the ecosystem community is the accuracy to which the terrain and canopy height can be derived from altimetry in the forest environment. Certainly, there is ambiguity as to where within the vertical column the photon will be reflected, which creates an opportunity for potential biases in the derived heights. Given the differences in the photon-counting and full-waveform altimetry detection approaches, there is not a direct translation to the performance capabilities between the two system types shown in
Figure 2. Full-waveform sensors record the entire temporal profile of the reflected energy along the laser line of sight, including the vertical structure of the canopy when present. However, this profile record is based on the signal exceeding a certain energy threshold and is not impacted by significant noise. Features in the waveform correspond to surfaces encountered by the laser energy (e.g., clouds, vegetation or terrain). In contrast, photon-counting systems will record time tags (arrival) for every detection event within the vertical distribution, including both the signal and noise. As such, an accumulation of multiple shots (>100) could produce a histogram of ranges based on the received photons similar to the product provided by the full-waveform systems and statistically representative of a probability distribution function (PDF) for the location of a detection within the vertical extent of the measurement. This statistical assessment of where the photons are actually reflected from within the PDF is referred to as the vertical sampling uncertainty and points to error associated with the interpretation of the height from the data, as well as the precision of the measurement. Again, the focus of this study is to quantify the vertical sampling uncertainty for various ecosystems in the form of a mean height bias and measurement precision as a first step toward quantifying the potential performance for ICESat-2 once it is on orbit. Effectively, the bias value is an indication of the accuracy of the height retrieval process as compared to ground truth, and the precision is the standard deviation of the measurements over the multiple iterations. Certainly, the results from this study will not provide a comprehensive understanding of the anticipated quality of ICESat-2 data, but will create a performance baseline for future studies that can build upon this first step. Future studies are warranted in order to investigate how the presence of solar noise will potentially impact the vertical sampling errors associated with the height retrieval process and how the use of a visible wavelength might differ from measurements collected using the near-infrared over vegetation.
The number of detected photon events associated with each outgoing laser pulse is a function of the transmitted laser energy, surface reflectance, solar conditions and scattering and attenuation in the atmosphere. For highly reflective surfaces (e.g., ice sheets) and clear skies, approximately 10 signal photons from a single strong beam are expected to be detected and recorded by the ATLAS instrument for a given transmit pulse. Over vegetated land where the surface reflectance is considerably less than snow or ice surfaces, the signal level is anticipated to be considerably less. This reduction in signal is to be expected based on the design cases analyzed for surface reflectance characteristics at a 532-nm wavelength; snow and ice surfaces have high reflectance (Lambertian), between 0.8 and 0.98 [
14], while canopy and terrain surfaces have much lower reflectance (typically around 0.3 for soil and 0.1 for vegetation). As a consequence, there will be 1/3–1/9 as many photons returned from terrestrial surfaces as from ice and snow surfaces. For vegetated areas, the number of reflected signal photon events per transmitted laser pulse is estimated to range between 0 and 3 photons for the strong beam case, depending on land cover and atmospheric conditions.
The ICESat-2 Instrument team has developed a full series of design cases for different generic land cover types in order to support the development of an estimation model for quantitative signal prediction. This model is based on the expected number of photons using a Poisson distribution for each outgoing laser shot using the planned ICESat-2 measurement scenario (footprint size and spacing) and the vegetation and soil reflectance characteristics. Three design cases for vegetation are shown in
Table 1. For example, every 70 cm in the along-track direction, the ATLAS instrument will potentially detect zero, one or two returns over boreal forest.
Geophysical algorithms developed by the ICESat-2 Science Definition Team (SDT) will produce estimates of terrain heights and relative canopy heights based on the statistical analysis of detected photons. The objective of this research is to determine the effect of vertical sampling error as a first step towards quantifying the likely performance characteristics and potential uncertainties in the land and canopy height products of ICESat-2/ATLAS for different vegetation types.
2. Materials and Methods
2.1. Data
In support of the performance study for space-based photon-counting LiDAR specific to terrestrial applications, ICESat-2/ATLAS data were simulated for multiple ecosystem types using existing airborne, small-footprint LiDAR datasets. Five specific areas were selected and include an oak-juniper savanna in central Texas, a pinon-juniper savanna in central New Mexico, boreal forest in central Alaska, deciduous hardwoods in eastern Tennessee and tropical moist forest in western Gabon. Each of these individual areas are discussed below and are also summarized in in
Table 2.
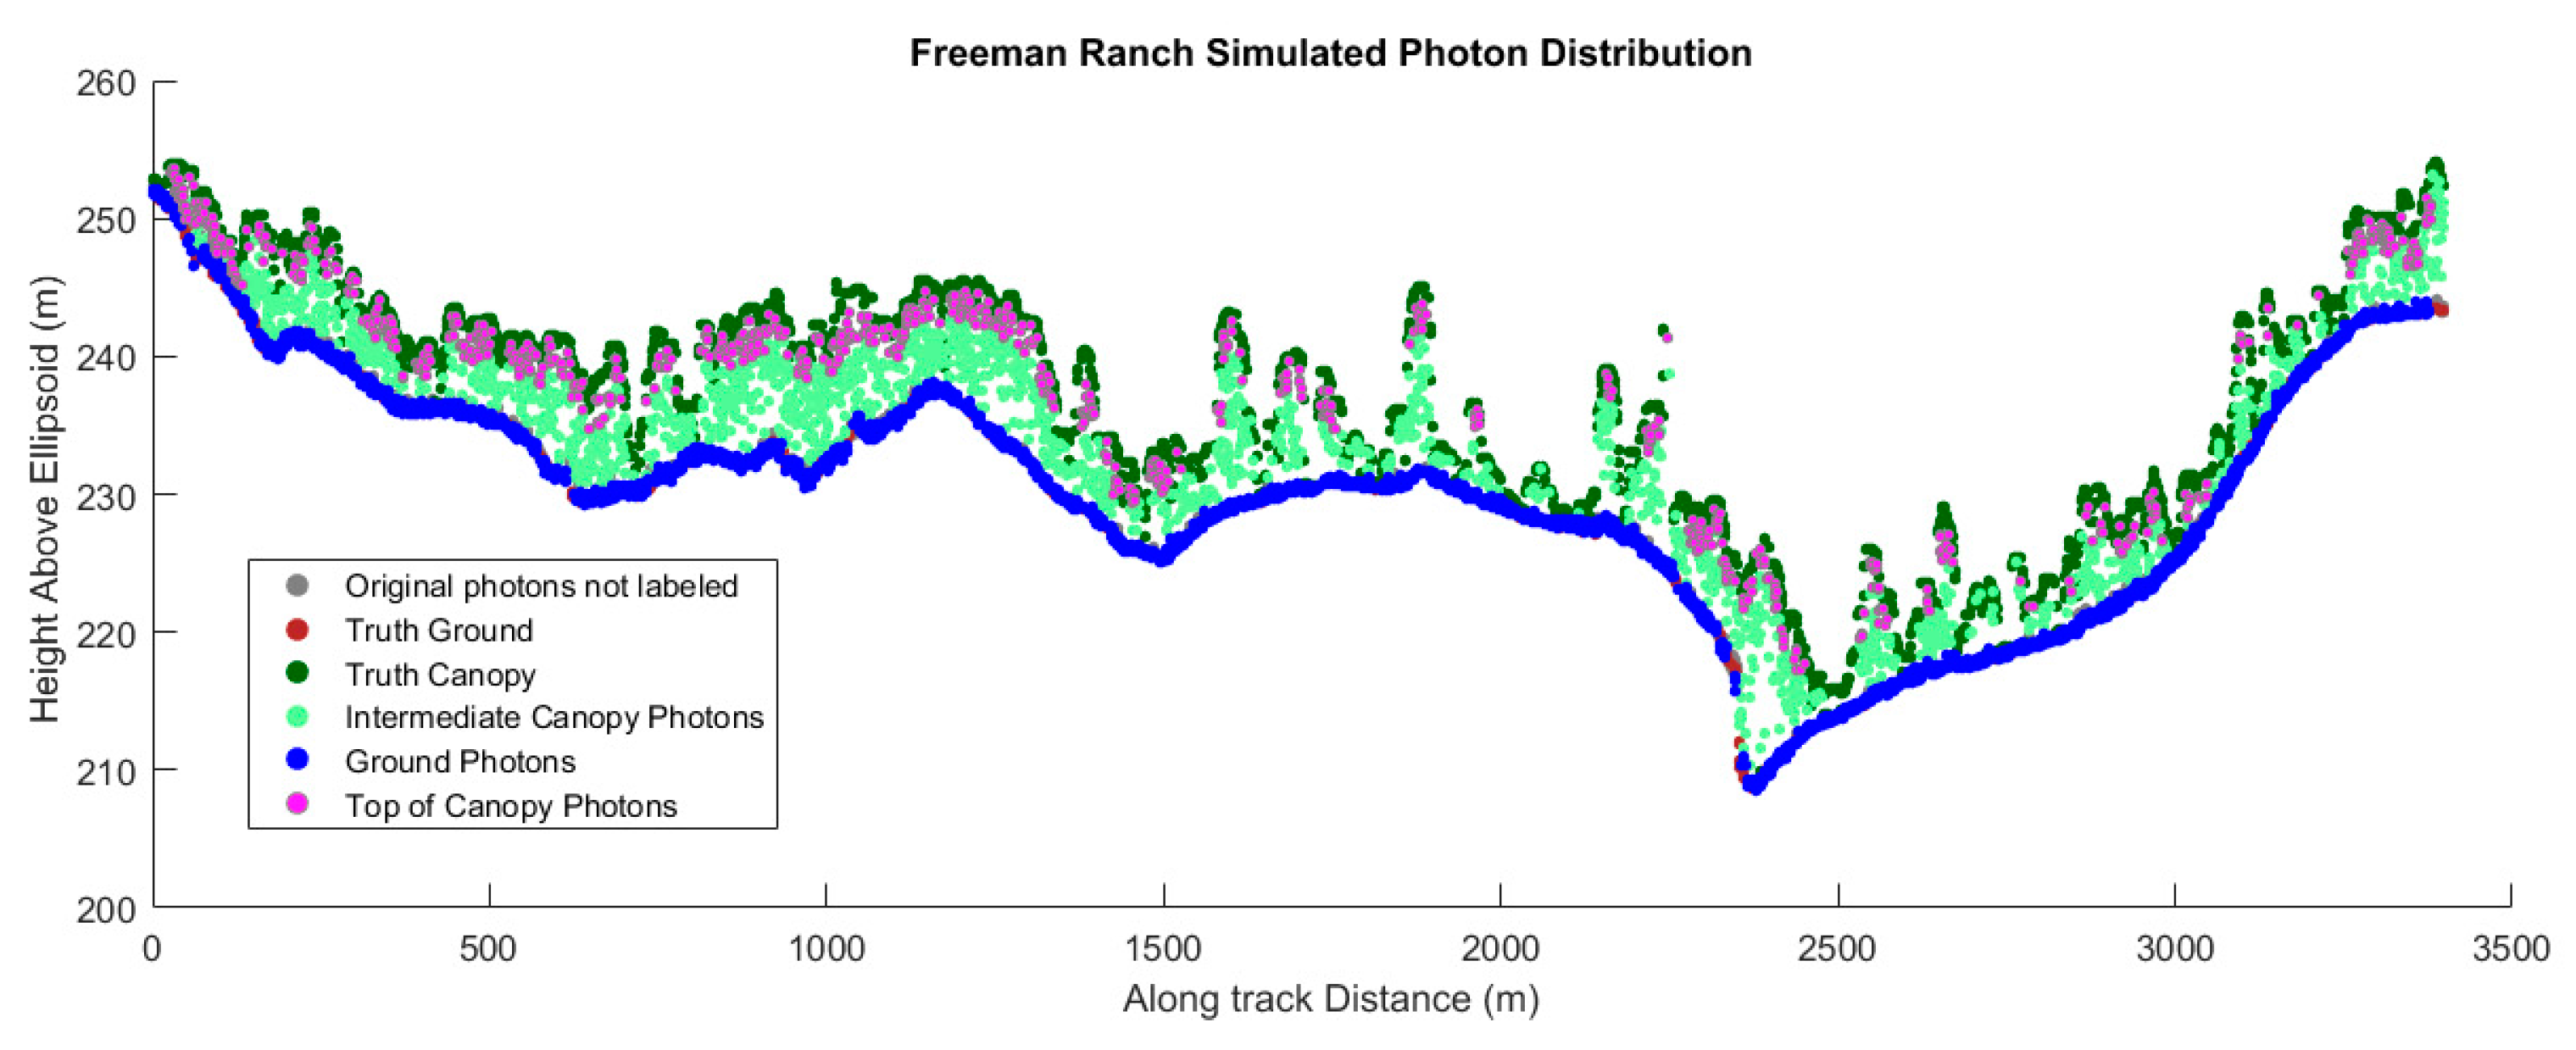
Woodland savanna: Small-footprint, full-waveform airborne LiDAR data were acquired in September 2010 over Freeman Ranch (29°56′N, 98°W) located near San Marcos, Texas. Freeman Ranch (~17 km2 in size) is a live oak (Quercus virginiana)-Ashe juniper (Juniperus ashei) savanna woodland and is typical of the vegetation in central Texas. For this study area, live oak is best characterized with trees heights approaching 13 m and having distinct vertical layers within the canopy. For this survey, the average point density of the LiDAR survey was ~10 laser shots per m2. The accuracy of the small-footprint LiDAR data was determined using kinematic GPS survey data collected within the survey area and was found to have a vertical accuracy of 10 cm or better for open surfaces.
Additional airborne LiDAR data were collected over several sites in central New Mexico in 2011. One of the sites is located in a pinon-juniper savanna woodland, 24 km southeast of Willard, NM (34.425489, −105.861545), and this study region exists within a managed rangeland ecosystem, with one-seed juniper (J. monosperma) and pinon pine as the two dominant woody species present. The LiDAR point cloud data had an average horizontal point spacing of 20 cm and a point density of approximately 10 points per m2. The mean horizontal relative accuracies was 25 cm, and vertical accuracy was approximately 10 cm or better for open surfaces.
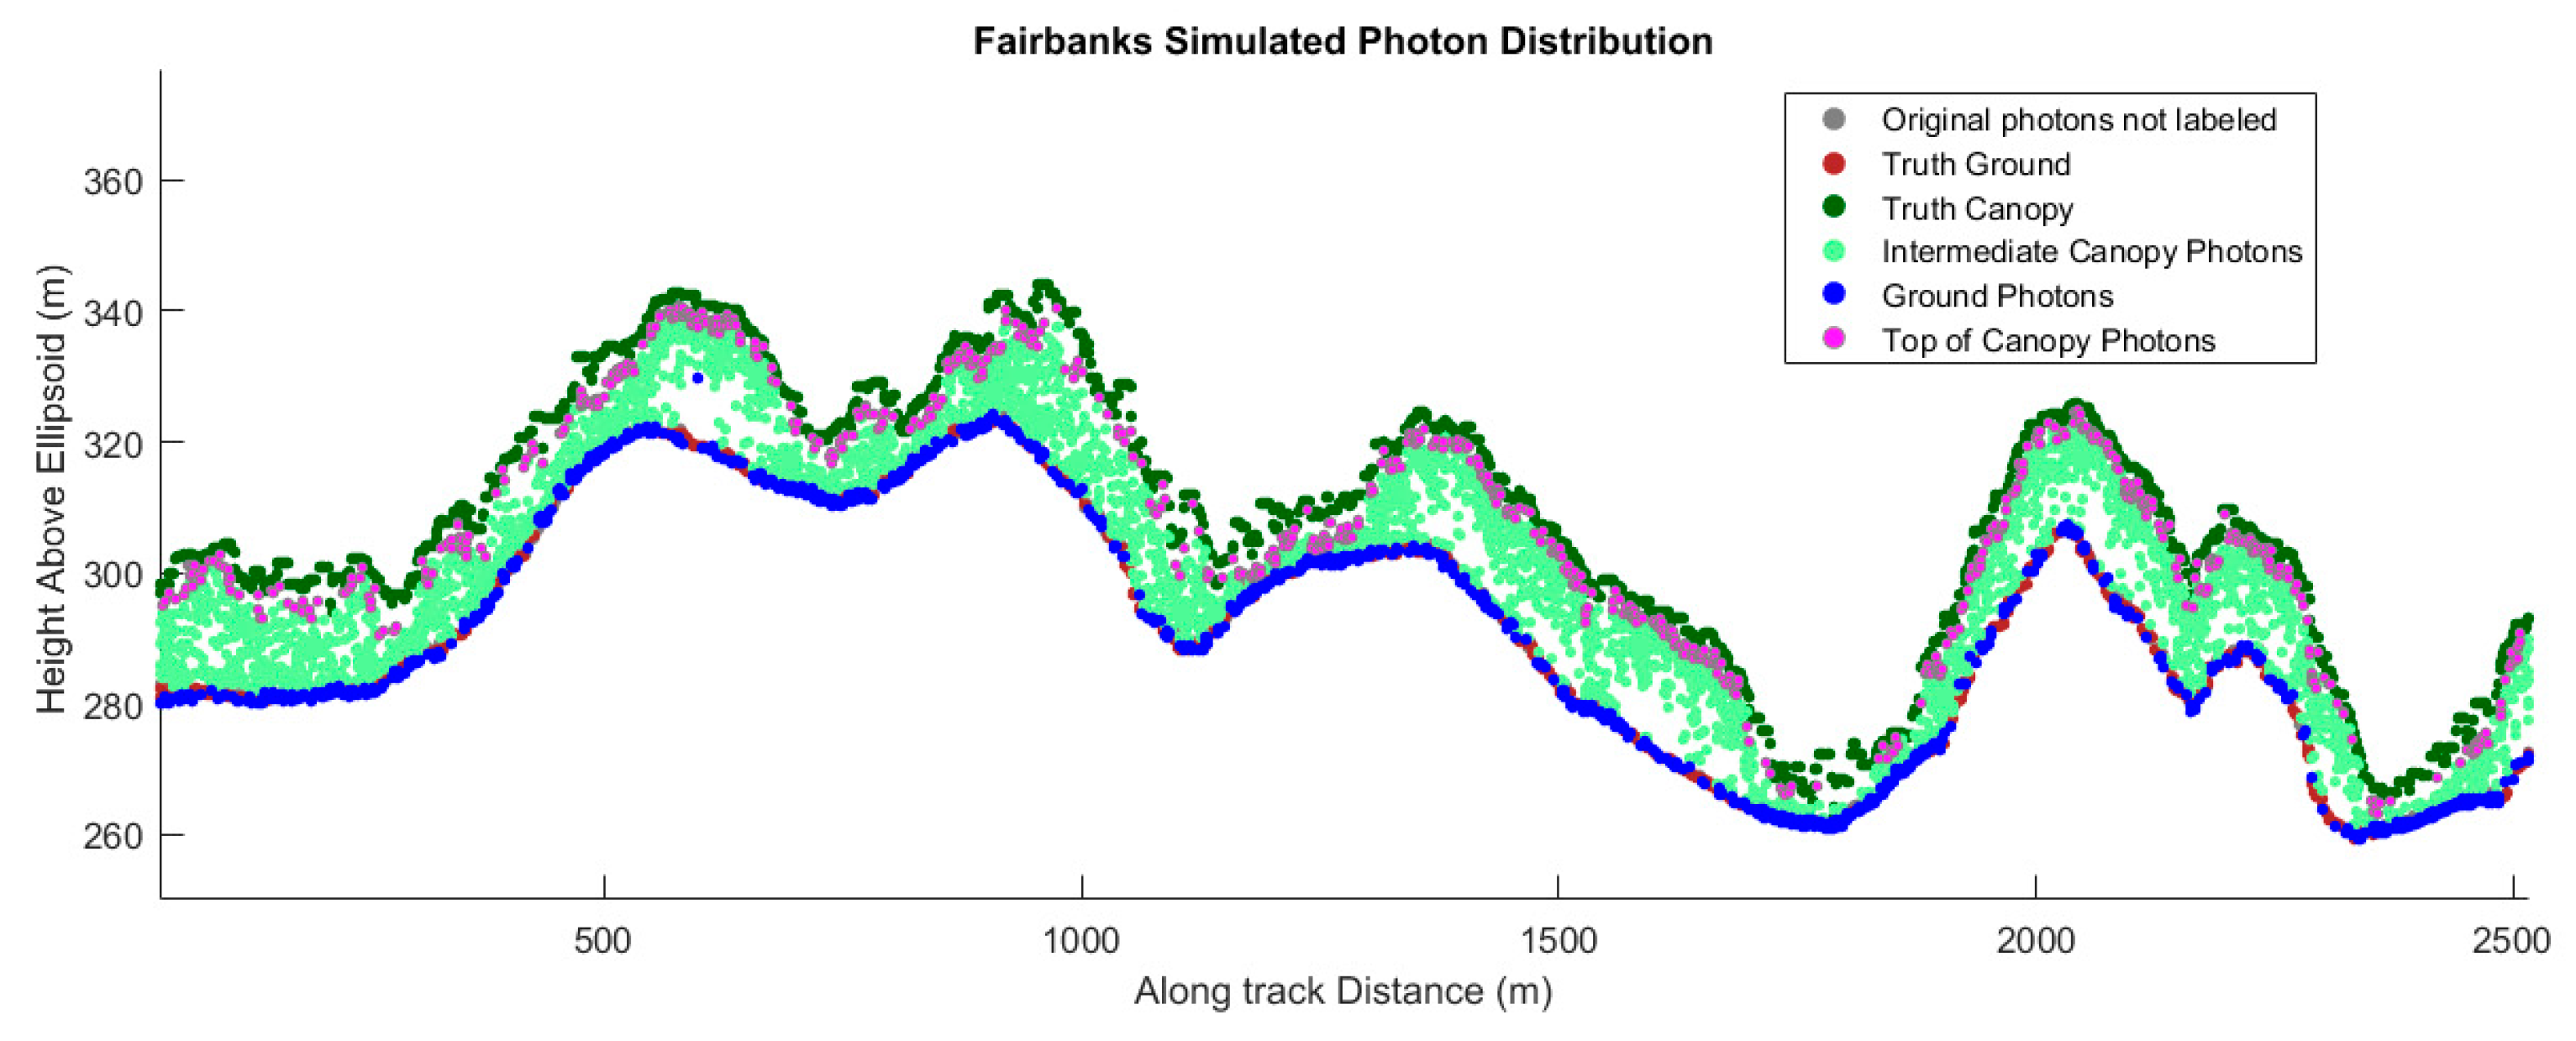
Boreal forest: The NASA Goddard Lidar, Hyperspectral and Thermal imager (G-LiHT) near Fairbanks, Alaska, in 2014 was also used in this study. The average point density for this dataset is approximately 5 points per m2. Similar to the approach used with small-footprint, full-waveform data to create a statistical representation of the ICESat-2 signal characteristics, the discrete elevations provided by this type of airborne sensor system can be aggregated to create a pseudo-waveform. However, the concession of using discrete data is effectively a lower digitization rate, meaning the full-waveform data provide a complete vertical history of the propagated laser energy, while the discrete return offers a limited sampling rate along the laser line of sight. Although the discrete return point density is not considered particularly high for this type of simulation, a 13 m-diameter simulated ICESat-2 footprint would consist of roughly 660 LiDAR points to construct the pseudo-waveform and does provide sufficient information as to the canopy structure and the relative capability of ICESat-2 for this region. Vegetation in the interior boreal forest consist of predominately black spruce.
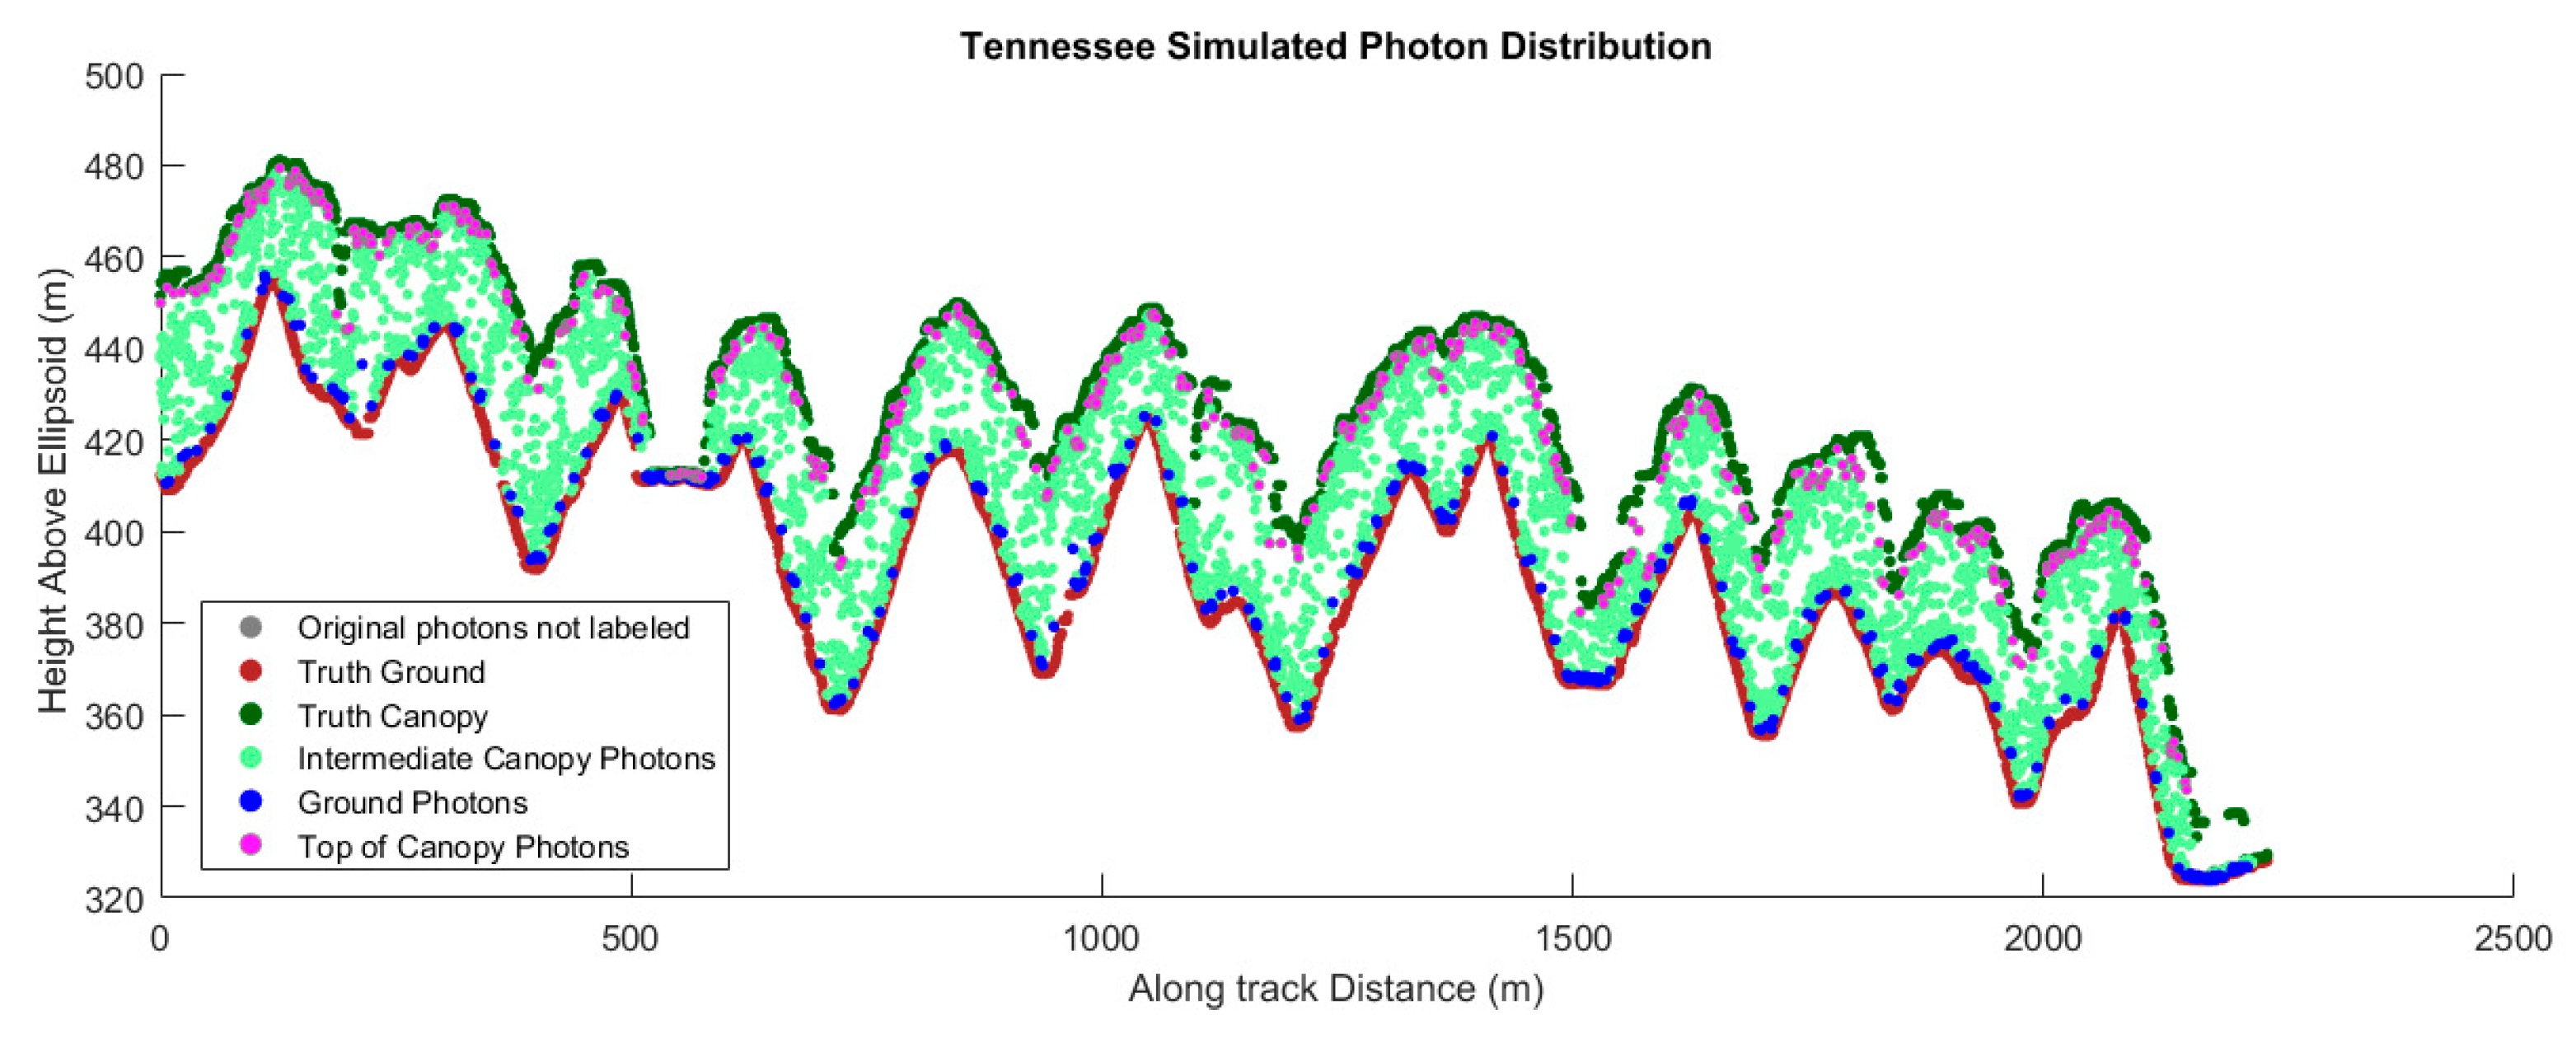
Temperate hardwoods: Small-footprint, full-waveform airborne LiDAR data were acquired in October 2011 over Bays Mountain, TN (36°31′N, 86°35′W), located near Kingsport, TN. This region in eastern Tennessee is a mixture of deciduous hardwoods (i.e., red oak, white oak, scarlet oak, chestnut oak, mockernut hickory, sweet birch and bear oak). The survey area corresponded to 1400 m × 250 m over the northern region of Bays Mountain. The LiDAR data were acquired with an average point density of 20 points per m2. The accuracy of the small-footprint LiDAR data was determined using kinematic GPS survey data collected within the survey area and was found to have a vertical accuracy of 10 cm or better for open surfaces.
Tropical forest: Small footprint airborne discrete LiDAR data with a nominal point density of 40 points per m
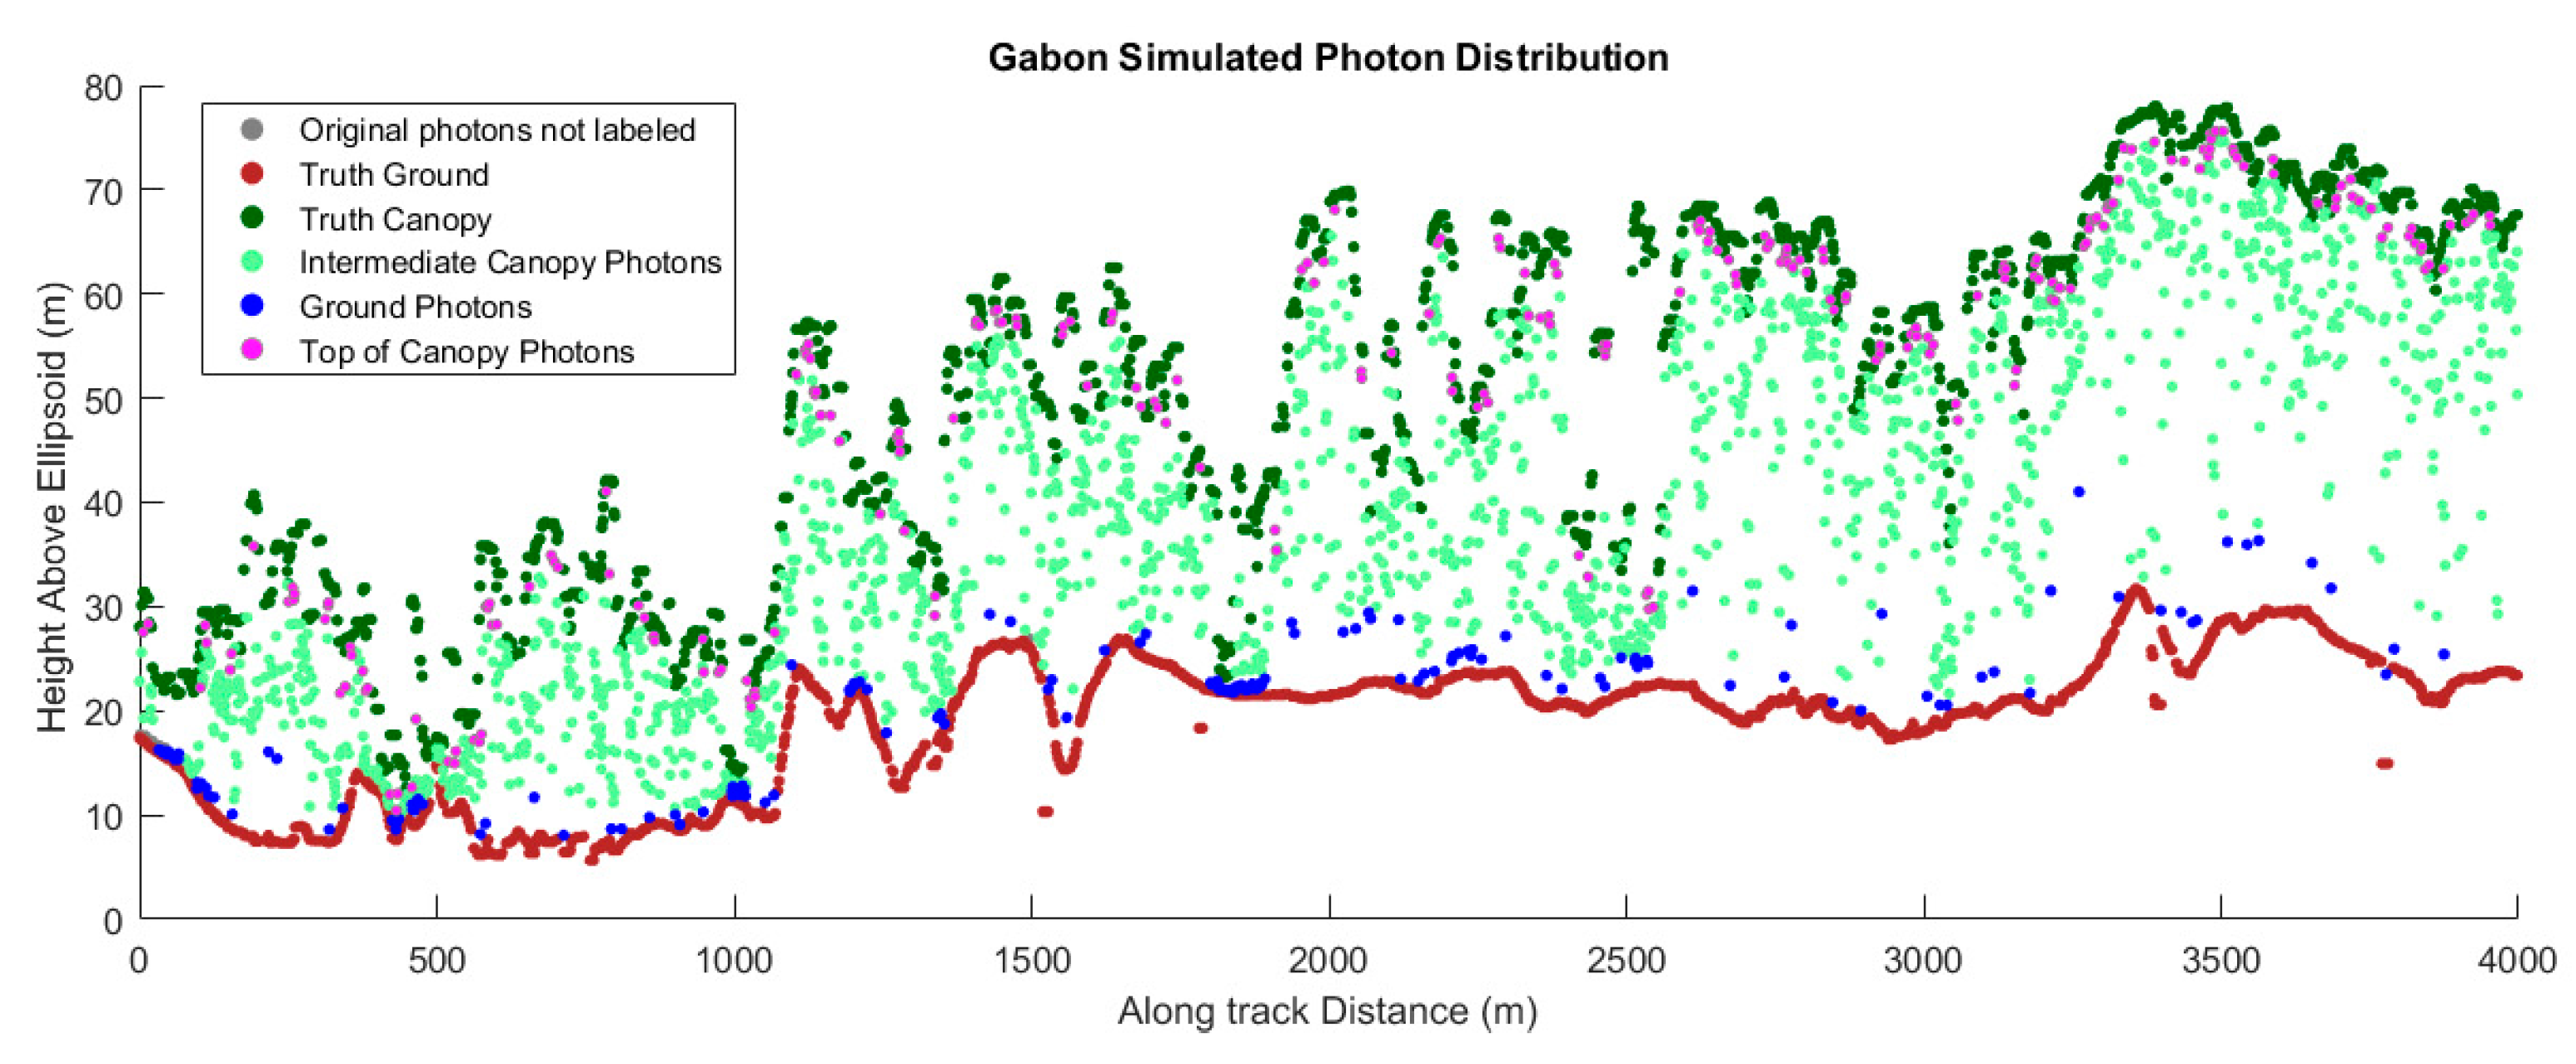
2 over Gabon, Africa, were used to support analysis over a tropical forest environment. Data with this point density allow for the construction of higher fidelity pseudo-waveforms for canopy structure detail than achieved for the lower density G-LiHT datasets. This airborne LiDAR data were collected in November 2011 over the Mondah forest in Gabon. Information regarding the LiDAR acquisition scenario was not provided with the data; however, the data were determined to have a vertical accuracy of 10 cm or better in open areas. The Mondah forest is on the Libreville peninsula and is located approximately 20 km northwest of Libreville (0°34′N, 9°20′E). The Mondah forest has been traditionally protected; however, recently, peri-urban growth has occurred on its perimeter, and the amount of protected lands has decreased from 10,200 hectares in 1951 to 6750 hectares in 2012 [
15]. In the protected area, the habitat is tropical moist forest, and tree heights range from 15–25 m, with emergent species reaching upwards of 45 m.
2.2. Methodology
Small-footprint, full-waveform LiDAR is essentially a surrogate for the statistical distribution of expected photons from ATLAS once on orbit. As such, these temporal profiles of received laser energy can essentially be used to empirically derive simulated ICESat-2 data by using a normalized waveform as a representative probability distribution function of the detected photons along the simulated vertical distribution. In instances where full-waveform data were not available, small-footprint discrete return data having a high point density (i.e., >30 points per m
2) were used as a surrogate to generate a pseudo-waveform. For this simulation, center coordinates of ICESat-2 laser footprints are determined using a 70-cm center-to-center spacing along a transect within an existing airborne LiDAR survey. Using these footprint center coordinates, the algorithm determined all small-footprint waveforms occurring within the radius of the ATLAS measurement. That is, all small-footprint waveforms within a 6.5-m radius of the center are identified and combined into a 13-m diameter waveform using a 1/e
2 weighting distribution based on the center position. This combined waveform is referred to here as a synthesized waveform, or pseudo-waveform, as mentioned previously.
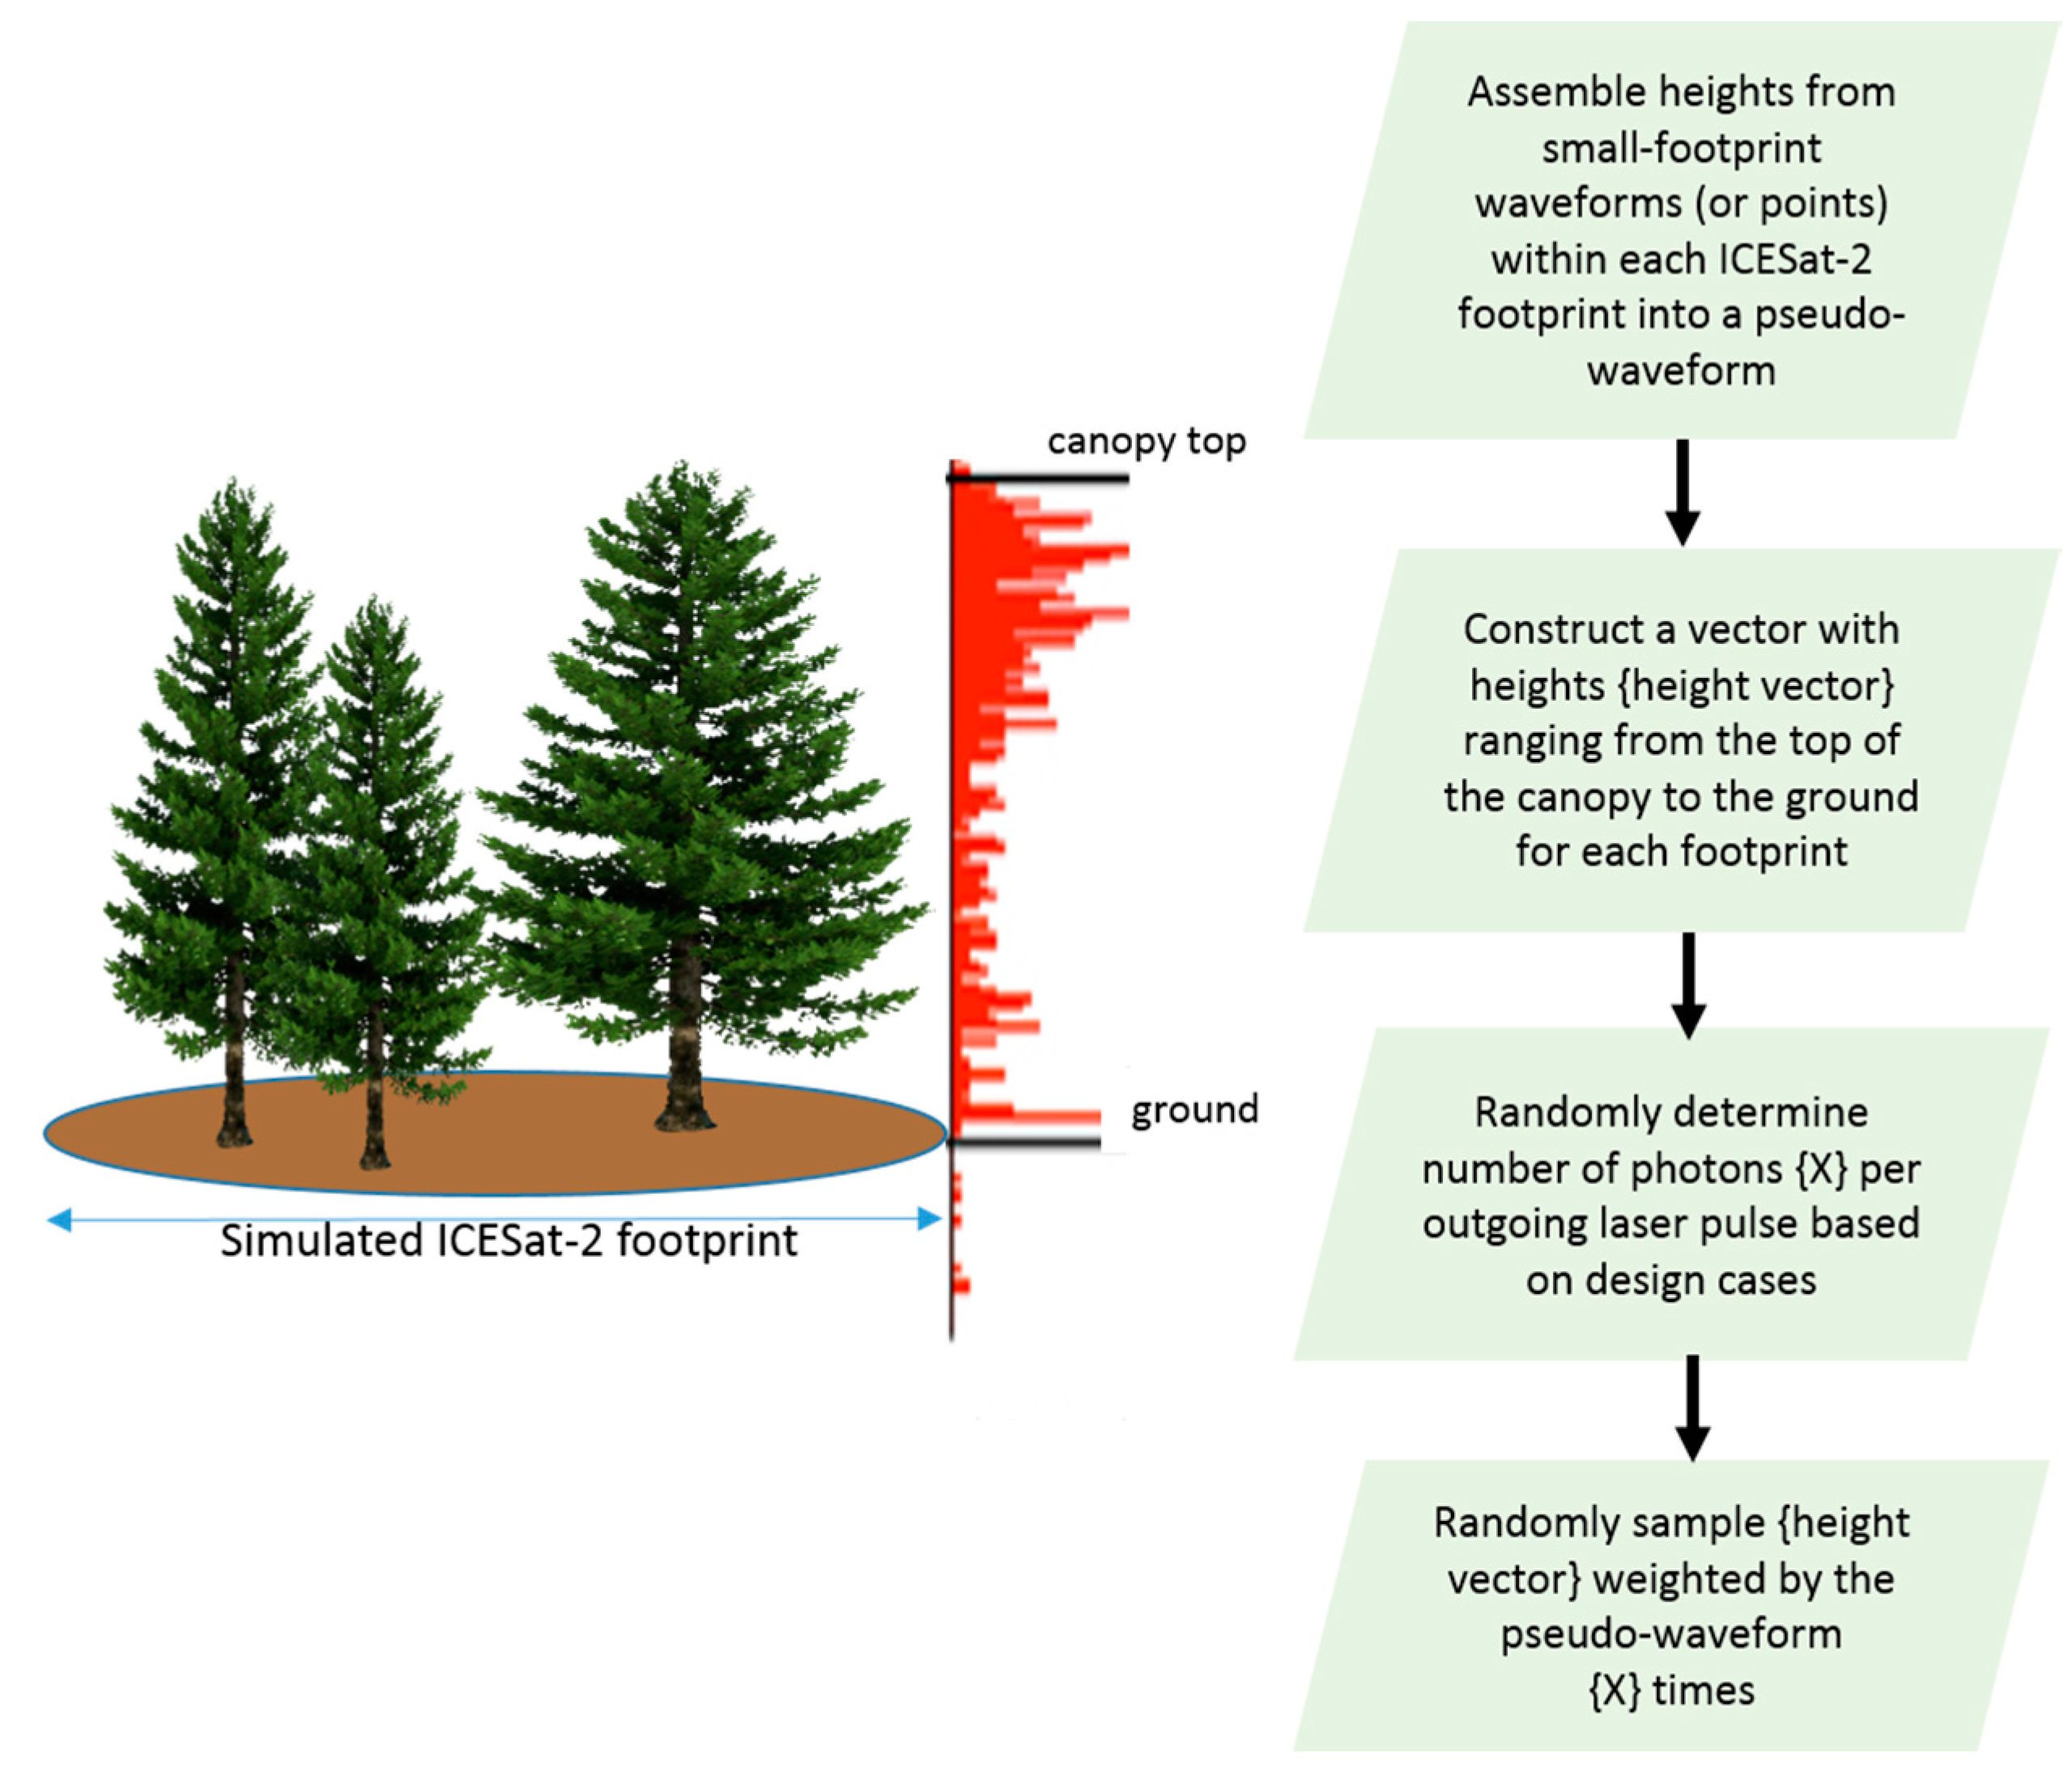
Figure 3 outlines the general methodology used to generate the simulated ICESat-2 data. To generate a probabilistic distribution function (PDF) of laser energy through the canopy, the combined waveform is normalized such that the integrated waveform amplitude sums to a value of one. For each PDF, a height vector is constructed originating at the perceived ground surface to the top of the canopy within each measurement simulation. Based on the design cases developed by the ICESat-2 Project Science Office, a mean number of photons returned for each output laser shot over various ecosystems can be estimated and used to simulate the ICESat-2 data. Using a Poisson random distribution, the number of photons returned for each ICESat-2 footprint, X, was randomly sampled. Next, the height vector is randomly sampled X times using the normalized PDF as the weighting function. For the cases where full-waveform data were not available, small-footprint discrete return data were used. In these cases, the point density was approximately 10 points/m
2 or greater, which should be sufficient to generate a pseudo-waveform to conduct the random sampling. The result of the sampling is a photon (or zero or two) for each simulated ICESat-2 footprint that is randomly sampled from the ground or within the canopy. The simulations shown here were implemented in MATLAB 2015b using software developed by the author. Statistics for each simulation were also produced in MATLAB.
A significant benefit to using airborne LiDAR data in the simulation of ICESat-2/ATLAS data is the role it can provide as ground truth when analyzing the expected space-based results in terms of estimating the terrain and canopy heights for specific regions. The truth height for the terrain is the height associated with the perceived ground (last) peak in the synthesized waveform. The truth height for the top of the canopy is the maximum height associated with the synthesized waveform. In addition to the top of canopy and ground heights, relative canopy height metrics RH50, RH60, RH75, RH90 and RH95 were also computed from the truth data. Relative canopy heights are defined as the percentage of canopy returns above the terrain surface.
The truth heights and height metrics extracted from the synthesized waveforms are compared to those derived from the simulated ICESat-2 data to examine the performance characteristics of the photon-counting system for terrain and canopy height recovery. The initial comparison analyzes the validity to which the signal photons are identified as terrain or canopy. Classifying the signal as ground or canopy is a challenging process given the vertical distribution along a surface inherent to photon-counting systems. The vertical distribution, or point spread function (PSF), of the ATLAS instrument is estimated to be 25 cm based on the pulse width of the laser and expected uncertainties in the timing. As such, ground photons and top of canopy photons were identified as follows using the PSF parameter. The two equations below provide the justification for identifying signal photons as ground (G) or as top of canopy (TOC) based on a criteria associated with the elevations of the aggregated data (step size). The step size was empirically determined as the quantity that would provide a statistically-relevant assessment of the terrain without diminishing the topographic detail.
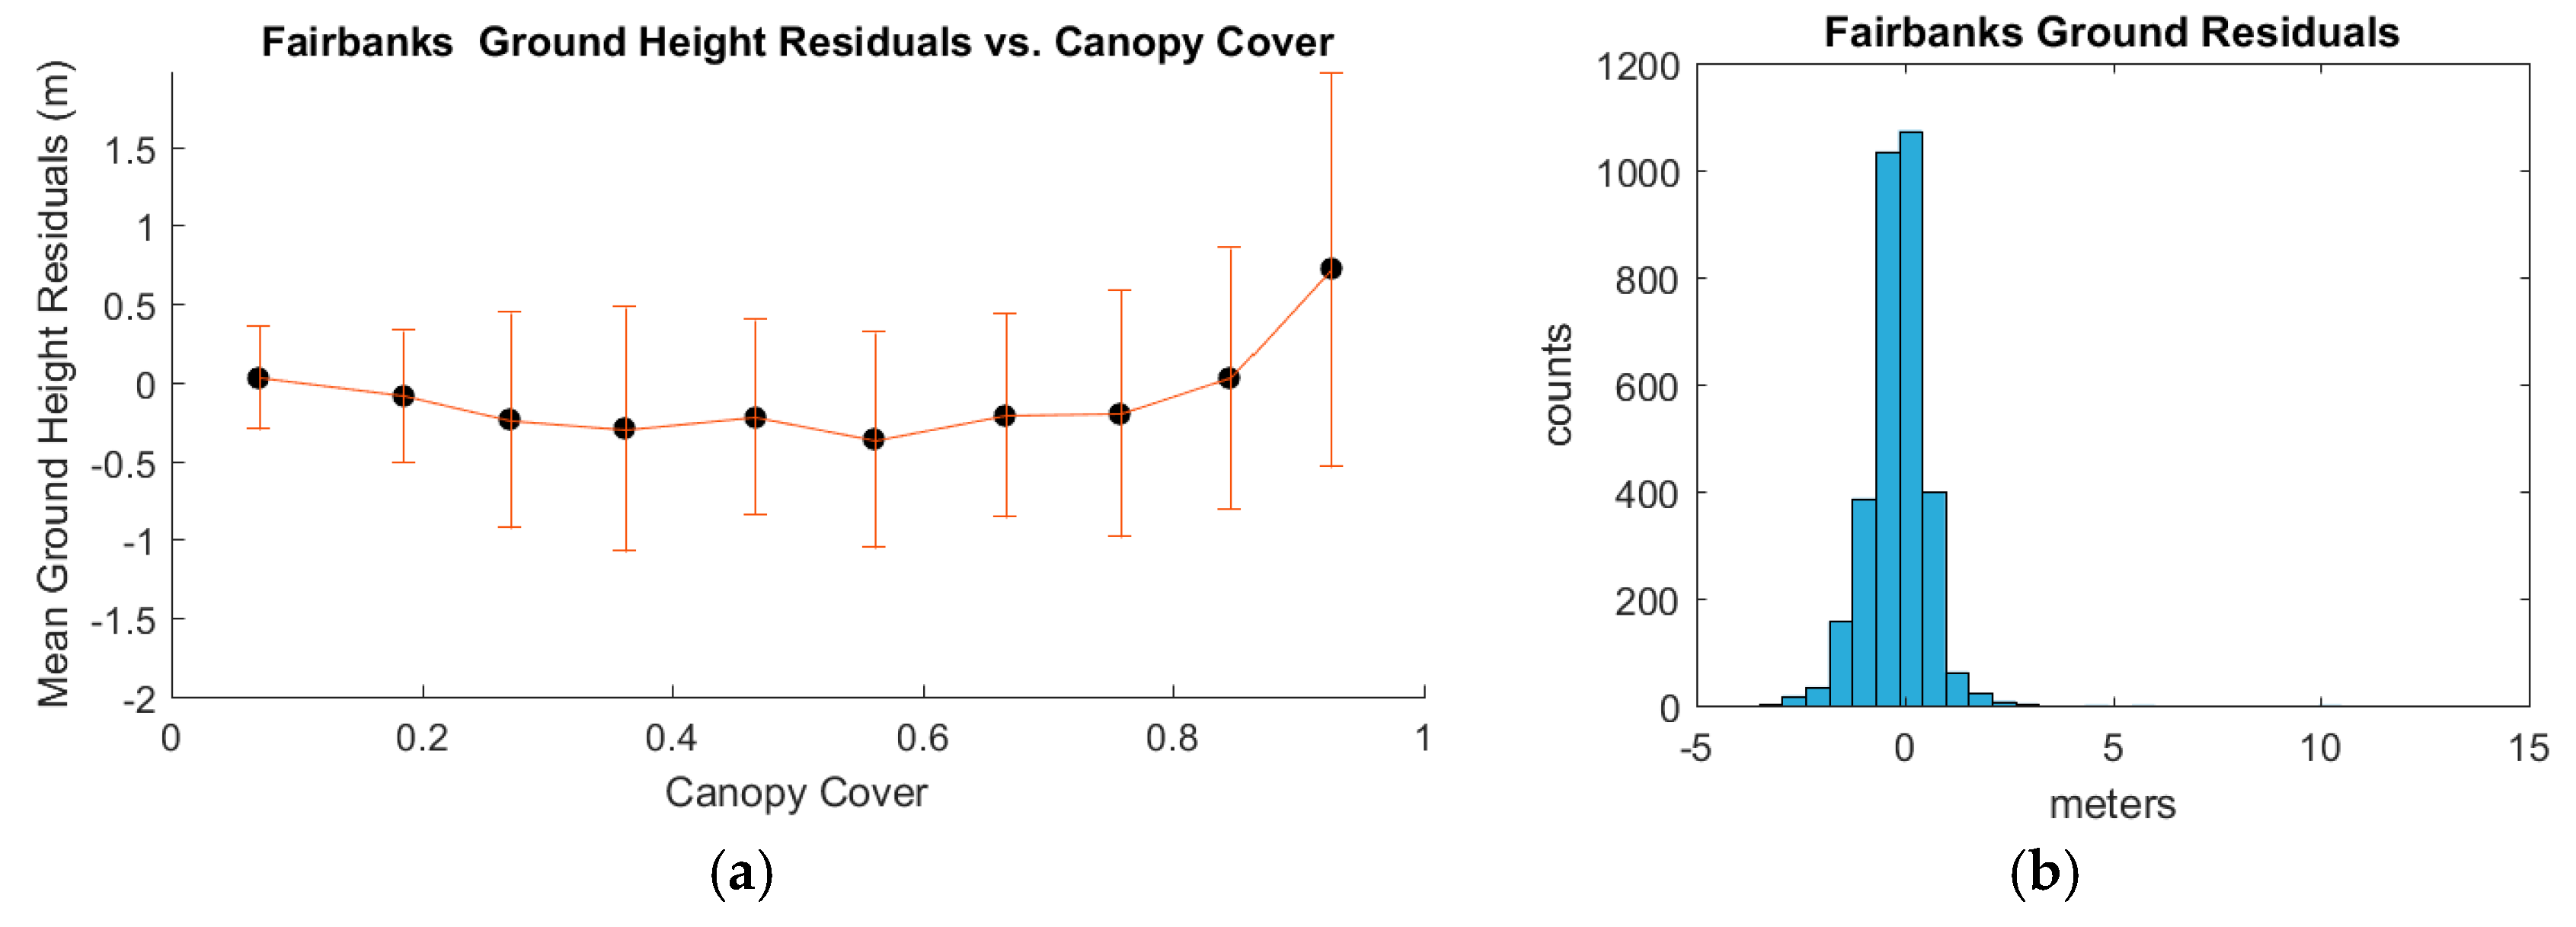
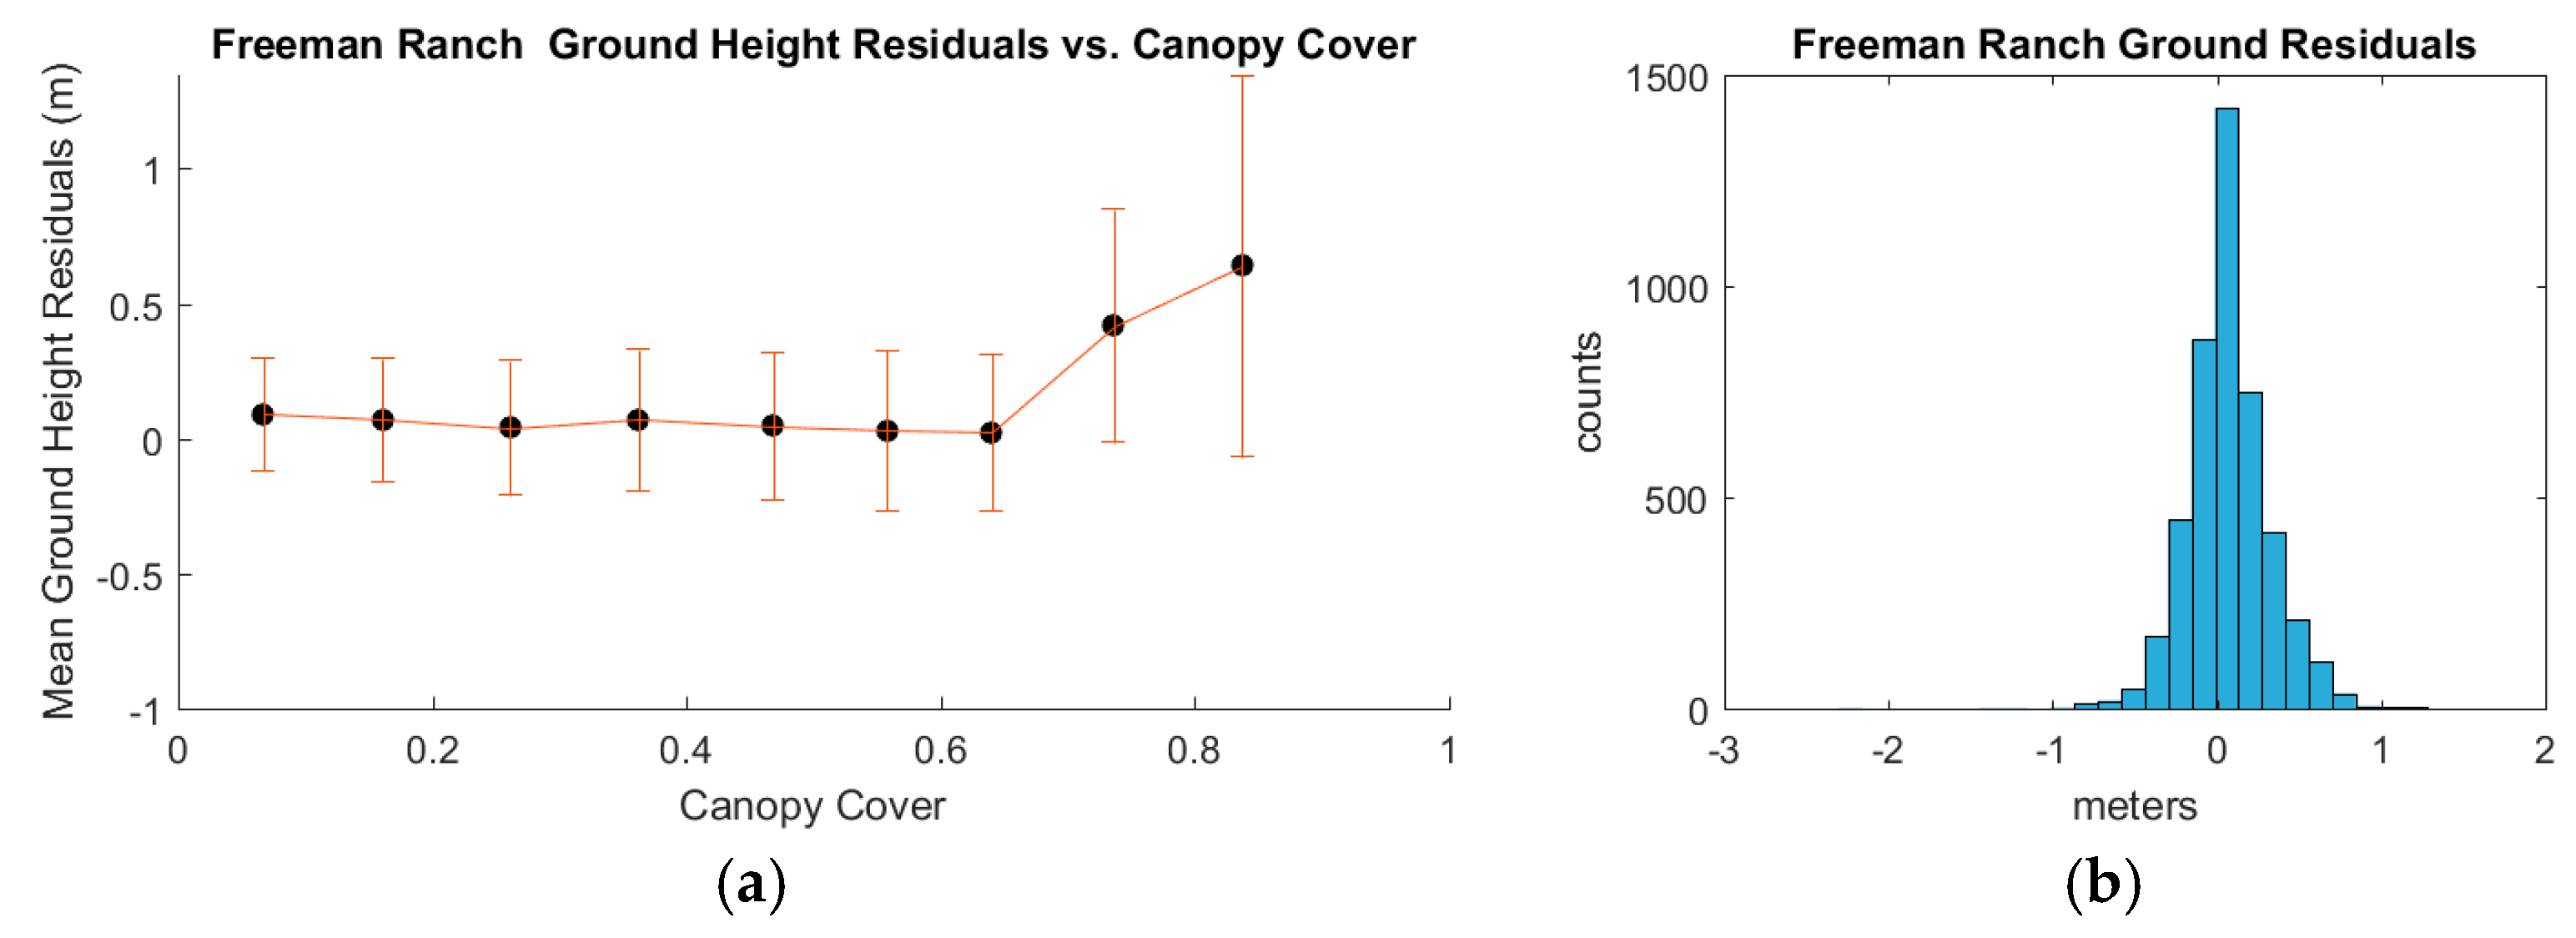
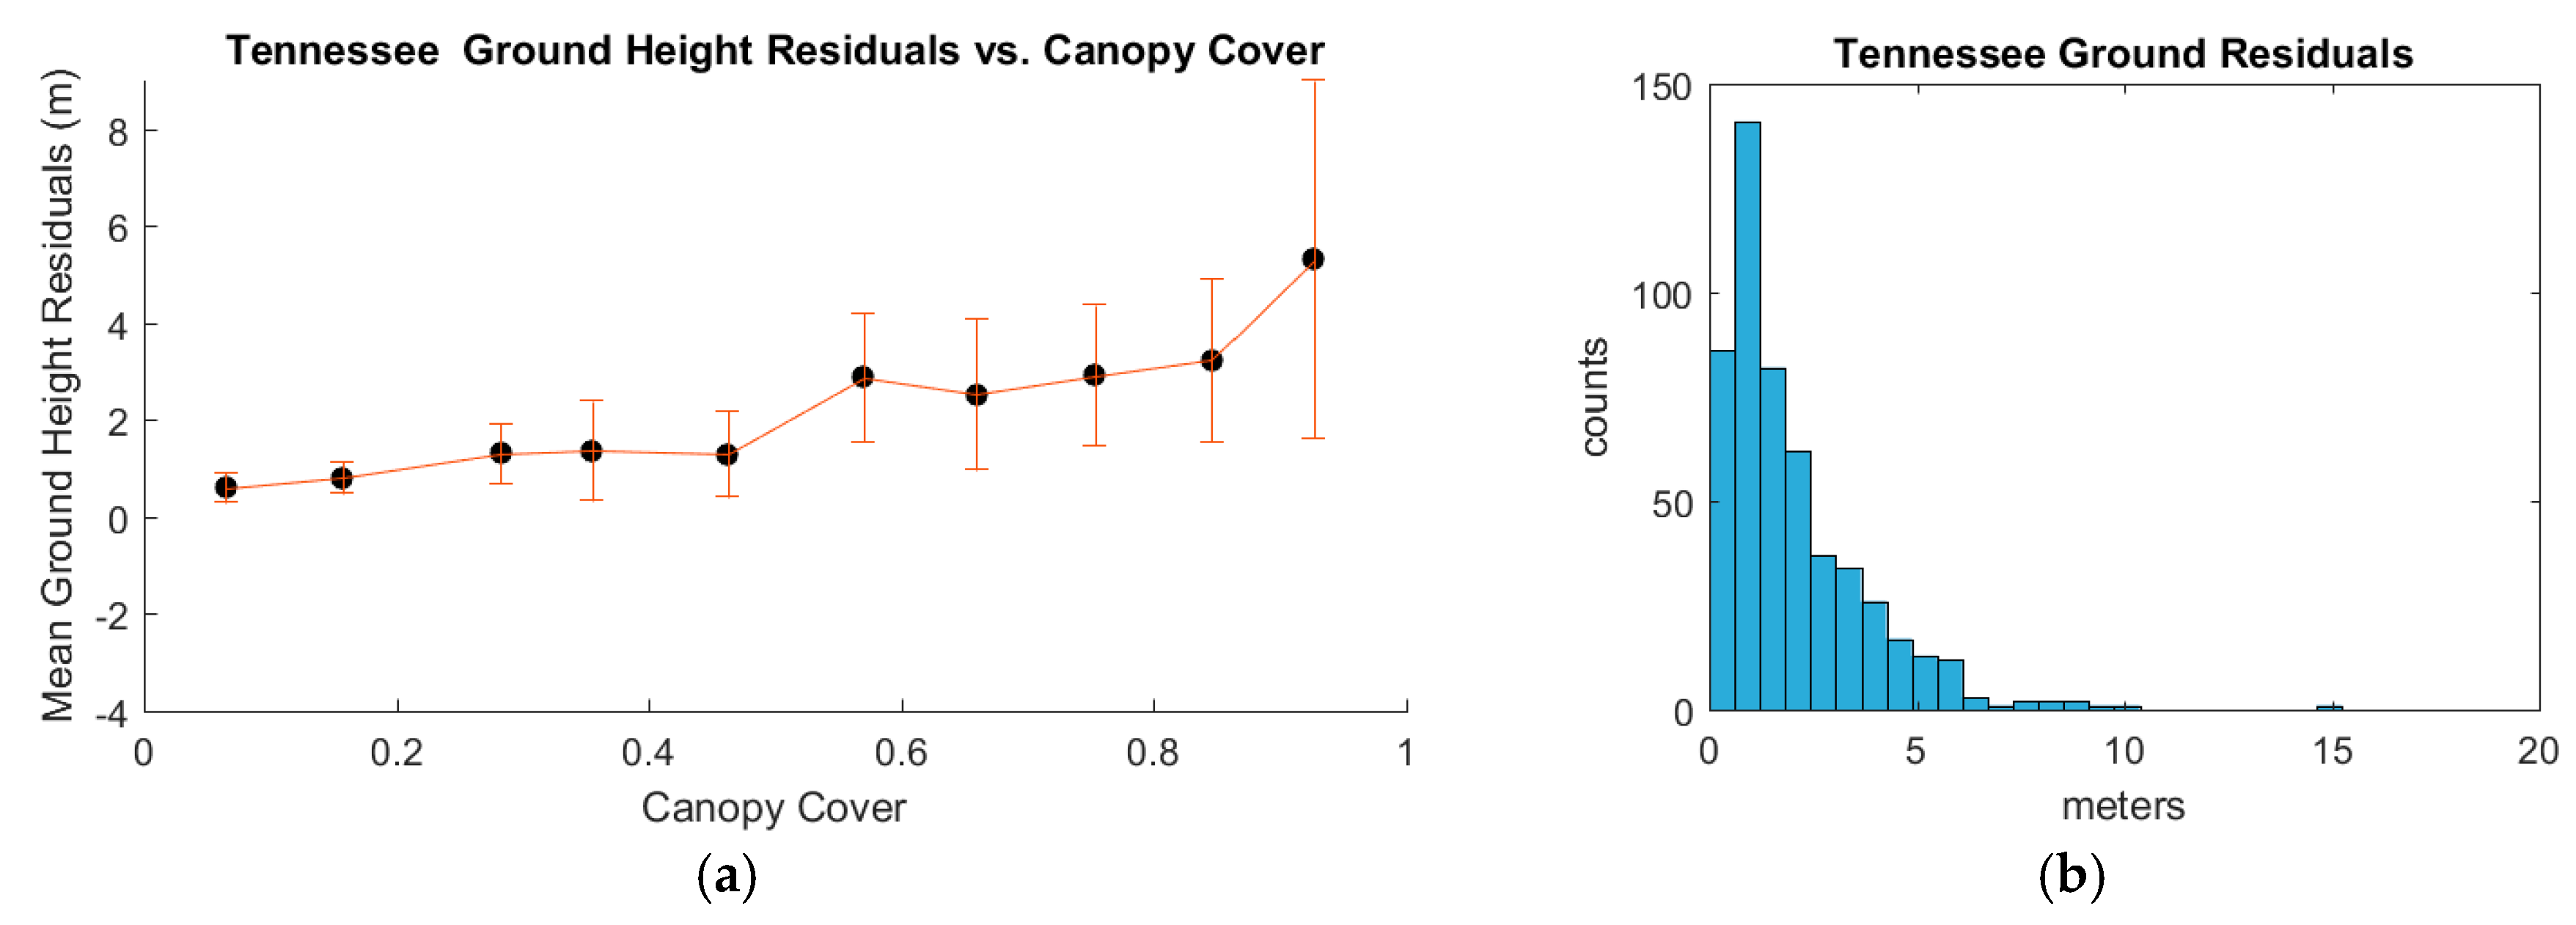
Thus, using an optimized step size of 20 photons along the theoretical ICESat-2 ground track, ground photons were identified as those within three times the PSF relative to the minimum height in the sample bin. The top of canopy photons were identified as those within 1 m of the sample bin (20 photons) simulated ICESat-2 maximum height. The identified ground photon heights were differenced from the truth ground height for each simulated ICESat-2 footprint to examine the potential capability of ICESat-2 in terms of estimating terrain elevations. Similarly, the top of canopy photons were differenced from the true top of canopy height within each simulated footprint. In addition to true top of canopy height, height metrics, such as RH50, RH60, RH75, RH90 and RH95, were computed. Terrain height residuals for the individual iterations (1 or 100) were evaluated for each test area as a function of percent canopy cover. Canopy cover was computed from the input, small-footprint data and is defined as the ratio of the number of canopy returns to the total number of returns.
4. Discussion
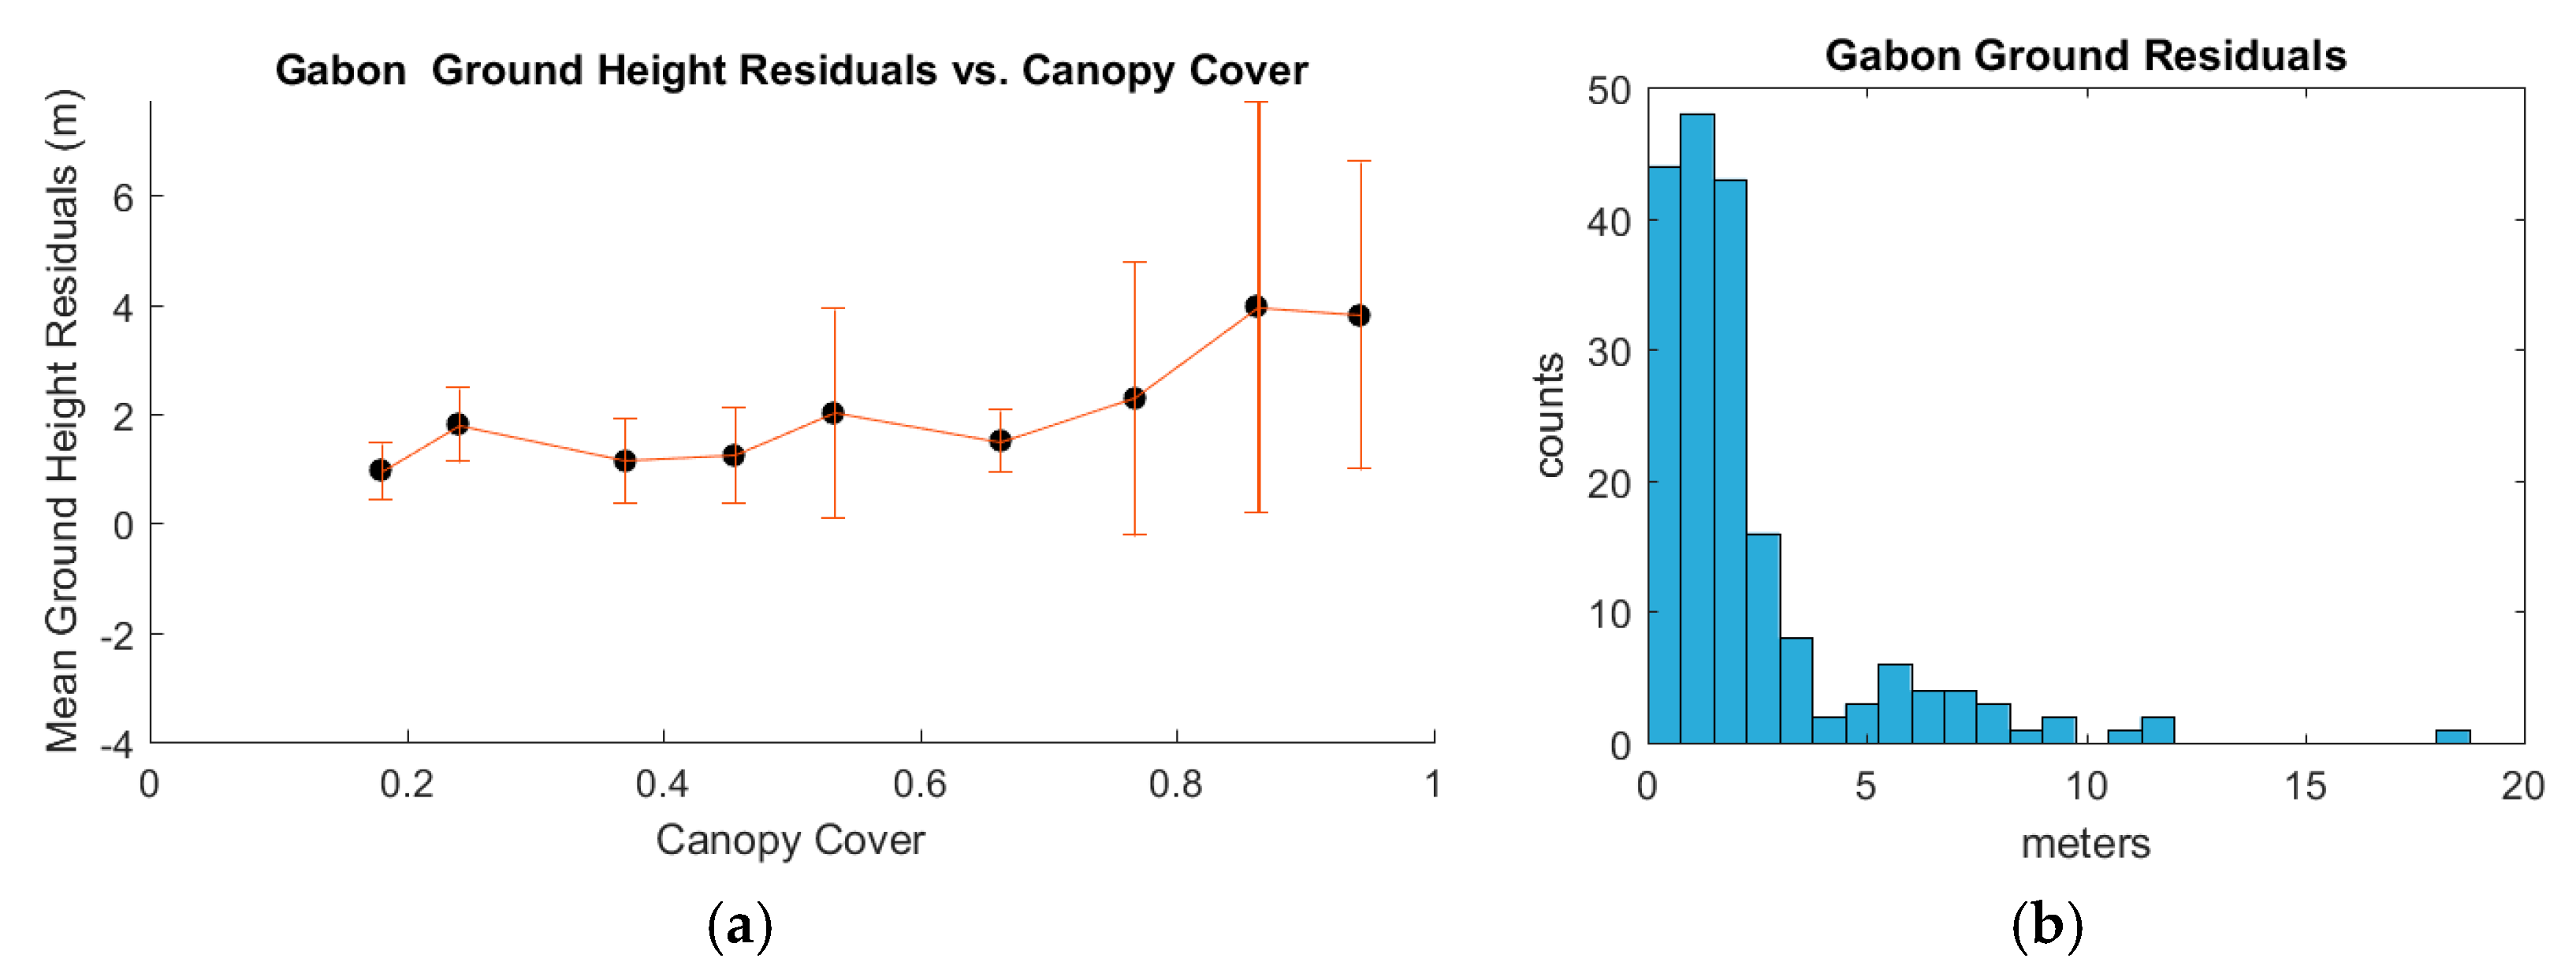
Evident from the results presented here, the deciduous hardwoods and tropical forest ecosystems will potentially see the largest errors associated with terrain height retrievals. These errors are most likely associated with the substantial extent of vegetated cover, as the signal received by the ATLAS instrument is dominated with reflections from within the canopy rather than the ground surface, creating a difficult scenario for accurate terrain height estimation and subsequent canopy heights within the ATL08 product. Any errors in the terrain height will propagate to errors in the canopy height and canopy metrics planned for the data product. One mitigation strategy involves introducing alternate sources of topographic information into the ATL08 processing scheme. Terrain models from other space-based systems, such as TandemX or GEDI, could be utilized; however, there are no plans at present for these data to be integrated into the ATL08 processing algorithm. These alternate terrain models come with their own errors and uncertainties; possibly confusing the errors associated from ICESat-2.
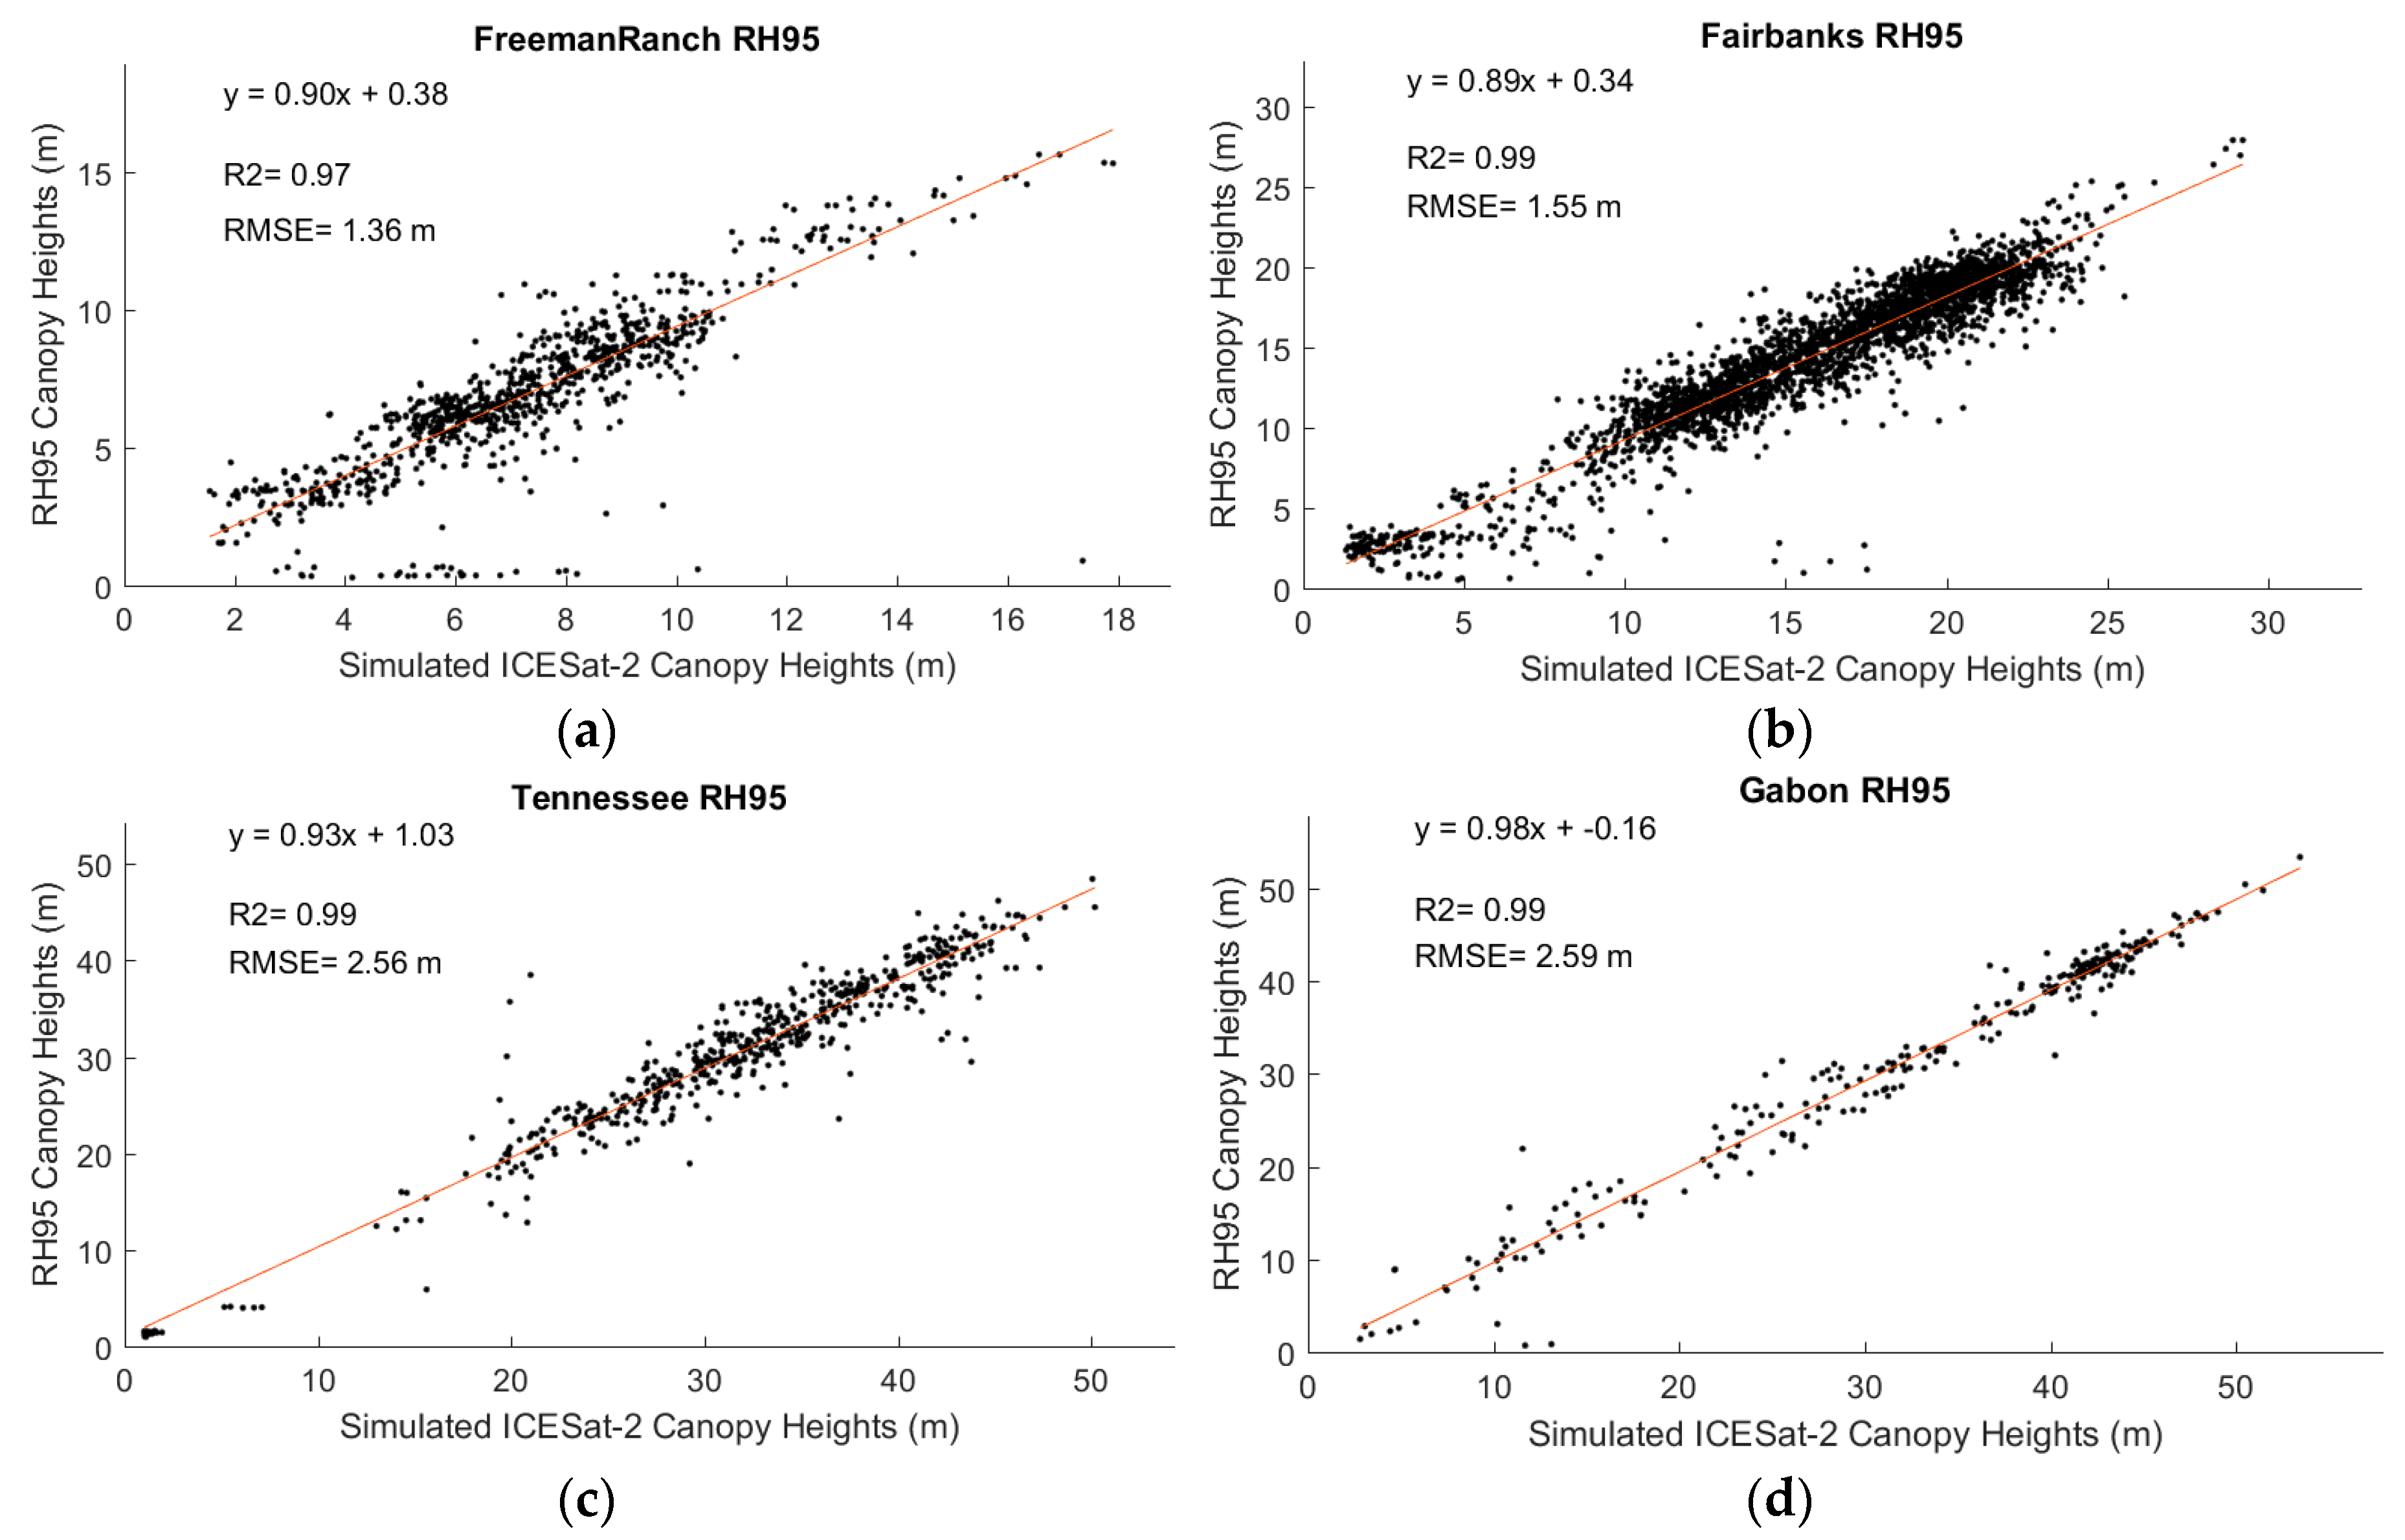
In addition to true top of canopy height, height metrics, such as RH50, RH60, RH75, RH90 and RH95, were computed. Although these simulation results indicate that the ICESat-2 land product will underestimate the true top canopy height, there is a strong correlation between ICESat-2 heights and relative canopy height metrics (e.g., RH95). In fact, for all of the simulations shown here, the ICESat-2 canopy top was strongly correlated with RH95.
Figure 12 shows the relationship of the ICESat-2 canopy height and the RH95 height from the truth data. It is hypothesized that the correlations between simulated ICESat-2 heights and canopy height metrics are a function of both canopy cover and vegetation physiology (e.g., leaf size/shape), which contributes to the horizontal and vertical structure of the vegetation. As canopy cover decreases, the probability of a photon being reflected from the top of canopy decreases, although the details of the relationship between the extent of the canopy cover and canopy height as they relate to ICESat-2 warrant further investigation. Recently, studies using both small-footprint discrete return LiDAR, as well as small-footprint full waveform LiDAR data have shown that RH90 and RH95 heights are highly sensitive to biomass, and RH90 and RH95 were identified as strong predictors in regression models [
17,
18]. Similarly, in the literature, other canopy metrics, such as canopy density, canopy area and canopy cover [
19], have also been shown to be good secondary predictors (i.e., used in conjunction with a canopy height metric), as they are related to the horizontal and vertical structure of vegetation on the landscape [
20,
21]. LiDAR data, both spaceborne and airborne, have been utilized in conjunction with optical imagery to quantify the spatial extent of biomass and estimate forest attributes, including forest cover [
22,
23,
24,
25]. Therefore, although ICESat-2 heights may not reflect the true top of canopy, they remain poised to be an important measurement for estimating biomass globally, particularly in sparse or degraded ecosystems.
The results shown in this paper are empirically derived from existing airborne LiDAR data and indicate the potential performance based on the vertical sampling uncertainty due to the photon-counting detection rate of ATLAS. Another simulation, however, of ICESat-2 has been implemented in a modeling environment, which provides a complementary understanding to the potential performance from ICESat-2 once it is on orbit. Montesano et al. [
26] tested the FLIGHT [
27] radiative transfer model to simulate ICESat-2 performance for the tundra-taiga ecosystem, where vegetation is short and sparse in coverage. The results from Montesano indicate that for ecosystems with a sparse canopy cover, retrieval of canopy heights is problematic, as there is not a sufficient number of photons reflected from the canopy. The simulation results presented in this study did not examine ecosystems with sparse canopy cover; however, we would anticipate similar results to the Montesano study. Certainly, Boreal forest and savanna woodlands can have a wide range of canopy cover; however, the data utilized in these simulations happened to occur over areas with a moderate amount of canopy cover. Just as terrain heights will be challenging to retrieve in dense vegetation cover, canopy height retrieval will be challenging to identify and quantify in sparse vegetation cover. The results discussed in this paper are the theoretical uncertainties of vertical sampling error due to using a photon counting detector with the instrument specifications (e.g., laser power, laser pulse repetition rate) for ICESat-2. Once ICESat-2 is on orbit, other factors, such as solar background noise and algorithm performance, will contribute and may increase the uncertainty of terrain and canopy heights.


