Article

Spatio-Temporal Variation and Impact Factors for Vegetation Carbon Sequestration and Oxygen Production Based on Rocky Desertification Control in the Karst Region of Southwest China

1
Key Laboratory of Agro-ecological Processes in Subtropical Region, Institute of Subtropical Agriculture, Chinese Academy of Sciences, No. 644, Yuanda 2nd Road, Furong District, Changsha 410125, China
2
Huanjiang Observation and Research Station for Karst Ecosystems, Chinese Academy of Sciences, Huanjiang 547100, China
3
College of Geography Science, Nanjing Normal University, No.1, Wenyuan Road, Xianlin University District, Nanjing 210046, China
4
Jiangsu Center for Collaborative Innovation in Geographical Information Resource Development and Application, Nanjing 210046, China
*
Author to whom correspondence should be addressed.
Remote Sens. 2016, 8(2), 102; https://doi.org/10.3390/rs8020102
Submission received: 30 September 2015 / Revised: 19 January 2016 / Accepted: 20 January 2016 / Published: 28 January 2016

Abstract

:
The Grain to Green Program (GTGP) and eco-environmental emigration have been employed to alleviate poverty and control rocky desertification in the Southwest China Karst region. Carbon sequestration and oxygen production (CSOP) is used to indicate major ecological changes, because they involve complex processes of material circulation and energy flow. Using remote sensing images and weather records, the spatiotemporal variation of CSOP was analyzed in a typical karst region of northwest Guangxi, China, during 2000–2010 to determine the effects of the Chinese government’s ecological rehabilitation initiatives implemented in 1999. An increase with substantial annual change and a significant increase (20.94%, p < 0.05) in variation were found from 2000 to 2010. CSOP had a highly clustered distribution in 2010 and was correlated with precipitation and temperature (9.18% and 8.96%, respectively, p < 0.05). CSOP was significantly suppressed by human activities (p < 0.01, r = −0.102) but was consistent with the intensity of GTGP (43.80% positive). The power spectrum of CSOP was consistent with that of the gross domestic product. These results indicate that ecological services were improved by rocky desertification control in a typical karst region. The results may provide information to evaluate the efficiency of ecological reconstruction projects.

Graphical Abstract

1. Introduction

Carbon sequestration and oxygen production (CSOP), which is an ecosystem regulation system that regulates the interaction between the terrestrial biosphere and the atmosphere, refers to the sequestration of carbon and release of oxygen by plants through photosynthesis, and is used to indicate major ecological changes that involve complex processes of material circulation and energy flow [1]. The Kyoto Protocol and Copenhagen conferences have focused worldwide attention on the need to reduce carbon emissions [2,3]. Moderate-resolution imaging spectroradiometry (MODIS) is widely used to monitor the spatial and temporal variation of ecosystem conditions because of its frequent and global coverage [4,5]. The normalized difference vegetation index (NDVI) is calculated as the difference between the reflectance in the red band (610–680 nm) and near infrared band (780–890 nm). NDVI is sensitive to the presence, density, and dynamics of vegetation. Consequently, the MODIS NDVI product has been applied to quantify vegetation cover and green biomass. Numerous studies have noted the effects of vegetation dynamics and climatic factors on vegetation in different ecosystems [5,6], and these studies showed that vegetation conditions were positively correlated with precipitation in most relatively dry areas, but negatively correlated in relatively humid areas [7,8].
Karst terrain in carbonate-dominated areas accounts for about 15% of the world’s land area and is the underlying terrain for approximately 17% of the world’s population. Karst regions are characterized by thin soil depth (generally not more than 10 cm), and poor surface water retention (infiltration coefficient of 0.3–0.6 or even 0.8) [9,10,11]. A degraded karst ecosystem may recover far more slowly than other ecosystems. One of the most harmful consequences of ecosystem degradation is rocky desertification, characterized by the formation of a desert-like landscape with a high percentage of bedrock [12]. As the bedrock is exposed, land productivity is reduced, and the distribution of cropland becomes more scattered. Because of these consequences, the karst region in southwest China is associated with severe poverty and environmental degradation [13].
In order to alleviate poverty and control rocky desertification, countermeasures have been employed, including the Grain to Green Program (GTGP) and eco-environmental emigration [14]. The objective of the GTGP is to increase vegetation coverage by planting trees or sowing grass on former farmland [15]. The focus of eco-environmental migration is to help farmers in karst areas to move to non-karst areas where ecosystem conditions were deemed to be considerably better in the 1990s. During this campaign, 49,133 families (232,705 persons) were relocated in northwest Guangxi, China. The total area of the GTGP was up to 1278.67 km2 in Baise in 2001–2004. This included 605.33 km2 of farmland restored to woodland and 673.33 km2 of barren hills subjected to reforestation [16]. An increasing number of studies have focused on karst ecosystems [17,18], whereas only a few studies have investigated the efficiency of these projects. Most previous research regarding CSOP for the study area mainly focused on microanalysis through the in situ method at an ecosystem scale. The differences between anthropogenic impacts on CSOP and those of climatic variations at the landscape scale are uncertain. Residual analysis not only identifies human factors but also characterizes the separate influences of climate factors and human activities [19,20].
In this study, the ecological efficiency was evaluated with regard to rocky desertification since the implementation of GTGP and eco-environmental migration at a regional scale. Remote sensing images and climate data from 2000 to 2010 were used to extract distribution and dynamic information for CSOP in the typical karst area of northwest Guangxi, China, in which ecological projects have been implemented. The results from the present study may improve our understanding of the interactions among climate, human activities, and CSOP, and may provide auxiliary information to evaluate the efficiency of ecological reconstruction projects. Our results could also assist in ecosystem management to ensure sustainable development in fragile environments.

2. Materials and Methods
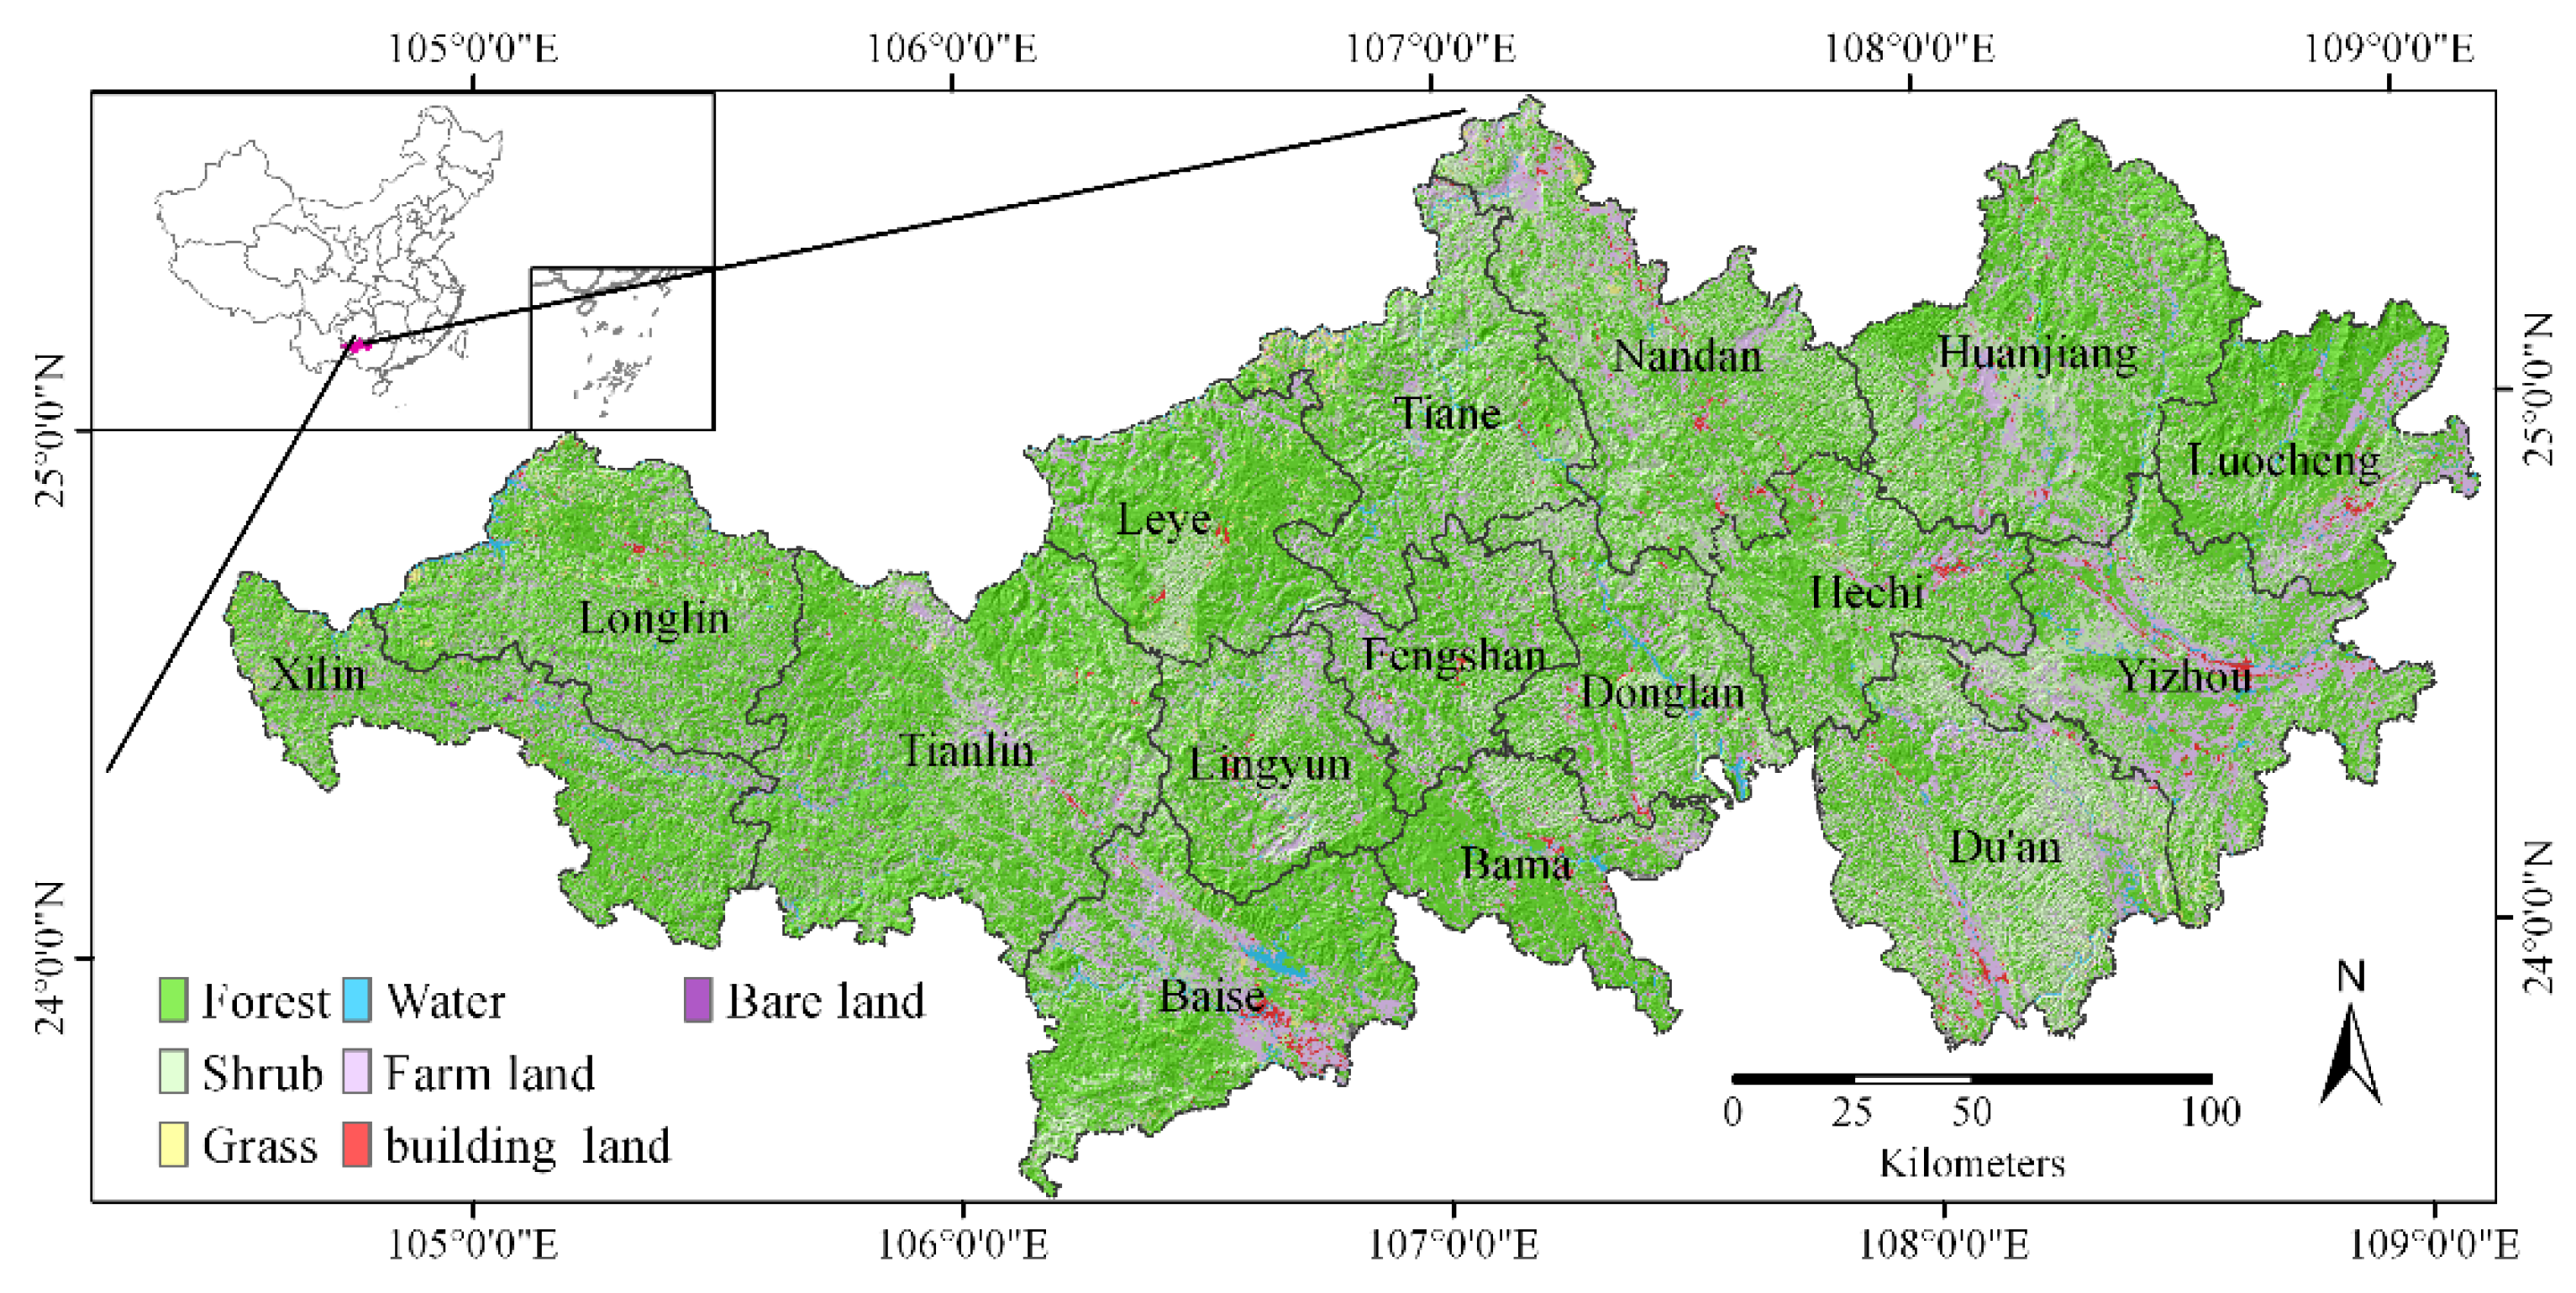
2.1. Study Area

The study region was located in northwest Guangxi, China (104°29′–109°09′E, 23°33′–25°37′N; Figure 1), including 16 counties covering an area of 50,818.20 km2, with a subtropical wet monsoon climate (annual temperature: 19.5 °C; annual precipitation: 1000 mm). The elevation of this region ranged from 100 to 2000 m, with a decrease in elevation from the northwest to the southeast. The main land use types in the region in 2010 included forest (28,058.83 km2, 55.12% of the total area), shrub land (12,349.16 km2, 24.29% of the total area), farm land (8919.58 km2, 17.54% of the total area), and other types of land use (including building land, grass, wetland, and bare land 1513.96 km2, 2.98% of the total area) (Figure 1). The farmland is mainly located in the industrial and economic development zones of the central region. Karst landforms are typical, and croplands are generally not fertile because of the geological conditions in this mountainous area. Most of the farmland is found in the flat areas in karst valleys or closed depressions, where major human settlements are also situated. Therefore, the demands for agricultural development and ecosystem conservation often conflict.
Figure 1. The location of the study region and main land uses in 2010.
Remotesensing 08 00102 g001

2.2. Data Acquisition and Preprocessing

MODIS NDVI data (with a spatial resolution of 0.0089285714) from 2000 to 2010 were downloaded from NASA’s Land Processes Distributed Active Archive Center (http://ladsweb.nascom.nasa.gov/). A digital elevation model (DEM, with a spatial resolution of 100 m × 100 m) was downloaded from the Data-sharing Network of Earth System Science in China (www.geodata.cn). Weather and radiation datasets from 97 stations within and near the study area including annual rainfall, average temperature, extreme temperature, and total and net radiation were collected for 2000–2010 from the China Meteorological Data-sharing Service System (http://cdc.nmic.cn/). Land cover in 2000 and 2010 was created by visual interpretation from Landsat-5 Thematic Mapper (TM) images with a resolution of 30 m × 30 m.
ArcGIS 10.0 (Environment Systems Research Institute, Redlands, CA, USA), ERDAS IMAGINE 9.1 (Leica, Stockholm, Sweden), and MATLAB (the MathWorks, Natick, Ma, USA) were used to compile data and perform spatial analysis. All data were projected or re-projected to the same projection (Albers Conical Equal Area projection, Krasovsky Spheroid) and re-sampled to 100 m × 100 m pixel spacing.

2.3. Measurements of CSOP

To quantitatively measure the CSOP, the terrestrial Carnegie-Ames-Stanford Approach (CASA) ecosystem model was used to estimate net primary productivity (NPP) from satellite data [21,22]. Models of the NPP calculation are as follows:
N P P ( x , t ) = A P A R ( x , t ) × ε ( x , t )
A P A R ( x , t ) = S O L ( x , t ) × F P A R ( x , t ) × 0.5
ε ( x , t ) = T ε 1 ( x , t ) × W ε ( x , t ) × ε max
F P A R ( x , t ) = ( N D V I ( x , t ) N D V I i min ) × ( F P A R max F P A R min ) ( N D V I i max N D V I i min ) + F P A R min
T ε 1 = 0.8 + 0.02 × T o p t ( x , t ) 0.0005 × [ T o p t ( x , t ) ] 2
W ε ( x , t ) = 0.5 + 0.5 × E ( x , t ) E p ( x , t )
E ( x , t ) = P ( x , t ) × R n ( x , t ) × [ ( P ( x , t ) ) 2 + ( R n ( x , t ) ) 2 + P ( x , t ) × R n ( x , t ) ] [ P ( x , t ) + R n ( x , t ) ] × [ ( P ( x , t ) ) 2 + ( R n ( x , t ) ) 2 ]
E ρ ( x , t ) = ( E ( x , t ) + E ρ 0 ( x , t ) ) / 2
where APAR(x,t) is the radiation available after absorption by photosynthesis; ε(x,t) is light energy utilization; FPAR(x,t) is the fraction of photosynthesis active radiation, with FPARmax = 0.950, FPARmin = 0.001 [23]; SOL(x,t) is solar radiation; Tε1(x,t) and Wε(x,t) are the effects of temperature and water on light energy utilization, respectively; εmax is the maximum light energy utilization, which has a different value for different vegetation types and is determined through the ecophysiological process model (BIOME-BGC) [24]; Topt(x,t), p(x,t), and Rn(x,t) are the annual average temperature, rainfall, and radiation; E(x,t) and Eρ(x,t) are the actual and potential evapotranspiration; and Eρ0(x,t) is the local available evapotranspiration, calculated using the vegetation-climate model of Thornthwaite [25].
According to the photosynthesis equation: 6CO2 + 6H2O → 6O2 + C6H12O6 (CH2O), the ratio of organic matter produced by photosynthesis, carbon sequestered by photosynthesis, and oxygen released by photosynthesis is 1:1.47:1.07. The CSOP is calculated from NPP using this ratio [26].

2.4. Method of Residual Analysis

Residual analysis was used to separate the impacts of human activities from those of climatic factors. This method includes a regression analysis and is based on general observation values that are closely correlated with climate variations (mainly precipitation and temperature). This model was used to predict the value for each pixel. If the inter-annual residual change was approximately zero, human activity had no significant impacts on CSOP. Otherwise, positive residual values suggest that CSOP values had increased, which may be attributed to conservation and restoration efforts. Negative values indicate a decreasing trend that shows human-induced reduction [20].
We adopted a fitting method within the n-times power terms of precipitation, temperature, and CSOP based on R2 set to determine the impacts of both temperature and precipitation on CSOP. Relationships between the NDVI and climatic factors for each pixel were examined using a regression analysis. Using the goodness-of-fit test (R2 = 0.675), the best relationship was obtained with a quadratic fit of precipitation and temperature to CSOP. The formula was applied on each grid pixel:
CSOP = a × P2 + b × P + c × T + d
where P is precipitation (mm); T is temperature (°C); and a, b, c, and d are the multiple regression coefficients, adjusted for each variable and for each pixel.

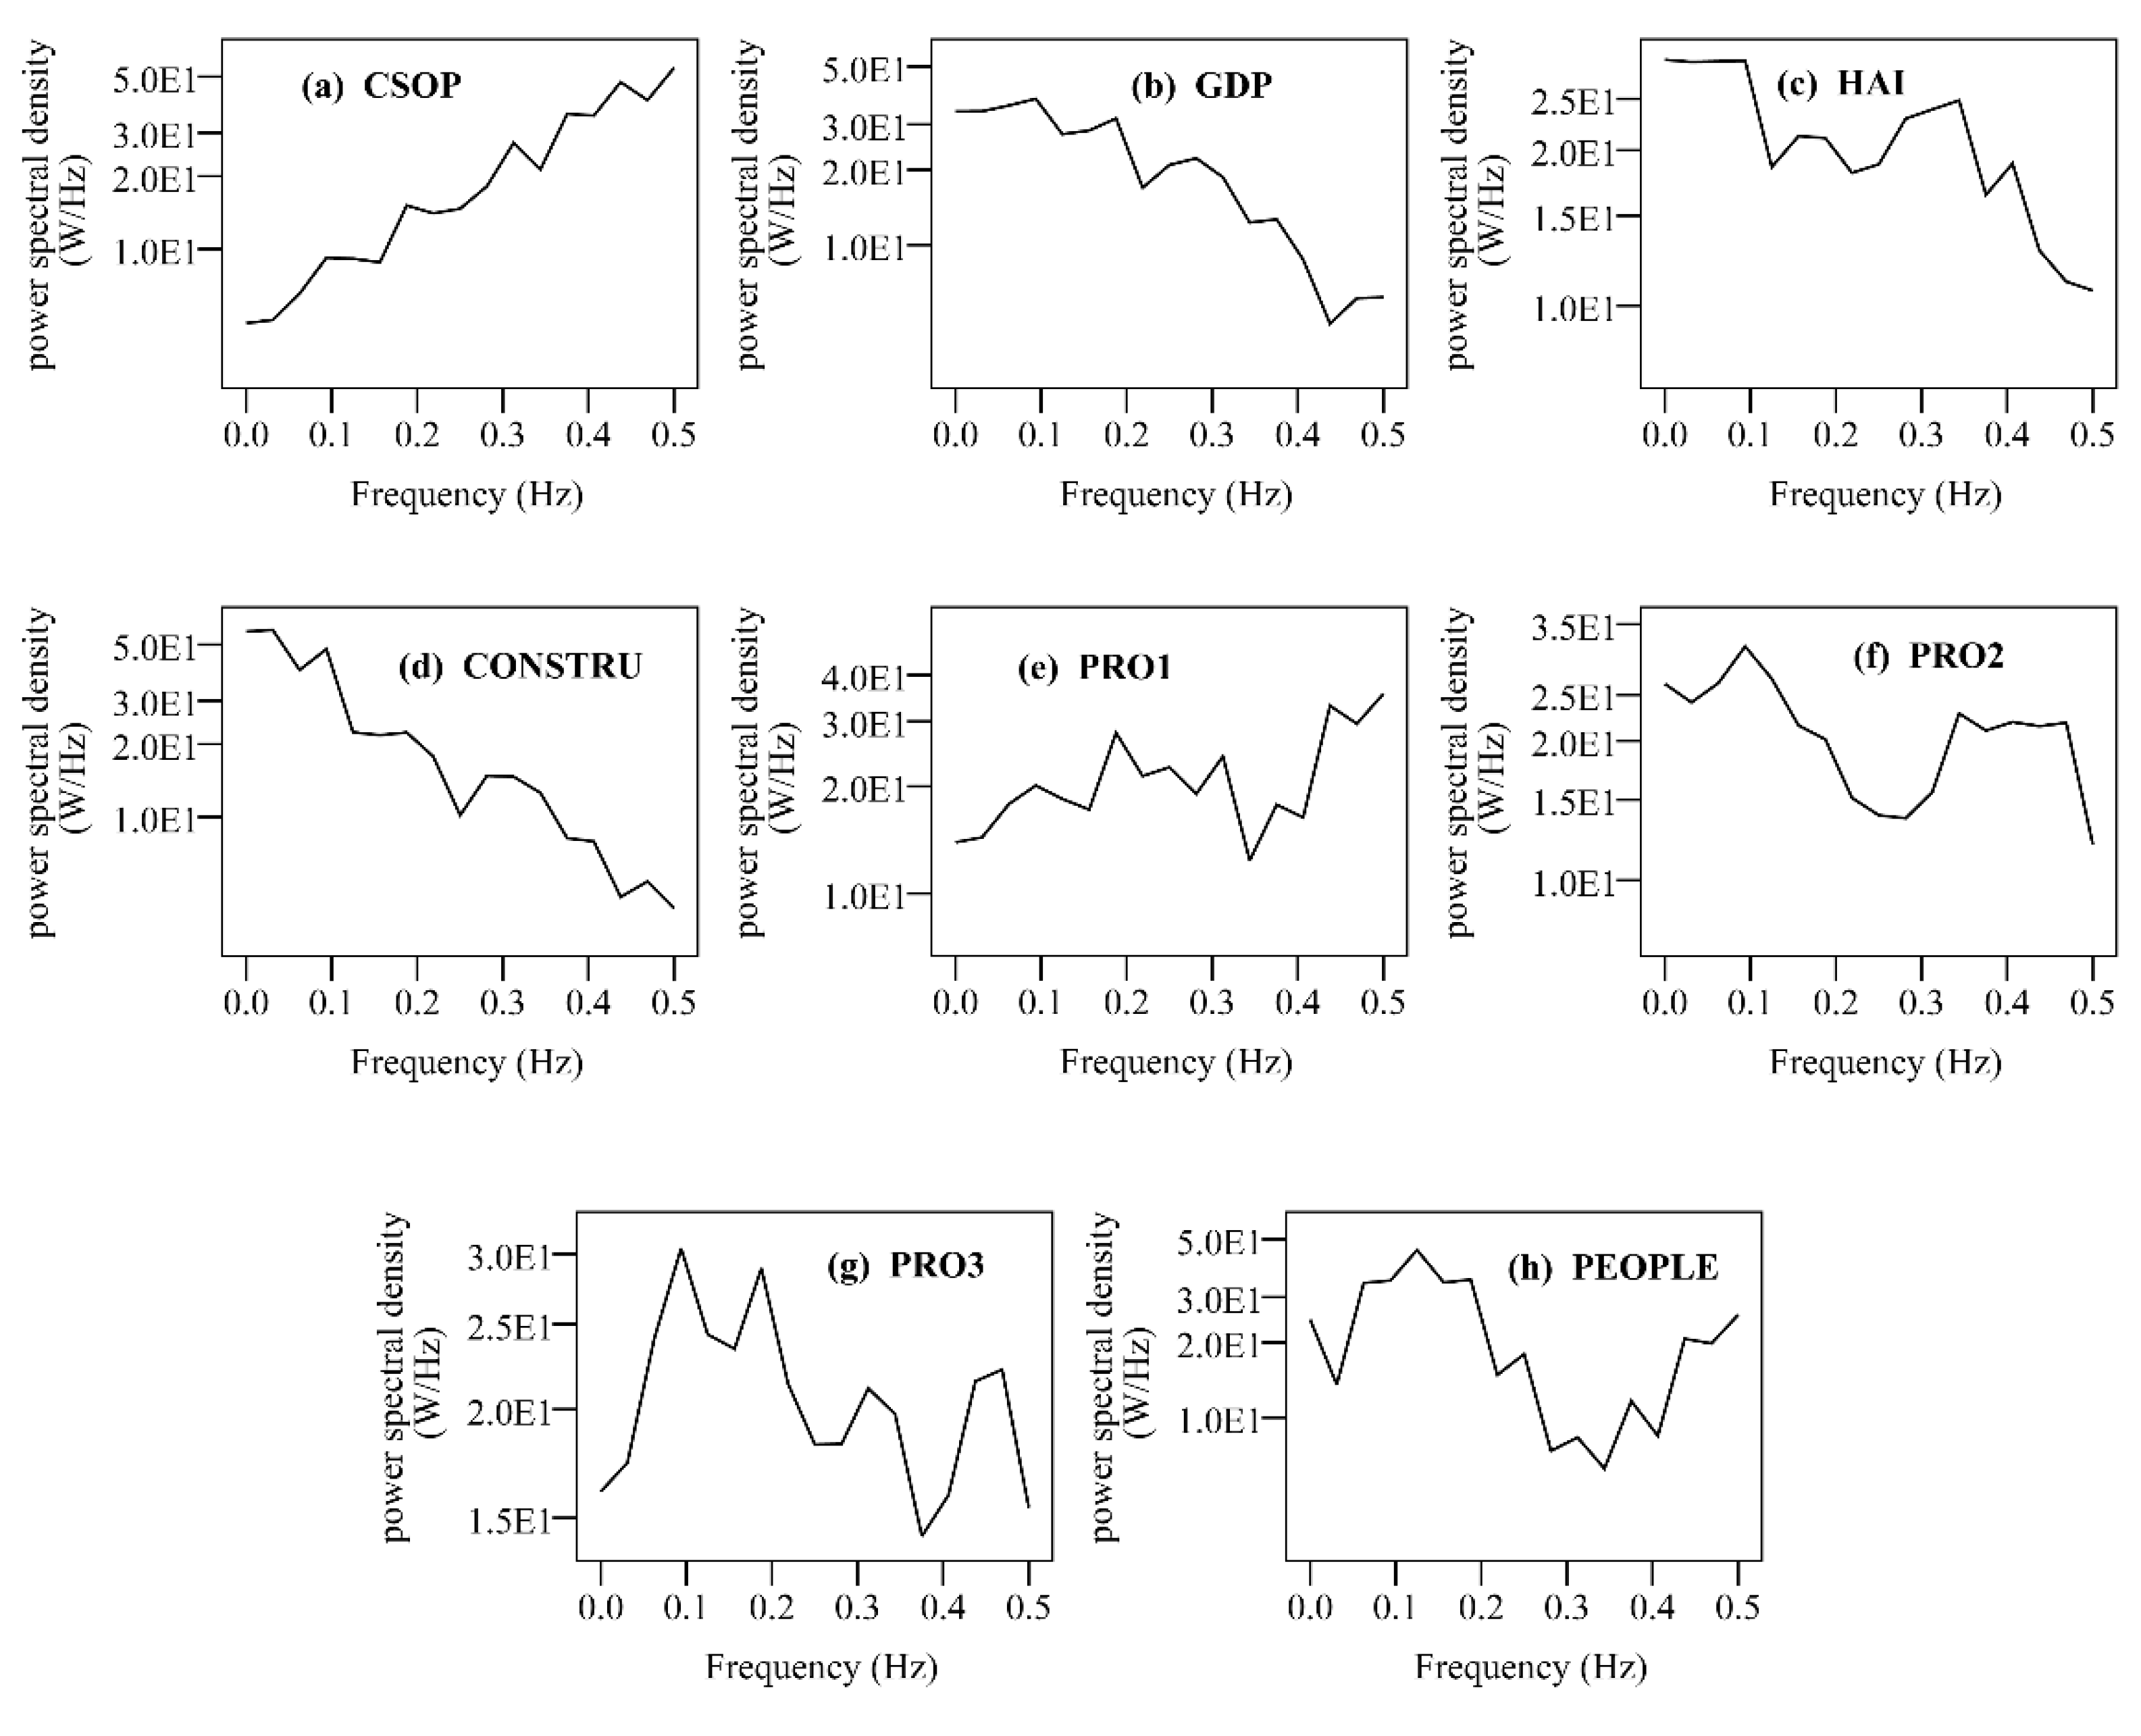
2.5. Methods for the Human Activity Index (HAI), Intensity of the GTGP (IGTGP), and Spectrum Analysis

The HAI was calculated by integrating the gross domestic product (GDP), production of the primary industry (PRO1), production of a secondary industry (PRO2), production of a third industry (PRO3), human population (PEOPLE), and construction area (CONSTRU). The intensity of GTGP (IGTGP) index was composed of the implementation time and area for the counties in the study area. The equation for IGTGP was as follows:
H A I = g = 1 k ( λ g / g = 1 m λ g ) F g
I G T G P = A S
where λ is the characteristic root and F is the main component, A is the implementation time of the GTGP (year), and S is the area of GTGP (ha).
Spectrum analysis is the technical process of decomposing a complex signal into simpler parts [27]. The resulting plot is referred to as a power spectrum, and frequency spectra are generated by applying a fast Fourier transform. In this analysis, CSOP and the other factors (i.e., GDP, PRO1, PRO2, PRO3, PEOPLE, and CONSTRU) for every county were treated as variables.

3. Results

3.1. Spatiotemporal Variations of CSOP

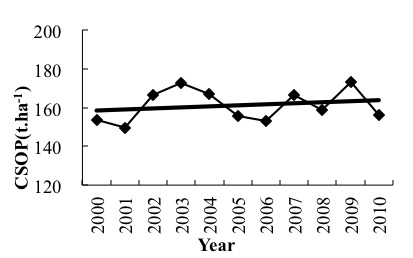
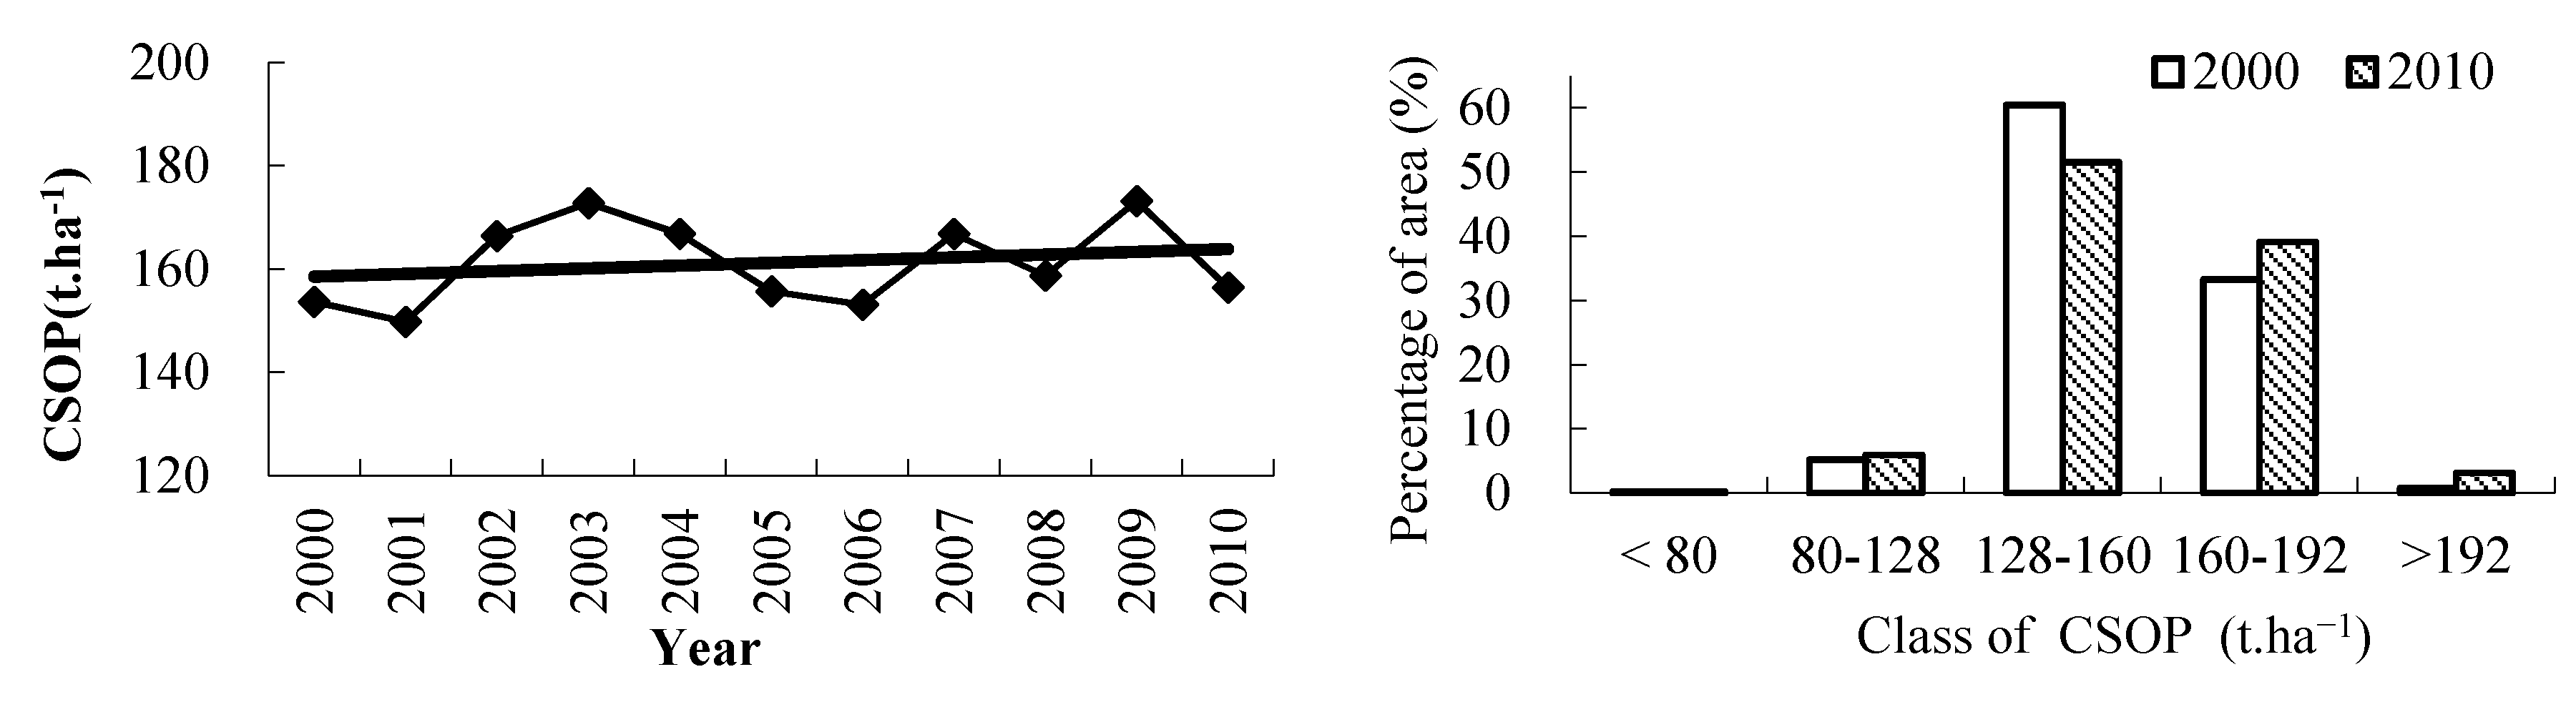
3.1.1. Inter-Annual Changes of CSOP

CSOP tended to increase in the study area, with substantial fluctuations and values increasing from 153.63 in 2000 to 156.41 t·ha−1 in 2010 (Figure 2). The total CSOP in the study area increased from 780.73 × 10⁶ t to 794.84 × 10⁶ t during the study period (Table 1). From an administrative point of view, the most rapid growth was observed in Baise county (CSOP growth density and total CSOP: 20.80 t·ha−1 and 7.66 × 10⁶ t, respectively), followed by Huanjiang county (CSOP growth density and total CSOP: 7.78 t·ha−1 and 3.51 × 10⁶ t, respectively). Obvious decreases were observed for CSOP in non-karst regions, such as Xilin and Du’an counties (decreases of 5.4 × 10⁶ t and 7.86 × 10⁶ t, respectively; Table 1, Figure 3). Results for the frequencies of CSOP values of the study area indicate that there were no significant annual vegetation changes. There was only a slight increase of 0.25 t·ha−1·yr−1 for the annual CSOP. The CSOP had one very high peak around 160 t·ha−1 every year, and over 50% of the study area had CSOP values of approximately 150 t·ha−1 because of the widespread forest cover (79.41% of the total area) in the study area. The location of the CSOP peak ranged from 149.71 t·ha−1 to 173.13 t·ha−1. The highest CSOP value for the study area appeared in 2003 and the lowest was in 2000. A detailed explanation for the fluctuations will be given in the following sections in terms of climate fluctuations and human activities.
Figure 2. The annual variation of CSOP and percentage of different classes of CSOP.
Remotesensing 08 00102 g002
Table 1. Variation of CSOP in different counties from 2000 to 2010.
County NameAreaMean (t.ha−1)Sum (106 t)
km−2%2000201000–102000201000–10
Nandan3920.817.72142.49142.31−0.1855.8755.80−0.07
Huanjiang4506.198.87147.55155.337.7866.4970.003.51
Tiane3188.386.27148.03149.851.8247.2047.780.58
Luocheng2633.815.18158.72160.882.1641.8042.370.57
Leye2614.005.14152.46157.244.7939.8541.101.25
Longlin3541.946.97148.22148.240.0252.5052.510.01
Hechi2338.004.60148.61158.589.9734.7437.082.33
Yizhou3815.197.51155.35159.884.5259.2761.001.72
Donglan2398.944.72143.32150.997.6734.3836.221.84
Fengshan1740.753.43140.67151.7011.0324.4926.411.92
Tianlin5532.3110.89162.46164.852.3989.8891.201.32
Xilin2969.565.84169.11152.14−16.9750.2245.18−5.04
Lingyun2041.064.02149.10161.4412.3330.4332.952.52
Du‘an3989.697.85173.43153.72−19.7169.1961.33−7.86
Bama1906.133.75127.86137.589.7224.3726.221.85
Baise3681.447.24163.11183.9120.8060.0567.707.66
Total50818.20100.00153.63156.412.78780.73794.8414.11
Figure 3. The distribution of (a) in 2000 and (b) in 2010; (c) variation; and (d) significant change in CSOP from 2000 to 2010 in the study area. The figure was generated using ARCGIS 10.0.
Remotesensing 08 00102 g003aRemotesensing 08 00102 g003b

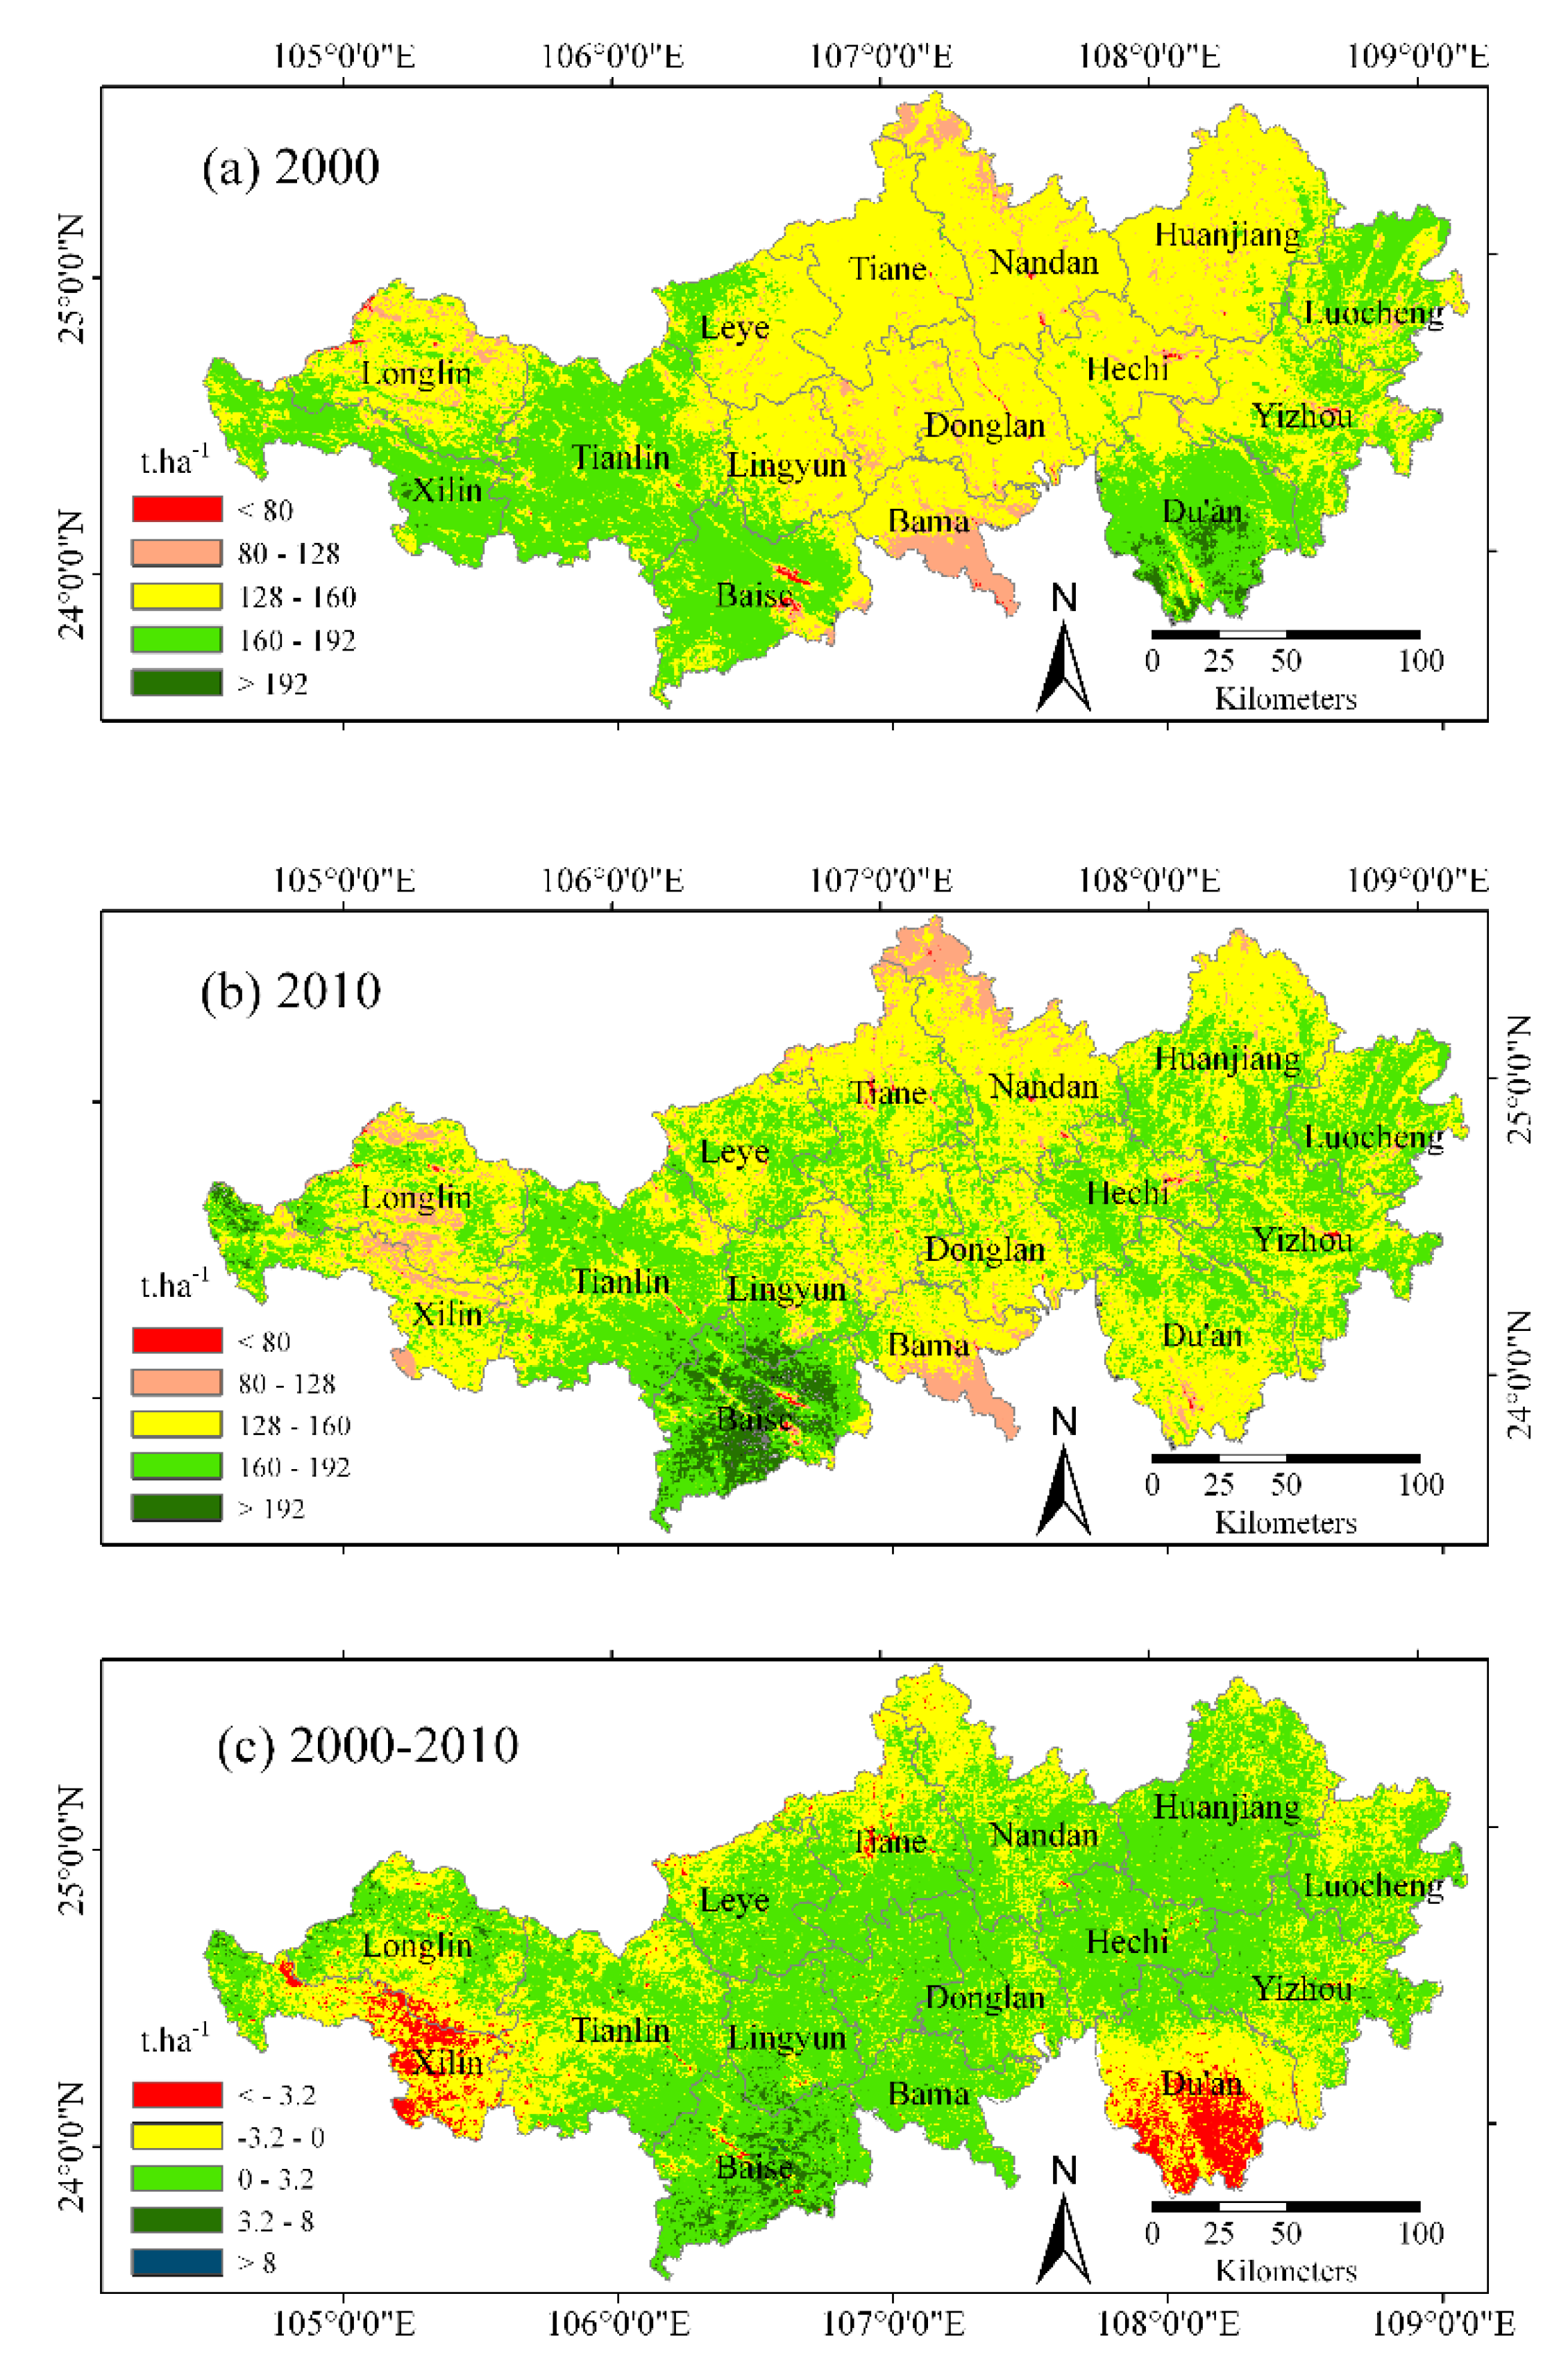
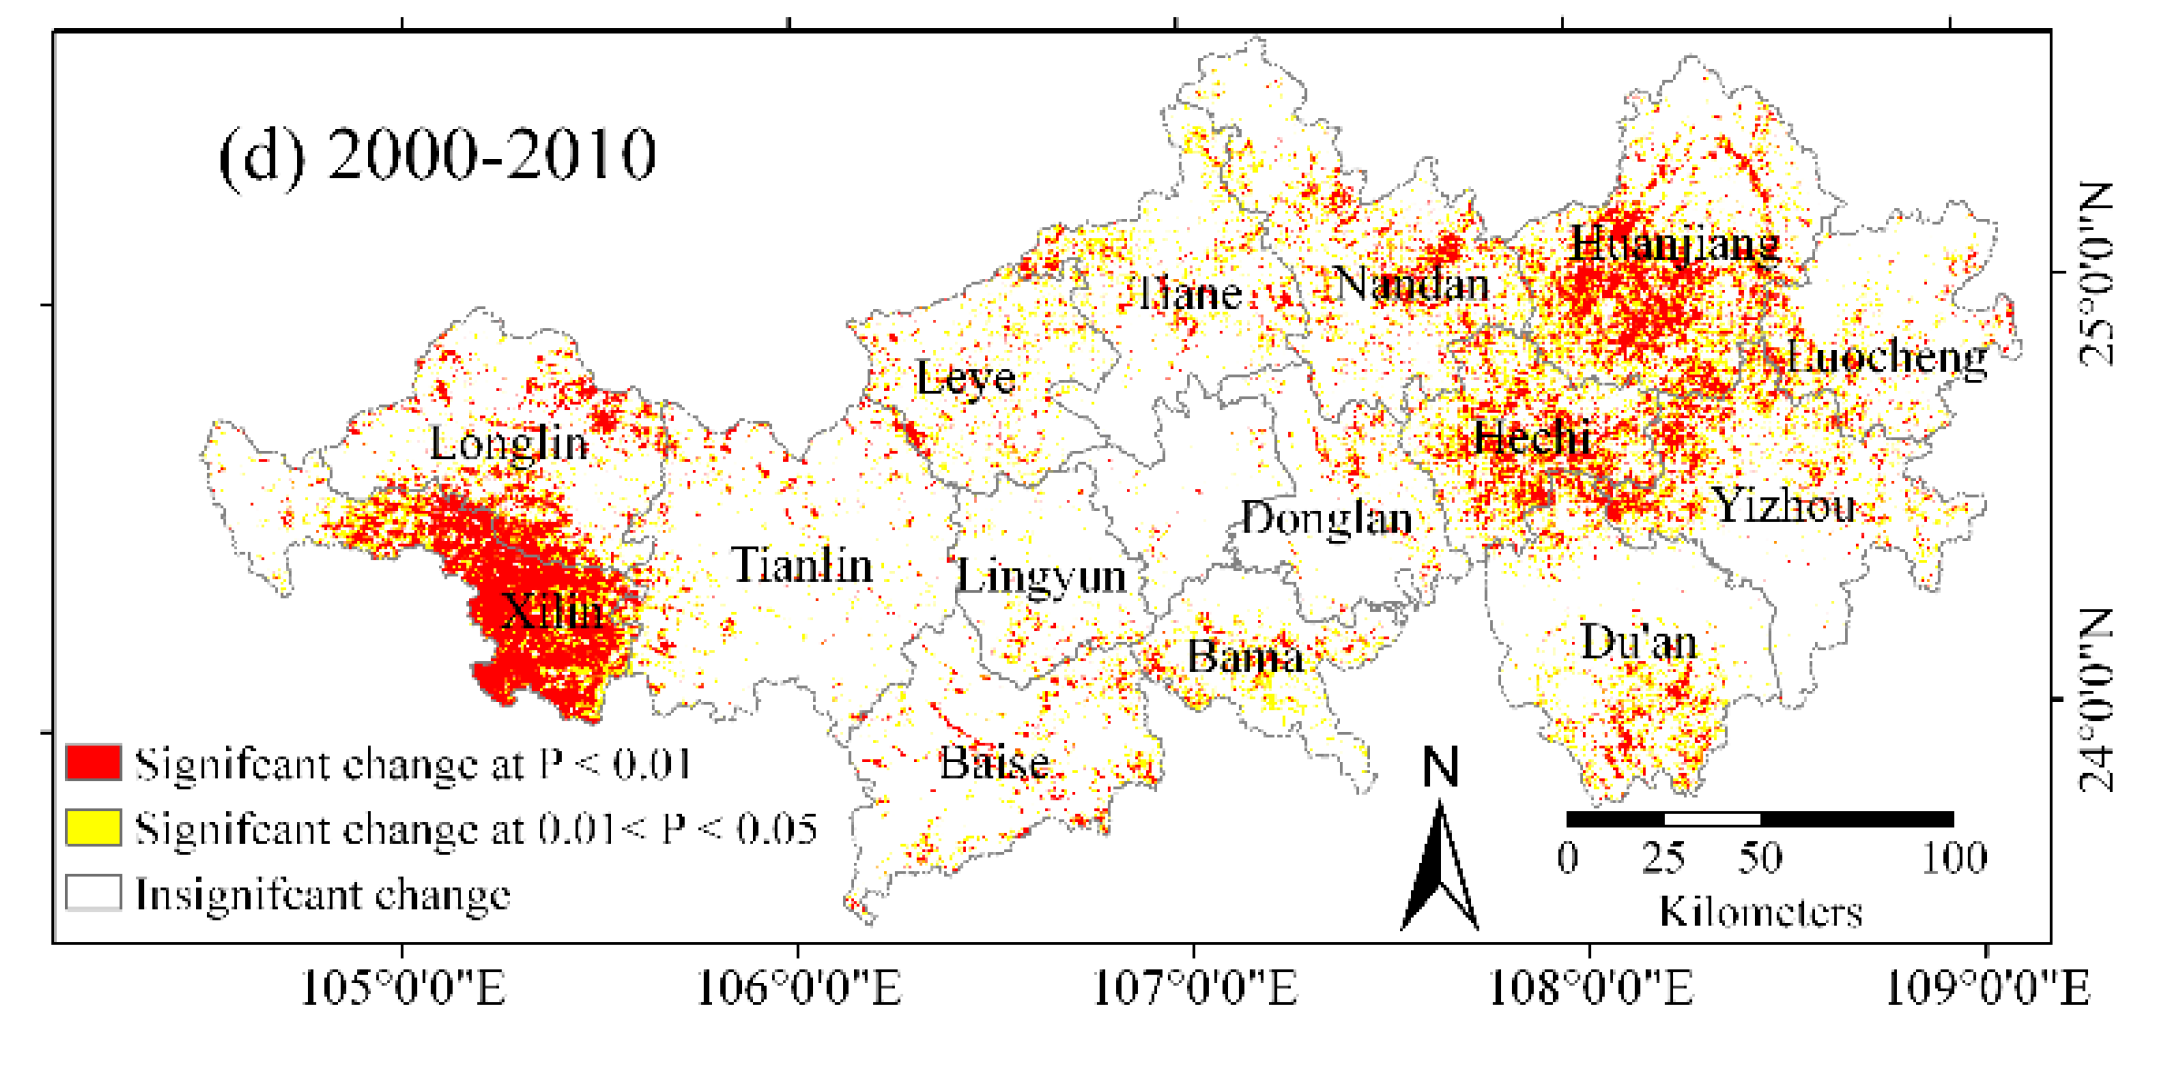
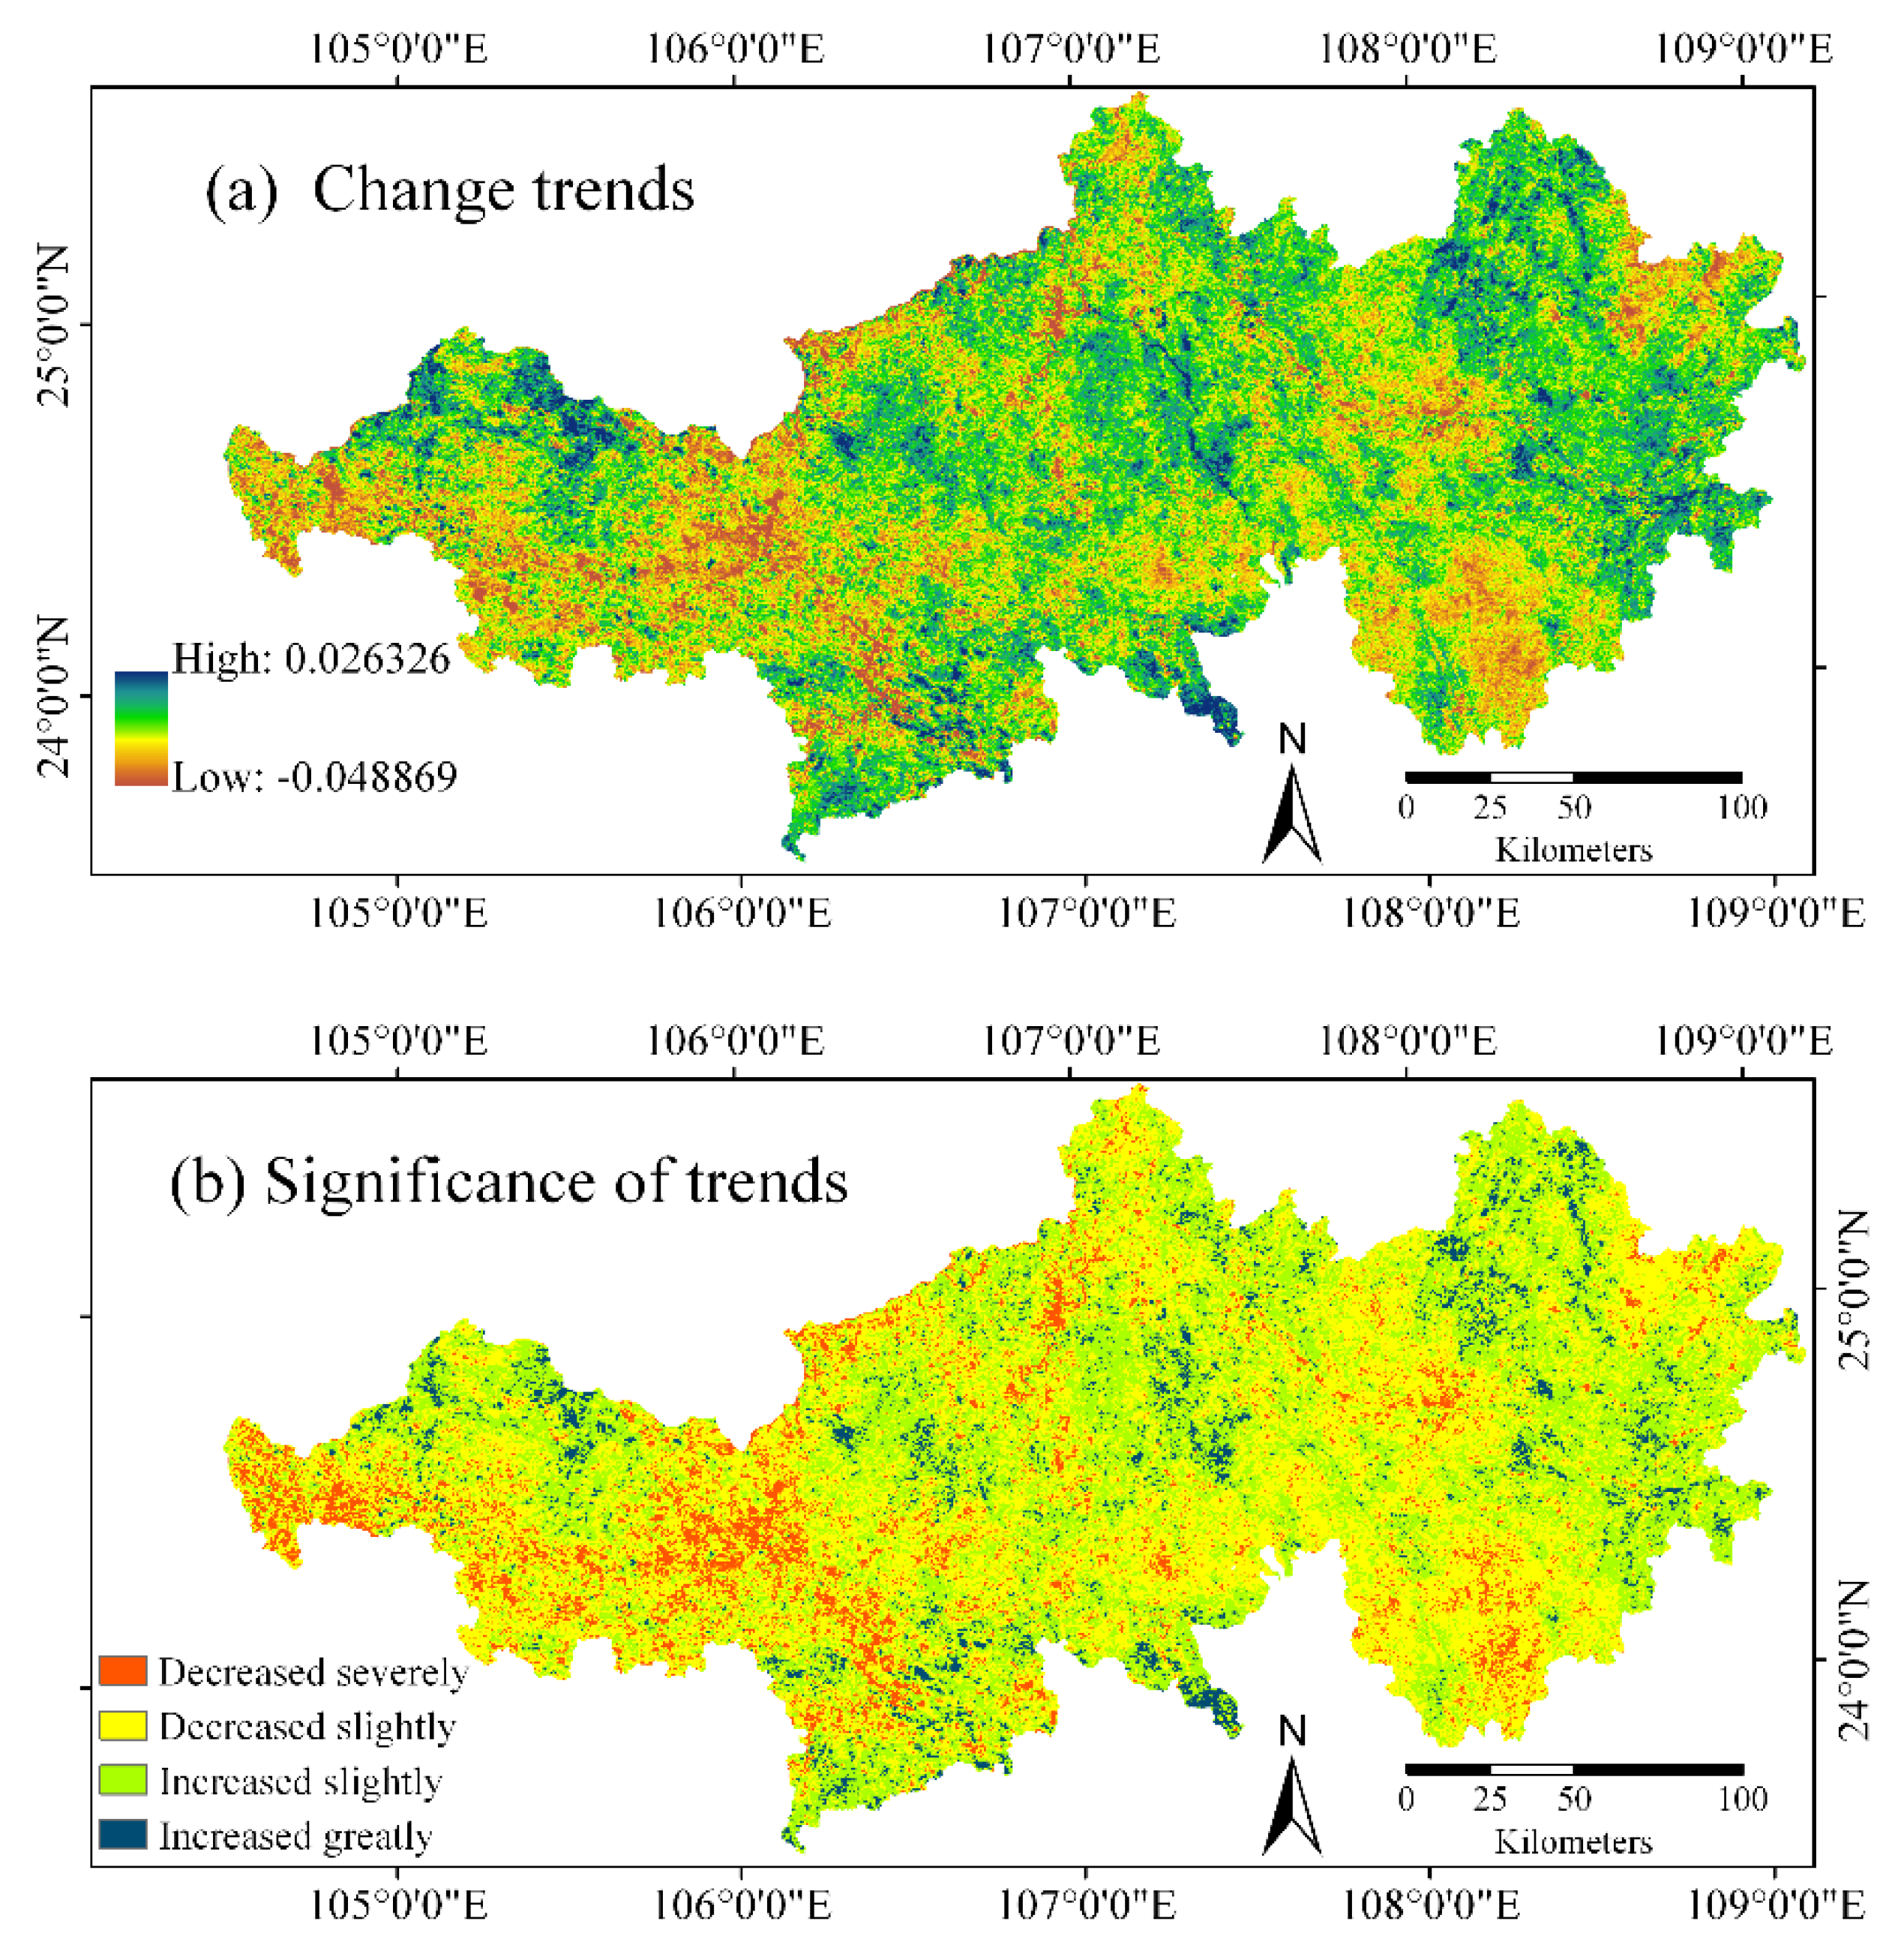
3.1.2. Spatial Variation of CSOP

The mid-west and southern regions exhibited high CSOP, while the central and northern regions exhibited low CSOP (Figure 3). The value of CSOP in most of the study regions in 2000 was 128–160 t·ha−1 and the proportion of land was 60.42%. A total of 90.67% of all CSOP in 2010 was concentrated into the two grades of 128–160 and 160–192 t·ha−1. CSOP increased in about 64% of the study area and decreased in only 36% of the area. Such dramatic variation was mainly accounted for by slight increases (0–3.2 t·ha−1), and the variation ratio was 62.11%. In contrast, the variation ratio of severe decreases (i.e., >−3.2 t·ha−1) was only 4.10% (Figure 3). Significant changes were observed in 21.14% of the study area (11.23%, p < 0.01; 9.91%, p < 0.05).
CSOP increased significantly in the central part of the study region, including Huanjiang, Baise, Hechi, Donglan, Bama, and Yizhou Counties. For example, the densities of CSOP in Baise and Huanjiang counties increased 20.80 and 7.78 t·ha−1, respectively, and the total CSOP increased 7.66 × 10⁶ t and 3.51 × 10⁶ t, respectively. Changes were significantly concentrated in the central and west regions of the study area, including Huanjiang, Hechi, Nandan, Xilin, and Du’an counties.

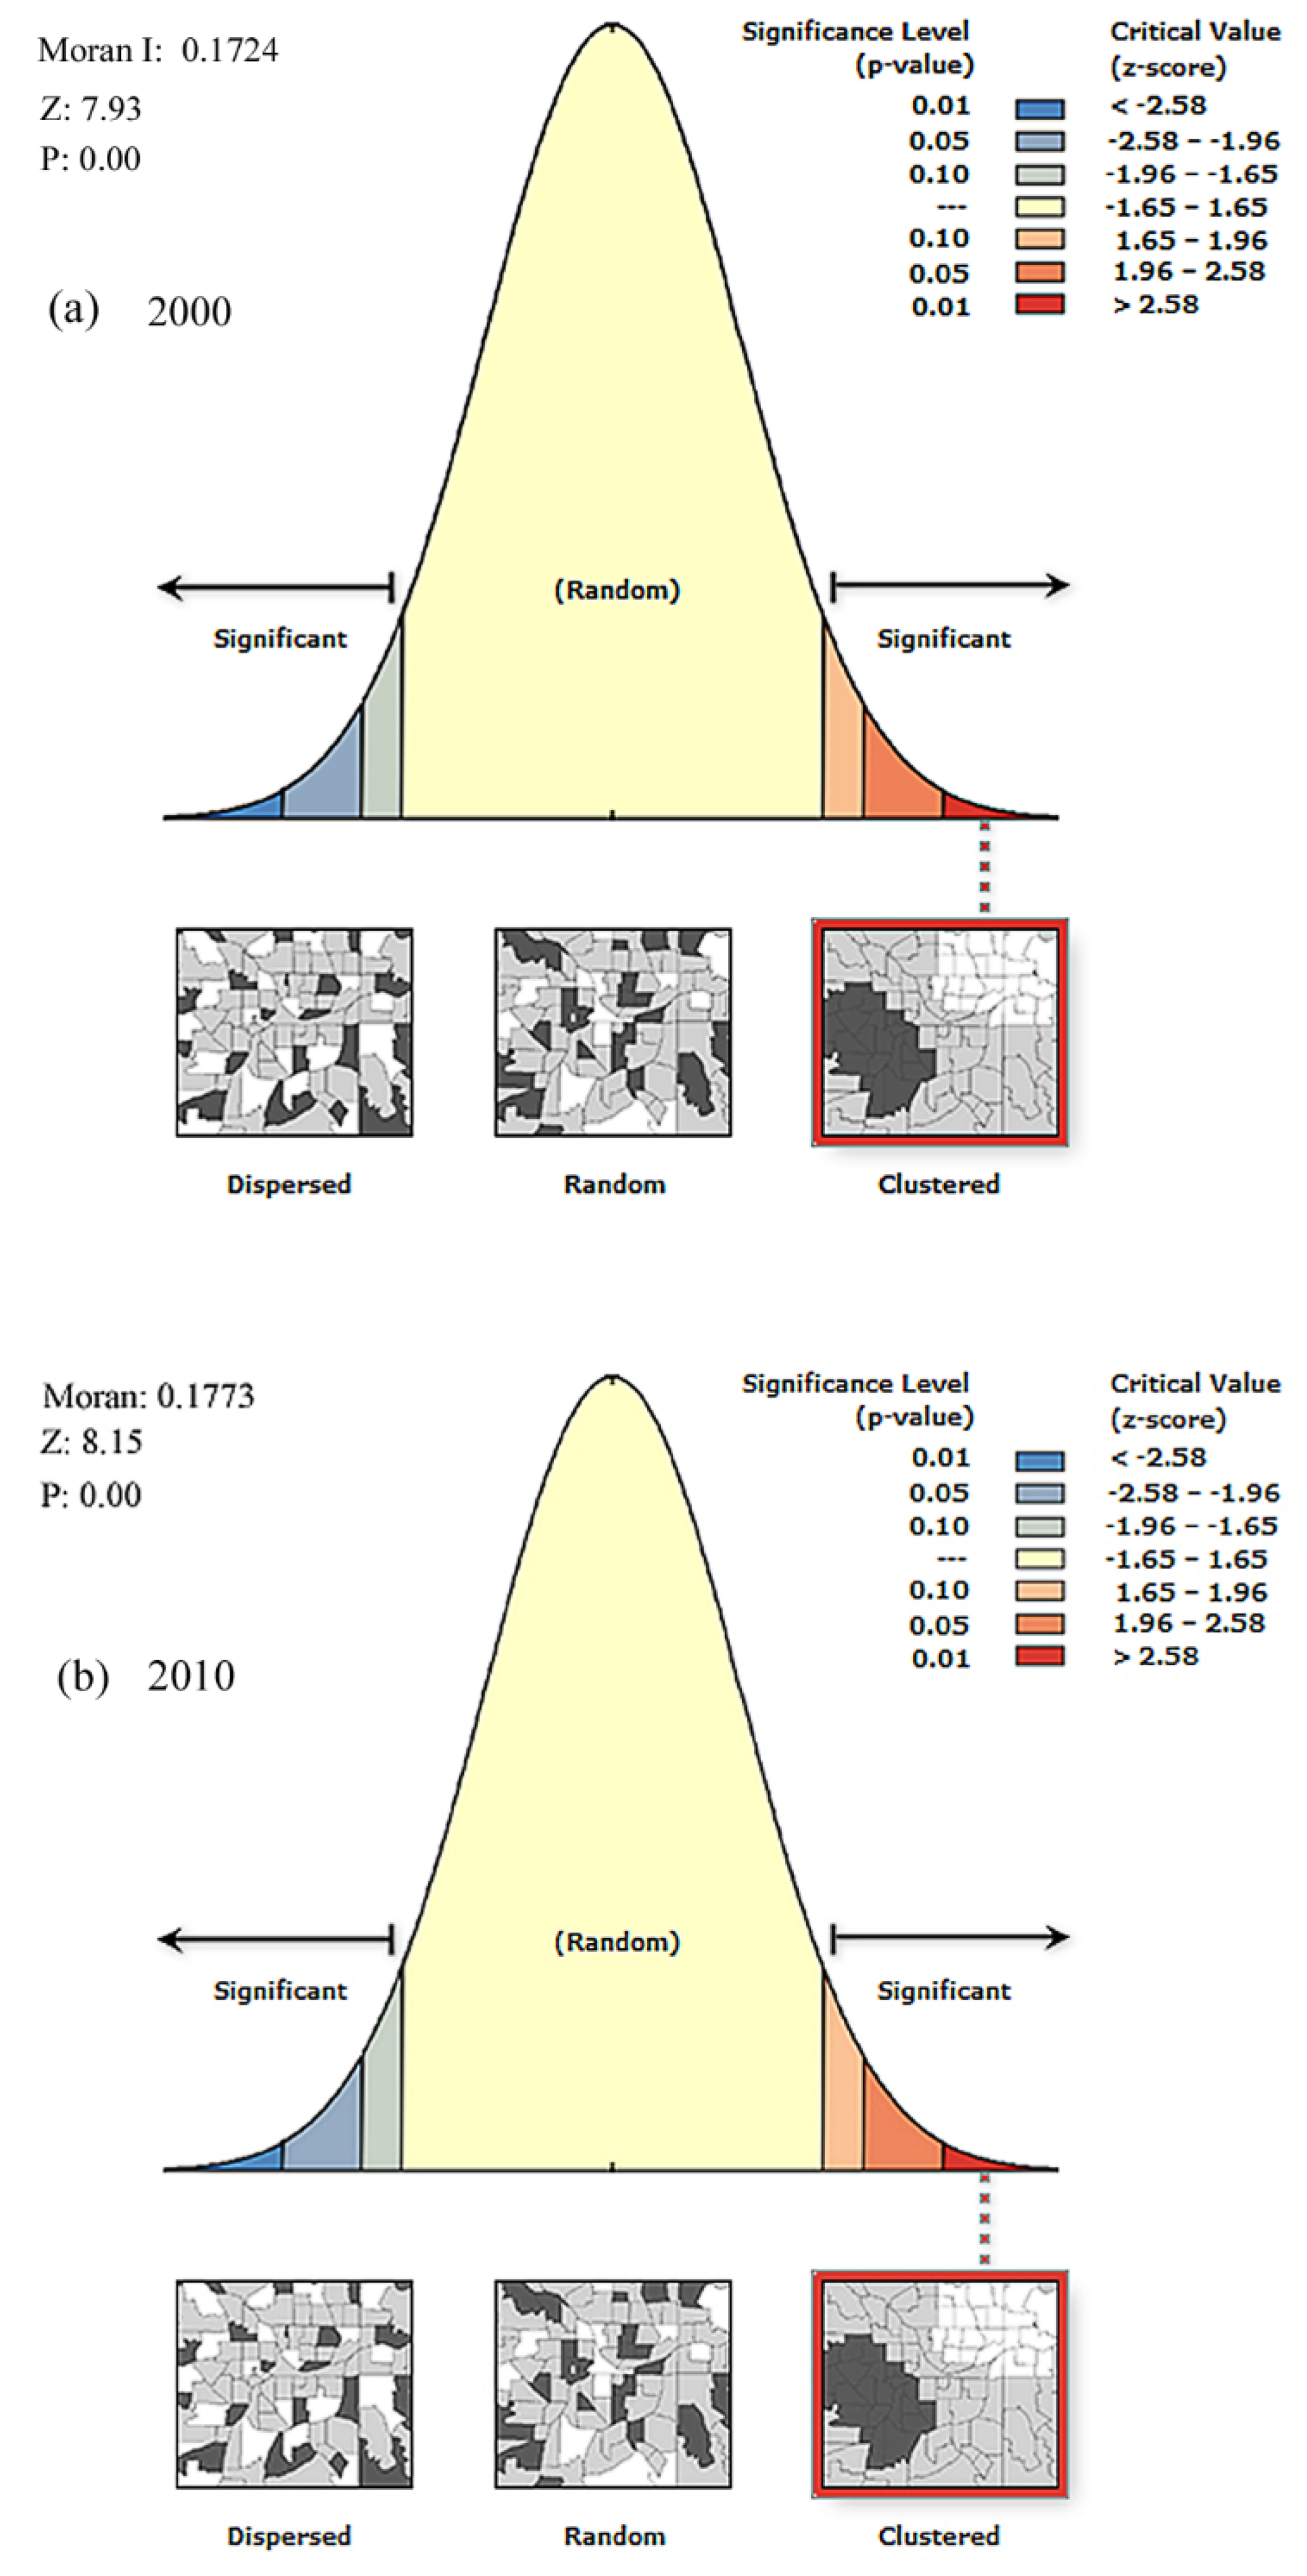
3.1.3. Self-Spatial Correlation Pattern of CSOP

The resultant Z scores indicated whether features were tightly clustered or widely scattered in the self-spatial correlation index of Moran I. Features with high values that were surrounded by other features with high values were considered to have a statistically significant self-spatial correlation. Large Z scores indicated intense clustering of high self-spatial correlations. Small Z scores indicated intense clustering of low self-spatial correlations. When the difference was too large to be the result of random chance, a statistically significant Z score was generated.
Moran I of CSOP indicated a random pattern of distribution in 2000 and 2010 and a highly clustered pattern in 2010 (Figure 4). The Z score was 7.93 in 2000 and 8.15 in 2010, which indicates that the intense clustering had a higher self-spatial correlation in 2010; therefore, the distribution pattern of CSOP could have been affected by measures to control rocky desertification.
Figure 4. The self-spatial correlation index of Moran I for CSOP in 2000 and 2010. The figure was generated using ARCGIS 10.0. (a) a random pattern of distribution in 2000; (b) a higher self-spatial correlation in 2010.
Remotesensing 08 00102 g004

3.2. Main Factors of Influencing CSOP

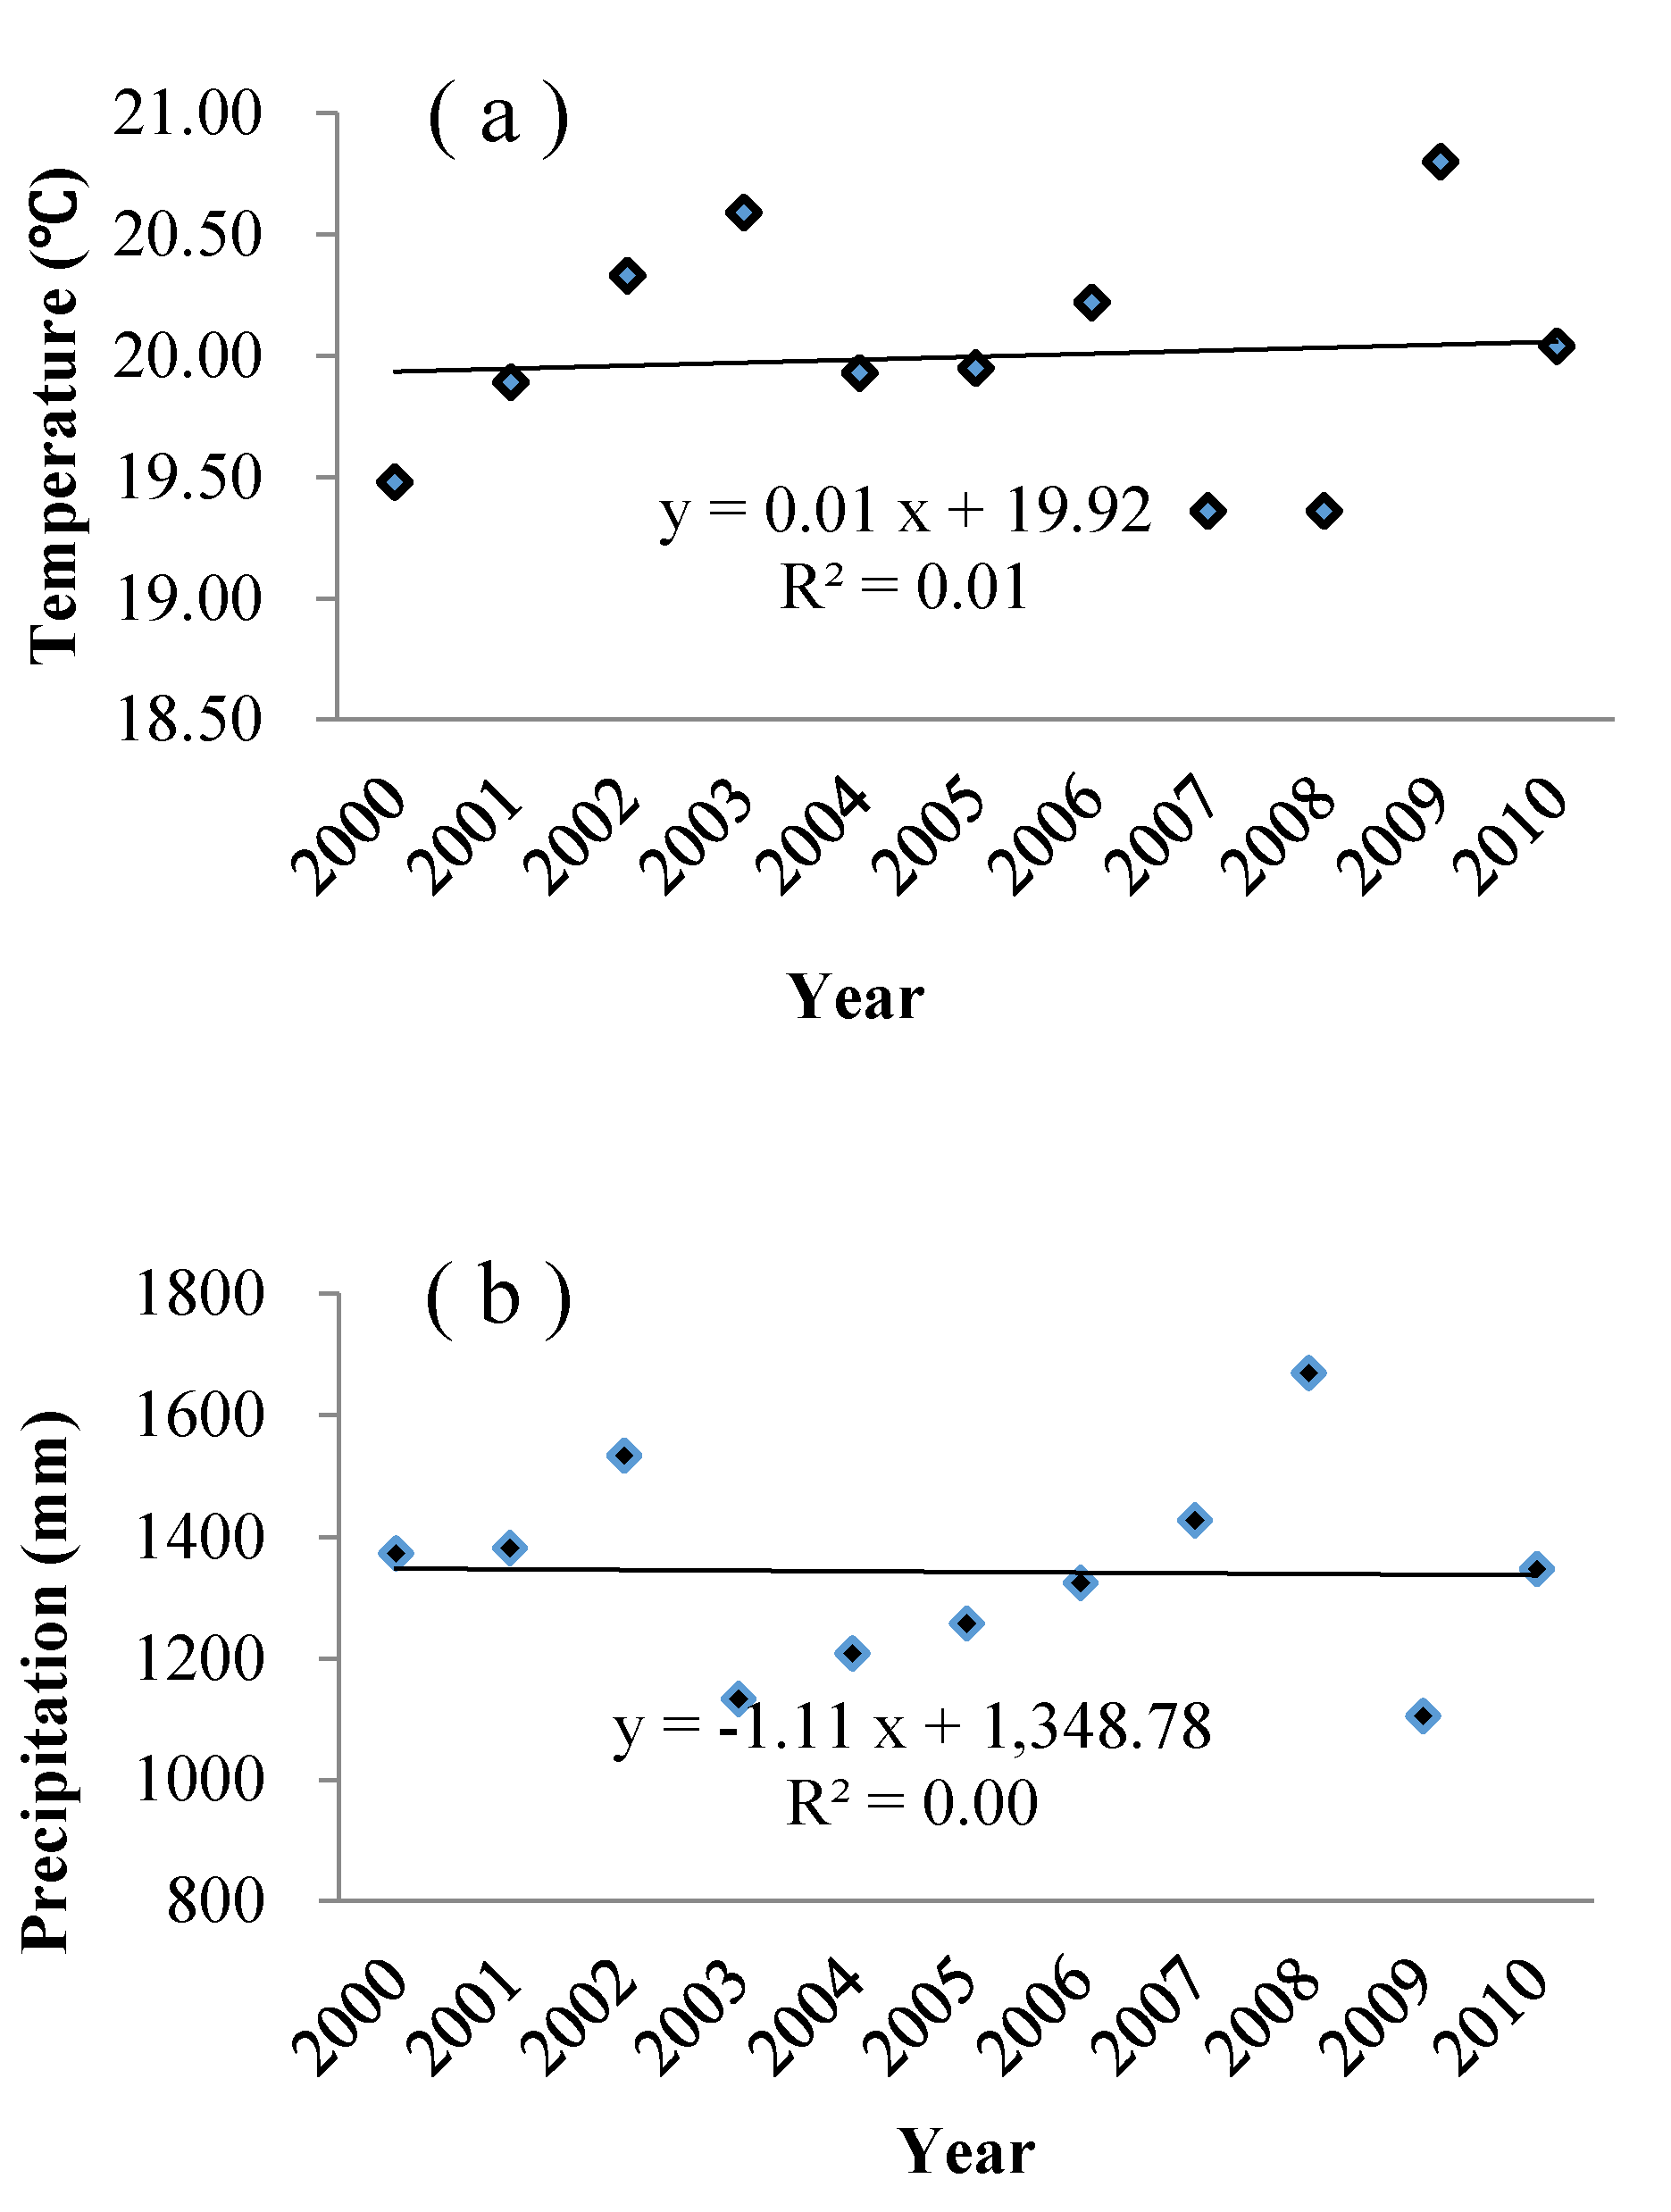
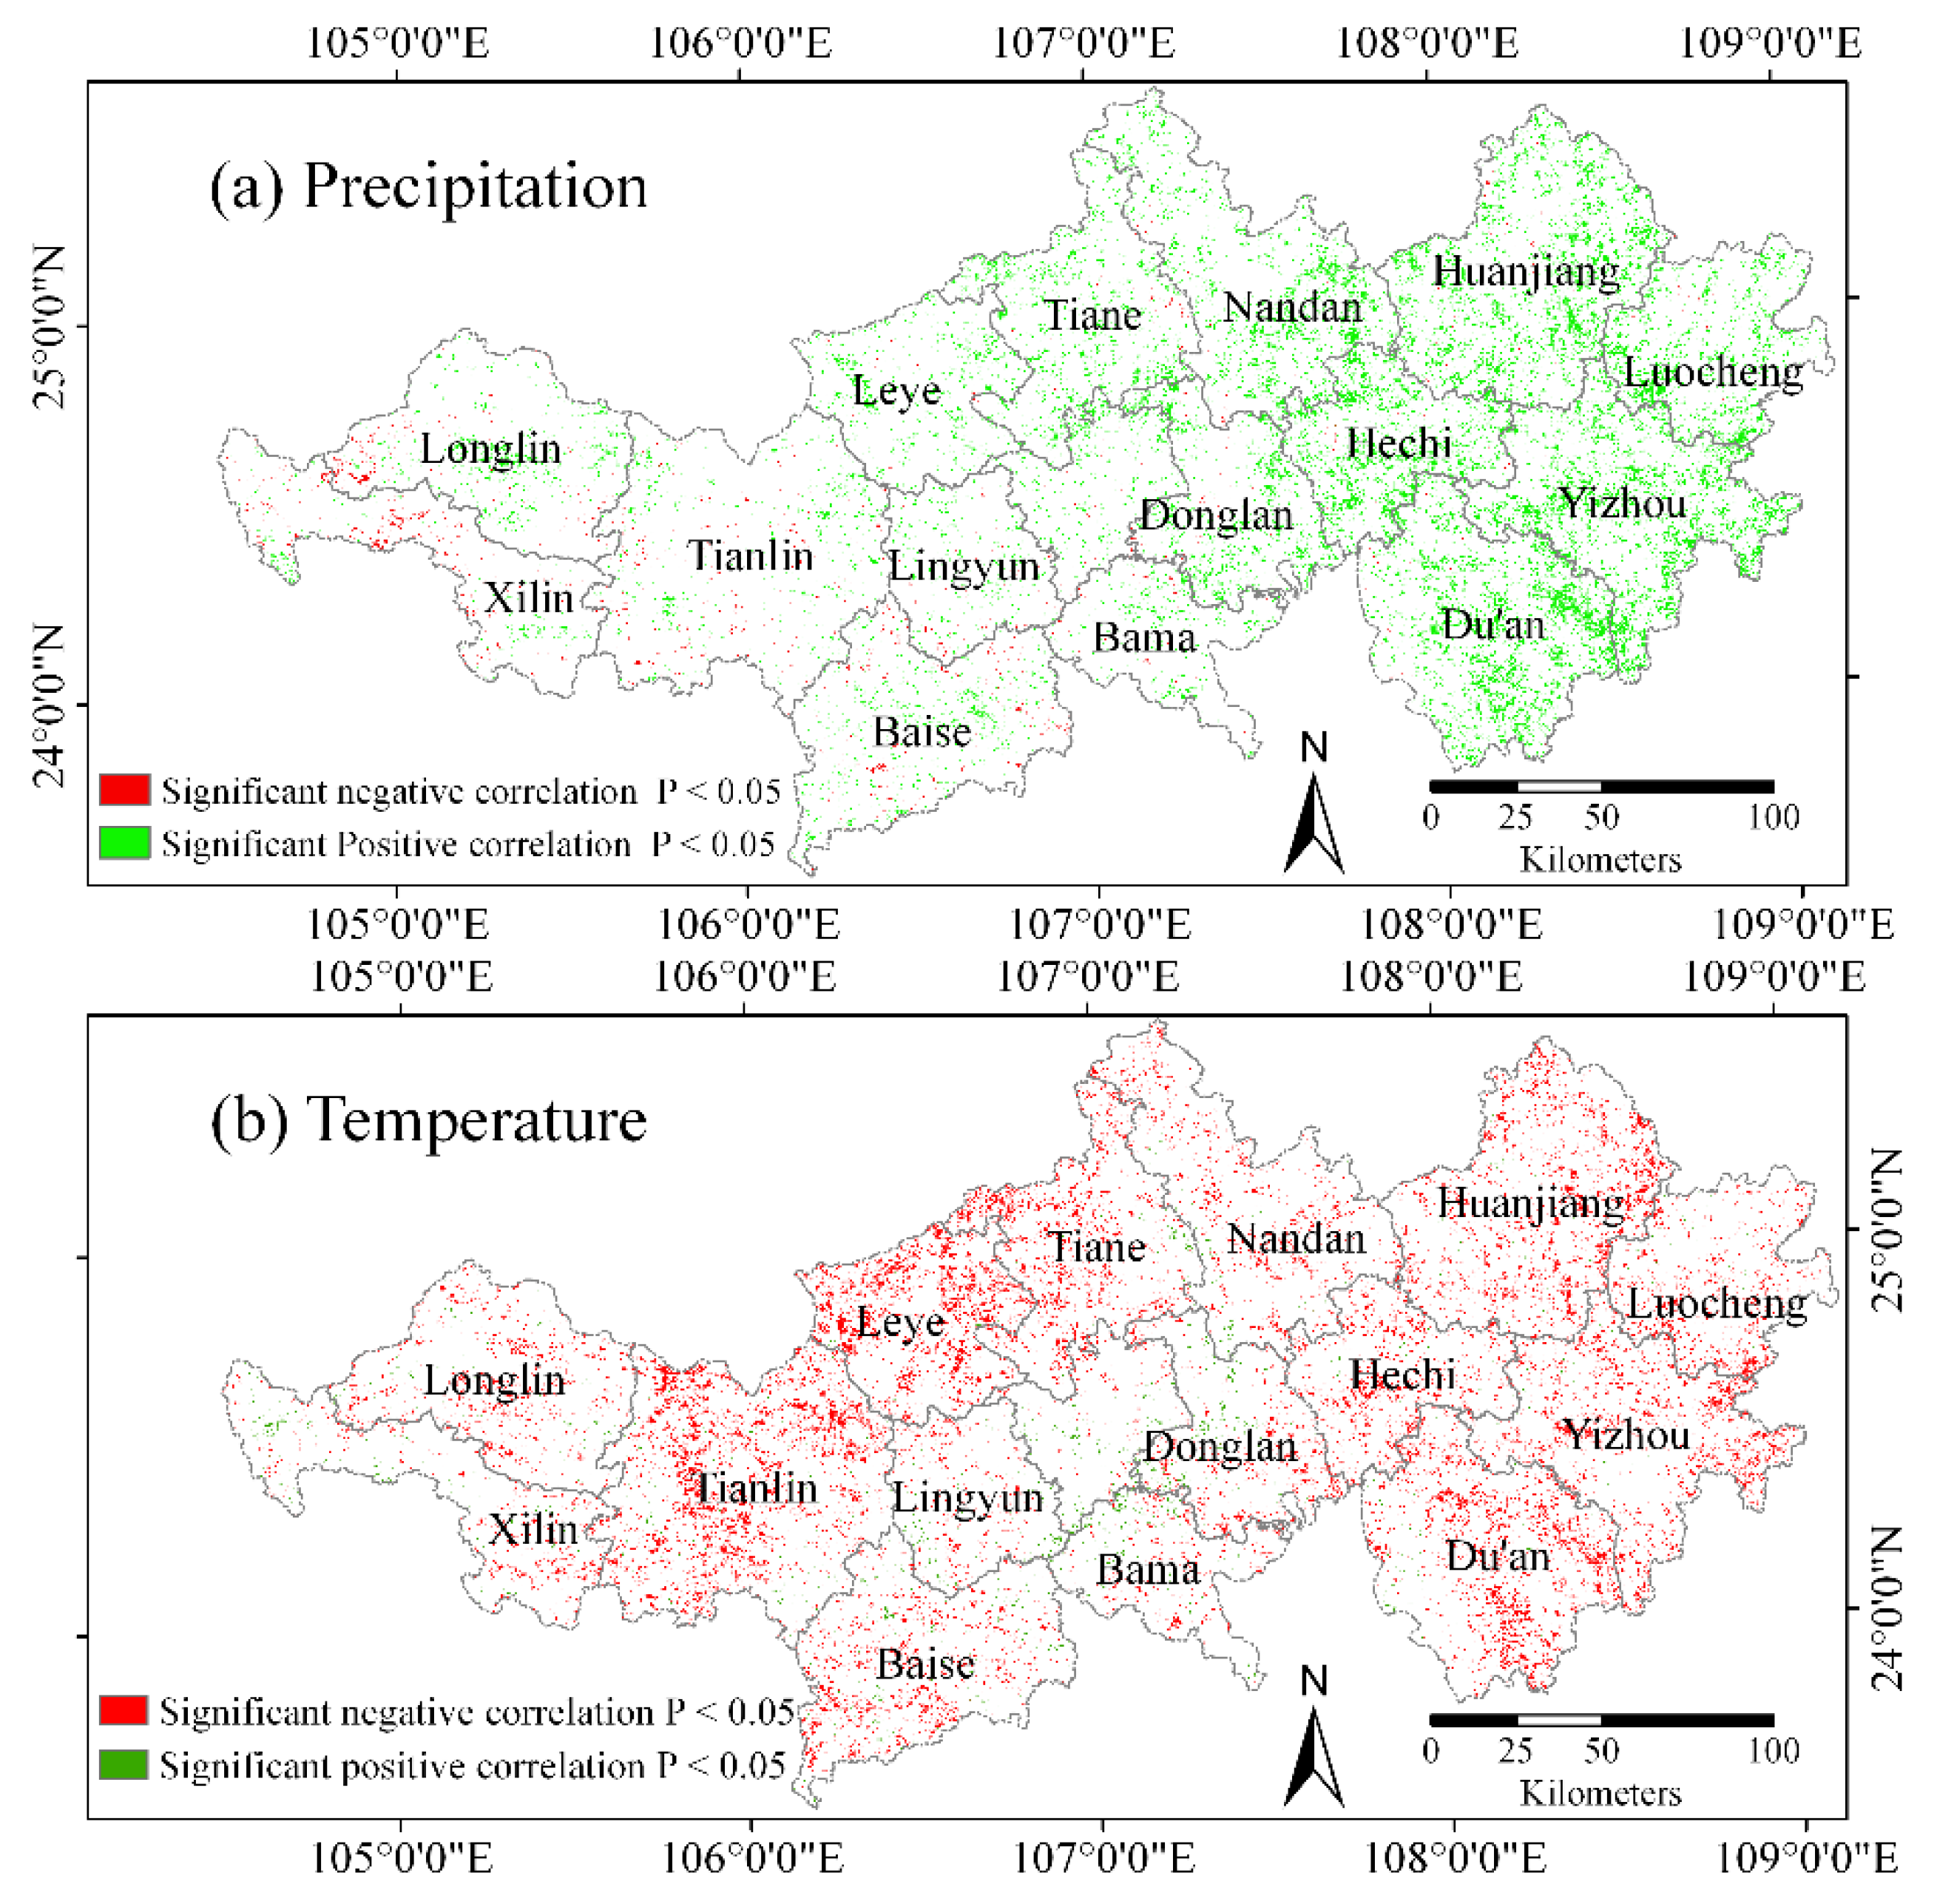
3.2.1. Variation and Correlation of Natural Factors

A warming and drying trend in the study area was quite apparent over the 11 years of the study period. Average temperature increased slightly at a rate of 0.056 °C·yr−1 from 2000 to 2010 (Figure 5a). The mean annual temperature ranged from 15–18 °C in the west and north to 20–22 °C in the southeast. Annual precipitation showed a tendency to decline, and the variation rate was −2.59 mm·yr−1 (Figure 5b). There were large inter-annual variations in climatic variables in the study area (60.36% of the pixels showed positive inter-annual variation rates in temperature). In particular, in the middle parts of the study region, the inter-annual variation rates were as high as 0.12 °C·yr−1. In the western and northern parts of the study area, the inter-annual variation rates of temperature were negative. Except for the southeastern and mid-western part of the study area, the inter-annual variations rates of precipitation were negative, and the variation rates could be up to −18.24 mm·yr−1. A total of 49.91% of all the pixels showed positive rates of precipitation change.
Figure 5. Climate fluctuations of (a) temperature and (b) precipitation in 2000–2010.
Remotesensing 08 00102 g005
Both positive and negative correlations existed between climatic variables and annual CSOP from 2000 to 2010 at the pixel scale in the study area (Figure 6). There was a significant correlation between CSOP and precipitation in 9.18% of the study area (p < 0.05), with a positive correlation within 8.69% of the area, distributed mainly in the eastern part of the study region. There was a significant correlation between temperature and CSOP in 8.96% of the study area (p < 0.05), and a negative correlation within 8.40% of the area. There was a strong positive correlation between temperature and CSOP in the central part of this study region, where the main vegetation types were mixed evergreen forests and shrubs. In the northeastern part of the region, the vegetation type was mainly mixed deciduous forests. Therefore, the increased temperature could lengthen the growing season of shrub and forests and strength photosynthesis, and thus promote vegetation activities. However, in the western part of the region, the correlation coefficients were negative. Specifically, the correlation coefficients were significantly negative in the western part of this study region and in most of the karst area. Most of the karst region lacked surface water. Consequently, temperature increases could increase evapotranspiration and result in vegetation stress; therefore, continuous drought in the summer may have caused the decrease in CSOP.
Figure 6. Distribution of correlation between CSOP and (a) precipitation and (b) temperature (0.05 and 0.01 significance levels). The figure was generated using ARCGIS 10.0.
Remotesensing 08 00102 g006

3.2.2. Human Factors that Affected CSOP

(1) The Characteristics of Land Use Change

Land use within the study area changed over the 11 years of the study period (Table 2). The areas characterized by forest, water, farms, and buildings increased significantly, including an increase of 156.56 km2 in forested land between 2000 and 2010. There were three main types of land transformations (Table 2): from farm to forest, from grass to forest, and from shrublands to forest. The shrubland area decreased the most significantly, followed by grassland and then bare land. A total of 274.36 km2 of shrublands was converted to other forms of land uses between 2000 and 2010, of which 58.97% was converted into forest. A total of 215.69 km2 of shrub/grassland was converted to forest, while 40.78 km2 of forest became shrub/grassland. These changes were closely associated with recent vegetation reconstruction practices. Application of the GTGP and hill closure for reforestation was the primary method used to restore vegetation in the study area. A total of 21.48 km2 of other types of land uses was converted to buildings. The area for building was derived mainly from shrublands and farmland, accounting for 80.77% of recently developed building land. The conversion from shrublands to buildings was one of the most significant transformations during the 11 years of the study period. It is reasonable to conclude that the implementation of vegetation restoration programs was a critical factor in increased CSOP. Meanwhile, the rapidly developing economy and accelerating urbanization process led to a massive transfer of other land uses to building land.
Table 2. Conversion and variation of land use in the study area from 2000 to 2010 (km2).
ForestShrubGrassWaterFarmBuildingBareness land
Forest27,820.1735.105.682.7635.163.400.00
Shrub161.7812,290.458.5799.7150.7211.930.35
Grass53.9115.48406.200.1811.180.410.10
Water1.850.420.15543.064.420.320.00
Farm14.494.830.119.058813.395.420.00
Building0.020.010.000.000.16414.510.00
Bare land6.622.880.370.104.560.191.39
Variation156.56−274.36−66.39104.6472.3121.48−14.25

(2) Correlation between Human Activities and CSOP

There is a high degree of spatial heterogeneity in the relationship between human activities and CSOP (Figure 7). The mean residual slopes were between −0.0489 and 0.0263. A total of 43.80% of the residual slopes were positive, particularly in the eastern and middle parts of the study region. The areas with negative residual slopes were in the western and south-central parts of the study area. In these areas, a large number of farms were converted to building land, and the absolute values of the negative residual slopes were higher than those in other regions. Meanwhile, the strong negative trends in some areas may be the result of the intense southwest drought in 2009 and 2010. The severe drought limited vegetation growth and consequently caused a significant drop in CSOP. The negative effects caused by extreme weather events may have alleviated or offset the positive effects of the increased forest area and ecological restoration program.
Figure 7. (a) Interannual change trends and (b) results of significance test in the study area region from 2000 to 2010. The grade of decreased severely refers to the significance p < 0.05 and trend < 0, and the grade of increased greatly refers to the significance p < 0.05 and trend > 0. The figure was generated using ARCGIS 10.0.
Remotesensing 08 00102 g007
Although climate fluctuation is an important factor that influences the spatiotemporal variations of CSOP, the impacts of human activities should not be neglected. There were correlations among the socioeconomic statistics indexes (p < 0.05), with differences for varying levels of CSOP (Table 3). Obvious negative correlations were observed between CSOP and HAI (p < 0.01, r = −0.102). Significant positive correlations were observed between CSOP and PRO1 or CONSTRU (p < 0.01). The radial basis function network model, based on 13 environmental factors of 1377 samples, showed that human activities affected the spatial distribution of vegetation carbon in typical karst areas [14].
Population growth, urbanization, economic development, and technological advances have changed the land use and land cover [28]. Spectrum analysis showed that although the power spectral density of human activity indexes is different, CSOP was concurrent with changes in the trends of GDP, HAI, and CONSTRU, albeit in the opposite direction. In contrast, changes of power frequency density in CSOP were quite different from those of the other four indicators (i.e., PROD1, PROD2, PROD3, and PEOPLE) (Figure 8).
Table 3. Correlation of CSOP and social economic statistics.
CSOPHAIGDPPRO1PRO2PRO3CONSTRU
HAI−0.102 **
GDP0.052 *−0.197 **
PRO10.092 **−0.467 **0.333 **
PRO2−0.012−0.373 **0.621 **0.553 **
PRO30.056 *−0.474 **0.561 **0.764 **0.859 **
CONSTRU0.108 **−0.425 **0.671 **0.386 **0.405 **0.591 **
PEOPLE−0.027−0.110 **0.457 **0.378 **0.111 **0.455 **0.638 **
** p < 0.01 * p < 0.05.
Figure 8. The spectrum trends of (a) CSOP (b) GDP; (c) HAI; (d) CONSTRU; (e) PRO1; (f) PRO2; (g) PRO3; and (h) PEOPLE. The figure was generated using SPSS (Statistical Product and Service Solutions) 10.0.
Remotesensing 08 00102 g008

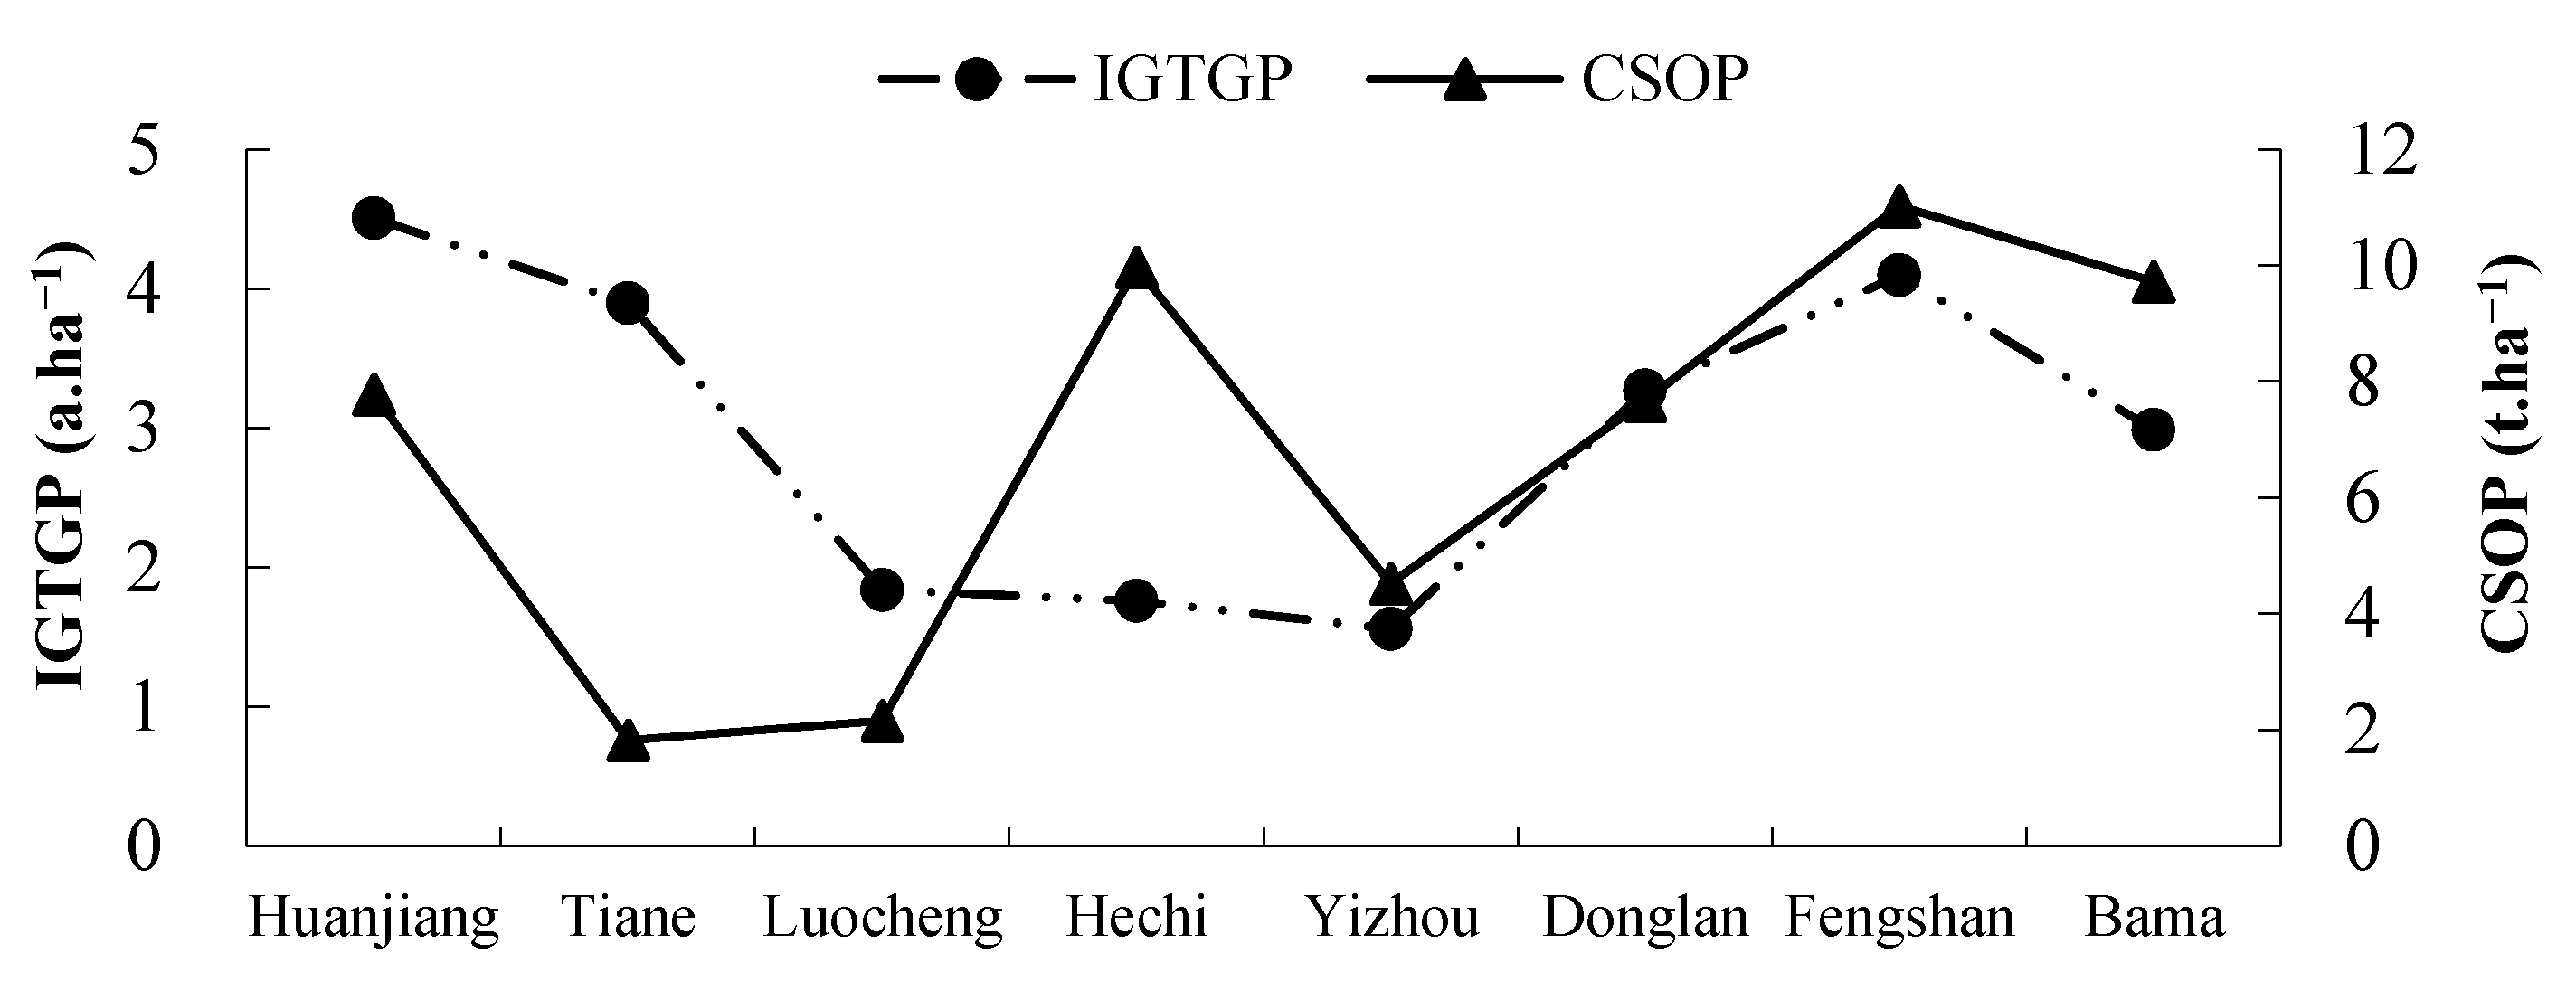
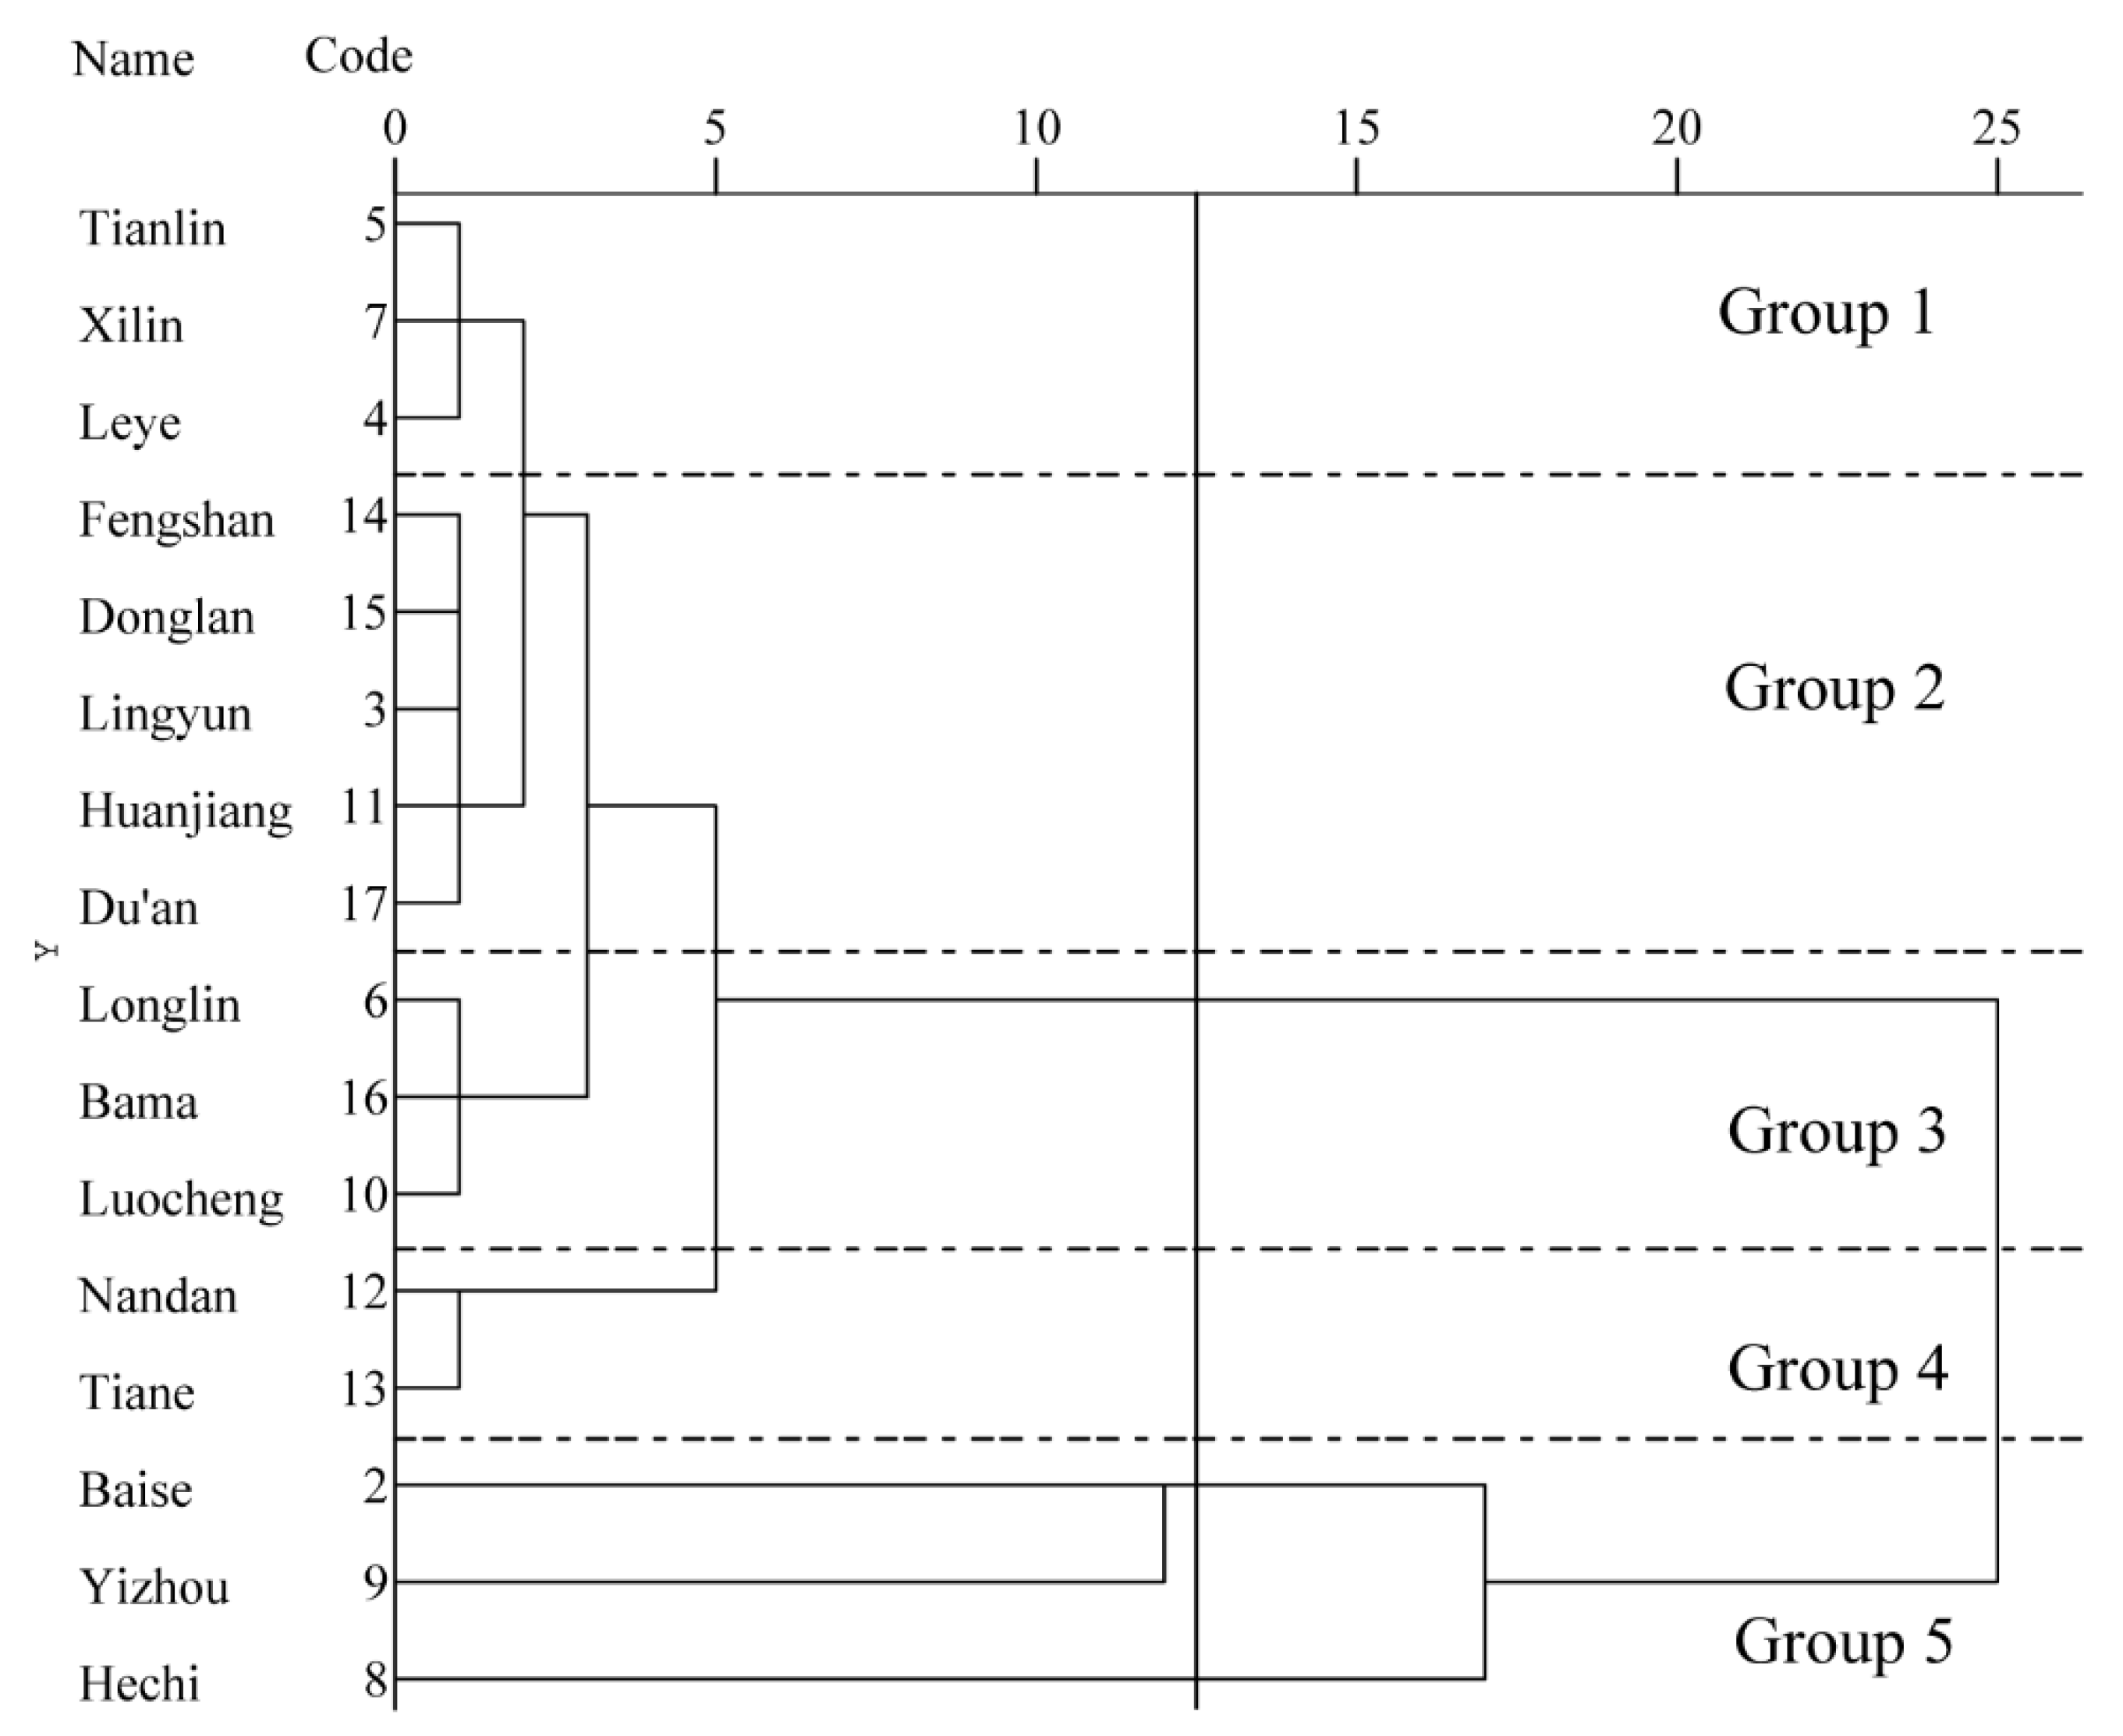
(3) Influence of Ecological Projects on CSOP

As one of the most serious geo-ecological problems in the karst areas in Southwestern China, karst rocky desertification had become a popular research topic. The ecological programs and rocky desertification controlling project resulted in a positive effect of the control of karst rocky desertification, thereby leading to changes of land use and land cover. In addition to the impact of climatic factors, the influence of human activities on CSOP displayed significant spatial and temporal variations. In the study region, the change in CSOP was significantly influenced by the implementation of ecological projects, such as gains in reforestation and afforestation by hill closures and comprehensive control of karst rock desertification. The implementation of the environmental emigration program had profound impacts on ecological restoration. Changes in CSOP were consistent with those of the IGTGP in typical karst counties (Figure 9): the greater the IGTGP, the more substantial the increase in CSOP, particularly in Hechi county, where the IGTGP was only 1.76 a. ha−1, whereas the increase in CSOP reached 9.97 t. ha−1. Previous studies in this region showed that net ecosystem productivity in typical karst areas has fluctuated substantially since 2000, and this fluctuation is closely related to the GTGP and eco-migration [12].
Figure 9. The change trend of CSOP and IGTGP in typical counties in the study area.
Remotesensing 08 00102 g009
Consequently, the ecological restoration programs were one of the main drivers of the increasing trend in CSOP in the study region. Additionally, human interference, such as increased urbanization, resulted in the conversion of farmland and forest to urban land. Taken together, the results of previous research and the current study show that implementing control measures to limit rocky desertification, such as GTGP and ecological emigration, had obvious effects on biomass, carbon, and CSOP of vegetation, with potential ecological benefits. The program has made great progress in easing the impacts of humans on the natural world, increasing the use efficiency of farmland and effectively guaranteeing the implementation of policies to restore farmlands to forested areas [14].
The counties in this study region were clustered into five groups according to their landscape types (Figure 10). Group 1, the ecological shelterbelt, included Leye, Tianlin, and Xilin counties. Because large populations emigrated to more urban areas, human activities in these areas were very low (146.08 persons·km−2 PEOPLE), and the areas showed the highest CSOP (161.88, Table 4). Group 2, the degraded ecological shelterbelt, included Huanjiang, Donglan, Fengshan, Lingyun, and Du’an counties. They were characterized by relatively low levels of human activity (381.04 persons·km−2 PEOPLE) but a relatively high CSOP (153.29 t·ha−1). Group 3, the agricultural area, included Luocheng, Longlin, and Bama counties. This area had low CSOP (146.84 t·ha−1) and was characterized by large areas of farmland (97.67 × 10⁴ RMB·km−2 PRO1) and small areas of permanent vegetation. Group 4, the suburban area, included Nandan and Tiane counties. This area was characterized by a low CSOP (144.97 t·ha−1) and high levels of human activity (734.36 × 10⁴ RMB·km−2 GDP, 217.91 × 10⁴ RMB·km−2 PRO2; Table 4). Group 5, the urban area, included Hechi, Yizhou, and Baise counties. This group was the most artificially disturbed area, with high-intensity human activity (996.99 × 10⁴ RMB·km−2 GDP, 257.43 × 10⁴ RMB·km−2 PRO2, 449.29 persons·km−2 PEOPLE).
Figure 10. Clustering dendrogram of counties, based on hierarchical cluster analysis using average linkage (between groups) and rescaled distance clustering. The figure was generated using SPSS (Statistical Package for the Social Sciences) 10.0.
Remotesensing 08 00102 g010
Table 4. CSOP and human activity in different groups of counties.
ClustersCSOP (t·ha−1)GDP (× 104 RMB¥·m−2)PRO1 (× 104 RMB¥·km−2)PRO2 (× 104 RMB¥·km−2)PRO3 (× 104 RMB¥·km−2)PEOPLE (Person·km−2)
Group 1161.88117.3442.4333.0141.91146.08
Group 2153.29248.8573.8885.2989.67381.04
Group 3146.84391.4597.67178.60115.18433.48
Group 4144.97734.3634.26217.9161.70290.32
Group 5156.65996.99131.49257.43190.17449.29

4. Discussion

This study evaluated the spatiotemporal variation of CSOP and its main factors in a typical karst region of northwest Guangxi, China. This study’s results suggest that factors affected by humans have important effects on the pattern of CSOP in a typical karst region, and that rocky desertification control measures also had an important impact on the pattern of CSOP, which are similar to previous results for small scale vegetation in karst obtained by sampling [8,9,14,29]. Most of the previous studies showed that spatial variation in vegetation carbon density generally increased in a typical area between 2005 and 2010, and factors associated with human activities had relatively high impacts on the distribution of vegetation carbon density. The ecosystem conditions were improved by the implementation of policies for rocky desertification in 2000–2010 [12,30,31].
The estimated results have some degree of uncertainty because of the complexity and dynamics of the ecosystems [5,32,33,34]. Several factors affected the accuracy of CSOP estimation at the regional scale. First, spatial scale is an important factor, and a multi-scale assessment of CSOP is necessary. The spatial scale at which vegetation type is measured significantly influences both the ecosystem service extent and its valuation [5,32,35]. Karst ecosystem areas are considerably fragile and heterogeneous [11], and the spatial scale needs to be taken into account in future evaluation of CSOP of this or similar regions. Second, the complex terrain in the karst area presented a challenge for deriving the spatial distribution of annual precipitation that was interpolated from climate records at 97 weather stations within and near the study area of northwest Guangxi, China. The large spatial and temporal variability in precipitation and temperature thus made accurate mapping distribution difficult at the 100-m resolution. Third, the CSOP assessment was undertaken through application of the terrestrial CASA together with remote sensing. The accuracy of the results from the CASA model is largely dependent on the resolution of remote sensing data. The remote sensing images of MODIS (1 km) and TM (30 m) were the main data sources in this study. The classifications of vegetation type were validated by referring to 1:47,000 color infrared aerial photographs. The overall accuracies for these classifications were 80.54%, with Kappa coefficients of 0.63. These errors or uncertainties can be reduced with more data, higher-resolution remote sensing data, and localized model parameters.
The analysis in this paper provides a preliminary basis for future studies of CSOP in the context of rocky desertification in karst regions. However, we did not consider the soil ecosystem in this study area. Although we compared the results with those of in situ data in part of the study area, further studies are required to determine the optimal approach for influencing the dynamic transformation of CSOP in regions with specific geographical environments and climatic backgrounds. Therefore, the present study has some limitations that should be addressed in future studies. First, the soil carbon should be considered for the whole karst system. Second, the degree of uncertainty associated with the CASA method requires further research. Finally, more comprehensive investigation of the driving mechanisms of the distribution of CSOP in karst regions is needed.

5. Conclusions

In the present study, the spatio-temporal variations of CSOP and its main factors were analyzed in a typical karst region of northwest Guangxi, China, using remote sensing data from 2000 to 2010. The results showed that the CSOP of vegetation was increasing, with substantial fluctuations (from 153.63 to 156.41 t·ha−1, reaching 173.13 t·ha−1 in 2009). Precipitation (9.18%, p < 0.05), temperature (8.96%, p < 0.05), and human activities substantially altered CSOP (p < 0.01, r = −0.102**), 43.80% of the residual slopes were positive, and the increases in CSOP were consistent with the IGTGP. The power spectrum density of CSOP followed the opposite trend from that of GDP, HAI, and CONSTRU. Using these data, the counties of the study area were clustered into five groups according to their landscape types: the ecological shelterbelt, the degraded ecological shelterbelt, the agricultural area, the suburban area, and the urban area. Our results indicated that CSOP was significantly increased by the implementation of control measures to limit rocky desertification, which had an important impact on the pattern of CSOP, and that these measures resulted in an improvement in ecological services.
The conflict between economic development and environmental protection is a common issue worldwide that has been previously noted in rocky desertification in karst areas [17,32]. Poor environmental quality is known to be an important restricted condition in karst areas. Therefore, conservation of karst areas should take priority over restricting the uncontrolled reclamation of these areas for economic purposes in future land use practices. Controlling karst rocky desertification requires the optimization of land use structure. Discontinuing all reclamation activities in karst areas might not be possible, but future land reclamation projects need to be controlled and should be implemented after rigorous environmental impact assessment. More comprehensive and detailed exploration of the impacts of karst reclamation projects on ecosystem services provided in southwest China is necessary.

Acknowledgments

This study was supported by National Natural Science Foundation of China (31370484, 41471445, 31470519), National Key Basic Research Program of China (2015CB452703), and the Chinese Academy of Sciences Action Plan for the Development of Western China (KZCX2-XB3-10).

Author Contributions

Kelin Wang and Mingyang Zhang designed the study. Huiyu Liu, Jing Wang, Chunhua Zhang, Yuemin Yue and Xiangkun Qi performed data collection and analysis. Mingyang Zhang interpreted the results and analyzed the data.

Conflicts of Interest

The authors declare no conflict of interest.

Abbreviations

The following abbreviations are used in this manuscript:
CSOP
carbon sequestration and oxygen production
HAI
human activities index
GDP
gross domestic product
PRO1
production of primary industry
PRO2
production of secondary industry
PRO3
production of third industry
CONSTRU
construction area
PEOPLE
human population
GTGP
grain to green program
IGTGP
the intensity of grain to green program
CASA
the terrestrial carnegie ames stanford approach
NDVI
normalized difference vegetation index
NPP
net primary productivity
MODIS
moderate-resolution imaging spectroradiometry

References

  1. Pan, Y.D.; Birdsey, R.A.; Fang, J.Y.; Houghton, R.; Kauppi, P.E.; Kurz, W.A.; Phillips, O.L.; Shvidenko, A.; Lewis, S.L.; Canadell, J.G.; et al. A large and persistent carbon sink in the world’s forests. Science 2011, 333, 988–993. [Google Scholar] [CrossRef] [PubMed]
  2. Wang, S.L.; Yeager, K.M.; Wan, G.J.; Liu, C.Q.; Wang, Y.C.; Lu, Y.C. Carbon export and HCO3 fate in carbonate catchments: A case study in the karst plateau of southwestern china. Appl. Geochem. 2012, 27, 64–72. [Google Scholar] [CrossRef]
  3. Dixon, R.K.; Brown, S.; Houghton, R.A.; Solomon, A.M.; Trexler, M.C.; Wisniewski, J. Carbon pools and flux of global forest ecosystems. Science 1994, 263, 185–190. [Google Scholar] [CrossRef] [PubMed]
  4. Pinzon, J.E.; Tucker, C.J. A non-stationary 1981–2012 AVHRR NDVI3g time series. Remote Sens. 2014, 6, 6929–6960. [Google Scholar] [CrossRef]
  5. Wang, X.; Cheng, G.; Li, X.; Lu, L.; Ma, M. An algorithm for gross primary production (GPP) and net ecosystem production (NEP) estimations in the midstream of the Heihe River Basin, China. Remote Sens. 2015, 7, 3651–3669. [Google Scholar] [CrossRef]
  6. Thevs, N.; Wucherer, W.; Buras, A. Spatial distribution and carbon stock of the Saxaul vegetation of the winter-cold deserts of Middle Asia. J. Arid Environ. 2013, 90, 29–35. [Google Scholar] [CrossRef]
  7. Ni, J. Carbon storage in terrestrial ecosystems of china: Estimates at different spatial resolutions and their responses to climate change. Clim. Change 2001, 49, 339–358. [Google Scholar] [CrossRef]
  8. Hou, W.; Gao, J.; Wu, S.; Dai, E. Interannual variations in growing-season NDVI and its correlation with climate variables in the southwestern karst region of china. Remote Sens. 2015, 7, 11105–11124. [Google Scholar] [CrossRef]
  9. Cai, H.; Yang, X.; Wang, K.; Xiao, L. Is forest restoration in the southwest china karst promoted mainly by climate change or human-induced factors? Remote Sens. 2014, 6, 9895–9910. [Google Scholar] [CrossRef]
  10. Parise, M.; de Waele, J.; Gutierrez, F. Engineering and environmental problems in Karst—An introduction. Eng. Geol. 2008, 99, 91–94. [Google Scholar] [CrossRef]
  11. Zhao, X.; Wei, H.; Liang, S.L.; Zhou, T.; He, B.; Tang, B.J.; Wu, D.H. Responses of natural vegetation to different stages of extreme drought during 2009–2010 in southwestern China. Remote Sens. 2015, 7, 14039–14054. [Google Scholar] [CrossRef]
  12. Zhang, M.; Zhang, C.; Wang, K.; Yue, Y.; Qi, X.; Fan, F. Spatiotemporal variation of karst ecosystem service values and its correlation with environmental factors in northwest Guangxi, China. Environ. Manag. 2011, 48, 933–944. [Google Scholar] [CrossRef] [PubMed]
  13. Yang, Q.-Q.; Wang, K.-L.; Zhang, C.; Yue, Y.-M.; Tian, R.-C.; Fan, F.-D. Spatio-temporal evolution of rocky desertification and its driving forces in karst areas of northwestern Guangxi, China. Environ. Earth Sci. 2010, 64, 383–393. [Google Scholar] [CrossRef]
  14. Zhang, M.; Wang, K.; Liu, H.; Zhang, C.; Wang, J.; Yue, Y.; Qi, X. How ecological restoration alters ecosystem services: An analysis of vegetation carbon sequestration in the karst area of northwest Guangxi, China. Environ. Earth Sci. 2015, 74, 5307–5317. [Google Scholar] [CrossRef]
  15. Feng, X.; Fu, B.; Lu, N.; Zeng, Y.; Wu, B. How ecological restoration alters ecosystem services: An analysis of carbon sequestration in China's Loess Plateau. Sci. Rep. 2013, 3. [Google Scholar] [CrossRef] [PubMed]
  16. Piao, S.L.; Fang, J.Y.; Ciais, P.; Peylin, P.; Huang, Y.; Sitch, S.; Wang, T. The carbon balance of terrestrial ecosystems in China. Nature 2009, 458, 1009–1013. [Google Scholar] [CrossRef] [PubMed]
  17. Brown, D.R.; Dettmann, P.; Rinaudo, T.; Tefera, H.; Tofu, A. Poverty alleviation and environmental restoration using the clean development mechanism: A case study from Humbo, Ethiopia. Environ. Manag. 2011, 48, 322–333. [Google Scholar] [CrossRef] [PubMed]
  18. Harris, N.L.; Brown, S.; Hagen, S.C.; Saatchi, S.S.; Petrova, S.; Salas, W.; Hansen, M.C.; Potapov, P.V.; Lotsch, A. Baseline map of carbon emissions from deforestation in tropical regions. Science 2012, 336, 1573–1576. [Google Scholar] [CrossRef] [PubMed]
  19. Evans, J.; Geerken, R. Discrimination between climate and human-induced dryland degradation. J. Arid Environ. 2004, 57, 535–554. [Google Scholar] [CrossRef]
  20. Xin, Z.B.; Xu, J.X.; Zheng, W. Spatiotemporal variations of vegetation cover on the Chinese Loess Plateau (1981–2006): Impacts of climate changes and human activities. Sci. China Ser. D 2008, 51, 67–78. [Google Scholar] [CrossRef]
  21. Field, C.B.; Randerson, J.T.; Malmstrom, C.M. Global net primary production: Combining ecology and remote sensing. Remote Sens. Environ. 1995, 51, 74–88. [Google Scholar] [CrossRef]
  22. Zhu, W.Q.; Pan, Y.Z.; He, H.; Yu, D.Y.; Hu, H.B. Simulation of maximum light use efficiency for some typical vegetation types in China. Chin. Sci. Bull. 2006, 51, 457–463. [Google Scholar] [CrossRef]
  23. Liu, Z.J.; Shao, Q.Q.; Liu, J.Y. The performances of MODIS-GPP and -ET products in China and their sensitivity to input data (FPAR/LAI). Remote Sens. 2015, 7, 135–152. [Google Scholar] [CrossRef]
  24. Running, S.W.; Coughlan, J.C. A general-model of forest ecosystem processes for regional applications 1. Hydrologic balance, canopy gas-exchange and primary production processes. Ecol. Model. 1988, 42, 125–154. [Google Scholar] [CrossRef]
  25. Thornthwaite, C.W. Atmospheric moisture in relation to ecological problems. Ecology 1940, 21, 17–28. [Google Scholar] [CrossRef]
  26. Su, C.-H.; Fu, B.-J.; He, C.-S.; Lü, Y.-H. Variation of ecosystem services and human activities: A case study in the Yanhe watershed of China. Acta Oecol. 2012, 44, 46–57. [Google Scholar] [CrossRef]
  27. Miyazaki, M.; Ouyang, C.; Zhou, X.Z.; Murdoch, J.B.; Fushimi, Y.; Okada, T.; Fujimoto, K.; Kido, A.; Arakawa, Y.; Miyamoto, S.; et al. Z-spectrum analysis provides proton environment data (ZAPPED): A new two-pool technique for human gray and white matter. PLoS ONE 2015, 10. [Google Scholar] [CrossRef] [PubMed]
  28. Zhu, H.Y. Underlying motivation for land use change: A case study on the variation of agricultural factor productivity in Xinjiang, China. J. Geogr. Sci. 2013, 23, 1041–1051. [Google Scholar] [CrossRef]
  29. Yan, J.H.; Wang, W.T.; Zhou, C.Y.; Li, K.; Wang, S.J. Responses of water yield and dissolved inorganic carbon export to forest recovery in the Houzhai Karst Basin, Southwest China. Hydrol. Process 2014, 28, 2082–2090. [Google Scholar] [CrossRef]
  30. Zhang, M.-Y.; Wang, K.-L.; Liu, H.-Y.; Zhang, C.-H.; Duan, Y.-F. Spatio-temporal variation of vegetation carbon storage and density in karst areas of northwest Guangxi based on remote sensing images. Chin. J. Eco-Agric. 2013, 21, 1545–1553. [Google Scholar] [CrossRef]
  31. Yue, Y.; Wang, K.; Zhang, B.; Chen, Z.; Jiao, Q.; Liu, B.; Chen, H. Exploring the relationship between vegetation spectra and eco-geo-environmental conditions in karst region, southwest China. Environ. Monit. Assess. 2010, 160, 157–168. [Google Scholar] [CrossRef] [PubMed]
  32. Yue, Y.; Zhang, B.; Wang, K.; Liu, B.; Li, R.; Jiao, Q.; Yang, Q.; Zhang, M. Spectral indices for estimating ecological indicators of karst rocky desertification. Int. J. Remote Sens. 2010, 31, 2115–2122. [Google Scholar] [CrossRef]
  33. Ngugi, M.R.; Johnson, R.W.; McDonald, W.J.F. Restoration of ecosystems for biodiversity and carbon sequestration: Simulating growth dynamics of brigalow vegetation communities in Australia. Ecol. Model. 2011, 222, 785–794. [Google Scholar] [CrossRef]
  34. Yu, Q.; Wang, S.; Mickler, R.; Huang, K.; Zhou, L.; Yan, H.; Chen, D.; Han, S. Narrowband bio-indicator monitoring of temperate forest carbon fluxes in northeastern China. Remote Sens. 2014, 6, 8986–9013. [Google Scholar] [CrossRef]
  35. Cheng, J.; Ji, Y.; Liu, H. Segmentation-based PoLSAR image classification using visual features: RHLBP and color features. Remote Sens. 2015, 7, 6079–6106. [Google Scholar] [CrossRef]

