Article

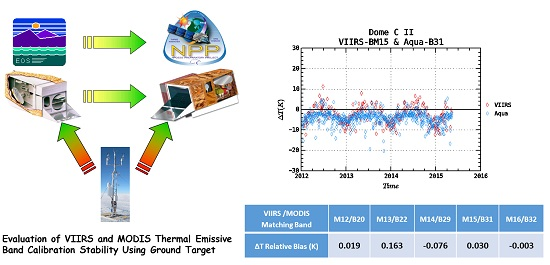
Evaluation of VIIRS and MODIS Thermal Emissive Band Calibration Stability Using Ground Target

1
Science Systems and Applications, Inc., 10210 Greenbelt Rd., Lanham, MD 20706, USA
2
Sciences and Exploration Directorate, NASA/GSFC, Greenbelt, MD 20771, USA
*
Author to whom correspondence should be addressed.
Remote Sens. 2016, 8(2), 158; https://doi.org/10.3390/rs8020158
Submission received: 2 November 2015 / Revised: 2 February 2016 / Accepted: 4 February 2016 / Published: 19 February 2016
(This article belongs to the Collection Visible Infrared Imaging Radiometers and Applications)

Abstract

:
The S-NPP Visible Infrared Imaging Radiometer Suite (VIIRS) instrument, a polar orbiting Earth remote sensing instrument built using a strong MODIS background, employs a similarly designed on-board calibrating source—a V-grooved blackbody for the Thermal Emissive Bands (TEB). The central wavelengths of most VIIRS TEBs are very close to those of MODIS with the exception of the 10.7 µm channel. To ensure the long term continuity of climate data records derived using VIIRS and MODIS TEB, it is necessary to assess any systematic differences between the two instruments, including scenes with temperatures significantly lower than blackbody operating temperatures at approximately 290 K. Previous work performed by the MODIS Characterization Support Team (MCST) at NASA/GSFC used the frequent observations of the Dome Concordia site located in Antarctica to evaluate the calibration stability and consistency of Terra and Aqua MODIS over the mission lifetime. The near-surface temperature measurements from an automatic weather station (AWS) provide a direct reference useful for tracking the stability and determining the relative bias between the two MODIS instruments. In this study, the same technique is applied to the VIIRS TEB and the results are compared with those from the matched MODIS TEB. The results of this study show a small negative bias when comparing the matching VIIRS and Aqua MODIS TEB, implying a higher brightness temperature for S-VIIRS at the cold end. Statistically no significant drift is observed for VIIRS TEB performance over the first 3.5 years of the mission.

Graphical Abstract

1. Introduction

The Suomi Visible Infrared Imaging Radiometer Suite (S-VIIRS) and the MODerate resolution Imaging Spectroradiometer (MODIS) are cross track scanning radiometers orbiting the Earth on a sun synchronous polar orbit with the corresponding altitudes of approximately 824 km and 705 km, respectively [1,2]. The S-VIIRS is on board the S-National Polar-orbiting Partnership platform whereas the MODIS is on board the Terra (T) and Aqua (A) platforms. As of 28 October 2015, the S-VIIRS has completed four years of on orbit flight. The T- and A-MODIS have completed 15 and 13 years of successful on-orbit operation recording the geophysical changes of the Earth in a wide range of spectral channels. Together, the three sensors provide high quality radiometric measurements of the Earth; the S-VIIRS mission is to ensure the continuity of the valuable data records from MODIS. Examples of science products derived from S-VIIRS and compared with MODIS sensor are available in [3,4,5], which cover the ocean, land, and atmospheric science discipline areas. In order to ensure the long term continuity of these data products, the calibrations of the VIIRS and MODIS are extremely critical. In order to achieve the traceability to ground based references, both the VIIRS and MODIS instruments are bestowed with robust on-board calibrators (see Figure 1a,b). In this paper, we focus on the S-VIIRS and A-MODIS bands with wavelengths longer than 3.7 µm. These bands are referred to as Thermal Emissive Bands. The calibration of the S-VIIRS and A-MODIS is based on a similar v-grooved BlackBody (BB) as shown in Figure 2a,b, whose temperature measurements were traceable to the National Institute of Standards and Technology temperature scales [6]. Further, the MODIS BB is monitored using 12 thermistors whereas the VIIRS BB is monitored via 6 uniformly spaced thermistors. The individual thermistor locations are roughly shown in Figure 2a,b.
S-VIIRS has two types of bands providing ground observations at different spatial resolutions. The moderate-resolution (M-) bands have a spatial resolution of 750 m, which is similar to the 1 km bands of MODIS. Additionally, to achieve a wide dynamic range some of the M-bands are dual gain, with high gain intended for detection at the low end of the dynamic range and the low gain for the higher end. M13 is the only dual gain TEB band which is primarily used for fire detection and is similar to MODIS bands 21 and 22. The two imaging (I-) bands are fine resolution that have a spatial resolution of 375 m. The I4 band is very similar to the MODIS band 20 while the I5 band covers MODIS bands 31 and 32, respectively. Figure 3 shows the Relative Spectral Response (RSR) of all the VIIRS TEB overlaid with the response curve of the BB radiance at a set temperature of 290 K [7]. It is important to note the RSRs for 3 µm–4 µm band pairs cover parts of the spectrum influenced by scattered solar irradiance. Table 1 gives the spectral center wavelengths of the VIIRS TEBs along with the matching MODIS TEB. In the rest of the paper we use the following match up of M-bands as mentioned in Table 1 for cross comparison of the two instruments.
In previously reported works [8,9,10], cold Earth View (EV) targets, such as Dome Concordia (C), served as a reference to evaluate the sensor calibration deficiencies at the low end of the dynamic range. In this paper, we extend the methodology developed in [8] to assess the calibration stability and consistency of S-VIIRS and A-MODIS. Since both S-VIIRS and A-MODIS are on afternoon orbits, with near-simultaneous scene acquisition times, the two instrument responses can be cross verified using coincident automatic weather station (AWS) ground measurements. The objective of the work is to track the S-VIIRS TEBs on-orbit performance for 3.5 years since launch, for identifying potential instrument based dependencies, useful in improving future reprocessing of the Level 1B datasets.
With the defined objective as stated above, the rest of the paper is prepared as follows. The next section briefly reviews the TEB calibration algorithm for both VIIRS and MODIS, laying down the foundation for the various calibration terms. The third section describes the evaluation methodology of the TEB of both instruments using the proxy reference. The fourth section provides the results and discussions. Finally, the paper is tied with a summary of the work.

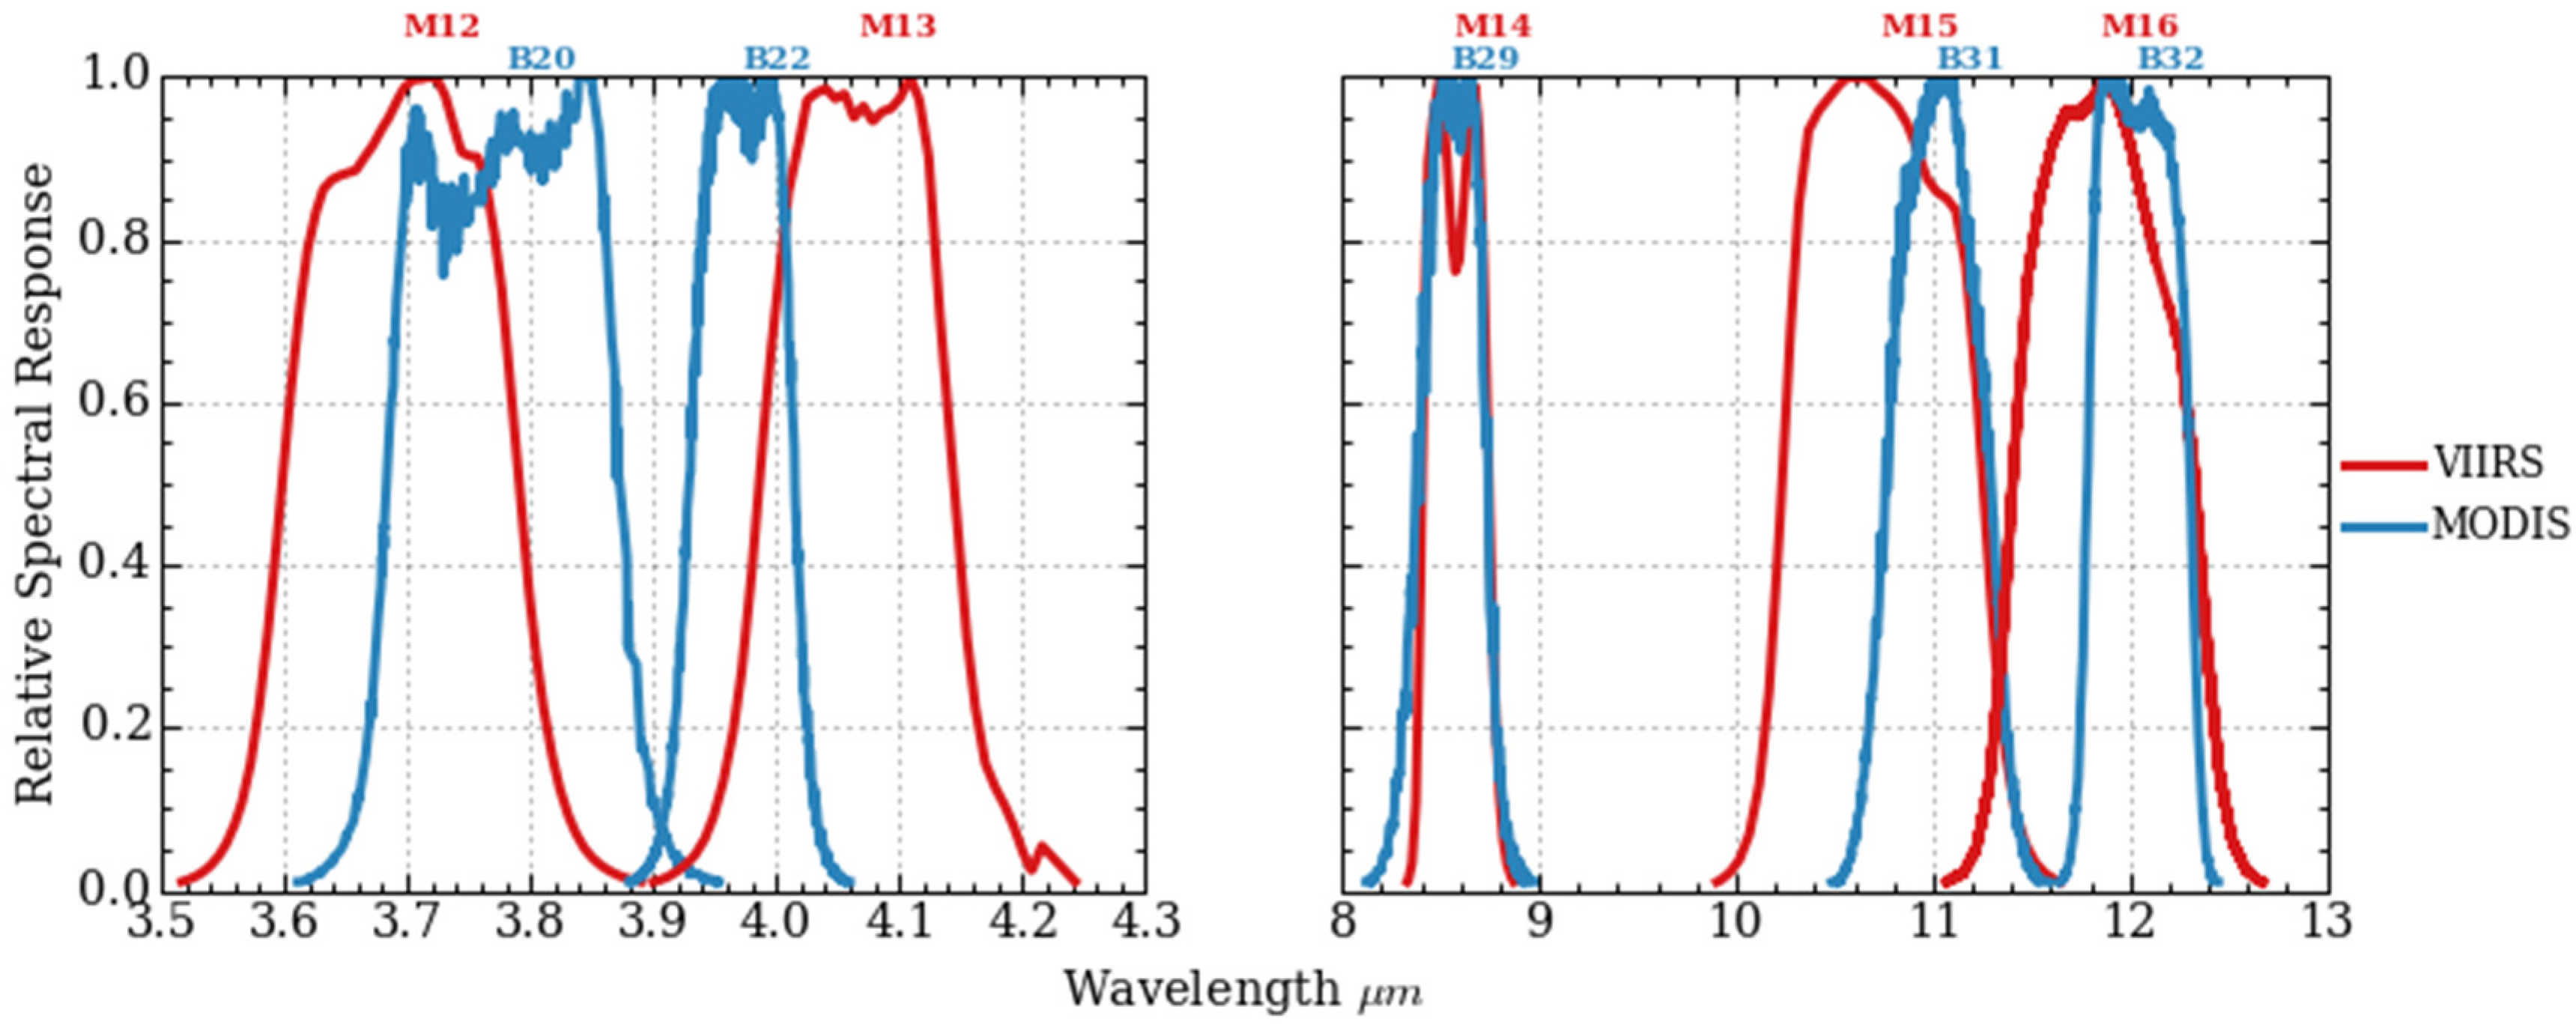
2. TEB On-Orbit Calibration

For MODIS TEB, a quadratic model is applied to describe the relationship between the “at” sensor aperture radiance L and background subtracted instrument response dn [11]. For the BB calibration, the “at” sensor radiance models the thermal environment as:
L C A L = R V S B B ε B B L B B + ( R V S S V R V S B B ) L S M + R V S B B ( 1 ε B B ) ε C A V L C A V
where LCAL is the at sensor aperture radiance for the BB view, RVSBB (RVSSV) is the response versus scan angle (RVS) at the sensor’s BB (SV) view angle. εBB is the BB emissivity and εCAV is the effective scan cavity emissivity. The radiance contains contributions primarily from the BB, in addition has minor contributions from the scan mirror and instrument cavity. The terms LBB (LSM, LCAV) are computed using Planck’s equation at a measured TBB (TSM, and TCAV). Using Equation (1), the linear calibration term b1 for BB observation can be related to the at sensor aperture radiance LCAL by
b 1 = ( L C A L a 0 a 2 d n B B 2 ) / d n B B
For both T- and A- MODIS, a BB Warm-up/Cool-down (WUCD) process on a quarterly basis derives the minor temporal change in calibration coefficients of the quadratic model, especially the offset (a0) and quadratic (a2) terms. In MODIS Collection 5 (C5) or earlier collections, Equation (2) is fitted to the WUCD measurements without constraint. In T-MODIS Collection 6, the offset term a0 is constrained to be zero and only the linear and quadratic terms are fitted to the measured data. The approach of setting a0 to zero was suggested based on the results reported in [9,10].
The calibration equation for S-VIIRS TEB is similar with slight modifications from MODIS, wherein the background removed BB response is related to the spectral radiance as seen by the instrument aperture (Lap) by Equation (3) and is as follows [12]:
F ( B ) = R V S B B ( B ) L a p ( B ) + Δ L b g ( B , θ B B ) i = 0 2 c i d n B B i
where the terms c0, c1, and c2 are pre launch coefficients, ∆Lbg is the residual self emission background term , determined for each band B and at the angle of incidence θ and finally the term F-Factor that relates to the linear change calculated scan-by-scan. The slight modifications from Equations (2) and (3) stem from the fact of using the quadratic terms in VIIRS as a lumped sum of products, the linear calibration change captured from the scan by scan measurements of the BB. Apart from the afore mentioned differences the calibration methodology are based on similar looking equations for the TEB of the two instruments.

3. Evaluation Methodology

Vicarious calibration using well characterized EV targets have proven to be great sources for evaluating and validating the calibration accuracy. Works reported in [8,13,14,15,16,17] have shown and identified stable EV targets that serve the above mentioned purpose. The Dome C (75.102°S, 123.395°E) is one such EV target that has been characterized for Long Wave InfraRed (LWIR) satellite retrievals [8]. Some of the key highlights of this site are: minimum spatial variability, the most homogenous surface with a slope of approximately 0.004%; High Infrared emissivity and relatively uniform surface temperatures; High surface elevation (3233 meters above sea level); Extremely dry and rarified atmospheric conditions allowing the outgoing surface radiation to be very close to the Top Of Atmosphere (TOA) radiance in the spectral window of 11 to 12 µm. The Dome C site is well characterized as being very stable and uniform. Previous works have demonstrated that spatial variability of MODIS Band 31 BTs was typically less than 0.3 K in the Dome C region [18]. From the stand point of polar orbiting EV based remote sensing satellites this site provides a unique advantage of several overpasses per day over the region. Thus, both A-MODIS and S-VIIRS possess thousands of high quality Dome C scene acquisitions in the Level 1 B repository. Figure 4 gives one such S-VIIRS image acquired over Antarctica that comprises the Dome C site (identified by the small black square). The image shown is an orthographic map projection, depicting the retrieved Brightness Temperature (B.T.) from M15 band of S-VIIRS. In general, the scene as expected is a cool target with mean B.T. of approximately 235 K.
Additionally, the Dome C site is characterized by the Concordia research stations jointly operated by research scientists from France and Italy. An AWS, operated by Univ. Wisconsin, has been fully functional since installed in 1995. The AWS is physically installed approximately three meters above the ground base at Dome C. The AWS measurements are calibrated with a radiometric accuracy of ±0.5 K over a range of approximately 233 K–293 K respectively. Additionally, the typical errors were less than 1.0 K for measurements varying from approximately 198 K–298 K [19]. As of May 2015 a twenty year record of various meteorological measurements have been archived that serve as a great ground reference to assess the calibration stability and consistency of MODIS and VIIRS sensors. Figure 5 shows the lifetime temperature observations from both AWS and the MODIS measurements over Dome C since 2002. Based on the trends it can be seen that the lifetime trends are very stable with mean temperatures at approximately 220 K, with seasonal oscillations of approximately ±25 K. Thus the Dome C site provides a useful reference to assess the lower order deficiencies in calibration models for systems such as MODIS and VIIRS.
In the current work, the AWS is the proxy that is employed to assess the calibration consistency and stability of A-MODIS and S-VIIRS since January 2012. The Dome C measurement extractions from the two instruments are described as follows. About 250 nadir viewing Dome C scene acquisitions were identified for both instruments. These scenes were screened for clouds using two filtering steps. The first set of cloud screening was performed using the level 2 cloud mask products. Further, a clear sky restore was performed for MODIS using the algorithm mentioned in [20]. Antarctica presents a significant challenge to discriminate clouds from surface, where the surface is often colder than cloud. In order to obtain the maximum number clear-sky the MODIS clear-sky-restore algorithm was used to identify clear-sky pixels incorrectly flagged as cloudy. Unfortunately, the inversions required for this test can not be attained with the limited number VIIRS bands. Next, the spatially equivalent pixels were aggregated up for both the instruments. The total Dome C area covered was a small square region of 20 km × 20 km with the center pixels corresponding to the above mentioned latitude and longitudes of the Dome C site. After acquiring the matching co-located data, the L1B radiances from both the sensors is converted to a retrieved B.T. using the Planck equation and the spectral center wavelengths for the matching wavelengths. The 10-min average AWS data closest to the scene acquisitions is separately recorded. The data source used for this research work is as follows: For A-MODIS the latest collection C6 L1 B radiances were used, the latest version V3.1 L1B radiances for VIIRS from the Land PEATE distribution. The data are acquired from the site provided in [21]. Further, the AWS measurements are made available by the Antarctic Meteorology Research Center at the University of Wisconsin. The data can be downloaded from reference shown by [22].

4. Results and Discussion

This section presents the results of the calibration stability and consistency of the two sensors. Thus the results and subsequent discussions for each of the above mentioned analyses is broken into two subsections.

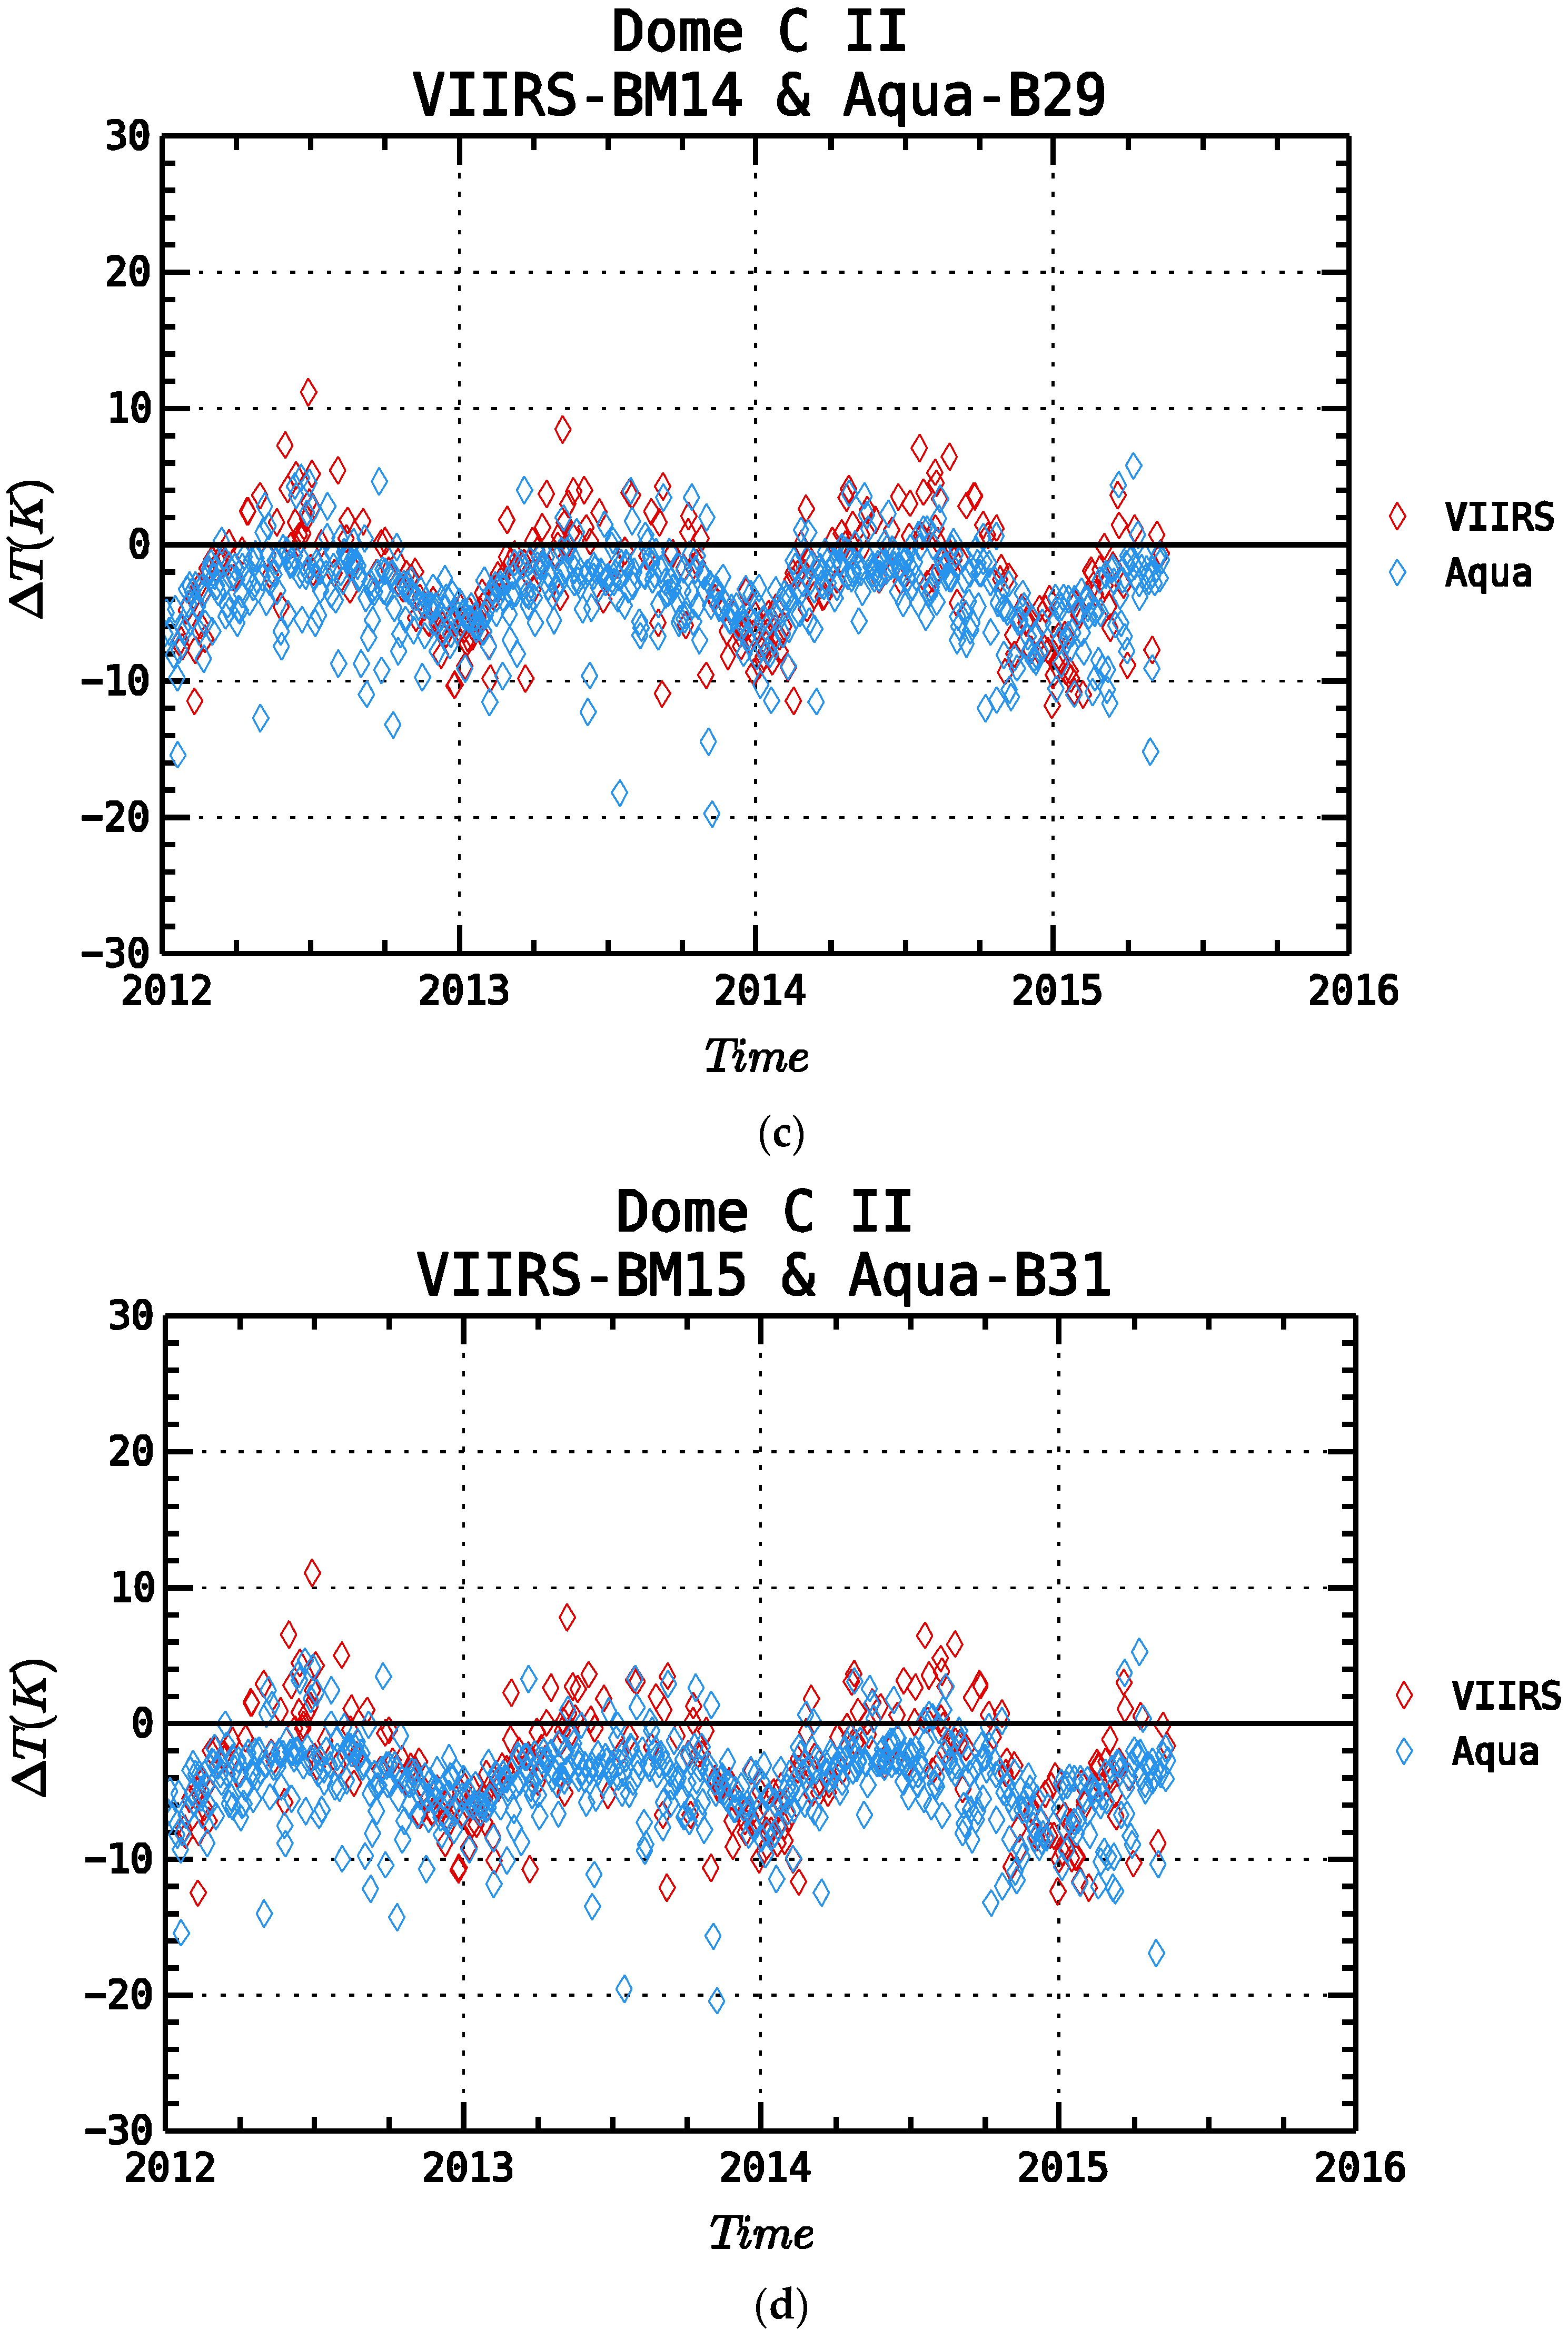
4.1. Calibration Stability

The first aspect of the study incorporated the temperature differences of the afore-mentioned 5 TEB of A-MODIS and S-VIIRS compared against the AWS measurements. The trends are provided in Figure 6a–e. The trends show the temperature differences of the two sensors from the AWS measurements for three and a half years from January 2012. The red diamond points are temperature differences with S-VIIRS while the blue diamond points are for differences with A-MODIS. Additionally shown is a black solid line that references a zero difference. The trends are expected to remain consistent between both sensors, while not necessarily approaching zero. A seasonal oscillation is seen in the difference trends, the difference oscillations between the various bands are smaller with increasing wavelengths. This is particularly true for wavelengths upwards of 8 µm (Figure 6c–e); the oscillations are approximately within ±10 K. It is also noted from the temperature trends shown in Figure 5 that Dome C being located in Southern Hemisphere experiences temperature highs in December (summer) and lows in July (winter), respectively. As a result the coldest scenes are acquired during the May–August time span. In the colder months, retrieved temperatures from S-VIIRS have generally tended to be higher when compared to the AWS reference. A plausible reasoning for this is given later. For the same time frame the A-MODIS is in general closer to the AWS measurements. In the warmer scene retrievals, both S-VIIRS and A-MODIS recorded slightly lower temperatures in comparison to the AWS measurements. This can be expected as the TOA radiance reaching the sensor is attenuated by the atmospheric absorption due to higher water vapor content. Overall, over the three year period from 2012 there are no observable drifts in temperature trends for both the instruments. This indicates the 3.5 years fidelity of the TEBs of both A-MODIS and S-VIIRS.

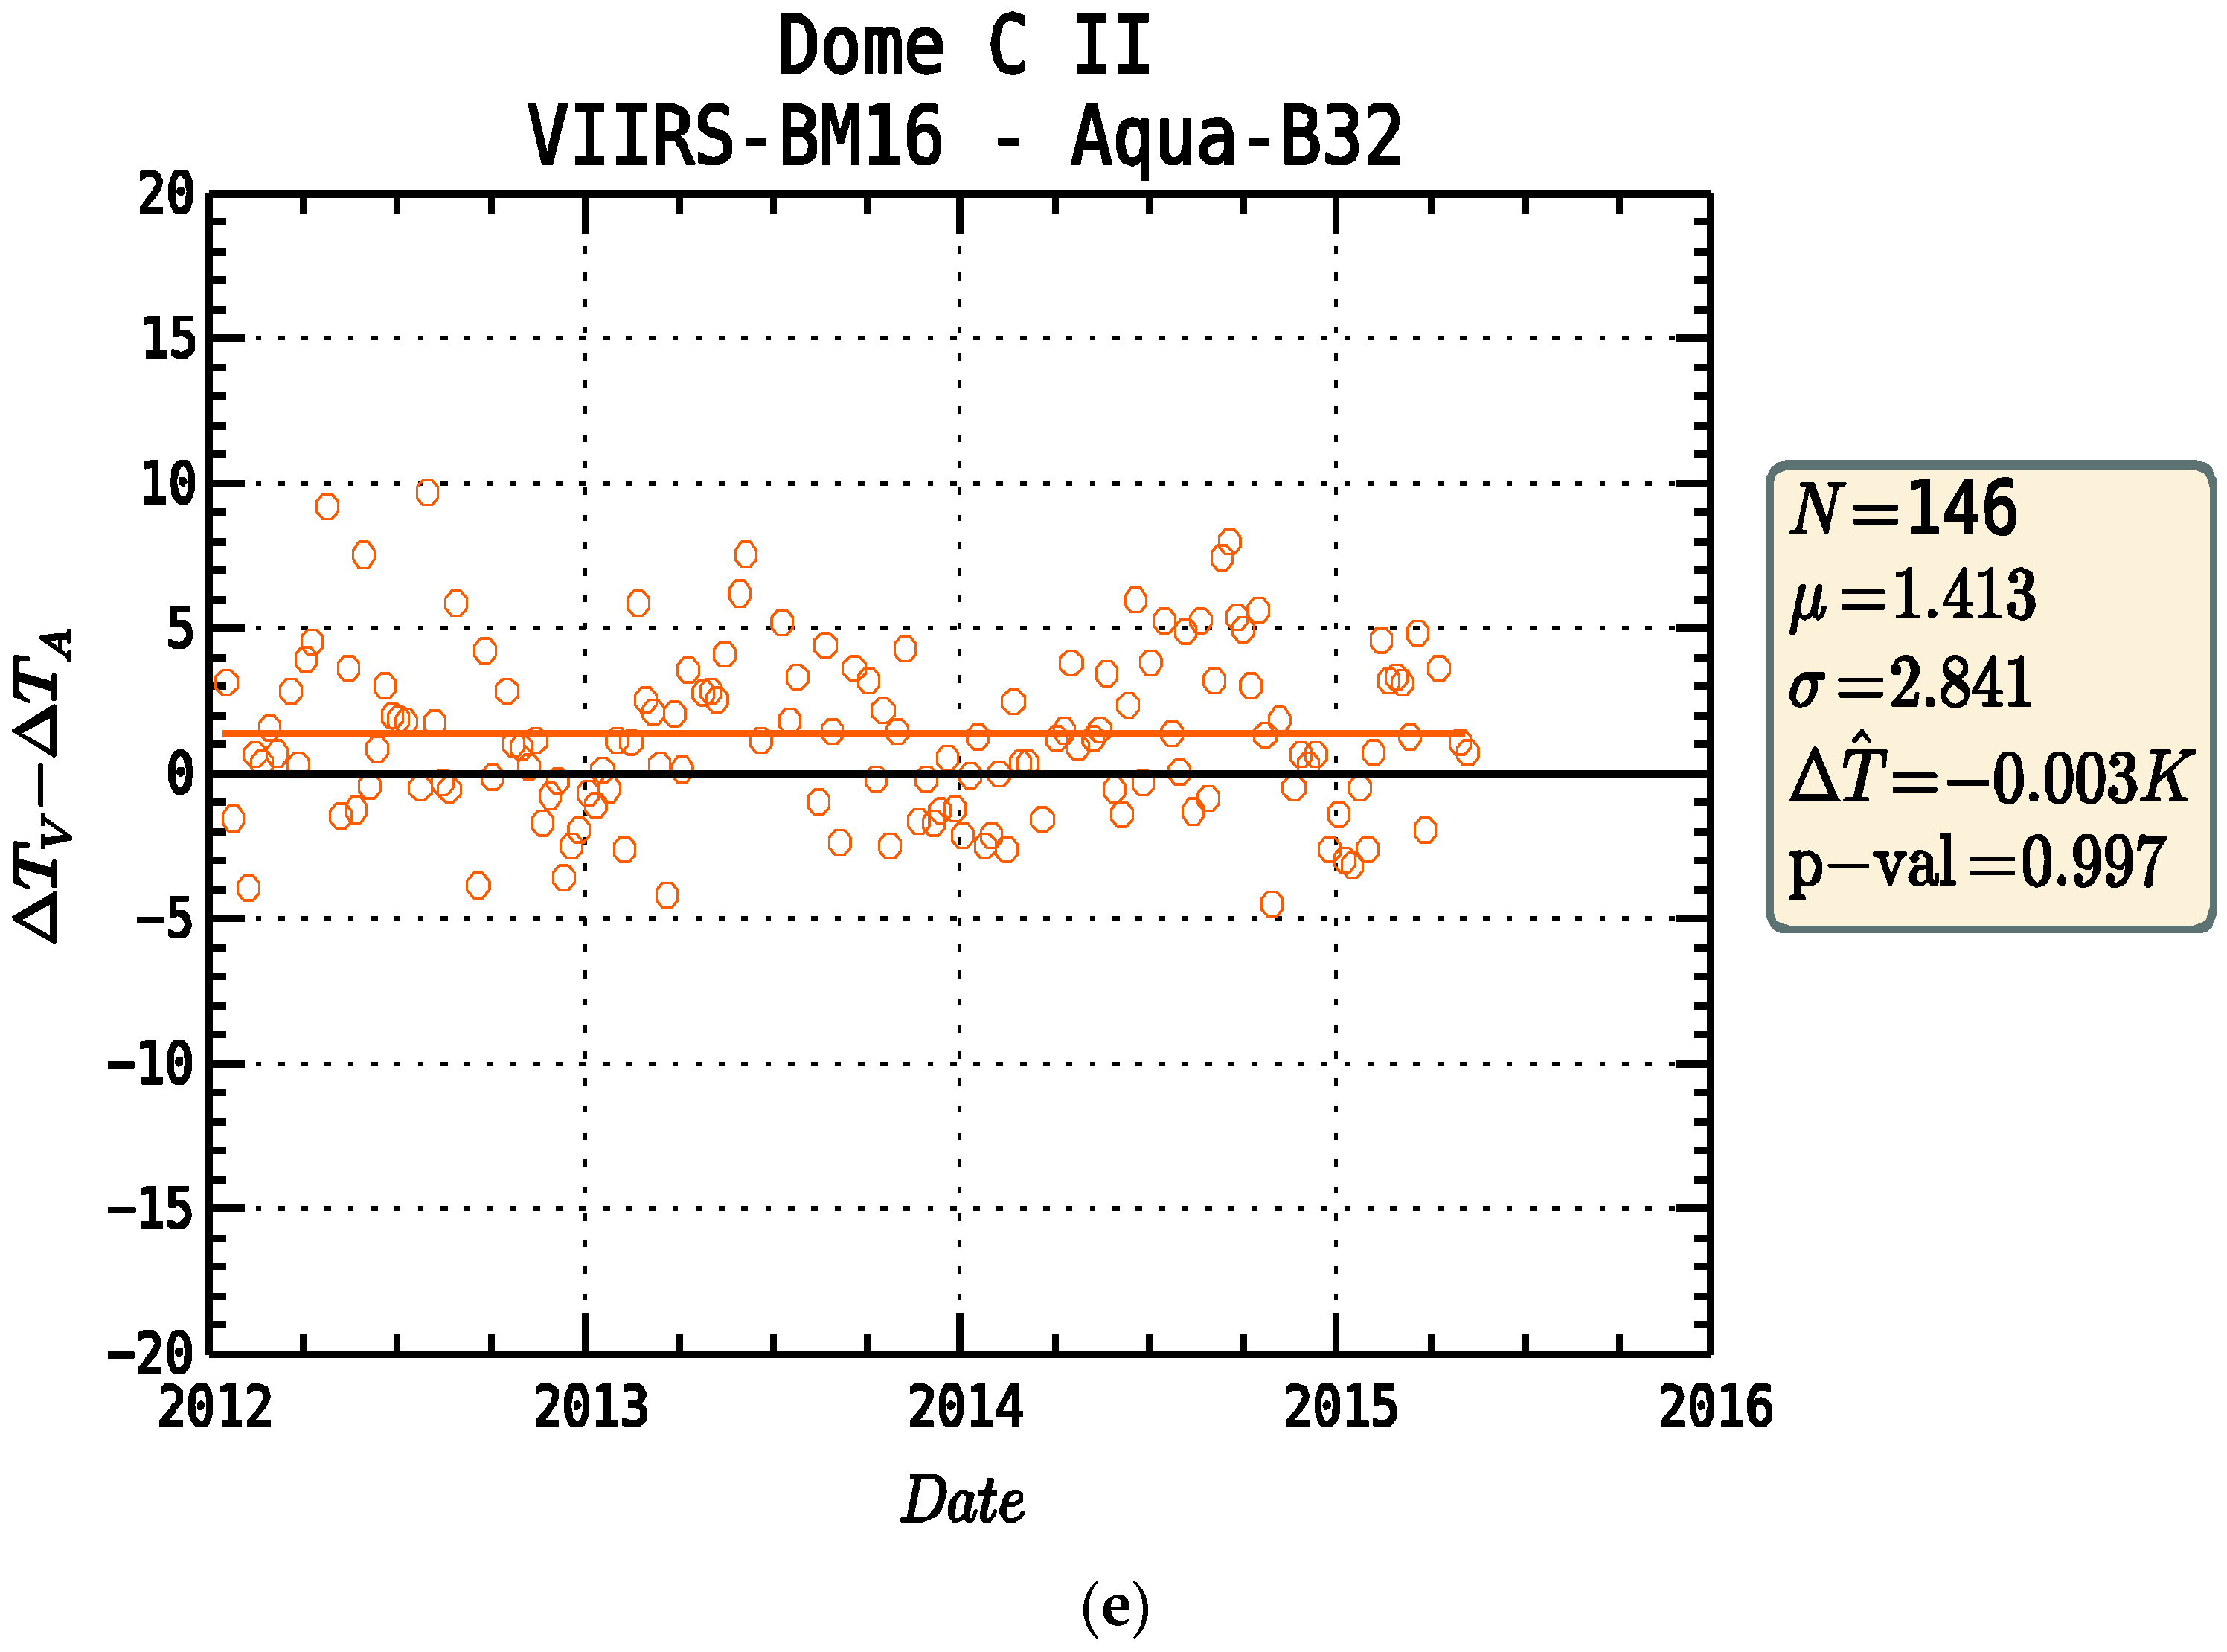
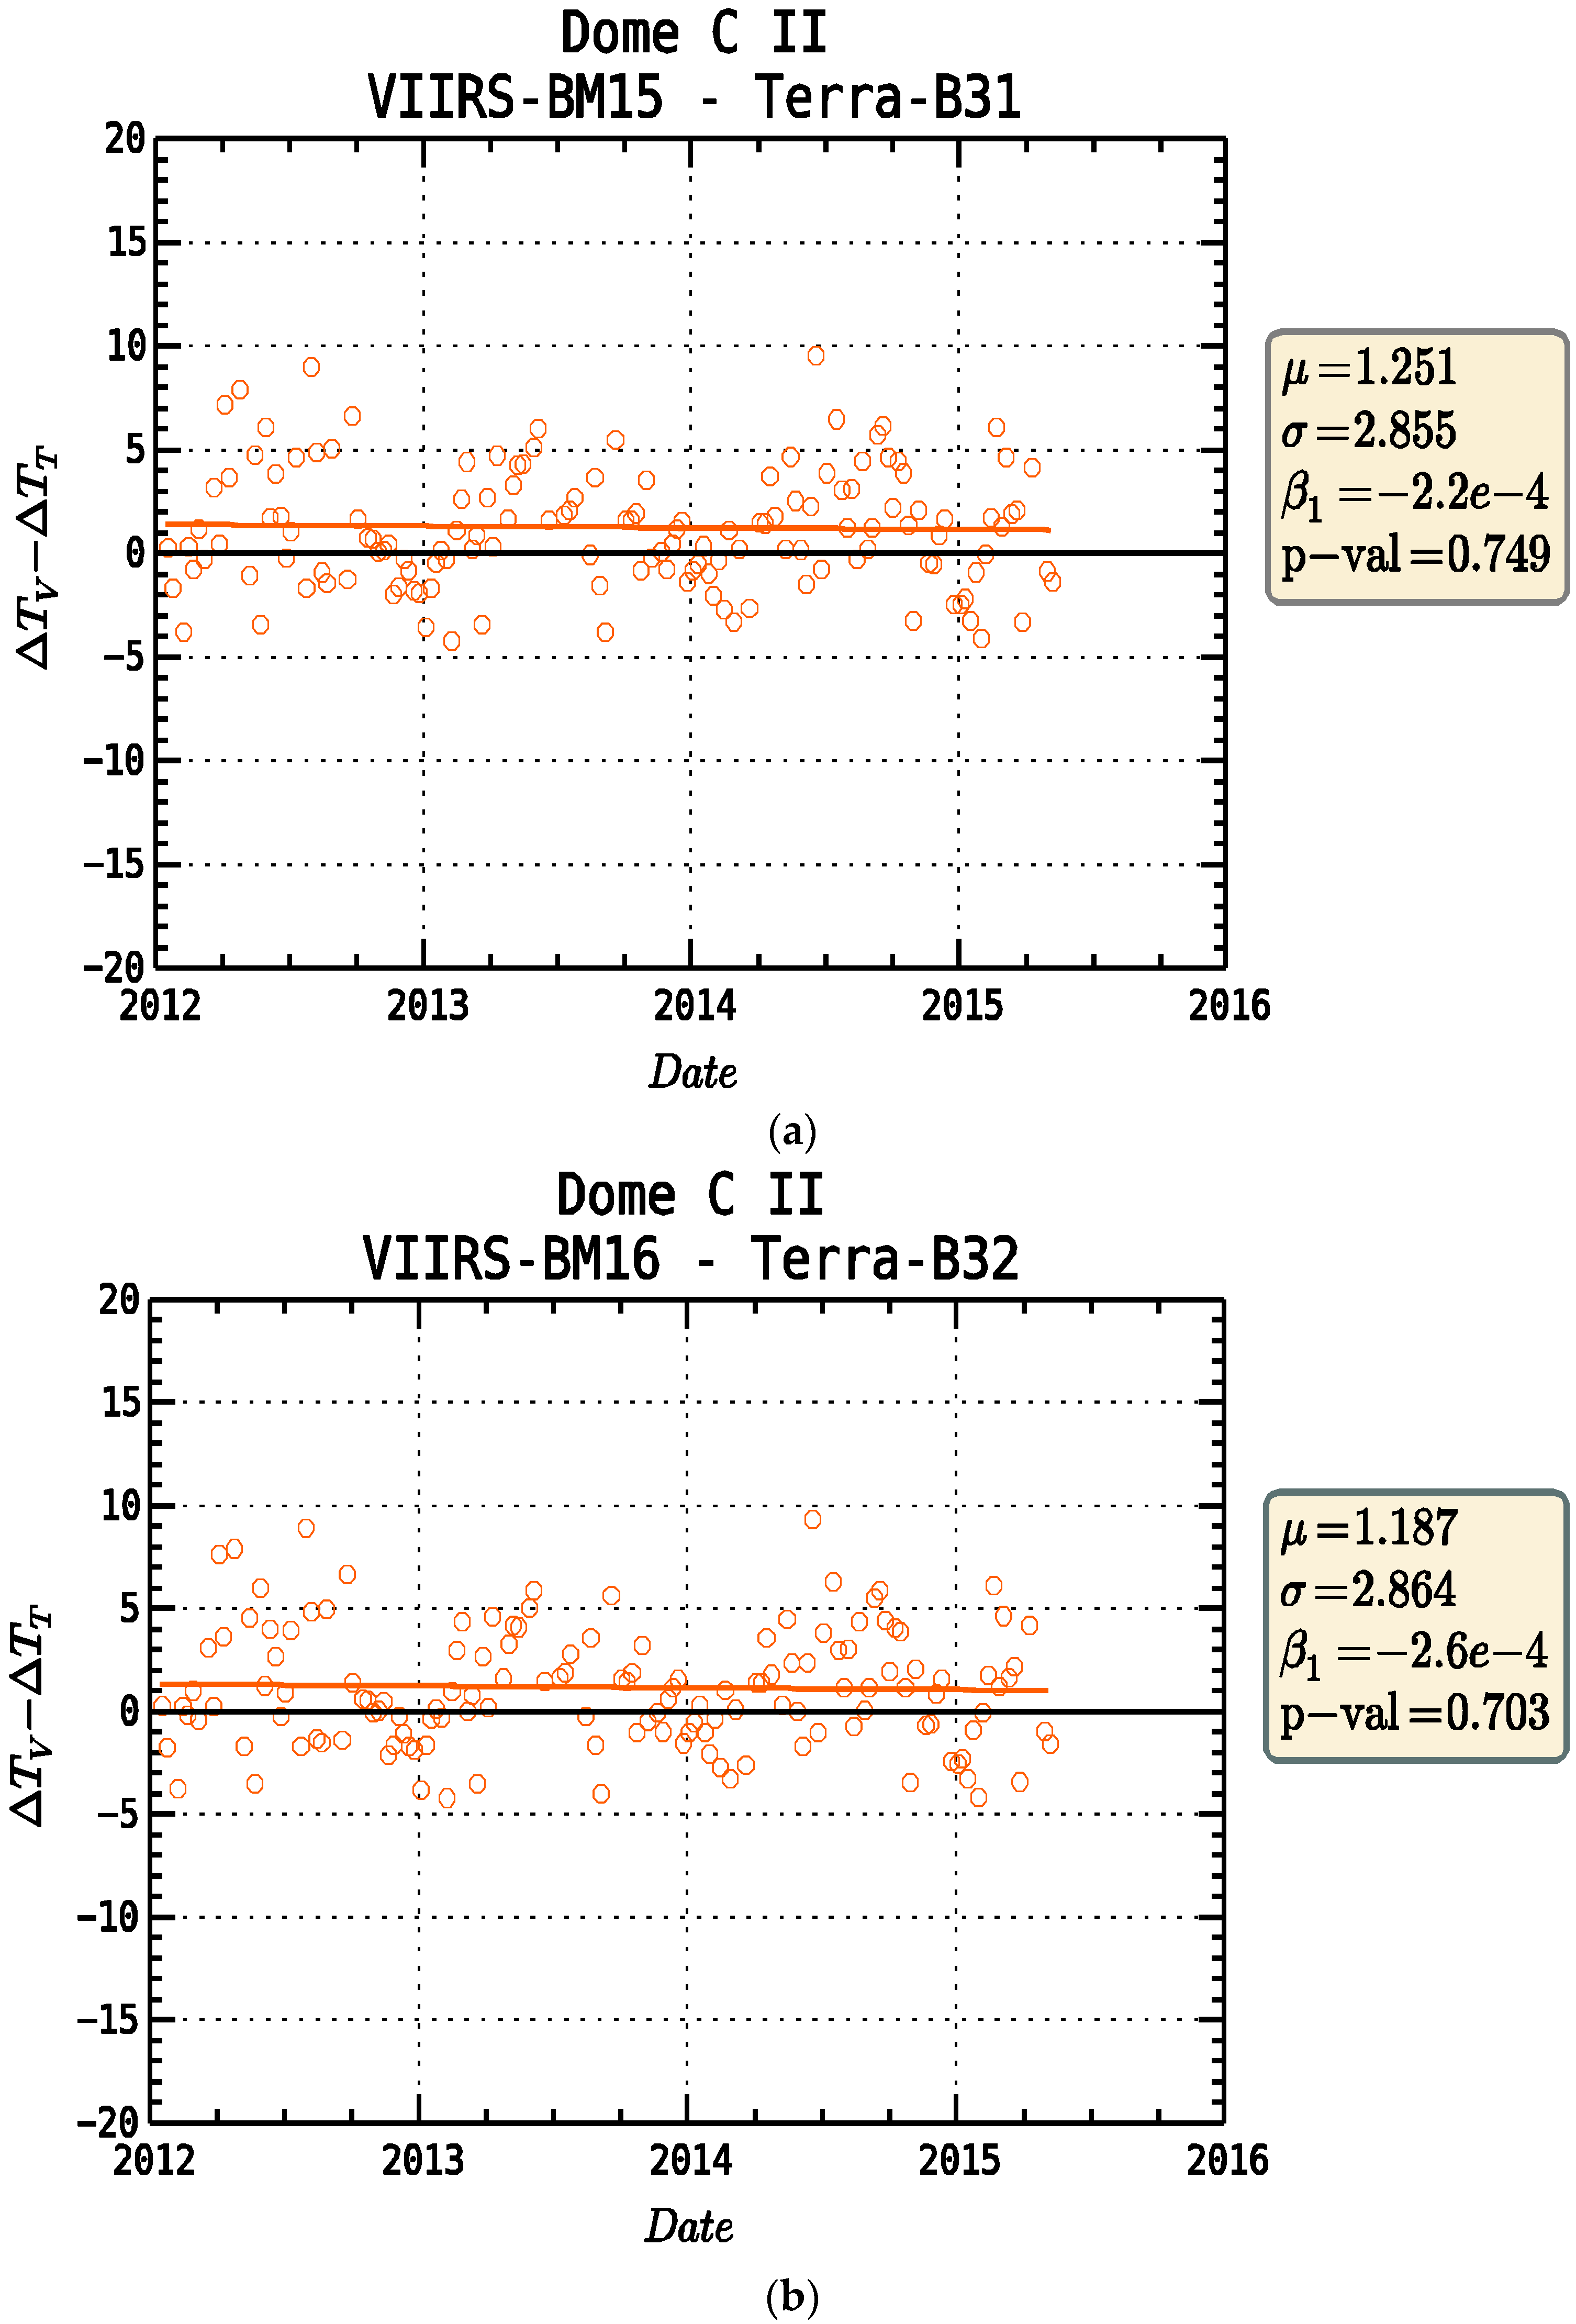
4.2. Calibration Consistency

In order to assess the calibration consistency between the two instruments which is extremely important for long term continuity of climate data records, a double difference of the Brightness Temperatures between the two sensors is done to remove the differences caused by using the AWS as the proxy. This measurement is known as “relative bias” and has been reported for T- and A-MODIS in [8]. The AWS air-temperature measurement is different than the 20 km × 20 km skin surface measured by the sensor. The difference is assumed to be random due to the fluid dynamics of air, and stable within the small satellite acquisition time differences. Figure 7a–e presents the weekly-averaged relative bias trends between S-VIIRS and A-MODIS for the 5 TEB. For each of the bands a linear fit is performed to assess any significant trend. Additionally, shown in each subplot are various statistical quantities such as the mean (µ), standard deviation (σ), delta change in relative bias over 3.5 years (∆T), and the p-value. Due to the differences between AWS and satellite measurements in the SMIR spectrum that positively correlate with non-negative solar elevation, only the night time measurements were used for computing the relative bias in M12/B20 and M13/B22 band pairs, removing approximately 10 weeks per year during Antarctic Summer.
Overall, based on the trends and fit statistics shown there is no statistical evidence for any drift in the relative bias between the two instruments. This is indicative by the high p-value suggesting the linear predictor to be not a representative of the response, the null hypothesis of the slope being not statistically significant be accepted. However, a warm relative bias is assessed between S-VIIRS and A-MODIS. In other words, at colder scenes the S-VIIRS is found to retrieve slightly warmer temperatures in comparison to A-MODIS. The average warm bias (BT [K]/3.5 years) for the various TEB are as follows: approximately 4.94 K for the M12, 4.90 K for M13, 1.48 K for M14, 1.53 K for M15 and 1.41 K for M16, respectively. Some of the differences reported above would have to be absorbed by the uncertainties in the calibration itself. The expected differences are typically based on the design requirements of the calibration sources used for both the instruments. The Blackbody calibration sources are expected to be within 50 mK and 30 mK for MODIS and VIIRS respectively. The differences between the two instruments are expected to be between 0.2 K and 0.5 K [6]. Further, a small portion of this relative warm bias can be attributed to the RSR differences between the two sensors and results to the effect have been previously reported in [7]. The RSR curves for the matching TEB for MODIS and VIIRS are shown in Figure 8. It is observed that indeed the RSR differences are bound to affect the various bands, probably minimal in the case of M14 and band 29. The RSR curves are very similar and hence expected to show the least impact for this band. Despite the fact that the RSRs are close for the M14 band the mean relative bias between the two instruments is quite significant. This implies that only a small factor would be accounted for if the RSR shifts were corrected. The remaining bias does point to the inadequacy of the calibration model of S-VIIRS. The impacts of spectral correction for the RSR differences using measured simultaneous hyper-spectral data from A-Atmospheric Infrared Sounder (AIRS) for M15/B31 and M16 B32 are described in [23]. The RSR correction factor is derived as a radiance ratio between S-VIIRS and A-MODIS theoretical values, derived from RSR integration using AIRS hyper-spectral data. Results from the work reported in [23] indicate that the RSR correction reduces the differences by approximately 0.10 K and 0.29 K for M15/B31 and M16/B32 respectively. For M14/B29, since there is not enough spectral coverage for both A-AIRS and S-Cross track Infrared Sounder (CrIS), there is no RSR factor derived for this band. However, it should be noted that Infrared Atmospheric Sounding Interferometer (IASI) would provide contiguous spectral coverage over the difficult M14/B29.
In terms of the drift in the relative bias over 3.5 years, it is assessed to be significantly small for most bands with the exception of band M13/B22. The largest drift is observed to be about 0.163 K for band M13. Results for all bands have been summarized in Table 2. Further, it is noted that drift in all the matching TEB are well within the noise requirements given in terms of Noise Equivalent Temperature difference (NEdT) of both instruments [6].
Based on the results shown in Figure 6 and Figure 7, it is suggestive a small cold scene retrieval bias in S-VIIRS TEB. In the current Collection 6 for T-MODIS the offset calibration term is set to zero whereas A-MODIS uses the pre-launch/on-orbit based non-zero coefficients [24]. Similar to the current study, T-MODIS suffered from the warm bias in the cold scene retrievals in comparison to A-MODIS. Though on different orbits, and the Dome C acquisition times not being as close to A-MODIS and S-VIIRS, the relative bias study was extended, comparing S-VIIRS and T-MODIS. Since the path radiance may be considerably different for the two sensor acquisitions, only the surface sensing bands are used in the discussion. Figure 9 shows the relative bias trends between S-VIIRS and T-MODIS for M15/Band 31, M16/Band 32, and M14/Band 29, respectively. Figure 9 also provides similar fit statistics as illustrated in the results shown in Figure 7. From these two figures the following observations are made. First, the mean relative biases between S-VIIRS and T-MODIS for the three surface bands are smaller in comparison to the mean relative bias between S-VIIRS and A-MODIS, but still positive in sign. The differences in the mean relative biases between (A-MODIS~S-VIIRS) and (T-MODIS~S-VIIRS) instruments are approximately 0.63 K, 0.29 K, and 0.23 K, respectively, for the M14, M15 and M16 bands.
A similar cold scene bias in S-VIIRS TEB has been reported in a different study that comprised of early mission inter comparison of S-VIIRS with Cross-track Infrared Sounder (CrIS) and S-VIIRS with the IASI [25].The RSR differences between MODIS and VIIRS are also expected to impact the differences seen in the relative bias estimates though at a very small magnitude. Overall, over the first 3.5 years of the mission both A-MODIS and S-VIIRS TEB performance are very stable and consistent. Improvements suggested here are very useful in future reprocessing of the science data records of S-VIIRS should tie the two sensors on an even keel.

5. Conclusions

Earth-observing remote sensing instruments such as MODIS and VIIRS are critical for global monitoring of the various geophysical retrievals that shape the Earth’s Climate. Further, given the legacy of the MODIS instruments, S-VIIRS becomes a key bridge to ensuring long term continuity of the climate data records. With such high requirements on the radiometric fidelity for both instruments, we have tried to assess the radiometric consistency and stability using well characterized EV target “Dome C”. An AWS is used as a stable proxy to assess the 3.5 year on-orbit performance of S-VIIRS, and perform an inter comparison of S-VIIRS and A-MODIS using a previously established methodology for the 2 MODIS instruments [8]. In general, S-VIIRS TEBs performance is very similar to A-MODIS. Statistically, no significant temporal drift in the relative bias measurements for the two instruments is observed. The temporal drift in relative bias over 3.5 years of performance is assessed to be within ±0.08 K with the exception of the M13 band of S-VIIRS. A small warm bias is noted in the cold scene retrieval for all the 5M- bands of S-VIIRS suggesting an offset impact in the S-VIIRS TEB calibration model. The relative bias comparisons between S-VIIRS and T-MODIS provided evidence the deficiency could reside in the offset calibration term in the VIIRS TEB model. In summary, the TEB performance for both S-VIIRS and A-MODIS based on the BB as a calibrator source has been found to be within design requirements.

Acknowledgments

The authors would like to thank all current (in particular Andrew Wald for proof reading the article) and past members of the MCST and VIIRS Characterization Support Team (VCST) for their many and varied contributions over the years.

Author Contributions

Sriharsha Madhavan was responsible in writing the manuscript. Jake Brinkmann provided the dataset and comphrensive analysis for this work. Brian Wenny was chief investigator for the relative bias efforts in the previous work using MODIS instruments. His insights were quite useful for this work. Aisheng Wu provided support in extending the work to VIIRS. Funding for this research was provided through NASA contract NNG15HQ01C, as represented by Xiaoxiong Xiong.

Conflicts of Interest

The authors declare no conflict of interest.

References

  1. Xiong, X.; Butler, J.; Chiang, K.; Efremova, B.; Fulbright, J.; Lei, N.; McIntire, J.; Oudrari, H.; Sun, J.; Wang, Z.; Wu, A. VIIRS on-orbit calibration methodology and performance. J. Geophys. Res. Atmos. 2014, 119, 5065–5078. [Google Scholar] [CrossRef]
  2. Xiong, X.; Chiang, K.; Esposito, J.; Guenther, B.; Barnes, W. MODIS on-orbit calibration and characterization. Metrologia 2003, 40, 89–92. [Google Scholar] [CrossRef]
  3. Turpie, K.R.; Robinson, W.D.; Franz, B.A.; Eplee, R.E.; Meister, G.; Fireman, G.F.; Patt, F.S.; Barnes, R.A.; McClain, C.R. Suomi NPP VIIRS ocean color data product early mission assessment. SPIE Proc. 2012, 8510. [Google Scholar] [CrossRef]
  4. Justice, C.O.; Romàn, M.O.; Csiszar, I.; Vermote, E.F.; Wolfe, R.E.; Hook, S.J.; Friedl, M.; Wang, Z.; Schaaf, C.B.; Miura, T.; et al. Land and cryosphere products from Suomi VIIRS: Overview and status. J. Geophys. Res. Atoms. 2013, 118, 9753–9765. [Google Scholar] [CrossRef] [PubMed]
  5. Liu, H.; Remer, L.A.; Huang, J.; Huang, H.-C.; Kondragunta, S.; Laszlo, I.; Oo, M.; Jackson, J.M. Preliminary evaluation of S-NPP VIIRS aerosol optical thickness. J. Geophys. Res. Atoms. 2013, 119, 3942–3962. [Google Scholar] [CrossRef]
  6. Xiong, X.; Butler, J.; Wu, A.; Chiang, V.; Efremova, B.; Madhavan, S.; Mcintire, J.; Oudrari, H. Comparison of MODIS and VIIRS onboard blackbody performance. SPIE Proc. 2012, 8533. [Google Scholar] [CrossRef]
  7. Efremova, B.; Wu, A.; Xiong, X. Relative spectral response corrected calibration inter-comparison of S-NPP VIIRS and Aqua MODIS thermal emissive bands. SPIE Proc. 2014, 9218. [Google Scholar] [CrossRef]
  8. Wenny, B.N.; Xiong, X. Using a Cold Earth Surface Target to Characterize Long-term Stability of the MODIS Thermal Emissive Bands. IEEE Geosci. Remote Sens. Lett. 2008, 5, 162–165. [Google Scholar] [CrossRef]
  9. Wenny, B.N.; Xiong, X.; Madhavan, S.; Wu, A.; Li, Y. Long-term band-to-band calibration stability of MODIS thermal emissive bands. SPIE Proc. 2013, 8724. [Google Scholar] [CrossRef]
  10. Wenny, B.N.; Xiong, X.; Madhavan, S. Evaluation of Terra and Aqua MODIS thermal emissive band calibration consistency. SPIE Proc. 2012, 8533. [Google Scholar] [CrossRef]
  11. Xiong, X.; Wu, A.; Wenny, B.N.; Madhavan, S.; Wang, Z.; Li, Y.; Chen, N.; Barnes, W.; Salomonson, V. Terra and Aqua MODIS thermal emissive bands on-orbit calibration and performance. IEEE Trans. Geosci. Remote Sens. 2015, 53, 5709–5721. [Google Scholar] [CrossRef]
  12. Efremova, B.; McIntire, J.; Moyer, D.; Wu, A.; Xiong, X. S-NPP VIIRS thermal emissive bands on-orbit calibration and performance. J. Geophys. Res. Atmos. 2014, 119, 10859–10875. [Google Scholar] [CrossRef]
  13. Hook, S.J.; Clodius, W.B.; Balick, L.; Alley, R.E.; Abtahi, A.; Richards, R.C.; Schladow, S.G. In-Flight validation of mid- and thermal infrared data from the Multispectral Thermal Imager (MTI) using an automated high-altitude validation site at Lake Tahoe CA/NV, USA. IEEE Trans. Geosci. Remote Sens. 2005, 43, 1991–1999. [Google Scholar] [CrossRef]
  14. Barsi, J.A.; Schott, J.R.; Hook, S.J.; Raqueno, N.G.; Markham, B.L.; Radocinski, R.G. Landsat-8 Thermal Infrared Sensor (TIRS) vicarious radiometric calibration. Remote Sens. 2014, 6, 11607–11626. [Google Scholar] [CrossRef]
  15. Cao, C.; Uprety, S.; Xiong, X.; Wu, A.; Jing, P.; Smith, D.; Chander, G.; Fox, N.; Ungar, S. Establishing the antarctic Dome C community reference standard site towards consistent measurements from earth observation satellites. Can. J. Remote Sens. 2010, 36, 498–513. [Google Scholar] [CrossRef]
  16. Xiong, X.; Wu, A.; Wenny, B. Using Dome C for MODIS Calibration Stability and Consistency. J. Appl. Remote Sens. 2009, 3, 033520. [Google Scholar]
  17. Wu, A.; Xiong, X.; Cao, C. Tracking the calibration stability and consistency of the 3.7, 11.0 and 12.0 micron channels of the NOAA-KLM AVHRR with MODIS. Int. J. Remote Sens. 2009, 30, 5901–5917. [Google Scholar] [CrossRef]
  18. Walden, V.P.; Roth, W.L.; Stone, R.S.; Halter, B. Radiometric validation of the atmospheric infrared sounder over the Antarctic plateau. J. Geophys. Res. Atoms. 2006, 111. D09 S03. [Google Scholar]
  19. Weidner, G.; Thom, J.; Lazzara, M. Legacy calibration of the Automatic Weather Station Model 2 of the United States Antarctic Program (A primer). In Proceedings of the 8th Antarctic Meteorological Observation, Modeling, and Forecasting Workshop, Madison, WI, USA, 10–12 June 2013.
  20. Ackerman, S.; Strabala, K.; Menzel, W.; Frey, R.; Moeller, C.; Gumley, L. Discriminating clear sky from clouds with MODIS. J. Geophys. Res. Atoms. 1998, 103, 32141–32157. [Google Scholar] [CrossRef]
  21. Level 1 and Atmosphere Archive and Distribution System (LAADS). Available online: https://ladsweb.nascom.nasa.gov/data/search.html (accessed on 6 August 2015).
  22. AMRC/AWS FTP Data Server. Available online: ftp://amrc.ssec.wisc.edu/pub/aws/ (accessed on 29 June 2015).
  23. Li, Y.; Wu, A.; Xiong, X. Inter-comparison of S-NPP VIIRS and Aqua MODIS thermal emissive bands using hyperspectral infrared sounder measurements as a transfer reference. Remote Sens. 2016, 8. [Google Scholar] [CrossRef]
  24. Wenny, B.N.; Wu, A.; Madhavan, S.; Wang, Z.; Li, Y.; Chen, N.; Chiang, V.; Xiong, X. MODIS TEB calibration approach in collection 6. SPIE Proc. 2012, 8533. [Google Scholar] [CrossRef]
  25. Moeller, C.; Tobin, D.; Quinn, G. S-NPP VIIRS thermal band spectral radiance performance through 18 months of operation on-orbit. SPIE Proc. 2013, 8866. [Google Scholar] [CrossRef]
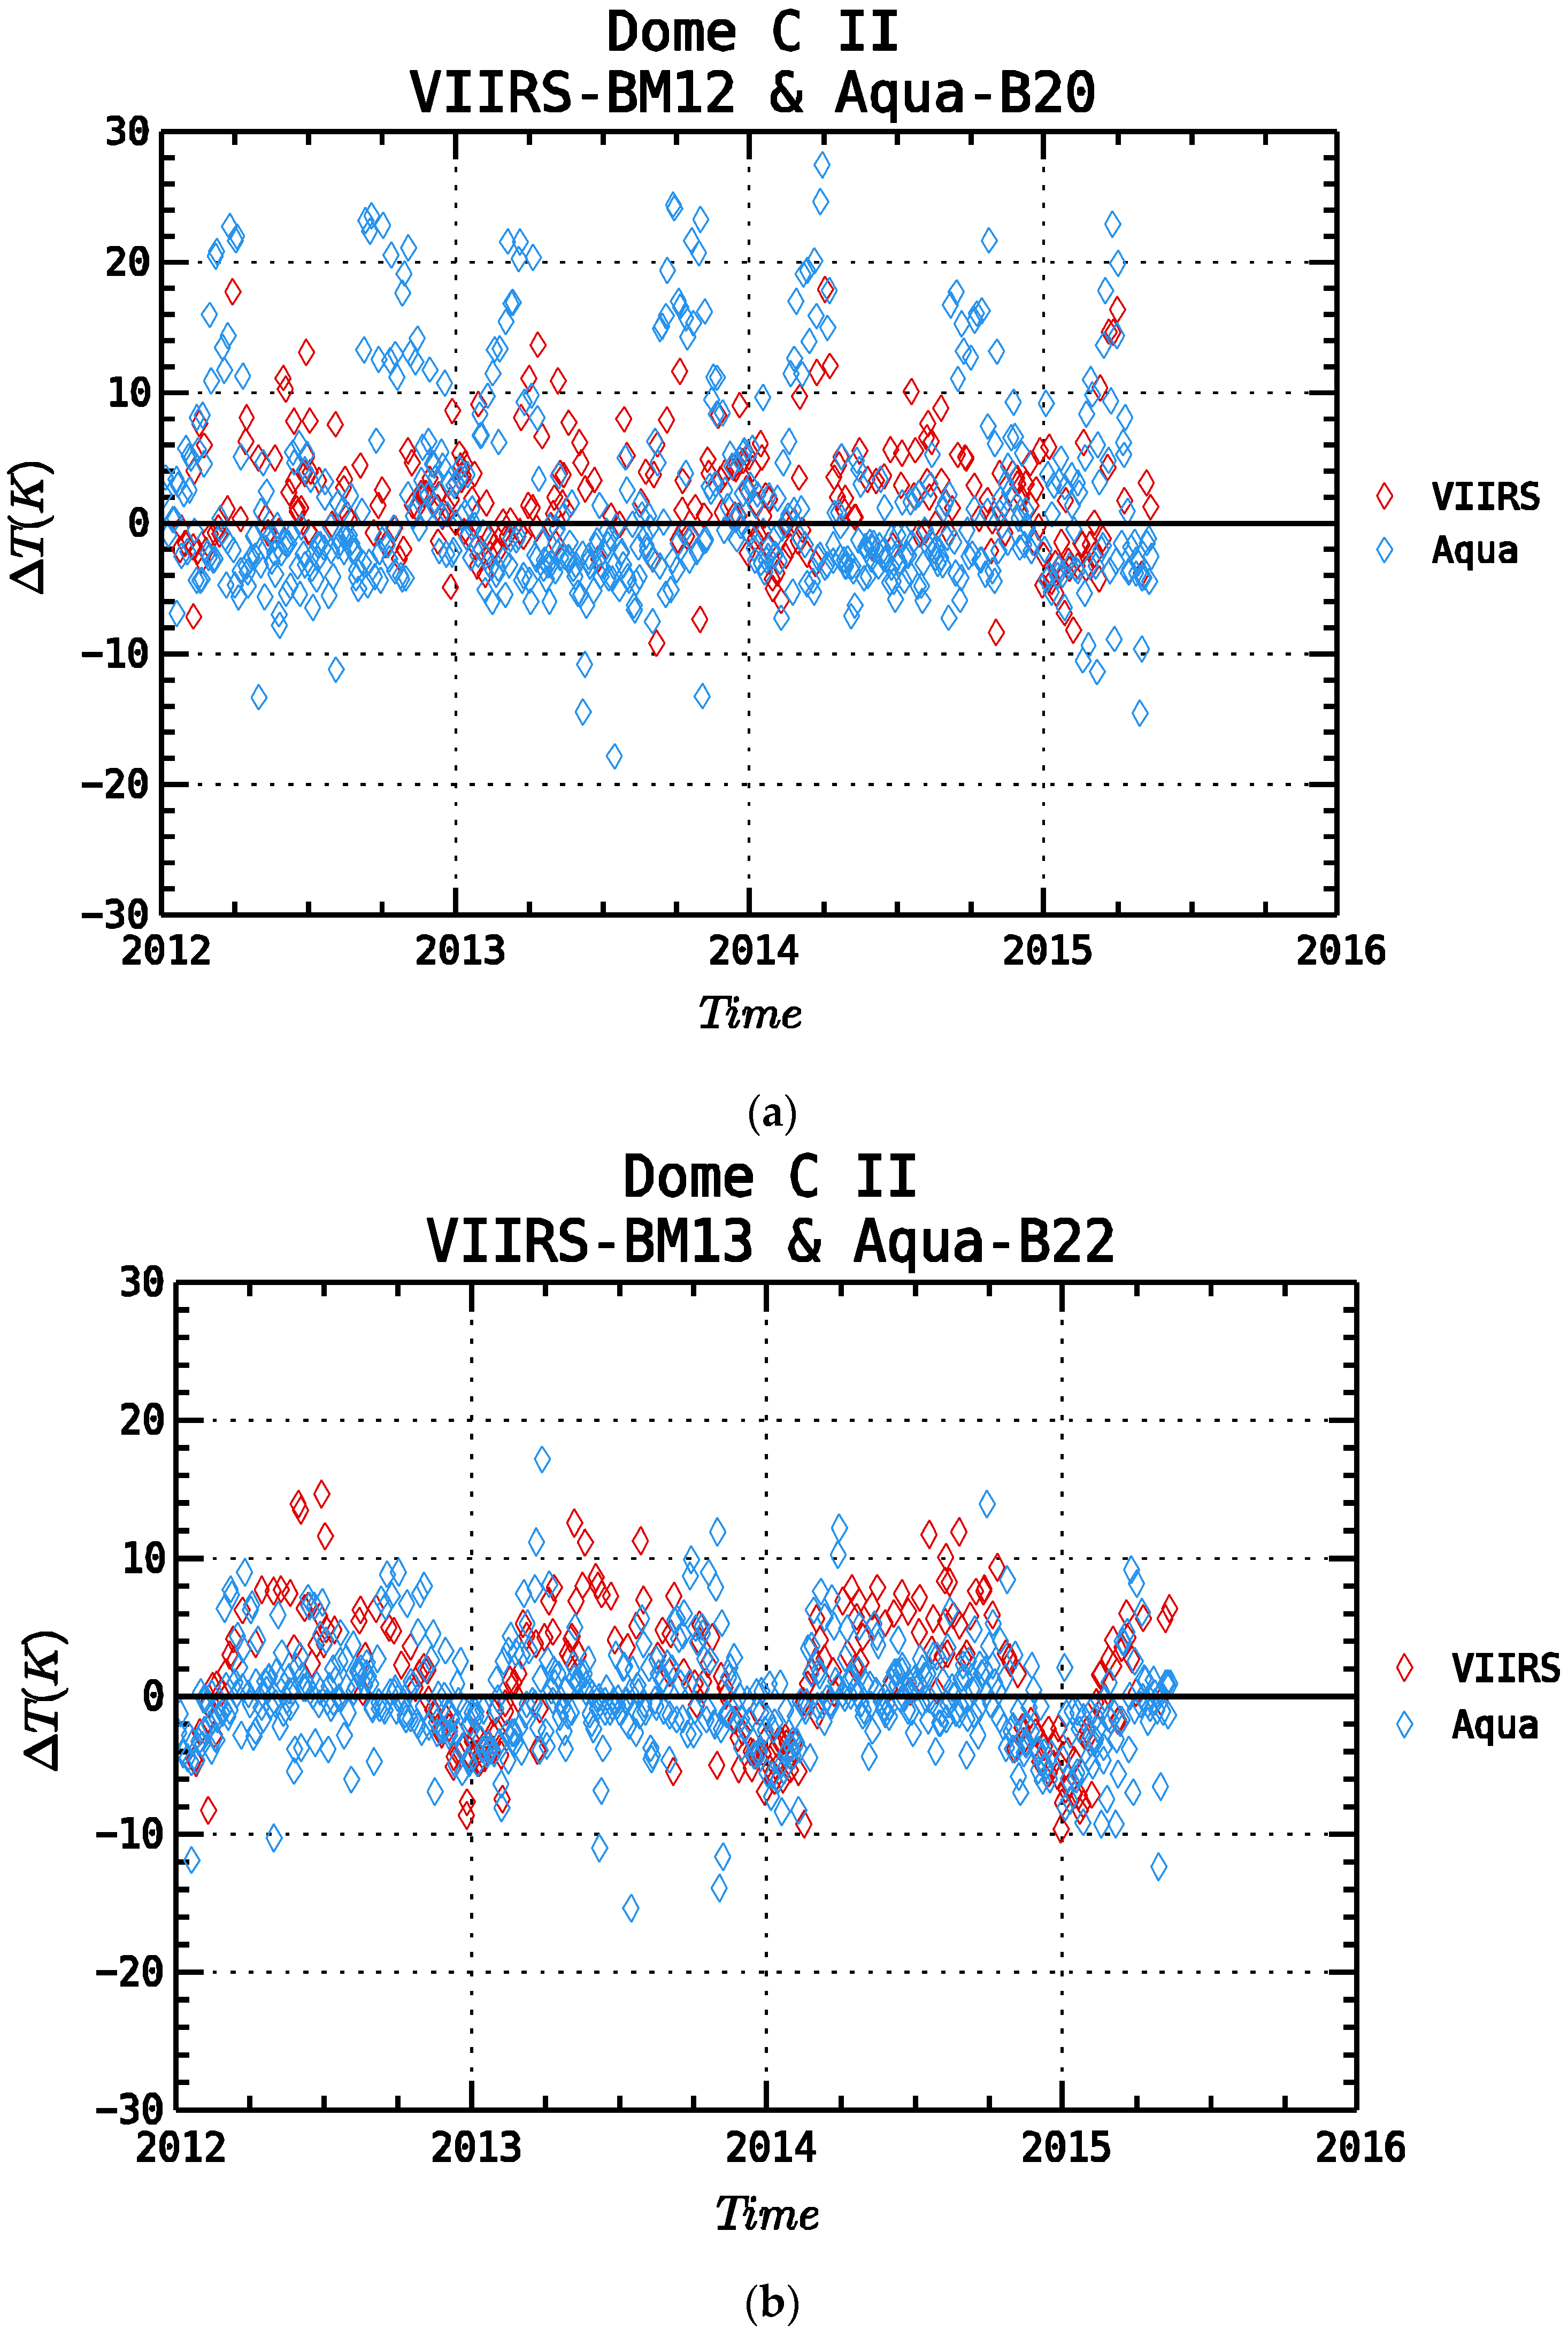
Figure 1. Instrument setup with on-board calibrators (a) MODIS; (b) VIIRS [1,2].
Remotesensing 08 00158 g001
Figure 2. V-grooved BlackBody controlled using various thermistors (a) MODIS; (b) VIIRS [6].
Remotesensing 08 00158 g002
Figure 3. Relative Spectral Response of the VIIRS TEBs overlaid with spectral radiance of the BlackBody at 290 K [7].
Remotesensing 08 00158 g003
Figure 4. S-VIIRS Band M15 image illustrating the Antarctic EV location comprising the Dome C site.
Remotesensing 08 00158 g004
Figure 5. Lifetime temperature observations over Dome C using AWS, T- and A- MODIS band 31.
Remotesensing 08 00158 g005
Figure 6. Long term Brightness Temperature difference trends (Sensor-AWS) (a) M12/B20; (b) M13/B22; (c) M14/B29; (d) M15/B31; (e) M16/B32.
Remotesensing 08 00158 g006aRemotesensing 08 00158 g006bRemotesensing 08 00158 g006c
Figure 7. The 3.5-year relative bias trend between S-VIIRS and A-MODIS. (a) M12/B20; (b) M13/B22; (c) M14/B29; (d) M15/B31; (e) M16/B32.
Remotesensing 08 00158 g007aRemotesensing 08 00158 g007bRemotesensing 08 00158 g007c
Figure 8. RSR Curves for matching TEB for VIIRS and MODIS.
Remotesensing 08 00158 g008
Figure 9. Relative bias trends between S-VIIRS and T-MODIS. (a) M15/B31; (b) M16/B32; (c) M14/B29.
Remotesensing 08 00158 g009aRemotesensing 08 00158 g009b
Table 1. VIIRS and MODIS matching TEBs [7].
VIIRS Band (C.W. (µm))I4 (3.74) I5 (11.45) M12 (3.70) M13 (4.05) M14 (8.55) M15 (10.76) M16 (12.01)
MODIS Band (C.W. (µm))B20 (3.78)B31 (11.03) B32 (12.04) B20 (3.78) B22 (3.96)B29 (8.56) B31 (11.03) B32 (12.04)
Table 2. Relative Bias drift [K/3.5 years] between S-VIIRS and A-MODIS.
VIIRS/MODIS Matching Band M12/B20 M13/B22 M14/B29 M15/B31 M16/B32
∆T Relative Bias (K) *0.0190.163−0.0760.030−0.003
* p-value (shown previously) indicates statistically insignificant for the relative bias drift.

