Article

Mapping Wetlands in Zambia Using Seasonal Backscatter Signatures Derived from ENVISAT ASAR Time Series

1
Department of Geodesy and Geoinformation, Vienna University of Technology, Gusshausstr. 27–29, 1040 Vienna, Austria
2
Luxembourg Institute of Science and Technology (LIST), 41, Rue du Brill, 4367 Belvaux, Luxembourg
3
Deutsches Geodätisches Forschungsinstitut der Technischen Universität München, Arcisstr. 21, 80333 Munich, Germany
*
Author to whom correspondence should be addressed.
Current address: Luxembourg Institute of Science and Technology (LIST), 41, rue du Brill, 4367 Belvaux, Luxembourg
Remote Sens. 2016, 8(5), 402; https://doi.org/10.3390/rs8050402
Submission received: 3 March 2016 / Revised: 18 April 2016 / Accepted: 21 April 2016 / Published: 12 May 2016
(This article belongs to the Special Issue What can Remote Sensing Do for the Conservation of Wetlands?)

Abstract

:
Wetlands are considered a challenging environment for mapping approaches based on Synthetic Aperture Radar (SAR) data due to their often complex internal structures and the diverse backscattering mechanisms caused by vegetation, soil moisture and flood dynamics contributing to the resulting imagery. In this study, a time series of >100 SAR images acquired by ENVISAT during a time period of ca. two years over the Kafue River basin in Zambia was compared to water heights derived from radar altimetry and surface soil moisture from a reanalysis dataset. The backscatter time series were analyzed using a harmonic model to characterize the seasonality in C-band backscatter caused by the interaction of flood and soil moisture dynamics. As a result, characteristic seasonal signatures could be derived for permanent water bodies, seasonal open water, persistently flooded vegetation and seasonally flooded vegetation. Furthermore, the analysis showed that the influence of local incidence angle could be accounted for by a linear shift in backscatter averaged over time, even in wetland areas where the dominant scattering mechanism can change depending on the season. The retrieved harmonic model parameters were then used in an unsupervised classification to detect wetland backscattering classes at the regional scale. A total area of 7800 km2 corresponding to 7.6% of the study area was classified as either one of the wetland backscattering classes. The results demonstrate the value of seasonality parameters extracted from C-band SAR time series for wetland mapping.

Graphical Abstract

1. Introduction

Wetlands are of significant importance for hydrological and ecological processes. They constitute vital habitats for specialized flora and fauna and contribute to the livelihoods of the local human population. Within the hydrological cycle, they behave as water storage, thereby alleviating extreme events like floods and droughts. They also play a vital role in biogeochemical cycles, acting both as sources and sinks of carbon and nitrogen emissions. However, wetlands are vulnerable to threats like climate change, land-use conversion—mainly to agricultural areas—and construction of reservoirs [1]. Recent studies have reported a decrease of about 40% in the area covered by wetlands at the global level, albeit strongly varying between regions [2]. In Sub-Saharan Africa, wetlands cover ca. 9% of the landmass. Since the second half of the 20th century, wetlands there have come under increasing pressure due to the construction of dams for the production of hydroelectricity. The function of the Zambezi River Delta as a natural ecosystem, for example, has been heavily altered after the construction of the Kariba and Cahora Bassa Dams [3]. In other cases, efforts have been made to restore environmental flows by adapting dam operations. For example, the Kafue Flats in Zambia are now largely dependent on the operation of dams for annual flooding during the wet season [4]. Due to the high vulnerability of wetlands to the aforementioned factors there is a strong need for monitoring their current state and projecting future trends [2].
In many regions of the world, wetlands can only be monitored using earth observation technology, either due to their remoteness or their vast size. In general, both optical and microwave sensors are suitable for this purpose, each with their own advantages and disadvantages [5]. For global monitoring purposes, multi-sensor fusion techniques have yielded reliable results, like in the case of the Global Inundation Extent from Multi-Satellites (GIEMS) product providing monthly surface inundation extent at a spatial resolution of ca. 25 × 25 km 2 based on data from passive and active microwave as well as optical sensors [6]. For more detailed regional and local assessments, Synthetic Aperture Radars (SAR) are an appropriate source of information: they are largely unaffected by cloud cover, offer a moderate to high spatial resolution and are very sensitive to the presence of surface water and—under certain circumstances—even to water underneath vegetation [7]. Since wetlands are often formed as a complex mosaic of different vegetation types and hydraulic conditions a variety of scattering mechanisms can contribute to the signal measured by the sensor. In combination with different sensor configurations in terms of frequency, polarization and observation geometry this often leads to very diverse backscatter signatures in wetlands. In the most straightforward case, calm open water surfaces act as specular reflectors, which cause water bodies to be represented as dark objects in SAR imagery. Wind and heavy rainfall, on the other hand, often roughen the water surface and complicate the retrieval [8]. If flooding occurs below vegetation, the signal is reflected between the water surface and the trunks and stems of vegetation emerging from the water surface. This so-called “double-bounce” scattering usually results in very high values of the backscatter coefficient σ 0 . Nevertheless, depending on the density and structure of the vegetation, the energy can be attenuated by the canopy to a substantial degree, especially at higher incidence angles. Apart from vegetation structure and density, this attenuation mostly depends on polarization, frequency and local incidence angle [9]. Compared to vertically polarized waves, horizontally polarized waves interact less with vertical vegetation structures and are therefore considered better suited for the purpose of mapping flooded vegetation [10]. Moreover, the use of smaller local incidence angles reduces the distance incident radiation has to travel through the canopy, in general leading to a higher amount of energy received by the sensor [11]. Attenuation by the vegetation also decreases with longer wavelengths like L-band [9], which is why a considerable number of studies has been carried out using data acquired at that wavelength e.g., [12,13,14,15,16]. It should be noted that we consider only techniques for single-polarized data here although, more recently, specialized algorithms for wetland detection from polarimetric SAR data have become available e.g., [17,18,19].
A prominent example of the application of L-band SAR data for wetland mapping is the exercise undertaken by Hess et al. [12] who discriminated different sparsely and densely vegetated wetland types in a large part of the central Amazon basin using mosaics of scenes acquired by the Japan Earth Resource Satellite (JERS-1) during low and high water stages. They concluded that 17% of the study area of 1.77 million km 2 were covered by one of the mapped wetland types. The study also highlighted the importance of seasonality in wetland water stage as it influences which of the aforementioned scattering mechanisms—specular reflection, volume scattering or double-bounce scattering—is dominant. At low water stages, stems may be protruding through the surface while they may be completely submerged during the flood peak. Yuan et al. [14] used multi-temporal SAR acquisitions and water heights estimated from radar altimeter data to infer sensitivity of L-band backscatter towards changes in flood water level. The increase in σ 0 with rising water level was significantly lower in areas which were characterized by a high amount of woody vegetation.
Despite the fact that L-band data are seen as the most suited wavelength for studies related to surface water and wetlands encouraging results have also been obtained using C-band data [20,21,22,23] especially where herbaceous vegetation is dominant [10], or even using X-band interferometric SAR (InSAR) in the case of flooded vineyards [24]. For example, in a study on coastal wetlands, L-band, HH-polarized data was found to be best suited for monitoring water levels using InSAR techniques but good results could also be obtained using C-band depending on the growth stage of the vegetation [15]. Kasischke et al. [20] reported an evident decrease of C-band backscatter with increasing water levels at sites with low to moderate vegetation cover such as prairie and woodland whereas in non-flooded areas there was a positive correlation with in-situ soil moisture.
Past studies have also suggested that information aggregated from multi-temporal data can help to compensate some of the shortcomings of C-band data for wetland mapping as observations are made at different stages of water level and vegetation growth. Indicators extracted from multi-temporal ENVISAT Advanced SAR (ASAR) data were used by Reschke et al. [22] to map peatlands and maximum inundation extent over Northern Eurasia. In this case, statistical estimates of high and low backscatter for the spring and summer seasons were used as inputs to a decision tree classifier. Areas with high maximum backscatter were assumed to be associated with saturated soil. On the other hand, the maximum annual inundation extent, which is typically reached after snowmelt in spring, could be related to the lower quantiles of the per-pixel backscatter time series. For mapping permanent open water, Santoro and Wegmüller [25] extracted statistics from ASAR time series and applied threshold classifiers to extract permanent water masks. High accuracy values could be achieved for pure pixels using minimum backscatter and variance over time as indicators. However, minimum backscatter was not robust to confounding factors such as temporary flooding and wet snow so that a low percentile of the time series histograms was used instead. When applying the approach at the global scale, a simple two-metric approach was found to be problematic, e.g., in regions where strong seasonal variations in surface water extent occurred [26].
The approaches by Reschke et al. [22] and Santoro and Wegmüller [25] have in common that they rely on seasonal or global time series statistics to estimate the backscatter signatures for each pixel of a multi-temporal image stack without explicitly accounting for periodic cycles in σ 0 induced by dynamic environmental variables like soil moisture, vegetation density and inundation extent. More objective methodologies to explicitly characterize seasonality in satellite-derived time series have been explored mainly in the field of optical remote sensing, typically in order to derive land surface phenology from parameters such as the Normalized Vegetation Difference Index (NDVI) e.g., [27,28,29]. Recently, Schlaffer et al. [30] applied harmonic analysis to detect flood events in multi-temporal ASAR time series as deviations from backscattering behavior under non-flooded conditions. In this context, a 3rd-order harmonic model efficiently reproduced the seasonal patterns encountered in the backscatter time series from non-flooded land surfaces. Such an approach should also be suitable for modeling seasonal backscatter patterns caused by vegetation, soil moisture and inundation dynamics in a wetland, especially if a strong seasonality in the climatic forcing is present. One of the advantages of a harmonic model is that the majority of the annual variability in a time series can be explained by only a few terms [27] and therefore it should be more suitable than using descriptive statistics for characterizing seasonality.
The goal of the presented study is to assess the potential of harmonic analysis for reproducing ASAR backscatter seasonality in a tropical wetland. For this purpose, ASAR time series are compared to water heights derived from radar altimeter and soil moisture output from a land-surface model. Then, the suitability of the derived time series parameters for discriminating between different wetland types such as permanent water, seasonally flooded areas and inundated vegetation is investigated using cluster analysis. The paper is structured as follows: in Section 2, the study area, the available data and the methodology used for data analysis and wetland mapping are described. The suitability of the area of interest as a test bed for this assessment is justified. The obtained results are reported and discussed in Section 3. Finally, Section 4 concludes the study.

2. Material and Methods

2.1. Study Area

The Kafue River basin is located in Northern Zambia and covers an area of ca. 155,000 km 2 (Figure 1a). Three large wetlands are located within the basin: the Lukanga Swamps and the Kafue Flats in Zambia’s Central Province and the Busanga Swamps in Northwestern Province (Figure 1c). All three of them are listed as wetlands of international importance by the Ramsar Organization [31]. Elevation of the study area ranges between ca. 1000 m and 1300 m whereas downstream of the Kafue Flats terrain height drops significantly (Figure 1b). Annual rainfall decreases from 1400 mm in the Northern part of the basin, where most of the runoff of the Kafue River is produced, to ca. 800 mm in the south. The climate is characterized by a pronounced rainy season which lasts approximately from October to April (Figure 2). October is, therefore, regarded as the start of the hydrological year in the region [32].
The Kafue Flats are situated downstream of the Itezhi-Tezhi Dam, which took up operations in 1977 [33]. They span a length of ca. 250 km along the river and are about 60 km wide. The area undergoes annual flooding which, approximately, starts in February and lasts until June. The hydrology of the Kafue Flats, which has been altered by the Itezhi-Tezhi Dam and the Kafue Gorge Dam further downstream, has been the subject of a series of studies in the past (e.g., [34,35,36]). Efforts have been made to restore the natural runoff regime by adapting dam operations [4] but especially dry-season discharge has been described as higher than what had been occurring before closure of the Itezhi-Tezhi Dam. In combination with backwater from the lower dam this has led to permanently inundated areas in downstream parts of the floodplain [34]. According to data from the Global Runoff Data Centre (GRDC), average dry-season runoff at Itezhi-Tezhi between August and November is around 200 m 3 ·s - 1 while the maximum monthly flow of ca. 600 m 3 ·s - 1 is reached in March (Figure 2). Land cover in the surroundings of the Kafue Flats consists mainly of cropland, however, also areas with tree cover are found at higher elevations according to the European Space Agency’s (ESA) Climate Change Initiative (CCI) Land-Cover dataset (Figure 1c) [37]. Information about vegetation within the wetland can be derived from optical imagery acquired at the end of the dry season which is largely cloud-free and whose reflectance values are not affected by flooding [38]. Figure 3 shows average NDVI for September from the Moderate Resolution Imaging Spectrometer (MODIS) on board Aqua (MYD13Q1 product). The Kafue Flats can easily be identified visually due to the higher NDVI in comparison to their surroundings where vegetation “greenness” is already very low during this part of the year. Areas with NDVI < 0 appear over open water bodies like the Itezhi-Tezhi reservoir west of the flats and the Chunga Lagoon in the Southern part of the image. Green vegetation is present mainly in the proximity of these water bodies and close to the river that crosses the wetland at its centre from West to East. Dense vegetation along the river has been described as consisting mainly of tall grasses that grow on levees formed along the river. The main part of the adjacent flat floodplain is covered by grassland [32]. A large number of irrigated fields are also visible as bright patches south-east of the Kafue Flats in Figure 3a).
Substantially less effort has been dedicated to studying the Lukanga Swamps which lie upstream of the two dams mentioned earlier. The swamp is located north of the Kafue Flats in a shallow depression covering about 1800 km 2 and is draining to the West to the Kafue River. Several tributaries contribute to the water balance of the swamp with the most important being the Lukanga River. The vast majority of the swamp consists of treeless marsh dominated by Phragmites and Typha as well as grasslands. In addition, ca. 5% of the area is covered by open water bodies. It has been estimated that about 60,000 people live in or close to the wetland who primarily use it for fishing, hunting, livestock and agriculture [39]. Dry-season NDVI can be seen to be substantially higher in the swamps and along the outlet to the Kafue River than in the surroundings (Figure 3b).
The long, persistent flooding of the wetlands along with the diverse mosaic of vegetation and open water make the area an interesting test bed for this study. While sparsely vegetated wetland soil should have a strong radar return due to elevated soil moisture levels, denser vegetation can be expected to show intermediate backscatter coefficients due to attenuation by the canopy. During flooding, signatures should become more distinct as specular reflection from open water surfaces leads to low σ 0 values while in flooded vegetation, double-bounce effects between the water surface and emerging vegetation parts lead to bright areas in the resulting SAR images.

2.2. Datasets and Pre-Processing

2.2.1. ENVISAT ASAR Wide Swath

Since seasonality in backscattering behavior plays an important role in tropical wetlands, a suitable remote sensing dataset should provide sampling intervals dense enough in order to be able to capture these seasonal variations. 108 scenes acquired in C-band by the ASAR sensor on board ENVISAT were available for the Kafue Flats (Figure 1c) for the time between October 2005 to September 2007 corresponding to two hydrological years. The images were acquired from a total number of 10 different swaths (see Figure S1 in Supplementary Material). For the entire study region the number of scenes amounted to 227. ASAR’s Wide Swath (WS) mode offered a moderate spatial resolution of 150 m and a large swath width of 400 km leading to overlaps between adjacent swaths and therefore an overall revisit time that was lower than the satellite’s repeat cycle of 35 days. All the images that were used here were acquired in HH polarization. Precise orbit state vectors were used to improve information about platform position [42]. The scenes were radiometrically calibrated and terrain-corrected using the Range-Doppler algorithm [43] with the help of elevation data from the Shuttle Radar Topography Mission (SRTM) with a resolution of 3 arc-seconds [40]. The images were then co-registered to a common grid definition with a pixel spacing of ca. 75 m at the Equator.
Due to the fact that the scenes were acquired using ScanSAR technology they cover a large swath width meaning that images of the same point on the ground have been acquired from different sensor positions leading to differences in viewing geometry. Local incidence angle θ has an important influence on σ 0 which is often corrected for using the linear relationship
σ 0 ( θ r e f ) = σ 0 ( θ ) - β ( θ - θ r e f )
where θ r e f is a reference local incidence angle (usually 30 to 40 ) and β = d σ 0 / d θ e.g., [44,45]. However, a central assumption to a time-invariant linear dependency is that the residual variance in σ 0 is caused mainly by variations in soil moisture [45]. This implies that no major change in scattering mechanism should take place during the observation period as this would affect the sensitivity of σ 0 towards changes in θ. For example, it has been reported that β is substantially steeper over open water than over land surfaces [46]. In a wetland, however, the assumption of β being time-invariant would not hold if a target area is flooded during substantial periods of the year so that the dominant scattering mechanism may change from bare-soil or volume scattering to specular reflection or double-bounce scattering and back. Seasonal variations in β caused by seasonality in vegetation coverage have been reported, e.g., for Southern Italy [47]. For this reason, we chose to carry out the analysis separately for different ranges of θ. Figure S1 in Supplementary Material shows θ averaged over the Kafue Flats (Figure 1c) for each scene. While it would have been preferable to analyse the data separately for each track the number of images available for each track would have been rather low. Therefore, the images were separated into different classes based on θ averaged over the Kafue Flats: 15 < θ 25 , 25 < θ 35 and 35 < θ 45 . The resulting average sampling interval in each of the θ classes was between 10 and 17 days. The sampling should therefore be dense enough to represent the underlying seasonality in the backscatter time series induced by rainfall and runoff.
Figure 4a,b show examples of pre-processed scenes acquired over the Kafue Flats along the same track at the end of the dry season and approximately at the time of peak flood extent, respectively. During the dry season, a few water bodies can be seen while in general the contrast between water and land is low. In March, however, large parts of the wetland are clearly recognizable as being flooded based on the very low σ 0 values encountered mainly along the borders of the Kafue Flats. Furthermore, the contrast between the wetland and its surroundings is enhanced due to high soil moisture values.

2.2.2. ENVISAT Radar Altimeter Water Heights

In order to investigate the relationship between SAR backscatter and water level as reported by e.g., Kasischke et al. [20] information on water stage is necessary. In many cases, however, water level measurements from in-situ gauges are sparse, especially in remote areas. In the case of the Kafue Flats, runoff measured at the outlet of the Itezhi-Tezhi Dam is available from GRDC only until 1991 and was therefore not suitable for direct comparison with ASAR σ 0 . Alternatively, satellite-based radar altimeters can provide high-accuracy water levels of inland water bodies such as lakes and rivers e.g., [48,49]. Altimeter data have also been used to infer wetland water heights and to relate their variations to changes in SAR backscatter intensity e.g., [15,50]. Although the altimeter footprint can measure up to several kilometers, the signal is highly sensitive to the occurrence of water within the footprint [51]. However, since satellite altimetry was designed for ocean applications, dedicated data processing for inland water is mandatory in order to extract reliable and highly accurate water levels from the observed radar returns.
The RA-2 radar altimeter on board ENVISAT provided accurate water level heights between 2002 and 2010. ENVISAT’s pass 85 crossed the Kafue Flats every 35 days along the same ground track (Figure 3a). The sampling rate of the altimeter was 18 Hz leading to an along-track sampling distance of ca. 374 m. Radar echoes (so-called waveforms) were extracted from the Sensor Geophysical Data Records and processed according to the methodology described by Schwatke et al. [52]. The approach is based on retracked waveforms and rigorous outlier detection and applies Kalman filtering to produce consistent and highly accurate water heights from data acquired along different tracks. The approach provides normal heights with respect to the EIGEN-6c3stat geoid [53]. Moreover, a time series for the Lukanga Swamps was computed based on data from ENVISAT tracks 543 and 156 (Figure 3b). The latter time series and its formal errors are freely available from the Database for Hydrological Time Series of Inland Waters (DAHITI) via http://www.dahiti.tum.de [52].

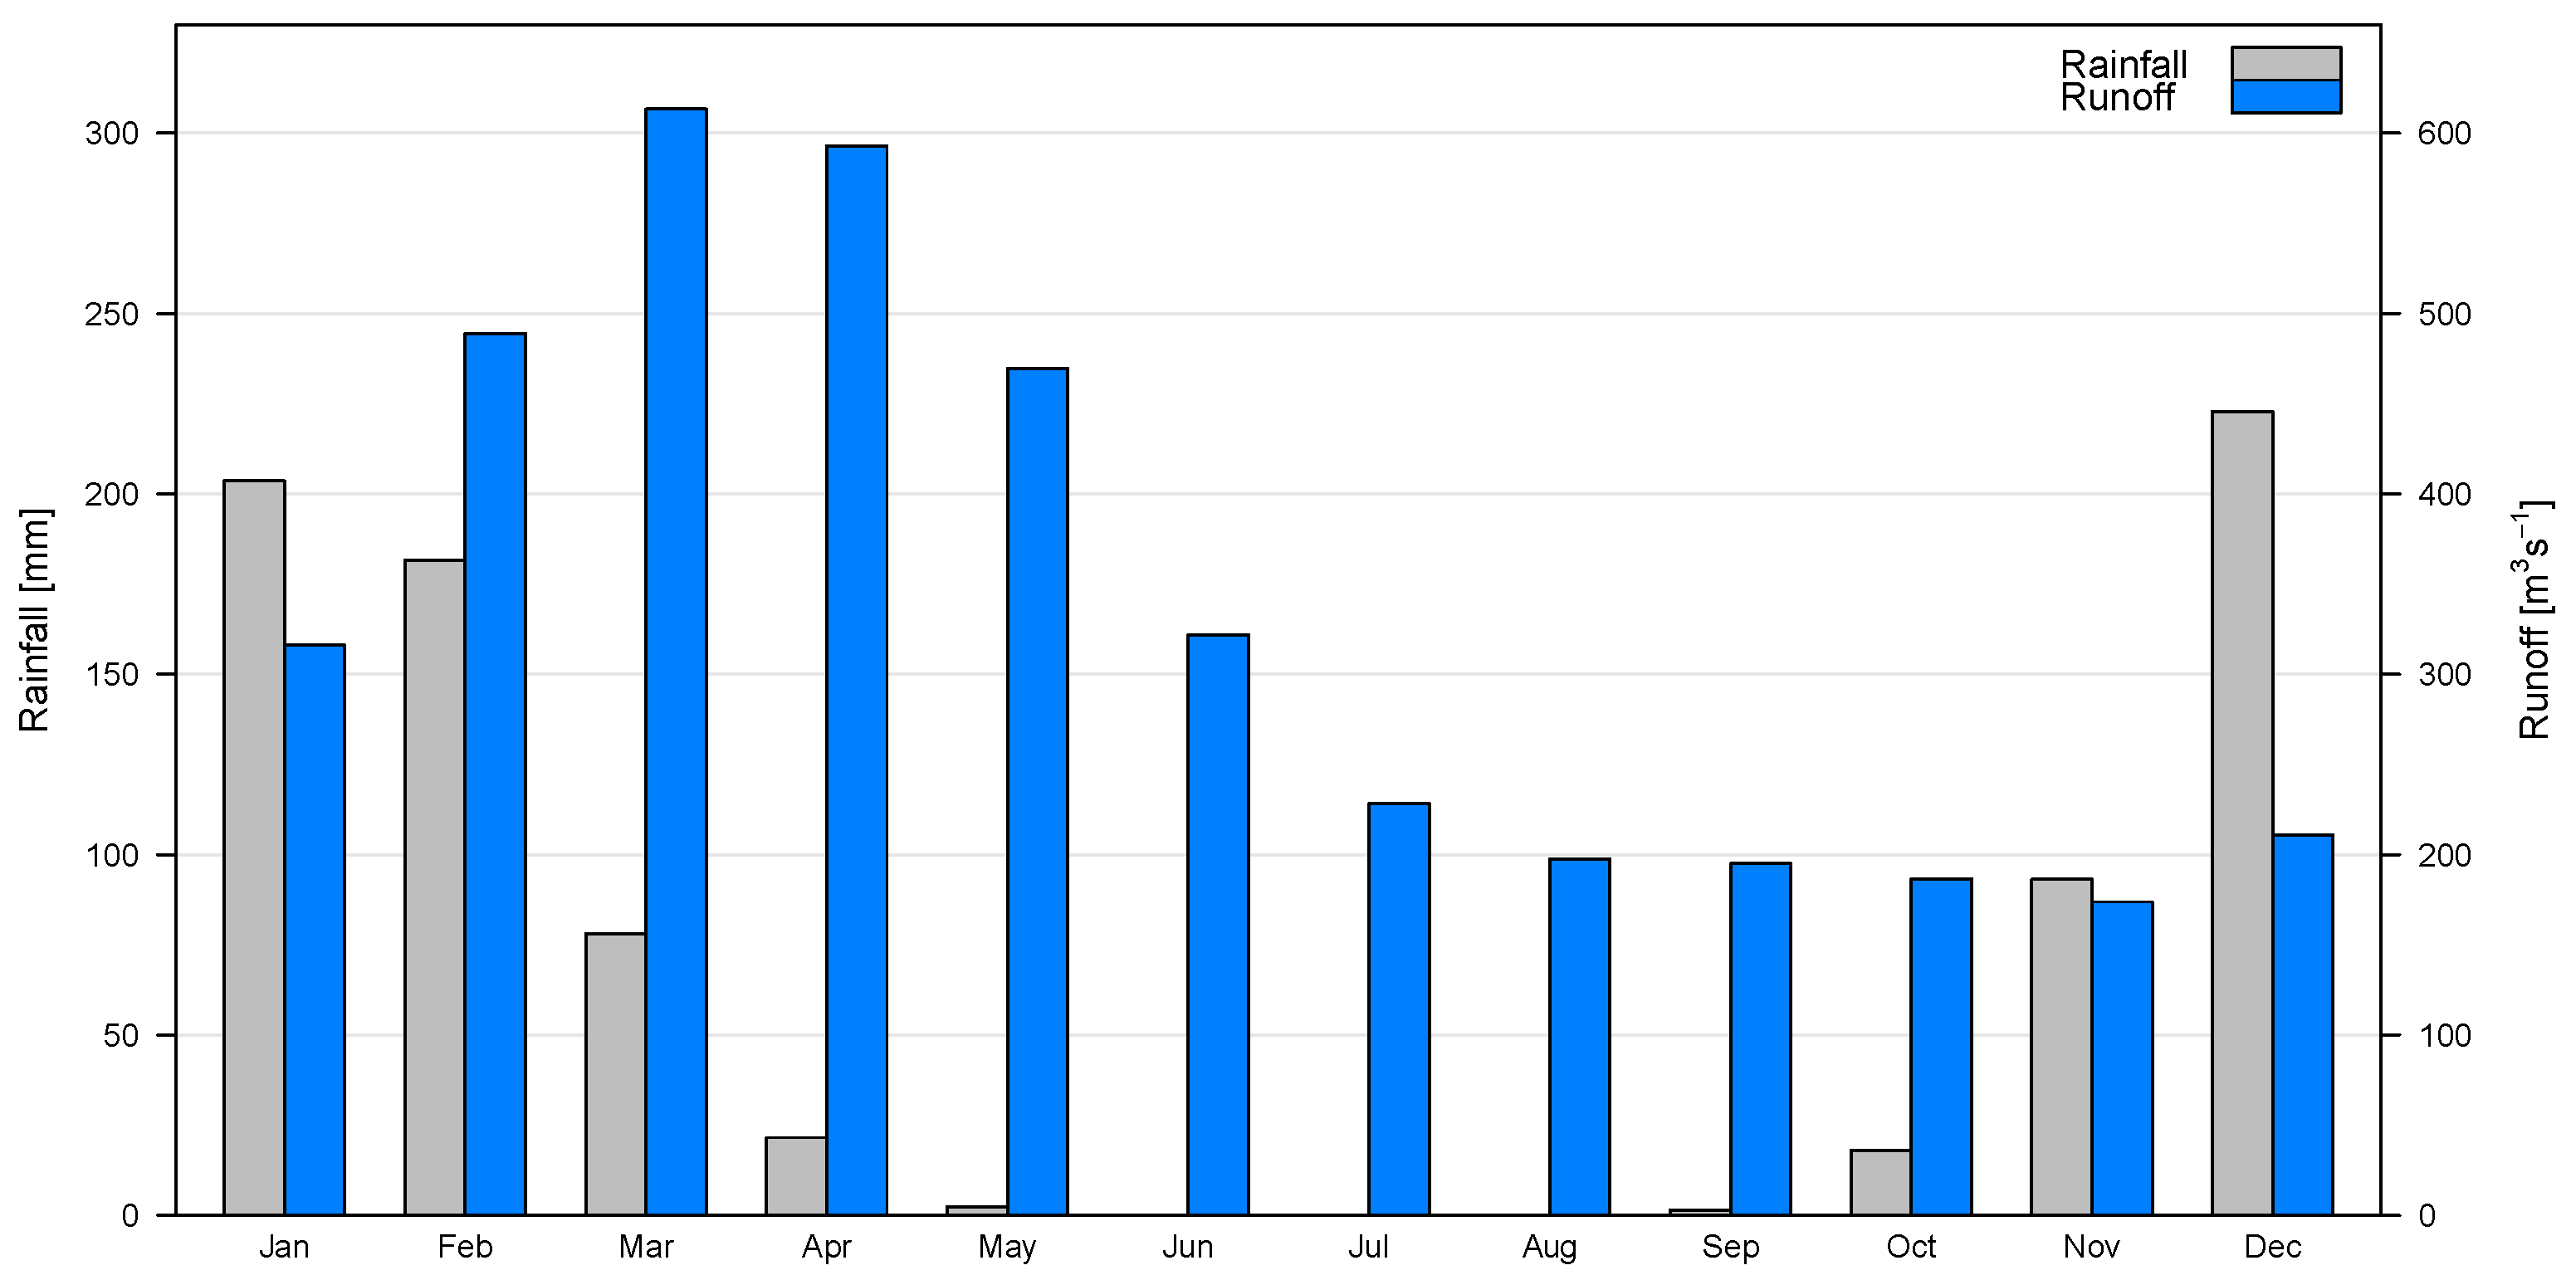
2.2.3. ERA-Interim/Land Volumetric Soil Water

Information on soil moisture dynamics in the study area are necessary in order to characterize the climatically induced seasonality in the backscatter signal. However, as there are no data from in-situ monitoring networks available and products from both passive and active microwave sensors are affected by the prolonged and extensive floods data from the ERA-Interim/Land reanalysis were used. The ERA-Interim/Land variables are produced at the European Centre for Medium-range Weather Forecasts (ECMWF) by forcing the HTESSEL land-surface model with ERA-Interim reanalysis fields [54]. The resulting volumetric soil water fields share the native resolution of the HTESSEL model of ca. 75 × 75 km 2 but versions downscaled to up to 0.125 are available on the website of ECMWF. Due to the low resolution of this product it does not represent the true soil moisture dynamics in the Kafue Flats but in this context it is used to get information about the likely start and end of the wet season.

2.3. Data Analysis

The ASAR σ 0 time series analysis was carried out in three steps: first, time series were extracted for a number of small areas of interest (AOIs). In the second step, a per-pixel analysis was carried out. Then, different wetland backscattering classes were derived from the time series based on their characteristic signatures using unsupervised classification.

2.3.1. Extraction of Time Series

Visual interpretation of σ 0 time series is often made difficult by the occurrence of speckle which is a characteristic feature of SAR data. The influence of speckle can be decreased by averaging samples over homogeneous areas [55]. Therefore, averaged time series were extracted from seven AOIs pertaining to different land-cover units located within and outside the Kafue Flats and Lukanga Swamps (Table 1). Their locations are shown in Figure 3. AOIs A–C and G are located below ENVISAT ground tracks so that the extracted σ 0 time series could be compared to water height. In addition, one AOI was selected over the Chunga Lagoon (F) and two further AOIs in non-wetland areas north of the Kafue Flats (D and E). It can be seen that they differ considerably in terms of size and vegetation as estimated by NDVI. Due to the fact that there is much small-scale variability present within the Kafue Flats no larger AOIs with presumably homogeneous backscattering behavior could be delineated in cases A–C. However, these AOIs are still large enough to minimize the speckle effect in the averaged time series. The land-cover information for AOIs D and E was extracted from the ESA Land Cover CCI dataset (Figure 1c). AOIs A and B are located in areas which show low σ 0 indicative of open water during the flood season and intermediate backscatter during the dry season (Figure 4a). AOI C is located in the vegetated floodplain close to the Kafue River where no negative change in σ 0 due to flooding is visible (Figure 4b). AOI G is situated in the Lukanga Swamps (Figure 3b).

2.3.2. Seasonality Analysis Using Harmonic Model

The Kafue Flats are subject to strongly seasonal rainfall and runoff (Figure 2). Radar backscatter dynamics are closely linked to hydrological processes occurring on the land surface due to the high sensitivity of microwave radiation to changes in dielectric constant. Moreover, in the case of flooding, processes such as specular reflection at open water surfaces exert a drastic influence on the energy amounts backscattered from affected surfaces. Therefore, σ 0 time series of the region are likewise expected to display a strong seasonality. It can also be assumed that the series will not show a single annual cycle but a more complex pattern produced at multiple frequencies due to the overlaying effects of different scattering mechanisms.
The seasonal patterns of wetting, flooding and drying of the land surface within and around the Kafue Flats were analyzed using harmonic modeling of the ASAR σ 0 image time series obtained using the pre-processing workflow described in Section 2.2.1. Seasonality in remotely sensed time series has been analyzed before using similar approaches, mostly in order to derive land surface phenology based on NDVI e.g., [27,56] but rarely for SAR-derived time series. A requirement for the application of a harmonic model is that valid data points have to be present at key points of the curve [27]. This in turn requires a sufficiently dense series which was generated as described earlier. The applied methodology is described in greater detail by Schlaffer et al. [30]. The σ 0 time series were averaged over slices of ten days in order to regularize the sampling intervals.
A harmonic model represents a time series as a combination of k N sinusoids, each with an amplitude A and a phase angle ϕ . ϕ can be interpreted as the time of the maximum of the respective sinusoid [57]. A backscatter time series can therefore be expressed as
σ 0 ( t ) = σ 0 ¯ + i = 1 k A i cos 2 π i t n - ϕ i + ε ( t )
where σ 0 ¯ is the backscatter coefficient averaged over time t, n is the number of measurements and ε a residual term. The k sinusoids represent cycles occurring with a frequency f i = 1 , 2 , 3 , . . . , k yr - 1 . The choice of an appropriate value for k was determined by the motive to reproduce the seasonality caused by the underlying climatic and flooding processes. According to our prior considerations that water level can have positive or negative effects on radar backscatter depending on the occurrence of flooded vegetation or open water, respectively, we expect that some of the affected time series will display strongly asymmetric shapes. Such deviations from a purely sinusoidal shape with a frequency f i can be represented by overlaying a second sinusoid with a frequency f i + 1 = 2 f i [58]. We therefore chose to represent the series by a number of k = 3 sinusoids. The number of harmonic terms is limited by the Nyquist frequency which is half of the sampling rate of a signal. In the present case, the lowest number of samples is 25 over the two-year study period for θ between 15 and 25 (see Figure S1). The maximum possible value of k is therefore 25 / 4 6 which is twice as high as the selected value.
The parameters of the sinusoids were estimated using least-squares optimization as missing values occurred in the time series due to the user-request-driven acquisition policy for ASAR WS data. Using the transformations
A i = c i 2 + s i 2
and
ϕ i = tan - 1 s i c i
Equation (2) can be rewritten as
σ 0 ( t ) = σ 0 ¯ + i = 1 k c i cos 2 π i t n + s i sin 2 π i t n + ε ( t )
which was treated like a multiple linear regression with predictors cos 2 π i t / n and sin 2 π i t / n [30].
We first estimated the parameters σ 0 ¯ , c i and s i for time series averaged from samples taken from the homogeneous areas selected as described in Section 2.3.1 to demonstrate the seasonality encountered in the area of interest. Then, the harmonic model was derived for each point X in space in the multi-temporal image stack created during pre-processing (cf. Section 2.2.1), which means that the harmonic model parameters can be visualized as raster maps with the same spatial dimensions as the input data.

2.3.3. Regional Wetland Mapping

After the harmonic model parameters were estimated as described in Section 2.3.2 we tested whether the parameters contained enough information to classify different wetland classes such as permanent and seasonal open water. If the harmonic model is fitted to the σ 0 time series of each pixel of a multi-temporal image stack the parameters of the model, namely mean backscatter, c i and s i , are available as spatially distributed variables. Therefore, using a harmonic model, a large portion of the variability in a time series can be expressed through a combination of 2 k + 1 parameters. These variables can then be used to compare the seasonal behavior of different pixels against each other. When no prior information about the seasonality of different wetland classes is available cluster analysis represents an efficient way to explore the relationships of the different parameters with respect to each other. Moreover, as the cosine and sine functions in Equation (5) are approximately orthogonal to each other, Euclidean distance can be used as a measure of dissimilarity between the time series [59]. A K-medoids partitioning approach was applied here which is outlined below. Details are given by Kaufman and Rousseeuw [60]. Due to the size of the dataset ( > 22 × 10 6 pixels) smaller sub-samples of 20,000 pixels were drawn at random. The sub-samples were grouped around K representative objects, the so-called medoids. Subsequently, the samples not included in the initial sub-samples were assigned to the closest representative object. The use of medoids instead of centroids assigns lower weights to outliers as the sum of absolute deviations is minimized instead of the sum of squared deviations as in the widely-used K-means method. This makes the approach more robust to the occurrence of outlying observations [60]. The number of target clusters was estimated by the number of land-cover classes that the CCI Land-Cover dataset reported for the study region. All clusters related to non-water or non-wetland were combined into a single “Land” class. The remaining clusters were labelled using the gathered information about hydrological and backscattering behavior from the analysis of the time series from selected AOIs (Table 1).
In the post-processing step, the resulting map showing the aggregated and labelled clusters was regularized using a majority filter with a square kernel of 5 × 5 pixels. We further made the assumption that wetlands and periodic inundation only occur in areas which are not highly elevated above the river network. Similar assumptions have been made by e.g., Fluet-Chouinard et al. [61]. This assumption was implemented by using a mask based on the Height Above Nearest Drainage (HAND) index which essentially consists of the elevation difference between a pixel of a digital elevation model and the nearest pixel that is part of the drainage network. Details of the derivation are given by Rennó et al. [62] and Schlaffer et al. [30] for the masking. The digital elevation model (DEM) and the flow direction rasters available at a resolution of 3 arc-seconds from the HYDROSHEDS website [63] were used as input for the HAND algorithm.

3. Results and Discussion

3.1. Wetland Backscatter Signatures

In this section, the results of the backscatter time series analysis are described. Since one goal of the study is to discuss the backscatter signatures in context with flood dynamics, we first focus on time series sampled from the AOIs described in Section 2.3.1. Then, the derived harmonic model parameters are discussed in a spatial context.

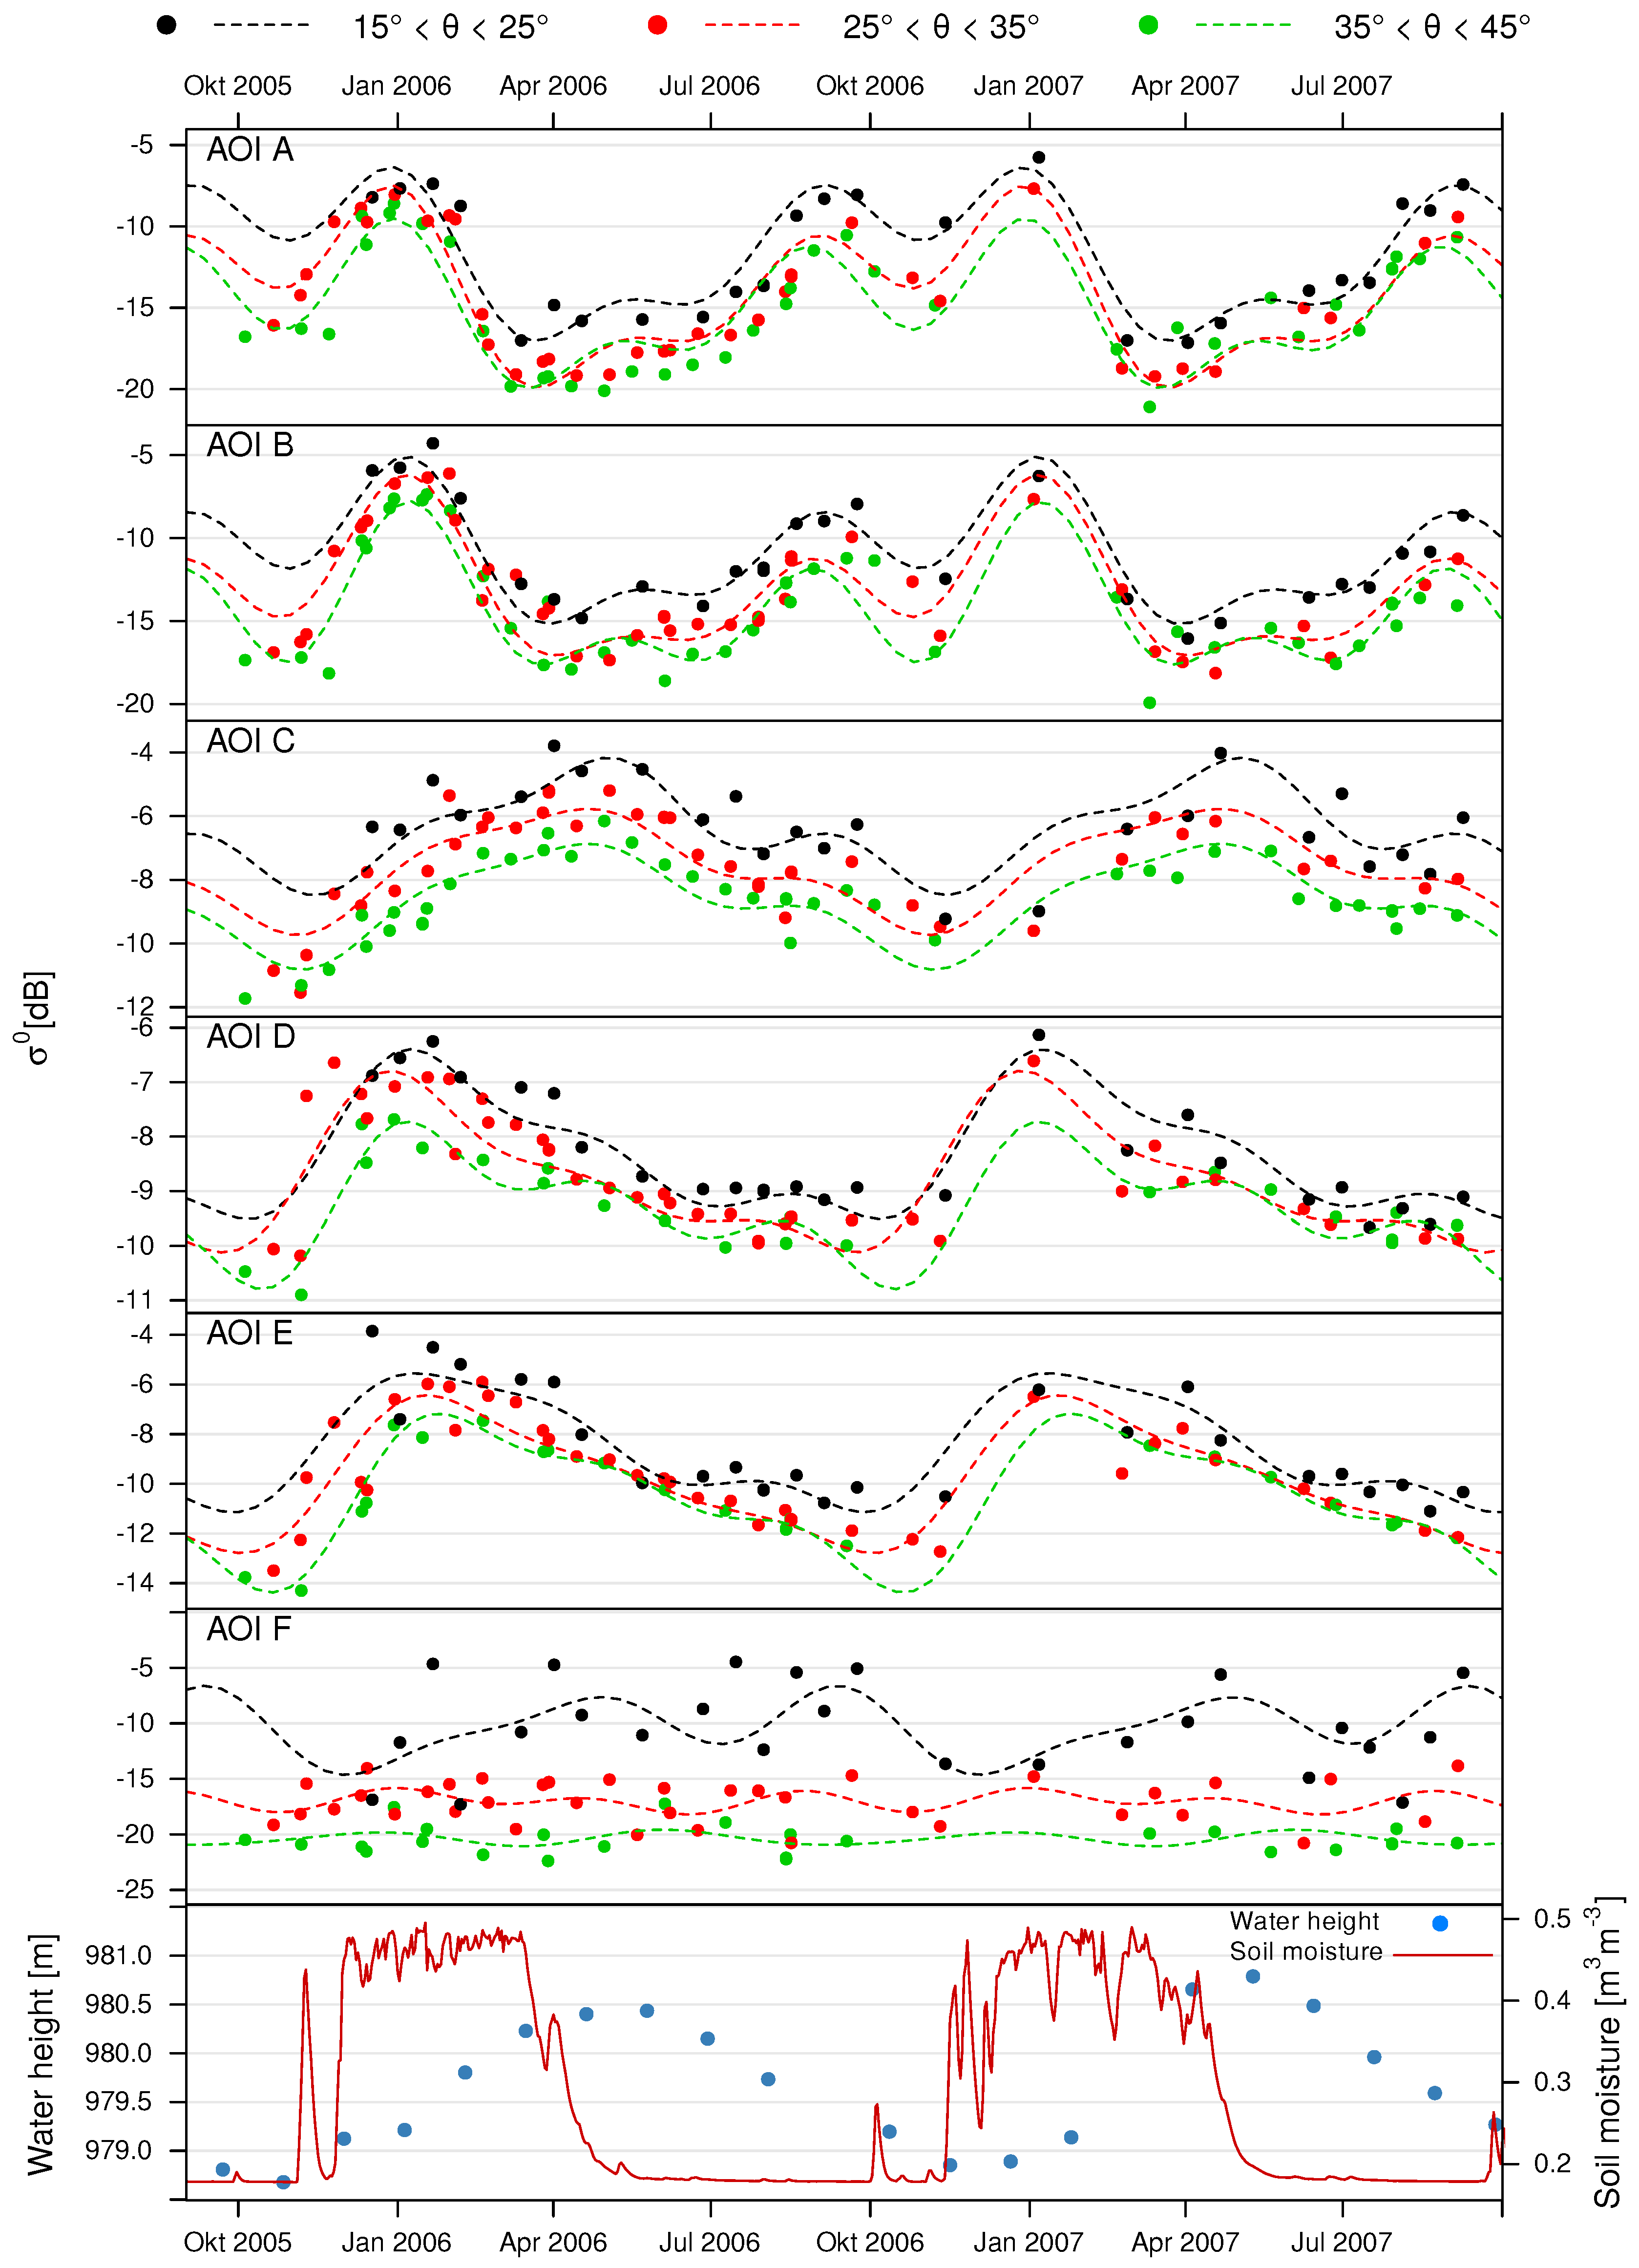
3.1.1. Analysis of Time Series from AOIs

ASAR σ 0 time series were sampled from AOIs at different locations along ENVISAT ground track 85 in the Kafue Flats and track 543 in the Lukanga Swamps to compare backscatter and water level dynamics. Additional AOIs were selected in a permanent water body and non-wetland areas for comparison. Seasonality was estimated for different local incidence angle classes using the harmonic model approach (Figure 5 and Figure 6).
Figure 5 shows the time series of six AOIs in and around the Kafue Flats. In the lower panel, altimeter-derived water height and soil moisture from the large-scale ERA-Interim/Land reanalysis are displayed. Although reanalysis soil moisture fields cannot realistically reproduce actual soil moisture dynamics inside the wetland they can be used to gain information about its general seasonality based on atmospheric forcing [64]. Indeed, soil moisture shows distinct wet and dry seasons as could be expected from the monthly rainfall statistics (Figure 2). Water height follows the soil moisture dynamics with a time shift of some months. The annual amplitude in water height along track 85 is ca. 2 m which is similar to numbers based on in-situ gauges reported in the literature [36].
In the top panel of Figure 5, the time series of a moderately vegetated AOI (A) with a dry-season NDVI of ca. 0.42 is shown. For all three local incidence angle classes similar seasonal σ 0 patterns can be observed. The maximum occurs around January which roughly coincides with the peak of the rainy season (cf. Figure 2) when soil moisture is high and vegetation should be fully developed. After this maximum, σ 0 drops within three months to levels usually considered indicative of flooding (<−15 dB). Water height reaches its annual maximum around the same time. Water level then decreases while at the same time there is a gradual increase of σ 0 to about −10 dB in September. This rather fast decrease in backscatter during the second half of the wet season and the subsequent slow increase can be attributed to flooding followed by comparatively slow flood recession due to the flat terrain. The strong negative relationship between σ 0 and water height provides additional evidence for this hypothesis. Between October and November there is again a decrease in backscatter as the dry season progresses, most likely due to lower soil moisture levels. Approximately in December, σ 0 , water height and soil moisture start increasing again. During this time of the year, there is a positive relationship between σ 0 and water height.
A similar pattern can be observed for another moderately vegetated AOI (B) in the southern part of the Kafue Flats. The main difference here is that the flooding seems to be more persistent as indicated by the more stable low backscatter between March and July. The second maximum in September is also by a few dB lower than in AOI A. A possible explanation for these dynamics could be lower vegetation which remains submerged longer while in the first case gradually more and more vegetation emerges from the water surface when the flooding slowly recedes and contributes to higher backscatter. However, this cannot be fully answered given the available data as NDVI is very similar among the two AOIs and it is also does not provide an indication of vegetation height.
Very different dynamics are found for the third AOI (C) which is located closer to the river and more densely vegetated than the first two AOIs (NDVI = 0.59). Here, an overall positive relationship between σ 0 and water height (irrespective of θ class) can be noticed. Both variables increase between November and May and then decrease during the dry season. The high σ 0 values that are reached during peak flood water height are indicative of double-bounce backscattering reaching values between −6 dB and −4 dB, depending on θ. According to Ellenbroek [32], the area along the river is characterized by tall grasses growing on levees along the river which may lead to only partial submersion during the flood season.
According to the reference land-cover dataset [37], the two non-wetland AOIs D and E are covered by trees and rainfed cropland, respectively. Both show similar seasonal patterns with a steep increase in σ 0 at the onset of the rainy season and a slow gradual decline reaching a minimum around October. The main difference between the two AOIs is that AOI D has a higher annual minimum and a smaller annual variation than E, presumably due to the denser vegetation and therefore higher volume scattering during the dry season. The time series corresponding to AOI F, located over a permanent water body, shows high noise at low local incidence angles resulting in a relatively poor harmonic model fit with standard errors between 1.2 and 1.4 for the coefficients c i and s i while for higher θ they lie typically around 0.5. This is most likely owed to the higher susceptibility of steep local incidence angles to water surface roughness. For the other θ ranges, the fitted curve resembles almost a straight line reflecting the stability of specular reflection throughout the year.
Backscatter, altimeter water height and surface soil moisture time series for the Lukanga Swamps (AOI G) are shown in Figure 6. The annual amplitude in water height was ca. 1 m, i.e., half the value found for the Kafue Flats. Backscatter throughout the year was high reflecting the high moisture content. For steep incidence angles, σ 0 during the wet season is even > 0 dB suggesting a strong double-bounce contribution from the partially submerged reed stands. It is worth mentioning that no further increase in σ 0 is visible when water height increases above 1115 m. Rather, there seems to be a small decrease during the height of the flood season between April and June (Figure 6). This behavior can possibly be explained by the decreasing length of the stems and leaves of reeds emerging above the water surface and therefore the smaller area available for the production of double-bounce scattering. Similar findings have been reported based on backscatter modeling [65]. In comparison with AOI C, which is also characterised by seasonally flooded vegetation in the Kafue Flats, double-bounce scattering is more persistent here meaning that the vegetation is likely to be longer partially submerged in this case. According to Ellenbroek [32], the Lukanga Swamps’ main water loss is by evaporation whereas drainage towards the Kafue River is low. This offers an explanation for the sustained high backscatter values encountered in this area. In relation to the fitted harmonic models it can be noted that in the case of low incidence angles (black dashed line in Figure 6) the annual dynamics are probably underestimated because there is only one σ 0 measurement available at the lowest point of the time series in November 2006.
Overall, very similar harmonic models were fitted for all three value ranges of θ. Steep local incidence angles ( 15 25 ) are sampled with the lowest density but the strong similarity between the estimated models suggests that the sample size was high enough for the parameter optimisation. In general, time series taken at a high local incidence angle are consistently lower than those from low θ ranges. A more detailed discussion of the differences between the estimated harmonic model parameters is given in the following paragraphs.
The differences between the harmonic models can also be illustrated in terms of the differences in the estimated coefficients c i and s i , corresponding to the amplitudes and phases estimated for the respective frequencies. A suitable way to visualize these differences is obtained by plotting the point pairs ( c i , s i ) for a single frequency f i in Cartesian coordinates and to connect the points to the origin. As result, a radial plot is obtained as shown in Figure 7 for the seven AOIs. The length of the lines is equal to the amplitude A i and the angle between the abscissa and the lines represents the phase angle ϕ i according to Equation (3) and Equation (4) [59]. For the first harmonic with an annual frequency, both AOIs with seasonal open water (A and B) have phase angles placing their lines in the lower right quadrant of Figure 7a). Also, their lines are longer than the other AOIs reflecting the large annual amplitude of the corresponding backscatter time series (cf. Figure 5). Since no significant seasonal variations in the backscatter time series of the permanently water-covered AOI F could be identified for intermediate and high θ (i.e., A 1 0 ) only a line for steep θ is visible which points in the almost opposite direction of the coefficients for seasonally inundated areas. This suggests a certain potential of the harmonic model parameters for being used to discriminate between permanent and seasonal water bodies even if the differences in average backscatter σ 0 ¯ are minor. The coefficients corresponding to AOI C, which is located close to the river, are displayed as lines in the upper left quadrant echoing the very different dynamics already shown in Figure 5. Moreover, the amplitude is much smaller than in the case of AOIs A and B. The coefficients related to AOIs D and E, which are not located inside the wetland areas, have similar phase angles ϕ 1 . A 1 for the tree-covered area D, however, is smaller than for the cropland area E. AOI G which is located in the Lukanga Swamps is characterised by comparatively small A 1 values for all three θ ranges. In contrast to the other AOIs, ϕ 1 varies strongly between the θ classes. This behavior can be explained by the fact that, in Figure 6, two peaks can be recognized in the σ 0 time series, the first one in January and the second one around August to September. For high local incidence angles (green dashed line in Figure 6), the second peak is higher than the first one which is likely to be the reason that the corresponding line is situated in the upper left quadrant of Figure 7a).
In contrast, land and seasonal water bodies show a much higher similarity in terms of the parameters obtained for the second harmonic term as demonstrated by the corresponding point pairs located in the upper-right quadrant of Figure 7b). Amplitudes A 2 also tend to be lower than A 1 . A 3 estimates are of similar magnitude as A 2 . Additionally, there is even less variation in ϕ 3 than in ϕ 2 between the AOIs (Figure 7c).
It is noteworthy that only minor differences in the estimated amplitudes between the different local incidence angle classes for the same AOIs can be found which is illustrated by the similarity of the solid, dashed and dotted lines in Figure 7. Viewing geometry expressed as θ, however, seems to affect σ 0 ¯ estimates for the different AOIs (Table 2). In general, σ 0 ¯ is higher at steep θ which is in line with our expectations. In dry-land AOIs (D and E) as well as in AOIs with seasonally flooded vegetation (C and G) σ 0 ¯ decreases in an almost linear manner with higher θ. In case of permanent water (AOI F), the difference in σ 0 ¯ is very strong between steep to intermediate θ values whereas between intermediate and high θ the gradient flattens. The comparatively high σ 0 ¯ for low θ is probably due to the higher sensitivity to water surface roughness at these incidence angles [66]. In case of the AOIs with seasonal open water (A and B) the gradient seems to be marginally steeper at low θ, however, not enough to assume a strong non-linearity. It can be concluded that, based on the data from the selected AOIs, the periodic changes between different scattering mechanisms like specular reflection and double-bounce scattering were not found to cause substantial deviations from a linear relationship between σ 0 and θ which is often reported in the literature e.g., [44,45]. Concerning the separability between wetland and dry-land classes differences between AOIs were more pronounced at higher angles.

3.1.2. Spatial Analysis of Harmonic Model Coefficients

In the next step of the analysis, harmonic models were fitted separately to the time series of each pixel of the multi-temporal image stack. For each pixel, the harmonic model coefficients, mean backscatter σ 0 ¯ , amplitudes A i and phases ϕ i were estimated and evaluated w.r.t. spatial patterns of backscatter seasonality. As it was demonstrated in Section 3.1.1 there should be a high potential to distinguish seasonal and permanent water bodies as well as regions with double-bounce backscattering using the coefficients corresponding to the first harmonic term in Equation (2) corresponding to a frequency f 1 = 1 yr - 1 . The differences between AOIs were less pronounced in the coefficients corresponding to the 2nd and 3rd harmonic terms. RGB composites of σ 0 ¯ , A 1 and ϕ 1 are shown in Figure 8 for different θ ranges. Phase angle ϕ 1 is given as Day of Year (DoY) and rescaled between 0 and 364. Visual inspection shows large differences between the wetland and surrounding areas but also within the Kafue Flats themselves. The area along the Kafue River appears as an orange-red ribbon in the centre of the maps. The time series derived from AOI C (Figure 5) corresponds to this backscattering class. The area is characterized by annual flooding during the wet season and high NDVI values. This leads to high average backscatter and therefore high values in the red band of Figure 8 while at the same time the intra-annual variability caused by flooding leads to intermediate values of A 1 (green band) and low ϕ 1 (blue band). In stark contrast, the seasonally flooded areas north and south of the river appear as bright blue-green bands stretching along the borders of the wetland. Comparison with the dynamics of AOI A and AOI B reveals that in these areas the maximum occurs before or during the peak of the rainy season, i.e., late in the year (high DoY), after which σ 0 is decreased due to specular reflection. This in turn leads to high values in the blue band of Figure 8 for seasonally flooded regions. Moreover, brighter shades of blue imply that there is also a strong green component due to a high yearly amplitude in backscatter. The high A 1 and ϕ 1 values for seasonally flooded areas were also visible in Figure 7a) for AOIs A and B. In conclusion, areas with seasonal open water are characterized by low σ 0 ¯ as well as high A 1 and ϕ 1 while in seasonally flooded vegetation high σ 0 ¯ , low ϕ 1 and intermediate A 1 can be found. AOIs A and B therefore correspond to areas appearing blue-green in Figure 8 while areas with a similar behavior as AOI C appear orange to red.
In comparison, non-wetland areas are mainly shown in green and red shades. Areas shown in green should be characterized by low average σ 0 and high A 1 while for areas shown in red the opposite is true reflecting differences in vegetation density and biomass. Indeed, green areas typically have a dry-season NDVI of 0.25–0.30 while in red areas NDVI is much higher (cf. Figure 3). According to the reference land-cover dataset red areas mostly belong to tree-covered or even forested classes (cf. AOI D) while green areas fall inside cropland classes (cf. AOI E). This would partly explain the differences in σ 0 ¯ and A 1 as in forests volume scattering can be expected to be comparatively high also during the dry season while in agricultural areas a higher sensitivity to soil moisture is usually observed. Visual inspection of the differences between Figure 8a–c reveals that in some areas the harmonic model coefficients are more sensitive to changes in θ than in others. Areas that are labelled as covered by trees in the reference land-cover dataset (Figure 1c), for example, appear with a higher red value and therefore have higher average σ 0 at higher local incidence angles (Figure 8c vs. Figure 8a). This is in line with our expectation that volume scattering is more dominant at a more oblique geometry due to the longer distance the incident radiation has to travel through the canopy.
Permanent water bodies like the Chunga Lagoon appear almost black at θ > 25 while at lower angles seasonal and permanent water is more difficult to differentiate visually based on the harmonic model components alone. Figure 5 shows more noise in the time series for AOI F acquired at θ < 25 which leads to a harmonic model which erroneously suggests a relatively high seasonality. This is likely due to the higher σ 0 from roughened surfaces at steep incidence angles [67] and therefore a higher temporal variability which can be mistaken for seasonality by the model (cf. Figure 5). At higher incidence angles, however, the harmonic model components seem to be well suited to distinguish permanent and seasonal water bodies.
The discussion here is mainly related to the parameters corresponding to the first harmonic. Additionally, gray-scale images of all the fitted coefficients are included in the Supplement to this article (Figures S2–S4). It can be seen that amplitudes A 2 and A 3 are, in general, lower than A 1 and that there is much less contrast between wetland and non-wetland areas. This confirms the conclusion from Section 3.1.1 that the AOIs can be distinguished mainly based on σ 0 ¯ , A 1 and ϕ 1 .

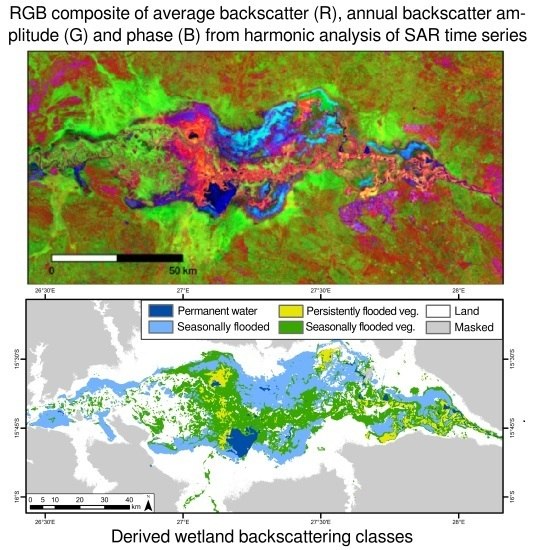
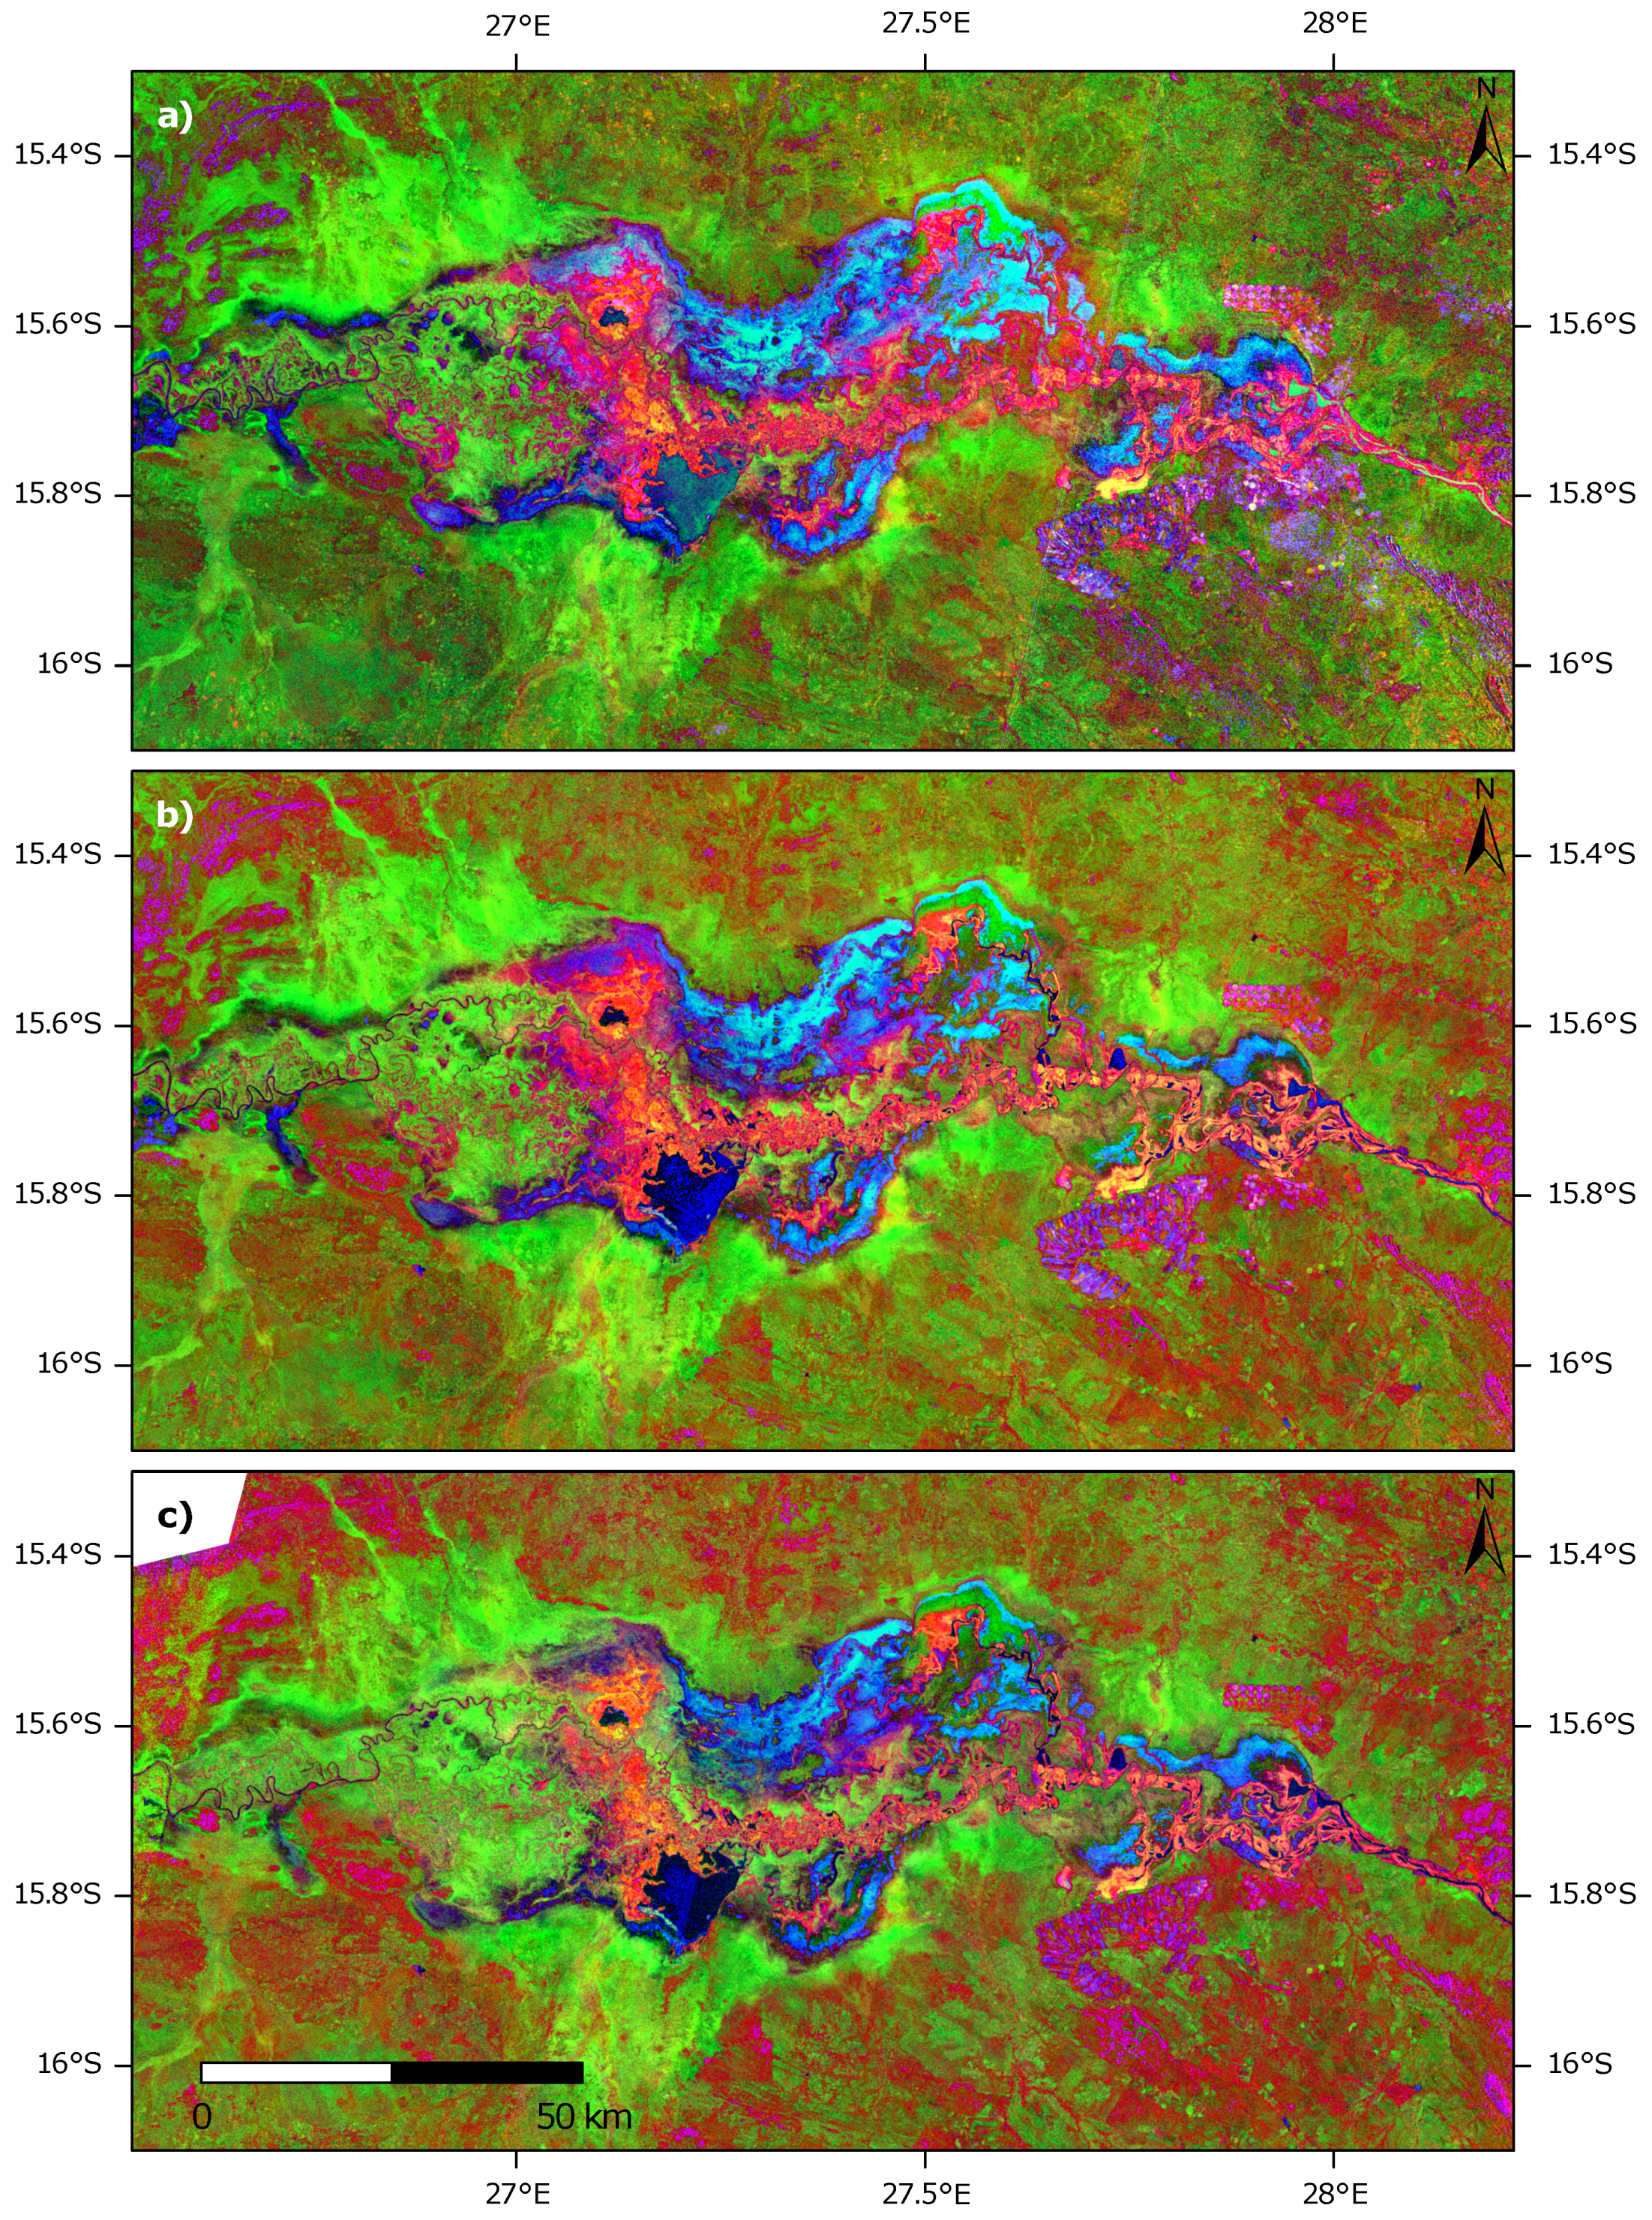
3.2. Regional Mapping of Wetland Backscattering Classes

Analysis of the harmonic model parameters in Section 3.1 showed that different backscattering classes in wetlands could be distinguished based on indicators of their annual dynamics and mean backscatter. We therefore chose the spatially distributed parameters σ 0 ¯ , c 1 and s 1 as well as the standard deviation of the residual term s ε as input parameters for the K-medoids approach described in Section 2.3.3. The cluster analysis was run over the entire region shown in Figure 1c) to see if the approach was able to correctly detect the three major wetlands in the study region. Only σ 0 measurements acquired at local incidence angles between 25 and 35 were used for the parameter estimation of the harmonic model. At these intermediate θ values a higher contrast between permanent and seasonal water bodies as well as between forested and open areas was described in Section 3.1. The parameters σ 0 ¯ , A 1 and ϕ 1 are shown in form of a RGB composite in Figure S5. The number of target clusters in the cluster analysis was 16 which is the number of land-cover classes that the ESA CCI Land-Cover dataset lists for the study region. The clusters were then combined and labelled according to a description of the seasonal behaviour of the corresponding AOIs in Table 3. Due to the differences in seasonal flooding that were observed between AOI C (Kafue Flats) and AOI G (Lukanga Swamps) two classes for flooded vegetation were created. “Persistently flooded vegetation” refers to persistent double-bounce scattering as observed in the Lukanga Swamps while the more dynamic behavior along the Kafue River was regarded as typical for class “Seasonally flooded vegetation”. A suitable threshold value for masking areas in which wetlands are very unlikely to occur based on the HAND index was determined by visually assessing the distributions of HAND values for the aggregated and labelled classes using a Box-Whisker-Plot (Figure S6 in Supplementary Material). A threshold value of 10 m effectively separated the HAND distributions of the wetland backscattering classes from the distribution conditioned on the “Land” class.
The result of the classification after applying the post-processing steps described in Section 2.3.3 is shown in Figure 9. A total area of almost 7800 km 2 was classified as one of the four wetland backscattering classes corresponding to 7.6% of the total study area. Of this area, 7% were permanent water bodies, 26% seasonal open water, 19% persistently flooded vegetation including most of the Lukanga Swamps and 22% were covered by seasonally flooded vegetation. In comparison, the CCI Land Cover dataset shows an area of 4800 km 2 as covered by either water bodies or flooded shrub and herbaceous vegetation. Discrepancies are mainly visible in the Lukanga and the Busanga Swamps where large portions are classified as shrubland in the CCI product. However, flooded vegetation seems to be more likely here as these areas, according to topography (cf. Figure 1b), are located within the aforementioned wetlands. All three major wetlands in the region, the Kafue Flats in the south, the Lukanga Swamp in the north-east and the Busanga Swamps in the north-west were detected by our approach. Also, the Itezhi-Tezhi reservoir, the Chunga Lagoon and a number of other permanent water bodies are well represented. In the Kafue Flats, the main wetland units of densely vegetated floodplain along the river and seasonal open water along their northern and southern edges are correctly identified. In contrast to the complex mosaic found in the Kafue Flats, the main part of the Lukanga Swamps is quite homogeneously covered by persistently flooded vegetation. This class is also found in the Kafue Flats in the proximity of large permanent water bodies like the Chunga Lagoon and in the flooded areas behind the Kafue Gorge Dam at the eastern end of the flats. The Busanga Swamp seems to be more vegetated in its northern part while the southern part exhibits seasonal open water bodies. The Kafue River is not continuously visible due to its rather narrow channel width of 150 m to 200 m (according to visual assessment using Google Earth imagery). This is below the size of the majority filter which may have reclassified pixels belonging to the river to the land class. However, since the focus of this study was the mapping of wetlands we chose not to alter the filter size of 5 × 5 pixels.
The masking based on elevation difference to the nearest drainage mainly removed forested pixels in the topographically complex south-eastern part of the region which would otherwise have been falsely classified as open water or flooded vegetation due to radar shadow and layover, respectively. It should also be mentioned that larger urban areas were falsely classified as flooded vegetation due to high σ 0 ¯ and low annual variation. Nevertheless, the HAND-based mask successfully removed such areas as in the case of Lusaka.

4. Conclusions

In the presented study, moderate-resolution ENVISAT ASAR data acquired over a time period of ca. two years were compared to altimeter-derived water height estimates and surface soil moisture from a reanalysis dataset to assess characteristic seasonal patterns in C-band radar backscatter from tropical wetlands. It was hypothesized that different scattering mechanisms caused by soil moisture and inundation dynamics along with vegetation density affected the observed backscatter ( σ 0 ) time series. Indeed, a positive contribution of water height to the backscatter coefficient was found under dense vegetation whereas in more open areas, specular reflection dominated the signal as soon as most of the vegetation had been submerged. These differences lead to typical time series signatures, which were characterized using a harmonic model. Selected harmonic model parameters estimated for each pixel in a multi-temporal image stack were then used to classify wetland backscattering classes at the regional scale by applying an unsupervised classification approach. It was possible to clearly differentiate permanent water bodies, seasonal open water, seasonal flooded vegetation as well as persistently flooded vegetation from dry-land areas.
Furthermore, we addressed the question of whether periodic changes in scattering mechanism (volume scattering, double-bounce scattering, specular reflection) affected the seasonal signatures of the σ 0 time series as expressed in terms of their amplitudes and phases. The effect of different local incidence angles was found to be sufficiently well described by a linear shift in average backscatter between the incidence angle bands. The only substantial exception to this finding were permanent water bodies where data acquired at higher incidence angles seemed to be less affected by water surface roughness. The effect of local incidence angle θ on σ 0 could, therefore, be largely corrected for using a linear normalization approach as found in the literature on soil moisture retrieval from radar data. For the wetland classification, data acquired in a θ range between 25 and 35 were selected as our analysis had shown that, at these intermediate incidence angles, a good trade-off was obtained between robustness to surface roughness for open water classification and canopy attenuation for the classification of vegetated wetlands.
Typically, SAR-based wetland classification methods, some of which were mentioned in Section 1, take into account imagery acquired during flood and dry seasons. Such approaches usually require a significant amount of intervention by the operator, especially for selecting suitable image acquisitions. In contrast, in the proposed approach, magnitude and timing of backscatter seasonality are explicitly modelled for each pixel while taking into account the full time series of ASAR images. We believe that our method makes an important contribution towards more automatic wetland classification approaches, especially as more systematic acquisitions are made possible by satellite missions such as Sentinel-1. As the application of a harmonic model requires a time series with a length of at least one seasonal cycle the proposed approach for wetlands mapping is generally suitable for detecting changes and trends in wetland extent and type from longer SAR time series. An important prerequisite is a dense enough temporal sampling. Since the conclusion of the ENVISAT mission Sentinel-1 is a prime candidate for continuing the existing time series of C-band SAR data. However, at the time this manuscript was finalised only a small number of scenes had been acquired by Sentinel-1 over the study region.

Supplementary Materials

The following are available online at www.mdpi.com/2072-4292/8/5/402/s1, Figure S1: Local incidence angles of ASAR scenes averaged over the Kafue Flats; Figure S2: Harmonic model parameters (a) σ 0 ¯ ( 15 25 ) ; (b) σ 0 ¯ ( 25 35 ) ; (c) σ 0 ¯ ( 35 45 ) ; (d) A 1 ( 15 25 ) ; (e) A 1 ( 25 35 ) ; (f) A 1 ( 35 45 ) ; (g) ϕ 1 ( 15 25 ) ; (h) ϕ 1 ( 25 35 ) ; (i) ϕ 1 ( 35 45 ) ; Figure S3: Harmonic model parameters (a) A 2 ( 15 25 ) ; (b) A 2 ( 25 35 ) ; (c) A 2 ( 35 45 ) ; (d) ϕ 2 ( 15 25 ) ; (e) ϕ 2 ( 25 35 ) ; (f) ϕ 2 ( 35 45 ) ; Figure S4: Harmonic model parameters (a) A 3 ( 15 25 ) ; (b) A 3 ( 25 35 ) ; (c) A 3 ( 35 45 ) ; (d) ϕ 3 ( 15 25 ) ; (e) ϕ 3 ( 25 35 ) ; (f) ϕ 3 ( 35 45 ) ; Figure S5: RGB composite of harmonic model components used for wetland extent mapping in the Kafue River Basin; Figure S6: Box-Whisker-Plots of the Height Above Nearest Drainage (HAND) index for each of the derived classes.

Acknowledgments

During the writing of this paper, the first author was recipient of a Marietta Blau scholarship from the Austrian Ministry of Science, Research and Economy (BMWFW). Marco Chini’s contribution was supported by the National Research Fund of Luxembourg (FNR) through the PAPARAZZI (C11/SR/1277979) and MOSQUITO (C15/SR/10380137) projects. The authors acknowledge the TU Wien University Library for financial support through its Open Access Funding Program. Processing of ENVISAT ASAR Level 1b datasets was funded by the European Space Agency (ESA) in the framework of the WATCHFUL project (4000107122/12/I-NB). ESA also provided the ENVISAT RA-2 SGDR v2.1 dataset. Monthly runoff data were provided by the Global Runoff Data Centre (GRDC), 56068 Koblenz, Germany. MODIS NDVI time series were downloaded from the University of Natural Resources and Applied Life Sciences (BOKU), Vienna, Austria. Information on Land Cover was provided by the ESA CCI Land Cover project. Volumetric surface soil water time series from the ERA-Interim/Land reanalysis were downloaded from the website of ECMWF.

Author Contributions

Stefan Schlaffer led the study and writing; the other authors contributed significantly to the writing of the manuscript; the time series analysis and wetland classification were carried out by Stefan Schlaffer and Marco Chini; Denise Dettmering processed and analysed the altimeter time series and provided extensive comments and contributions to the manuscript; Wolfgang Wagner contributed to the design of the study in the early stages and provided comments to the manuscript.

Conflicts of Interest

The authors declare no conflict of interest. The founding sponsors had no role in the design of the study; in the collection, analyses, or interpretation of data; in the writing of the manuscript, and in the decision to publish the results.

Abbreviations

The following abbreviations are used in this manuscript:
AOI
Area of interest
ASAR
Advanced Synthetic Aperture Radar
CCI
Climate Change Initiative
DAHITI
Database for Hydrological Time Series of Inland Waters
DEM
Digital Elevation Model
DOY
Day of Year ECMWF: European Centre for Medium-range Weather Forecasts
ESA
European Space Agency
GIEMS
Global Inundation Extent from Multi-Satellites
GRDC
Global Runoff Data Centre
HAND
Height Above Nearest Drainage
JERS-1
Japan Earth Resource Satellite 1
MODIS
Moderate Resolution Imaging Spectrometer
NDVI
Normalised Vegetation Difference Index
SAR
Synthetic Aperture Radar
SRTM
Shuttle Radar Topography Mission
WS
Wide Swath

References

  1. Junk, W.J.; An, S.; Finlayson, C.M.; Gopal, B.; Květ, J.; Mitchell, S.A.; Mitsch, W.J.; Robarts, R.D. Current state of knowledge regarding the world’s wetlands and their future under global climate change: A synthesis. Aquat. Sci. 2012, 75, 151–167. [Google Scholar] [CrossRef]
  2. Ramsar. Briefing Note 7: State of the World’s Wetlands and Their Services to People: A Compilation of Recent Analyses; Ramsar: Ramsar, Iran, 2015. [Google Scholar]
  3. Mitchell, S.A. The status of wetlands, threats and the predicted effect of global climate change: The situation in Sub-Saharan Africa. Aquat. Sci. 2012, 75, 95–112. [Google Scholar] [CrossRef]
  4. Schelle, P.; Pittock, J. Restoring the Kafue Flats: A partnership approach to environmental flows in Zambia. In Proceedings of the 8th International River Symposium, Brisbane, QLD, Australia, 6–9 September 2005; pp. 1–10.
  5. Ozesmi, S.L.; Bauer, M.E. Satellite remote sensing of wetlands. Wetl. Ecol. Manag. 2002, 10, 381–402. [Google Scholar] [CrossRef]
  6. Prigent, C.; Papa, F.; Aires, F.; Rossow, W.B.; Matthews, E. Global inundation dynamics inferred from multiple satellite observations, 1993–2000. J. Geophys. Res. 2007, 112. [Google Scholar] [CrossRef]
  7. Klemas, V. Remote sensing of emergent and submerged wetlands: An overview. Int. J. Remote Sens. 2013, 34, 6286–6320. [Google Scholar] [CrossRef]
  8. Bartsch, A.; Trofaier, A.M.; Hayman, G.; Sabel, D.; Schlaffer, S.; Clark, D.B.; Blyth, E. Detection of open water dynamics with ENVISAT ASAR in support of land surface modelling at high latitudes. Biogeosciences 2012, 9, 703–714. [Google Scholar] [CrossRef] [Green Version]
  9. Schumann, G.J.P.; Moller, D.K. Microwave remote sensing of flood inundation. Phys. Chem. Earth Parts A/B/C 2015, 83–84, 84–95. [Google Scholar] [CrossRef]
  10. Henderson, F.M.; Lewis, A.J. Radar detection of wetland ecosystems: A review. Int. J. Remote Sens. 2008, 29, 5809–5835. [Google Scholar] [CrossRef]
  11. Lang, M.; Townsend, P.; Kasischke, E. Influence of incidence angle on detecting flooded forests using C-HH synthetic aperture radar data. Remote Sens. Environ. 2008, 112, 3898–3907. [Google Scholar] [CrossRef]
  12. Hess, L.L.; Melack, J.M.; Novo, E.M.L.M.; Barbosa, C.C.F.; Gastil, M. Dual-season mapping of wetland inundation and vegetation for the central Amazon basin. Remote Sens. Environ. 2003, 87, 404–428. [Google Scholar] [CrossRef]
  13. Aires, F.; Papa, F.; Prigent, C. A long-term, high-resolution wetland dataset over the Amazon Basin, downscaled from a multiwavelength retrieval using SAR data. J. Hydrometeorol. 2013, 14, 594–607. [Google Scholar] [CrossRef]
  14. Yuan, T.; Lee, H.; Jung, H. Toward estimating wetland water level changes based on hydrological sensitivity analysis of PALSAR backscattering coefficients over different vegetation fields. Remote Sens. 2015, 7, 3153–3183. [Google Scholar] [CrossRef]
  15. Zhang, M.; Li, Z.; Tian, B.; Zhou, J.; Tang, P. The backscattering characteristics of wetland vegetation and water-level changes detection using multi-mode SAR: A case study. Int. J. Appl. Earth Obs. Geoinform. 2016, 45, 1–13. [Google Scholar] [CrossRef]
  16. Kim, J.W.; Lu, Z.; Jones, J.W.; Shum, C.; Lee, H.; Jia, Y. Monitoring everglades freshwater marsh water level using L-band synthetic aperture radar backscatter. Remote Sens. Environ. 2014, 150, 66–81. [Google Scholar] [CrossRef]
  17. Schmitt, A.; Brisco, B. Wetland monitoring using the curvelet-based change detection method on polarimetric SAR imagery. Water 2013, 5, 1036–1051. [Google Scholar] [CrossRef]
  18. White, L.; Brisco, B.; Dabboor, M.; Schmitt, A.; Pratt, A. A collection of SAR methodologies for monitoring wetlands. Remote Sens. 2015, 7, 7615–7645. [Google Scholar] [CrossRef]
  19. Morandeira, N.; Grings, F.; Facchinetti, C.; Kandus, P. Mapping plant functional types in floodplain wetlands: An analysis of C-Band polarimetric SAR data from RADARSAT-2. Remote Sens. 2016, 8. [Google Scholar] [CrossRef]
  20. Kasischke, E.S.; Smith, K.B.; Bourgeau-Chavez, L.L.; Romanowicz, E.A.; Brunzell, S.; Richardson, C.J. Effects of seasonal hydrologic patterns in south Florida wetlands on radar backscatter measured from ERS-2 SAR imagery. Remote Sens. Environ. 2003, 88, 423–441. [Google Scholar] [CrossRef]
  21. Bartsch, A.; Wagner, W.; Scipal, K.; Pathe, C.; Sabel, D.; Wolski, P. Global monitoring of wetlands—The value of ENVISAT ASAR Global mode. J. Environ. Manag. 2009, 90, 2226–2233. [Google Scholar] [CrossRef] [PubMed]
  22. Reschke, J.; Bartsch, A.; Schlaffer, S.; Schepaschenko, D. Capability of C-Band SAR for operational wetland monitoring at high latitudes. Remote Sens. 2012, 4, 2923–2943. [Google Scholar] [CrossRef]
  23. Kuenzer, C.; Guo, H.; Huth, J.; Leinenkugel, P.; Li, X.; Dech, S. Flood mapping and flood dynamics of the Mekong Delta: ENVISAT-ASAR-WSM based time series analyses. Remote Sens. 2013, 5, 687–715. [Google Scholar] [CrossRef] [Green Version]
  24. Pulvirenti, L.; Chini, M.; Pierdicca, N.; Boni, G. Use of SAR data for detecting floodwater in urban and agricultural areas: The role of the interferometric coherence. IEEE Trans. Geosci. Remote Sens. 2016, 54, 1532–1544. [Google Scholar] [CrossRef]
  25. Santoro, M.; Wegmüller, U. Multi-temporal synthetic aperture radar metrics applied to map open water bodies. IEEE J. Sel. Top. Appl. Earth Obs. Remote Sens. 2014, 7, 3225–3238. [Google Scholar] [CrossRef]
  26. Santoro, M.; Wegmüller, U.; Lamarche, C.; Bontemps, S.; Defourny, P.; Arino, O. Strengths and weaknesses of multi-year Envisat ASAR backscatter measurements to map permanent open water bodies at global scale. Remote Sens. Environ. 2015, 171, 185–201. [Google Scholar] [CrossRef]
  27. Brooks, E.B.; Thomas, V.A.; Wynne, R.H.; Coulston, J.W. Fitting the multitemporal curve: A fourier series approach to the missing data problem in remote sensing analysis. IEEE Trans. Geosci. Remote Sens. 2012, 50, 3340–3353. [Google Scholar] [CrossRef]
  28. Eastman, J.R.; Sangermano, F.; Ghimire, B.; Zhu, H.; Chen, H.; Neeti, N.; Cai, Y.; Machado, E.a.; Crema, S.C. Seasonal trend analysis of image time series. Int. J. Remote Sens. 2009, 30, 2721–2726. [Google Scholar] [CrossRef]
  29. Jonsson, P.; Eklundh, L. Seasonality extraction by function fitting to time-series of satellite sensor data. IEEE Trans. Geosci. Remote Sens. 2002, 40, 1824–1832. [Google Scholar] [CrossRef]
  30. Schlaffer, S.; Matgen, P.; Hollaus, M.; Wagner, W. Flood detection from multi-temporal SAR data using harmonic analysis and change detection. Int. J. Appl. Earth Obs. Geoinform. 2015, 38, 15–24. [Google Scholar] [CrossRef]
  31. Ramsar. The List of Wetlands of International Importance; Ramsar: Ramsar, Iran, 2016. [Google Scholar]
  32. Ellenbroek, G.A. Ecology and Productivity of an African Wetland System; Springer: Dordrecht, The Netherlands, 1987; p. 278. [Google Scholar]
  33. McCartney, M.; Houghton-Carr, H. A modelling approach to assess inter-sectoral competition for water resources in the Kafue Flats, Zambia. Water Environ. J. 1998, 12, 101–106. [Google Scholar] [CrossRef]
  34. Mumba, M.; Thompson, J.R. Hydrological and ecological impacts of dams on the Kafue Flats floodplain system, southern Zambia. Phys. Chem. Earth 2005, 30, 442–447. [Google Scholar] [CrossRef]
  35. Wamulume, J.; Landert, J.; Zurbrügg, R.; Nyambe, I.; Wehrli, B.; Senn, D. Exploring the hydrology and biogeochemistry of the dam-impacted Kafue River and Kafue Flats (Zambia). Phys. Chem. Earth Parts A/B/C 2011, 36, 775–788. [Google Scholar] [CrossRef]
  36. Zurbrügg, R.; Wamulume, J.; Kamanga, R.; Wehrli, B.; Senn, D.B. River-floodplain exchange and its effects on the fluvial oxygen regime in a large tropical river system (Kafue Flats, Zambia). J. Geophys. Res. 2012, 117. [Google Scholar] [CrossRef]
  37. Bontemps, S.; Boettcher, M.; Brockmann, C.; Kirches, G.; Lamarche, C.; Radoux, J.; Santoro, M.; Vanbogaert, E.; Wegmüller, U.; Herold, M.; et al. Multi-year global land cover mapping at 300 m and characterization for climate modelling: Achievements of the Land Cover component of the ESA Climate Change Initiative. Int. Arch. Photogramm. Remote Sens. Spat. Inf. Sci. 2015, 40-7/W3, 323–328. [Google Scholar] [CrossRef]
  38. Munyati, C. Wetland change detection on the Kafue Flats, Zambia, by classification of a multitemporal remote sensing image dataset. Int. J. Remote Sens. 2000, 21, 1787–1806. [Google Scholar] [CrossRef]
  39. McCartney, M.P.; Rebelo, L.M.; Mapedza, E.; de Silva, S.; Finlayson, C.M. The Lukanga Swamps: Use, conflicts and management. J. Int. Wildl. Law Policy 2011, 14, 293–310. [Google Scholar]
  40. Jarvis, A.; Reuter, H.; Nelson, A.; Guevara, E. Hole-filled Seamless SRTM Data V4. 2008. Available online: http://srtm.csi.cgiar.org (accessed on 12 July 2014).
  41. Hijmans, R.J.; Cameron, S.E.; Parra, J.L.; Jones, P.G.; Jarvis, A. Very high resolution interpolated climate surfaces for global land areas. Int. J. Climatol. 2005, 25, 1965–1978. [Google Scholar] [CrossRef]
  42. European Space Agency. ENVISAT-1 Products Specifications Volume 9: DORIS Product Specifications; European Space Agency: Paris, France, 2008. [Google Scholar]
  43. Small, D.; Schubert, A. Guide to ASAR Geocoding; University of Zürich: Zürich, Switzerland, 2008. [Google Scholar]
  44. Wagner, W.; Noll, J.; Borgeaud, M.; Rott, H. Monitoring soil moisture over the Canadian Prairies with the ERS scatterometer. IEEE Trans. Geosci. Remote Sens. 1999, 37, 206–216. [Google Scholar] [CrossRef]
  45. Pathe, C.; Wagner, W.; Sabel, D.; Doubkova, M.; Basara, J.B. Using ENVISAT ASAR global mode data for surface soil moisture retrieval over Oklahoma, USA. IEEE Trans. Geosci. Remote Sens. 2009, 47, 468–480. [Google Scholar] [CrossRef]
  46. O’Grady, D.; Leblanc, M.; Bass, A. The use of radar satellite data from multiple incidence angles improves surface water mapping. Remote Sens. Environ. 2014, 140, 652–664. [Google Scholar] [CrossRef]
  47. Van doninck, J.; Wagner, W.; Melzer, T.; De Baets, B.; Verhoest, N.E.C. Seasonality in the angular dependence of ASAR wide swath backscatter. IEEE Geosci. Remote Sens. Lett. 2014, 11, 1423–1427. [Google Scholar] [CrossRef]
  48. Crétaux, J.F.; Jelinski, W.; Calmant, S.; Kouraev, A.; Vuglinski, V.; Bergé-Nguyen, M.; Gennero, M.C.; Nino, F.; Abarca Del Rio, R.; Cazenave, A.; et al. SOLS: A lake database to monitor in the Near Real Time water level and storage variations from remote sensing data. Adv. Space Res. 2011, 47, 1497–1507. [Google Scholar] [CrossRef]
  49. Michailovsky, C.I.; McEnnis, S.; Berry, P.A.M.; Smith, R.; Bauer-Gottwein, P. River monitoring from satellite radar altimetry in the Zambezi River basin. Hydrol. Earth Syst. Sci. 2012, 16, 2181–2192. [Google Scholar] [CrossRef] [Green Version]
  50. Lee, H.; Yuan, T.; Jung, H.C.; Beighley, E. Mapping wetland water depths over the central Congo Basin using PALSAR ScanSAR, Envisat altimetry, and MODIS VCF data. Remote Sens. Environ. 2015, 159, 70–79. [Google Scholar] [CrossRef]
  51. Birkett, C.M. Synergistic remote sensing of Lake Chad variability of basin inundation. Remote Sens. Environ. 2000, 72, 218–236. [Google Scholar] [CrossRef]
  52. Schwatke, C.; Dettmering, D.; Bosch, W.; Seitz, F. DAHITI—An innovative approach for estimating water level time series over inland waters using multi-mission satellite altimetry. Hydrol. Earth Syst. Sci. 2015, 19, 4345–4364. [Google Scholar] [CrossRef]
  53. Förste, C.; Bruinsma, S.; Flechtner, F.; Marty, J.; Lemoine, J.; Dahle, C.; Abrikosov, O.; Neumayer, H.; Biancale, R.; Barthelmes, F.; et al. A new release of EIGEN-6C. In Proceedings of the AGU Fall Meeting 2012, San Francisco, CA, USA, 3–7 December 2012.
  54. Balsamo, G.; Albergel, C.; Beljaars, A.; Boussetta, S.; Brun, E.; Cloke, H.; Dee, D.; Dutra, E.; Muñoz-Sabater, J.; Pappenberger, F.; et al. ERA-Interim/Land: A global land surface reanalysis data set. Hydrol. Earth Syst. Sci. 2015, 19, 389–407. [Google Scholar] [CrossRef]
  55. Ulaby, F.T.; Moore, R.K.; Fung, A.K. Microwave Remote Sensing: Active and Passive—Volume III: From Theory to Applications; Artech House: Norwood, NC, USA, 1986; p. 2162. [Google Scholar]
  56. Verbesselt, J.; Hyndman, R.; Zeileis, A.; Culvenor, D. Phenological change detection while accounting for abrupt and gradual trends in satellite image time series. Remote Sens. Environ. 2010, 114, 2970–2980. [Google Scholar] [CrossRef]
  57. Wilks, D.S. Statistical Methods in the Atmospheric Sciences, 3rd ed.; Academic Press: Cambridge, MA, USA, 2011; p. 704. [Google Scholar]
  58. Bloomfield, P. Fourier Analysis of Time Series—An Introduction, 2nd ed.; John Wiley & Sons: New York, NY, USA, 2000. [Google Scholar]
  59. Lhermitte, S.; Verbesselt, J.; Jonckheere, I.; Nackaerts, K.; van Aardt, J.A.N.; Verstraeten, W.W.; Coppin, P. Hierarchical image segmentation based on similarity of NDVI time series. Remote Sens. Environ. 2008, 112, 506–521. [Google Scholar] [CrossRef]
  60. Kaufman, L.; Rousseeuw, P. Finding Groups in Data: An Introduction to Cluster Analysis; John Wiley & Sons: Hoboken, NJ, USA, 1990; p. 342. [Google Scholar]
  61. Fluet-Chouinard, E.; Lehner, B.; Rebelo, L.M.; Papa, F.; Hamilton, S.K. Development of a global inundation map at high spatial resolution from topographic downscaling of coarse-scale remote sensing data. Remote Sens. Environ. 2015, 158, 348–361. [Google Scholar] [CrossRef]
  62. Rennó, C.D.; Nobre, A.D.; Cuartas, L.A.; Soares, J.V.; Hodnett, M.G.; Tomasella, J.; Waterloo, M.J. HAND, a new terrain descriptor using SRTM-DEM: Mapping terra-firme rainforest environments in Amazonia. Remote Sens. Environ. 2008, 112, 3469–3481. [Google Scholar] [CrossRef]
  63. Lehner, B.; Verdin, K.; Jarvis, A. New global hydrography derived from spaceborne elevation data. Eos Trans. AGU 2008, 89, 93–94. [Google Scholar] [CrossRef]
  64. Albergel, C.; Dorigo, W.; Reichle, R.H.; Balsamo, G.; de Rosnay, P.; Muñoz-Sabater, J.; Isaksen, L.; de Jeu, R.; Wagner, W. Skill and global trend analysis of soil moisture from reanalyses and microwave remote sensing. J. Hydrometeorol. 2013, 14, 1259–1277. [Google Scholar] [CrossRef]
  65. Pulvirenti, L.; Chini, M.; Pierdicca, N.; Guerriero, L.; Ferrazzoli, P. Flood monitoring using multi-temporal COSMO-skymed data: Image segmentation and signature interpretation. Remote Sens. Environ. 2011, 115, 990–1002. [Google Scholar] [CrossRef]
  66. Töyrä, J.; Pietroniro, A.; Martz, L.W. Multisensor hydrologic assessment of a freshwater wetland. Remote Sens. Environ. 2001, 75, 162–173. [Google Scholar] [CrossRef]
  67. Richards, J.A. Remote Sensing with Imaging Radar; Springer: Berlin, Germany, 2009; p. 361. [Google Scholar]
Figure 1. (a) Location of the study area within the Zambezi (violet) and the Kafue River (green) basins; (b) digital elevation model of the study area (Source: Shuttle Radar Topography Mission [40]); (c) land cover (© ESA Climate Change Initiative—Land Cover project 2014, version 1.4 [37]).
Remotesensing 08 00402 g001
Figure 2. Mean monthly rainfall from WorldClim [41] for the Kafue River basin and mean monthly runoff at Itezhi-Tezhi for the period 1978–1991 (source: GRDC).
Remotesensing 08 00402 g002
Figure 3. Mean Aqua MODIS NDVI with 250 m resolution (MYD13Q1) for September in the (a) Kafue Flats and (b) Lukanga Swamps along with location of AOIs. Red lines show ENVISAT altimeter tracks.
Remotesensing 08 00402 g003
Figure 4. ENVISAT ASAR Wide Swath scenes acquired on (a) 10 November 2006 (dry season) and (b) 30 March 2007 (wet season).
Remotesensing 08 00402 g004
Figure 5. ASAR σ 0 time series for different local incidence angle ranges in AOIs A–F as well as soil moisture from ERA-Interim/Land and altimeter water heights in the Kafue Flats (bottom). Dashed lines show fitted harmonic models.
Remotesensing 08 00402 g005
Figure 6. ASAR σ 0 time series for different local incidence angle ranges in AOI G (top) as well as soil moisture from ERA-Interim/Land and altimeter water heights in the Lukanga Swamps (bottom). Dashed lines show fitted harmonic models.
Remotesensing 08 00402 g006
Figure 7. Fitted parameters c i , s i of harmonic model terms (a) i = 1 ; (b) i = 2 and (c) i = 3 for the different AOIs A–F and θ ranges. Line lengths represent amplitudes (a) A 1 ; (b) A 2 and (c) A 3 ; angles between the x axis and the lines represent phase angles (a) ϕ 1 ; (b) ϕ 2 and (c) ϕ 3 .
Remotesensing 08 00402 g007
Figure 8. RGB composite of harmonic terms derived for (a) 15 < θ 25 ; (b) 25 < θ 35 ; (c) 35 < θ 45 . Red: average backscatter; green: amplitude of first harmonic term A 1 ; blue: phase of first harmonic term ϕ 1 given as DoY.
Remotesensing 08 00402 g008
Figure 9. Result of wetlands classification for the entire study area (top) and the Kafue Flats (bottom).
Remotesensing 08 00402 g009
Table 1. Characteristics of selected AOIs.
AOILand CoverAvg. Dry-Season NDVI (–)Size (No. of Pixels)
ASeasonally flooded0.42371
BSeasonally flooded0.40152
CVegetated floodplain0.59170
DTree cover, open0.33755
ERainfed cropland0.271098
FPermanent water−0.131776
GLukanga Swamps0.504537
Table 2. Estimated σ 0 ¯ in dB for each AOI and different ranges of θ.
AOI 15 25 25 35 35 45
A−11.6−14.0−15.1
B−10.9−13.1−14.3
C−6.4−7.6−8.6
D−8.3−8.8−9.3
E−8.4−9.8−10.5
F−10.5−17.0−20.4
G−1.1−3.7−5.2
Table 3. Reclassification table.
AOIClass LabelsClusters
Permanent water16F
Seasonally flooded14A, B
Persistently flooded vegetation15G
Seasonally flooded vegetation3C
Land1, 2, 4–13D, E

