In-Orbit Radiometric Calibration and Stability Monitoring of the PROBA-V Instrument
Abstract
:1. Introduction
2. PROBA-V Instrument
2.1. Instrument Design
2.2. Radiometric Sensor Model
3. Radiometric Calibration Activities during Commissioning Phase
3.1. Absolute Calibration with the OSCAR Libya-4 Desert Method
3.2. Inter-Band Calibration with the OSCAR Deep Convective Clouds Method
3.3. Absolute Calibration with the OSCAR Rayleigh Method
3.4. Dark Current
4. The Operational Phase
4.1. Camera-to-Camera Bias Adjustments
4.2. Stability of the Instrument
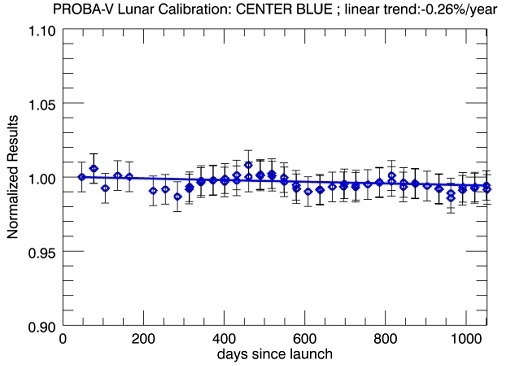
4.2.1. Trending for the CENTER Camera Based on Lunar Observations
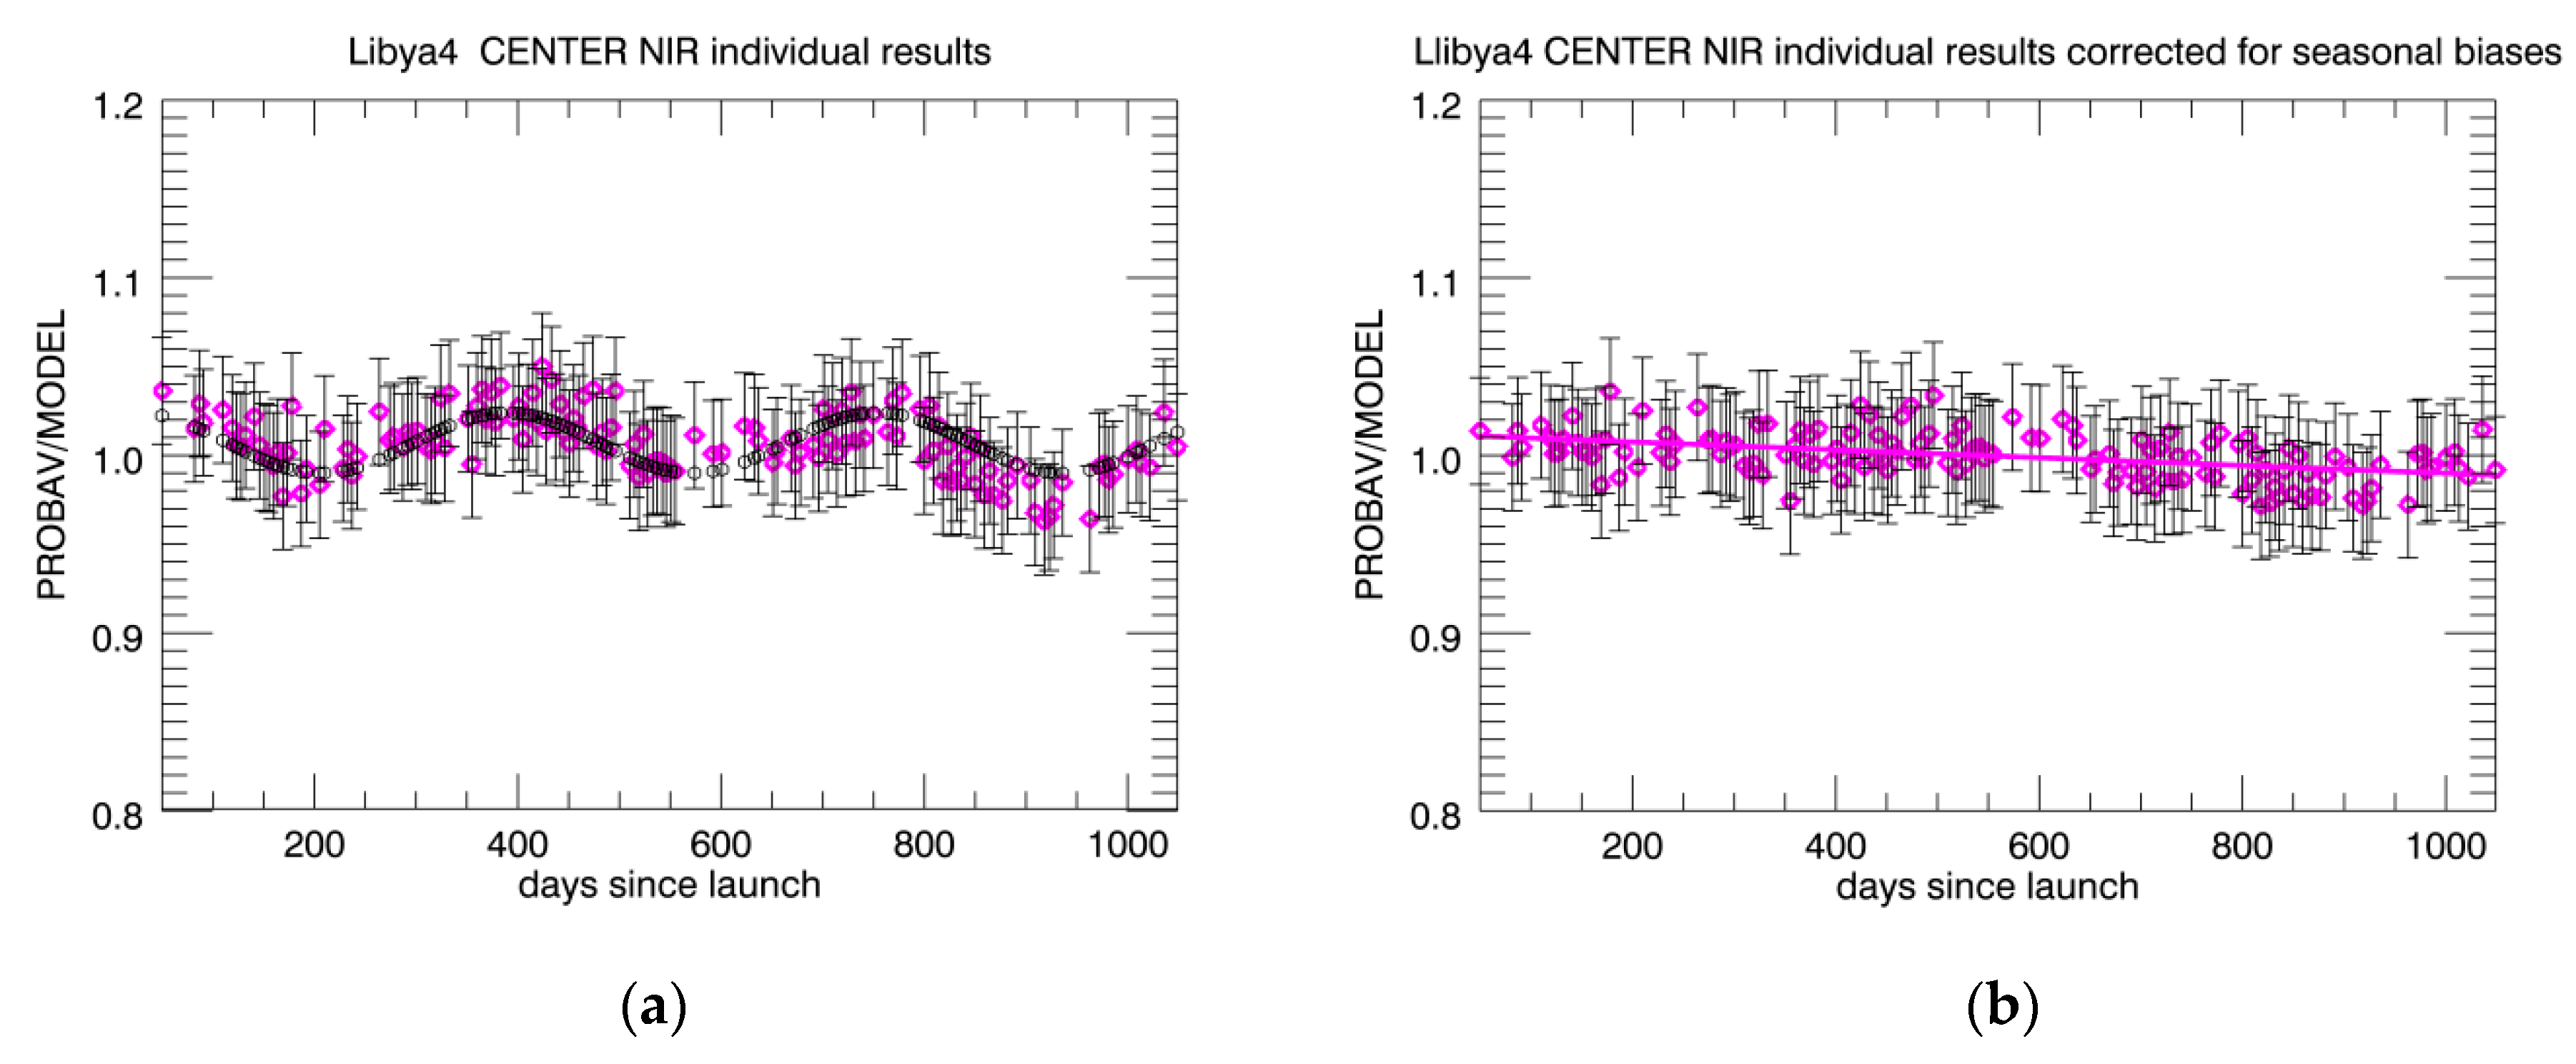
4.2.2. Trending for All Cameras Based on Libya-4 Observations
4.3. Dark Current Evolution
4.3.1. Average Dark Current Evolution
4.3.2. SWIR Dark Current Outliers
5. Independent Validation
- Simulated in-band PROBA-V TOA reflectance resulting from the convolution of simulated hyperspectral TOA reflectance and the PROBA-V VNIR channels spectral response functions. The simulated hyperspectral TOA reflectance over Libya-4 simulations are the output of a coupled surface atmosphere Monte Carlo radiative transfer model fully describing both absorption and scattering events [16]. The surface BRDF model parameters used as input to the radiative transfer model were derived from the inversion of the BRDF surface parameters enabling the TOA model simulations to best mimic four years (2006–2009) of MERIS TOA observations over the site.
- Simulated in-band VGT-2 TOA reflectance. The simulation of the VGT-2 is done following the same approach described in [16] but by substituting the surface BRDF model parameters derived from MERIS TOA observations with BRDF surface parameters, enabling the best mimicking of four years (2006–2009) of VGT-2 TOA observations over the site. Such VGT-2 top-of-atmosphere reflectance are not directly comparable to the PROBA-V observation as the spectral response of these two instruments differs noticeably. This comparison is however useful for Proba-V users that are also VGT-2 historical data users in order to provide estimates of the radiometric (dis)continuity that might exist between the two instrument measurement time series. These differences between PROBA-V and VGT-2 measurements are expected to be a combination of differences both in radiometric calibration and in spectral response functions.
6. Conclusions and Outlook
Acknowledgments
Author Contributions
Conflicts of Interest
References
- Dierckx, W.; Sterckx, S.; Benhadj, I.; Livens, S.; Duhoux, G.; Van Achteren, T.; Francois, M.; Mellab, K.; Saint, G. PROBA-V mission for global vegetation monitoring: Standard products and image quality. Int. J. Remote Sens. 2014, 35, 2589–2614. [Google Scholar] [CrossRef]
- Govaerts, Y.; Sterckx, S.; Adriaensen, S. Use of simulated reflectances over bright desert target as an absolute calibration reference. Remote Sens. Lett. 2013, 4, 523–531. [Google Scholar] [CrossRef]
- Sterckx, S.; Adriaensen, S.; Livens, L. Rayleigh, Deep convective clouds and cross sensor desert vicarious calibration validation for the PROBA-V mission. IEEE Trans. Geosci. Remote Sens. 2013, 51, 1437–1452. [Google Scholar] [CrossRef]
- Sterckx, S.; Benhadj, I.; Duhoux, G.; Livens, S.; Dierckx, W.; Goor, E.; Adriaensen, S.; Heyns, W.; Van Hoof, K.; Strackx, G.; et al. The PROBA-V mission: Image processing and calibration. Int. J. Remote Sens. 2014, 35, 2565–2588. [Google Scholar] [CrossRef]
- Govaerts, Y.M.; Clerici, M. Evaluation of radiative transfer simulations over bright desert calibration sites. IEEE Trans. Geosci. Remote Sens. 2004, 42, 176–187. [Google Scholar] [CrossRef]
- Chen, L.; Hu, X.; Xu, N.; Zhang, P. The application of deep convective clouds in the calibration and response monitoring of the reflective solar bands of fy-3a/mersi (medium resolution spectral imager). Remote Sens. 2013, 5, 6958–6975. [Google Scholar] [CrossRef]
- Fougnie, B.; Bach, R. Monitoring of radiometric sensitivity changes of space sensors using deep convective clouds: Operational application to PARASOL. IEEE Trans. Geosci. Remote Sens. 2009, 47, 851–861. [Google Scholar] [CrossRef]
- Baum, B.A.; Yang, P.; Heymsfield, A.J.; Platnick, S.; King, M.D.; Hu, Y.X.; Bedka, S.M. Bulk scattering models for the remote sensing of ice clouds: Part 2: Narrowband models. J. Appl. Meteorol. 2005, 44, 1896–1911. [Google Scholar] [CrossRef]
- Hagolle, O.; Goloub, P.; Deschamps, P.-Y.; Cosnefroy, H.; Briottet, X.; Bailleul, T.; Nicolas, J.-M.; Parol, F.; Lafrance, B.; Herman, M. Results of polder in-flight calibration. IEEE Trans. Geosci. Remote Sens. 1999, 37, 1550–1566. [Google Scholar] [CrossRef] [Green Version]
- Shettle, E.; Fenn, R.W. Models for the Aerosols of the Lower Atmosphere and the Effects of Humidity Variations on their Optical Properties; Environment. Research. Paper. No. 676; AFGL-AFSC: Hanscom AFB, MA, USA, 1979. [Google Scholar]
- Morel, A.; Claustre, H.; Gentili, B. The most oligotrophic subtropical zones of the global ocean: similarities and differences in terms of chlorophyll and yellow substance. Biogeosci. Discuss. 2010, 7, 5047–5079. [Google Scholar] [CrossRef]
- Kieffer, H.; Stone, T.C. The spectral irradiance of the Moon. Astron. J. 2005, 129, 2887–2901. [Google Scholar] [CrossRef]
- Stone, T.C.; Rossow, W.B.; Ferrier, J.; Finkelman, L.M. Evaluation of ISCCP multisatellite radiance calibration for geostationary imager visible channels using the Moon. IEEE Trans. Geosci. Remote Sens. 2013, 51, 1255–1266. [Google Scholar] [CrossRef]
- Bentell, J.; Van der Zanden, K.; Colin, T.; Herftijd, S.; Merken, P.; Vermeiren, J.A. Comparitive study of the MSI and Proba-V linear arrays under the influence of radiation. In Proceedings of the Fourth International Workshop on Analogue and Mixed Signal Integrated Circuits for Space Applications (AMICSA), Noordwijk, The Netherlands, 26–28 August 2012.
- Hopkinson, G.R. Radiation-induced dark current increases in CCDs. In Proceedings of the Second European Conference on Radiation and its Effects on Components and Systems (RADECS), St. Malo, France, 13–16 September 1993; pp. 401–408.
- Bouvet, M. Radiometric comparison of multispectral imagers over a pseudo-invariant calibration site using a reference radiometric model. Remote Sens. Environ. 2014, 140, 141–154. [Google Scholar]
- Adriaensen, S.; Barker, K.; Bourg, L.; Bouvet, M.; Fougnie, B.; Govaerts, Y.; Henry, P.; Kent, C.; Smith, D.; Sterckx, S. CEOS Ivos Working Group 4: Intercomparison of Vicarious Calibration and Radiometric Intercomparison over Pseudo-Invariant Calibration Sites. 2012. Available online: http://calvalportal.ceos.org/ceos-wgcv/ivos/wg4/final-report (accessed on 20 June 2016).
- Lachérade, S.; Fougnie, B.; Henry, P.; Gamet, P. Cross Calibration over Desert Sites: Description, Methodology, and Operational Implementation. IEEE Trans. Geosci. Remote Sens. 2013, 51, 1098–1113. [Google Scholar] [CrossRef]


| BAND | LEFT Camera | CENTER Camera | RIGHT Camera | |||
|---|---|---|---|---|---|---|
| AVG | STDEV | AVG | STDEV | AVG | STDEV | |
| BLUE | 1.009 | 0.013 | 0.993 | 0.017 | 1.034 | 0.013 |
| RED | 1.045 | 0.006 | 1.039 | 0.011 | 1.068 | 0.011 |
| NIR | 1.083 | 0.011 | 1.086 | 0.013 | 1.100 | 0.017 |
| SWIR1 | 1.035 | 0.009 | 1.011 | 0.013 | 1.003 | 0.009 |
| SWIR2 | 1.011 | 0.006 | 1.012 | 0.006 | 0.994 | 0.017 |
| SWIR3 | 1.008 | 0.010 | 1.022 | 0.010 | 1.035 | 0.013 |
| BAND | LEFT Camera | CENTER Camera | RIGHT Camera | |||
|---|---|---|---|---|---|---|
| AVG | STDEV | AVG | STDEV | AVG | STDEV | |
| BLUE | 0.998 | 0.018 | 1.030 | 0.018 | 1.006 | 0.013 |
| RED | 0.998 | 0.015 | 1.004 | 0.016 | 1.011 | 0.016 |
| Band | Camera | OSCAR Libya-4 Linear Trend (%/year) | OSCAR Libya-4 95% Confidence Interval of the Linear Temporal Trend (%/year) | Moon Linear Trend (%/year) | Moon 95% Confidence Interval of the Linear Temporal Trend (%/year) |
|---|---|---|---|---|---|
| BLUE | LEFT | –0.63 | 0.28 | - | - |
| BLUE | CENTER | –0.46 | 0.28 | –0.26 | 0.14 |
| BLUE | RIGHT | –0.51 | 0.19 | - | - |
| RED | LEFT | –0.13 | 0.14 | - | - |
| RED | CENTER | –0.08 | 0.20 | 0.32 | 0.13 |
| RED | RIGHT | –0.24 | 0.17 | - | - |
| NIR | LEFT | –0.85 | 0.18 | - | - |
| NIR | CENTER | –0.80 | 0.26 | –0.12 | 0.15 |
| NIR | RIGHT | –0.58 | 0.20 | - | - |
| SWIR1 | LEFT | –1.44 | 0.22 | - | - |
| SWIR2 | LEFT | –1.70 | 0.32 | - | - |
| SWIR3 | LEFT | –1.63 | 0.41 | - | - |
| SWIR1 | CENTER | –1.25 | 0.45 | - | - |
| SWIR2 | CENTER | –1.40 | 0.39 | –0.17 | 0.21 |
| SWIR3 | CENTER | –1.31 | 0.39 | - | - |
| SWIR1 | RIGHT | –1.39 | 0.32 | - | - |
| SWIR2 | RIGHT | –1.96 | 0.27 | - | - |
| SWIR3 | RIGHT | –1.74 | 0.33 | - | - |
| Band | a (1) (LSB/s/day) | b (1) (LSB/s) | R² | EOL (2) (LSB) |
|---|---|---|---|---|
| Left Blue | 0.110 | 37.22 | 0.995 | 1.32 |
| Left Red | 0.044 | 15.40 | 0.988 | 0.53 |
| Left NIR | 0.039 | 13.17 | 0.992 | 0.47 |
| Center Blue | 0.115 | 37.86 | 0.995 | 1.37 |
| Center Red | 0.045 | 15.28 | 0.993 | 0.54 |
| Center NIR | 0.039 | 13.48 | 0.989 | 0.47 |
| Right Blue | 0.129 | 35.60 | 0.995 | 1.50 |
| Right Red | 0.050 | 14.54 | 0.996 | 0.59 |
| Right NIR | 0.043 | 12.96 | 0.987 | 0.51 |
| Band | a (LSB/s/day) (1) | b(LSB/s) (1) | R² | EOL (2) Dark (LSB) |
|---|---|---|---|---|
| L SWIR1 | 0.031 | 22.01 | 0.968 | 1.46 |
| L SWIR2 | 0.059 | 26.74 | 0.990 | 2.50 |
| L SWIR3 | 0.046 | 20.50 | 0.979 | 1.95 |
| C SWIR1 | 0.046 | 18.82 | 0.994 | 1.92 |
| C SWIR2 | 0.050 | 22.68 | 0.992 | 2.10 |
| C SWIR3 | 0.023 | 14.69 | 0.978 | 1.05 |
| R SWIR1 | 0.070 | 21.84 | 0.991 | 2.77 |
| R SWIR2 | 0.081 | 25.37 | 0.996 | 3.22 |
| R SWIR3 | 0.066 | 21.22 | 0.993 | 2.61 |
| Band | BAD Pixel (ID L1A) |
|---|---|
| Left SWIR1 | 28,298,352,644,956 |
| Left SWIR2 | 711,863 |
| Left SWIR3 | 90,172,419,438,759,761 |
| Center SWIR1 | 1021 |
| Center SWIR2 | 57,295,769,900 |
| Center SWIR3 | 29,30,476,640,763,889,890,917,938, 994 |
| Right SWIR1 | |
| Right SWIR2 | 14,438,470 |
| Right SWIR3 |
| Band | Slope of Regression (1) (#pixels/day) | Intercept of Regression (1) | R² | # HDC Pixels at EOL (2) | # HDC Pixels on 01/03/2016 | # Pixels with Dark >40LSB @IT=24 ms on 01/03/2016 |
|---|---|---|---|---|---|---|
| L SWIR1 | 0.0791 | 13.05 | 0.98 | 145 | 73 | 11 |
| L SWIR2 | 0.1283 | 13.00 | 0.99 | 227 | 112 | 2 |
| L SWIR3 | 0.3845 | 80.59 | 0.81 | 721 | 512 | 31 |
| C SWIR1 | 0.1191 | 2.13 | 0.99 | 200 | 95 | 6 |
| C SWIR2 | 0.1179 | 8.16 | 0.99 | 204 | 102 | 6 |
| C SWIR3 | 0.0619 | 17.09 | 0.94 | 120 | 64 | 15 |
| R SWIR1 | 0.1509 | 11.11 | 0.99 | 262 | 130 | 4 |
| R SWIR2 | 0.1566 | −6.39 | 0.98 | 254 | 125 | 6 |
| R SWIR3 | 0.125 | −2.35 | 0.97 | 206 | 103 | 2 |
| % of total pixels | 25.39 | 14.28 | 0.90 | |||
| Band | TMA | # acq. | # disc. acq. (1) | Mean diff (2) (%) | 95% conf. (3) (%) | Stdev (4) (%) | Linear Trend (5) (%/year) | 95% conf. Trend (6) (%/year) |
|---|---|---|---|---|---|---|---|---|
| BLUE | LEFT | 186 | 14 | −1.82 | 0.18 | 1.2 | 0.05 | 0.26 |
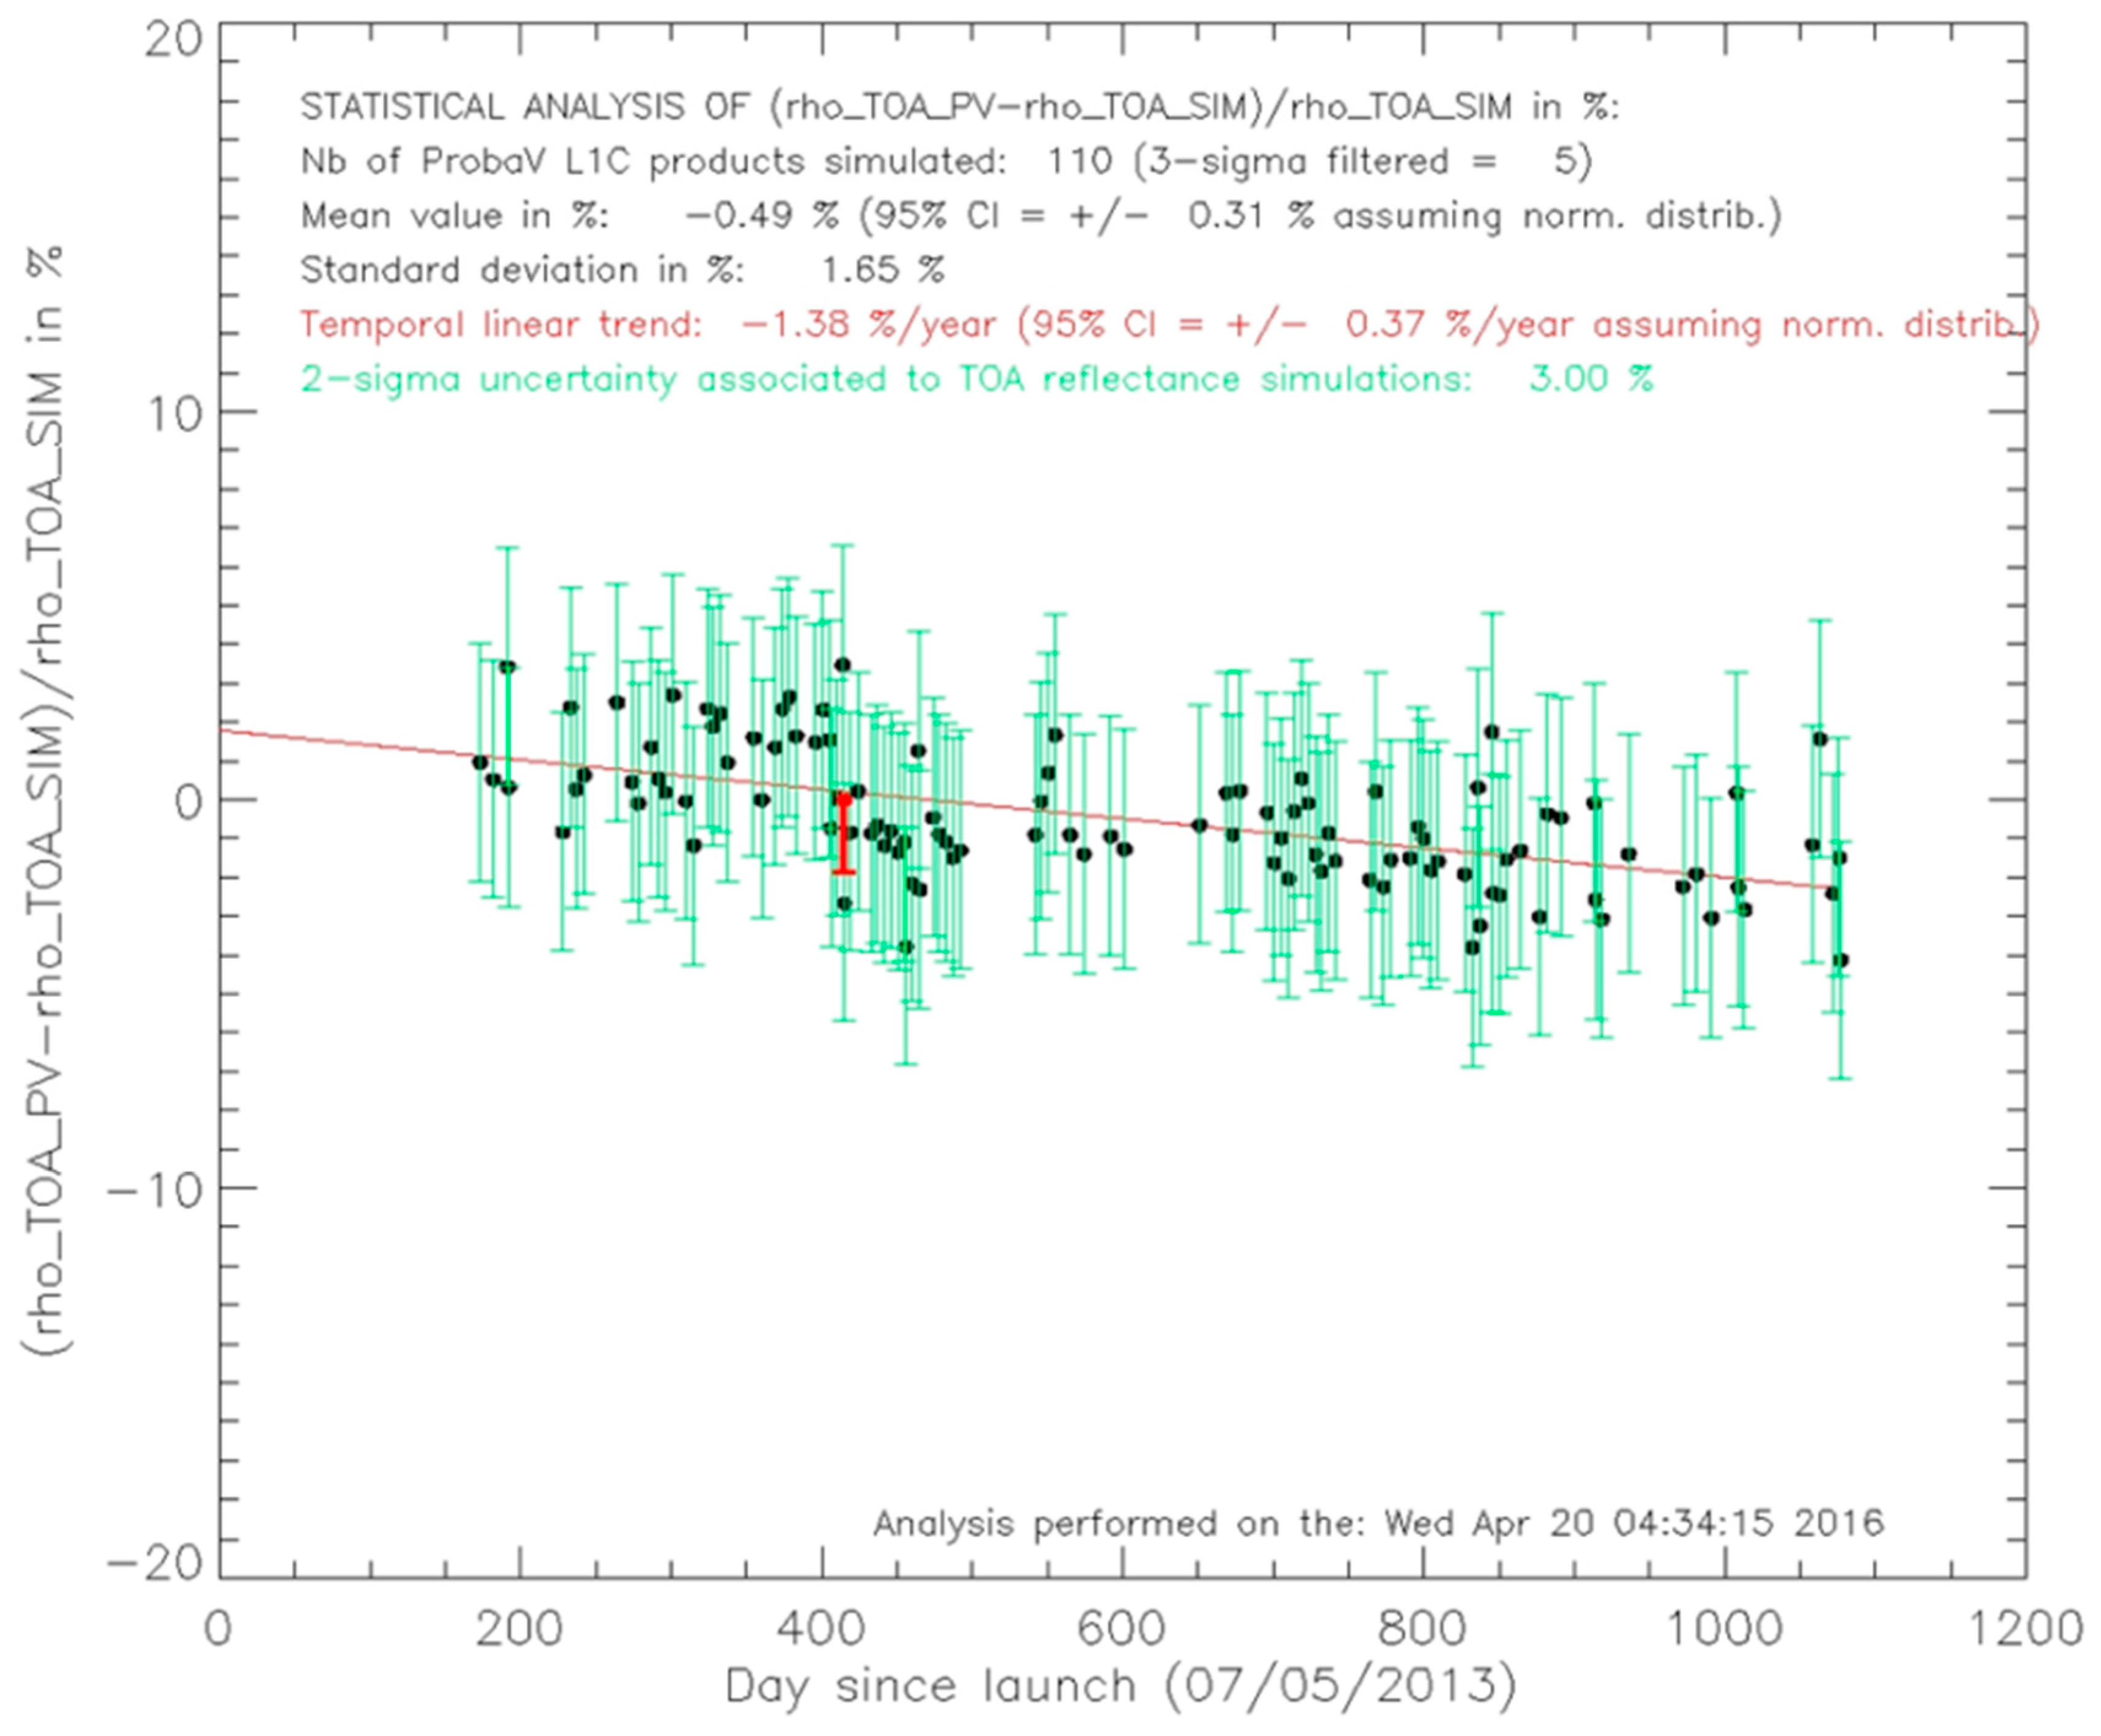
| BLUE | CENTER | 110 | 5 | −0.49 | 0.31 | 1.65 | −1.38 | 0.37 |
| BLUE | RIGHT | 193 | 8 | −2.15 | 0.12 | 0.84 | 0.19 | 0.17 |
| RED | LEFT | 193 | 7 | −1.73 | 0.14 | 0.95 | −0.17 | 0.2 |
| RED | CENTER | 110 | 5 | −0.54 | 0.25 | 1.32 | −1.49 | 0.23 |
| RED | RIGHT | 189 | 12 | −0.84 | 0.14 | 0.95 | −0.05 | 0.2 |
| NIR | LEFT | 189 | 11 | −2.43 | 0.26 | 1.81 | −0.07 | 0.4 |
| NIR | CENTER | 108 | 7 | −1.28 | 0.26 | 1.36 | −0.34 | 0.38 |
| NIR | RIGHT | 192 | 9 | −1.75 | 0.26 | 1.81 | 0.15 | 0.37 |
| Band | TMA | # acq. | # Disc. acq. (1) | Mean diff (2) (%) | 95% conf. (3) (%) | Stdev (4) (%) | Linear Trend (5) (%/year) | 95% conf. Trend (6) (%/year) |
|---|---|---|---|---|---|---|---|---|
| BLUE | LEFT | 188 | 12 | 1.73 | 0.23 | 1.58 | 0.05 | 0.34 |
| BLUE | CENTER | 110 | 5 | 4.49 | 0.34 | 1.77 | −1.41 | 0.41 |
| BLUE | RIGHT | 193 | 8 | 2.02 | 0.17 | 1.2 | 0.11 | 0.24 |
| RED | LEFT | 193 | 7 | 1.57 | 0.16 | 1.1 | −0.13 | 0.23 |
| RED | CENTER | 110 | 5 | 2.15 | 0.26 | 1.35 | −1.44 | 0.26 |
| RED | RIGHT | 187 | 14 | 1.99 | 0.16 | 1.12 | −0.02 | 0.23 |
| NIR | LEFT | 188 | 12 | 0.76 | 0.26 | 1.76 | 0 | 0.38 |
| NIR | CENTER | 108 | 7 | 2.61 | 0.28 | 1.44 | −0.37 | 0.4 |
| NIR | RIGHT | 187 | 14 | 3.57 | 0.29 | 1.97 | 0.09 | 0.41 |
| SWIR1 | LEFT | 107 | 7 | −0.95 | 0.26 | 1.35 | −0.48 | 0.39 |
| SWIR1 | CENTER | 50 | 3 | 0.63 | 0.41 | 1.43 | −0.71 | 0.54 |
| SWIR1 | RIGHT | 51 | 4 | −0.1 | 0.49 | 1.74 | −0.92 | 0.67 |
| SWIR2 | LEFT | 75 | 5 | 0.29 | 0.25 | 1.07 | −0.74 | 0.33 |
| SWIR2 | CENTER | 41 | 1 | 0.57 | 0.52 | 1.66 | −0.51 | 0.77 |
| SWIR2 | RIGHT | 77 | 3 | −0.59 | 0.3 | 1.31 | −0.1 | 0.43 |
| SWIR3 | LEFT | 54 | 5 | 0.54 | 0.38 | 1.4 | −0.52 | 0.53 |
| SWIR3 | CENTER | 52 | 1 | 0.64 | 0.61 | 2.22 | −0.31 | 0.96 |
| SWIR3 | RIGHT | 107 | 7 | −3.42 | 0.2 | 1.01 | 0.66 | 0.26 |
© 2016 by the authors; licensee MDPI, Basel, Switzerland. This article is an open access article distributed under the terms and conditions of the Creative Commons Attribution (CC-BY) license (http://creativecommons.org/licenses/by/4.0/).
Share and Cite
Sterckx, S.; Adriaensen, S.; Dierckx, W.; Bouvet, M. In-Orbit Radiometric Calibration and Stability Monitoring of the PROBA-V Instrument. Remote Sens. 2016, 8, 546. https://doi.org/10.3390/rs8070546
Sterckx S, Adriaensen S, Dierckx W, Bouvet M. In-Orbit Radiometric Calibration and Stability Monitoring of the PROBA-V Instrument. Remote Sensing. 2016; 8(7):546. https://doi.org/10.3390/rs8070546
Chicago/Turabian StyleSterckx, Sindy, Stefan Adriaensen, Wouter Dierckx, and Marc Bouvet. 2016. "In-Orbit Radiometric Calibration and Stability Monitoring of the PROBA-V Instrument" Remote Sensing 8, no. 7: 546. https://doi.org/10.3390/rs8070546
APA StyleSterckx, S., Adriaensen, S., Dierckx, W., & Bouvet, M. (2016). In-Orbit Radiometric Calibration and Stability Monitoring of the PROBA-V Instrument. Remote Sensing, 8(7), 546. https://doi.org/10.3390/rs8070546


