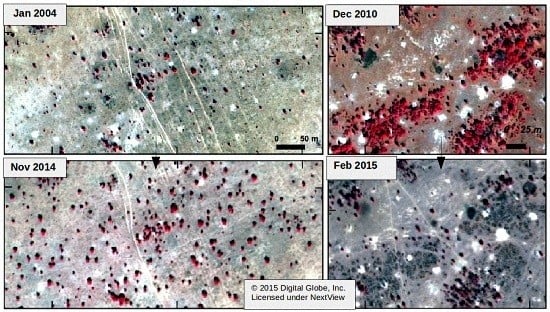
Article

Woody Vegetation Die off and Regeneration in Response to Rainfall Variability in the West African Sahel

1
Department of Geosciences and Natural Resource Management, University of Copenhagen, 1350 Copenhagen, Denmark
2
Data Center Sioux Falls, Earth Resources Observation Systems (EROS), US Geological Survey (USGS), SD 57198, USA
3
Centre de Suivi Ecologique, BP 15532 Dakar-Fann, Senegal
4
ICRAF (World Agroforestry Center), Science Domain 6, 00100 Nairobi, Kenya
*
Author to whom correspondence should be addressed.
Remote Sens. 2017, 9(1), 39; https://doi.org/10.3390/rs9010039
Submission received: 9 November 2016 / Revised: 26 December 2016 / Accepted: 1 January 2017 / Published: 5 January 2017
(This article belongs to the Special Issue Remote Sensing of Land Degradation and Drivers of Change)

Abstract

:
The greening in the Senegalese Sahel has been linked to an increase in net primary productivity, with significant long-term trends being closely related to the woody strata. This study investigates woody plant growth and mortality within greening areas in the pastoral areas of Senegal, and how these dynamics are linked to species diversity, climate, soil and human management. We analyse woody cover dynamics by means of multi-temporal and multi-scale Earth Observation, satellite based rainfall and in situ data sets covering the period 1994 to 2015. We find that favourable conditions (forest reserves, low human population density, sufficient rainfall) led to a rapid growth of Combretaceae and Balanites aegyptiaca between 2000 and 2013 with an average increase of 4% woody cover. However, the increasing dominance and low drought resistance of drought prone species bears the risk of substantial woody cover losses following drought years. This was observed in 2014–2015, with a die off of Guiera senegalensis in most places of the study area. We show that woody cover and woody cover trends are closely related to mean annual rainfall, but no clear relationship with rainfall trends was found over the entire study period. The observed spatial and temporal variation contrasts with the simplified labels of “greening” or “degradation”. While in principal a low woody plant diversity negatively impacts regional resilience, the Sahelian system is showing signs of resilience at decadal time scales through widespread increases in woody cover and high regeneration rates after periodic droughts. We have reaffirmed that the woody cover in Sahel responds to its inherent climatic variability and does not follow a linear trend.

Graphical Abstract

1. Introduction

Changes in the Sahelian environment have been the focus of a plethora of ecological research since the major drought years of the 1980s [1,2,3]. The rich and diverse scientific literature, covering various temporal and spatial scales, often disagrees with the overall trends of environmental change [4] but recent research suggests the Sahel is an unstable but resilient ecosystem which is steadily recovering from prolonged droughts and below average rainfall conditions [5]. The potential of recovery is especially favoured in areas of low human pressure and population density [5], and after droughts in the 1980s had caused a serious reduction in woody cover [6], new studies have shown that the sparsely populated pastoral zones of eastern Senegal witnessed an increase in woody vegetation over the past decades [7]. This increase in woody plants seems to be followed by increased dominance of xeric plants [8,9] and causes declines in species diversity at the cost of ecosystem services (e.g., fruits and leaves for food and fodder, wood products for construction and medical purposes). Hiernaux et al. [10] showed that pioneer species (e.g., Leptadenia pyrotechnica, Guiera senegalensis or Calotropis procera) can rapidly populate these areas affected by drought-induced woody plant mortality. However, neither degradation nor recovery is spatially uniform, and several studies have shown the importance of soil type, soil permeability and available root depth as major factors influencing water availability and thus woody plant survival during drought and recovery [10,11,12]. Especially on shallow soils, soil degradation becomes a severe problem in the Senegalese Sahel if too many trees are lost, either by drought or human overuse [13,14]. Human management (e.g., cutting, burning, conservation laws, grazing pressure) also plays an important role in woody cover dynamics in the Sahel [6].
Since the 1980s, remote sensing has been a valuable tool to monitor both global and regional vegetation over long time scales at high temporal frequency [15,16]. However, due to the coarse resolution of the imagery (≥250 m), the distinction between the woody and herbaceous strata has been unattainable and vegetation trends have been interpreted as general changes in net primary productivity. Recently, several studies suggested a phenology based method to separate the signal of the woody and herbaceous plants [17,18,19]. The study by Brandt et al. [17] is calibrated by in situ woody cover data from Senegal, Niger and Mali and is able to quantify and monitor woody cover changes over the entire Sahel, suggesting large scale increases in the eastern parts of Senegal [17]. However, without detailed in situ observations from “woody greening” areas, it remains unclear what species and biophysical mechanisms are causing the observed patterns and trends. Moreover, long-term trends do not provide information on inter-annual dynamics in woody cover and how dry and wet periods affect the overall recruitment, growth and mortality of woody stratum. Ultimately, an improved understanding of the biophysical mechanisms driving woody vegetation dynamics is vital to addressing the resilience and robustness of dryland ecosystems in the context of climate change and natural resource management [20].
Here we aim to investigate woody plant growth and mortality in pastoral central Senegal (western Sahel) and explore the species composition of woody cover change, and how these changes relate to rainfall dynamics, human management and soil type. To achieve this, we link multi-temporal and spatial Earth Observation (EO) data and various field observation data sets spanning from 1994 to 2015.

2. Materials and Methods

This study applies the phenology–based methodology [17,18,19] to estimate woody cover with EO based metrics derived from moderate resolution satellite imagery. The method is based on the assumption that herbaceous vegetation is not green between late October and late June–a period when only the woody vegetation layer has green leaves. Thus, while the satellite images do not measure woody cover directly, the method senses green foliage density present in the dry season as a proxy for woody cover. The EO-based annual woody cover maps are used for trend analysis from 2000 to 2015, and areas of significant woody cover increases were visited in the field (2015) to identify the species composition. The EO based analysis is supported by in situ measurements every two years at several sites (1998–2015). Repeat photography (1994 and 2015) and very detailed satellite images (2004–2015) at a 50 cm resolution document and illustrate observed dynamics.

2.1. Study Area

The study area includes the pastoral areas of central and eastern Senegal and is well described in Diouf et al. [21], Tappan et al. [13] and Brandt et al. [11]. Current vegetation patterns are the product of the complex interactions between climate, biology, geomorphology, soils, fauna, fire, and human activity over time (see Figure A1, Figure A2, Figure A3, Figure A4, Figure A5 and Figure A6 and Table 1). Soils play an important role in defining the contrasting character of the western and eastern parts of the study region. Generally, the western part has sandy soils (Sandy Ferlo), whereas the eastern part has stony and shallow ferrugineous soils (Ferrugineous Ferlo) intersected by a fossil valley system (Figure 1). The pastoral areas of Senegal receive on average 450 mm of annual rainfall and experienced both periods of low rainfall (2000–2002, 2011, 2013, and 2014) and above average rainfall (2008–2010) [21].

2.2. Satellite Data

MODIS (Moderate Resolution Imaging Spectroradiometer) MCD43A4 Collection 5, a BRDF (Bidirectional Reflectance Distribution Function) corrected reflectance product available at 8 day temporal and 500 m spatial resolution was applied for the woody cover estimation. Normalised Difference Vegetation Index (NDVI) was calculated from the red and near infrared bands as a proxy for green vegetation [22]. All values flagged as good quality between 8 October and 9 June were averaged for each dry season (i.e., lasting from October to June next calendar year). In this study, the mean dry season NDVI is representing the mean dry season green foliage mass of the woody vegetation [17,18,19].
Very high spatial resolution (VHR) satellite images from the Geoeye 1, Quickbird 2 and Worldview 2 sensors were acquired within the NextView License program for the field sites covering the period 2004 to 2015. All scenes are dated during the dry season between November and February where there is no green annual herbaceous vegetation and when only the woody vegetation layer has green leaves. Raw data was ortho-rectified and digital numbers were converted to top-of-atmosphere reflectance. False colour composites (near infrared, red, green) were pan-sharpened to 50 cm resolution, to allow identification of photosynthetically active woody vegetation in various hues of red. VHR images were used for visual comparison and no quantification was made.
The rainfall products used in this study were produced by NOAA’s Climate Prediction Center specifically for United States Agency for International Development (USAID) Famine Early Warning Systems (FEWS) to assist in drought monitoring activities over Africa [23]. RFE v2.0 is a blended product based on cold cloud duration derived from Meteosat thermal infrared, estimates from the Special Sensor Microwave Imagery and the Advanced Microwave Sounding Unit, and daily station rainfall data [24]. ARC2 extends the period to 1983 using the same algorithm but less input channels [25]. Meteosat based rainfall products have shown to be reliable at annual scale [23,24].

2.3. Estimating Woody Cover Dynamics from Sahel-Wide in Situ Data and Satellite Time Series

This study applies a method developed by Brandt et al. [17] and Brandt et al. [26] and the description here is kept to the basic principles (Figure S1). Woody cover was measured at 77 sites in Senegal, Mali and Niger between 2000 and 2015. In total, we used 178 measurements to develop an EO-based model for woody cover estimation. For the sites in Mali and Senegal, the canopy cover of all individuals was measured in 4 circular plots along a 1 km transect line, spaced at 200 m intervals. The circular plots commonly have a 20 m radius and the height, basal diameter and crown coverage of all woody plants within the plot was measured. For each transect, the woody cover was averaged over 4 plots. Although transects in Niger were shorter (300 m × 100 m), they represent larger areas. As woody cover cannot be directly measured by coarse satellite data, the dry season green foliage density is used as a proxy for woody cover. The field data was used to calculate the mean green foliage density from October to June for each site, which is an average weighted by the contribution (%) of each species to the woody canopy cover i.e., the norm of foliage density per unit canopy over time [17,26].
A regression between the dry season foliage density and the mean dry season NDVI was used to estimate woody cover at annual time steps. Water availability impacts on the foliage density of a given year causing inter-annual fluctuations which hide actual changes in the woody populations. We thus used the wet season peak NDVI as a proxy for the year’s rainfall and growing conditions, to correct the dry season NDVI and remove the effects of varying foliage density. If a significant relationship between wet season NDVI peak and dry season NDVI was observed, a regression was used to predict the dry season NDVI with the wet season peak NDVI, following the concept described in Bégué et al. [27]. The residues between predicted and observed NDVI were used to remove the effects of rainfall. In this way, a stronger relationship between annual dry season NDVI and woody populations is achieved and the influence of inter-annual foliage mass variations is attenuated. Annual in situ data on green foliage density was then correlated with the corresponding corrected dry season NDVI to establish the model and predict the woody cover using the regression coefficients. To transform the projected foliage density to the unit woody cover, pixel values of the final annual maps were divided by the mean foliage density of Sahelian woody species [17]. This corrects partly for the fact that the model was established with dry season foliage density and omitting the rainy season part. Finally, a Theil-Sen trend analysis was applied to estimate the direction, pattern, and magnitude of woody cover trends. The resulting trend map was multiplied by the number of years to obtain the change in percent woody cover over the full period of analysis. The linear trends of the estimated woody cover are in line with the trends observed at field sites (R2 = 0.75) [17].

2.4. In Situ Woody Cover Measurements (5 CSE Sites)

Data collection in Senegal was conducted by the Centre de Suivi Ecologique (CSE). Although measurements for 24 CSE sites are available, multi-year in situ woody cover data without gaps are only available for five sites for the years 1998, 2000, 2002, 2005, 2007, 2009, 2013 and 2015. These sites are part of the model calibration and used for in situ monitoring of temporal woody cover dynamics within the study area, supporting the EO-based approach (Figure 2).

2.5. In Situ Woody Species Measurements (21 2015 Field Sites)

Fieldwork was conducted in September–October 2015 to obtain a detailed in situ based analysis of areas of woody cover increases. Located within areas of EO-based positive woody cover change, 21 sites were selected and all individuals of woody species were surveyed within circular plots (20 m radius) along 500 m transect lines. For each transect, three circular plots were spaced at 250 m intervals. The survey was developed to spatially match the pixel resolution of the MODIS imagery. Woody plants were classified as either old (>5 cm) or young (including resprouted plants) (<5 cm) based on trunk diameter. Reforestation areas were omitted.

2.6. Repeat Photography

Analogue colour photos taken in 1983 and 1994 were printed and 32 sites revisited between 2013 and 2015 to retake digital photos with the same framing [8]. Only the 1994 images have exact GPS coordinates, so not all photo pairs could be framed in an identical way. The photos taken between 2013 and 2015 include GPS coordinates and geographic direction. While exact matching of landscape features (individual trees, etc.) was not achieved for all of the historical photos, they still provide a unique window into the past and give an impression of the landscape and the vegetation trends through time.

2.7. Mapping Negative Anomalies in Woody Cover

To test how the exceptionally low rainfall in 2014 (following several years of below average rainfall) affected the woody vegetation in the study area, woody cover anomalies (deviations compared to the 2000–2015 period) were calculated from EO based woody cover estimations for 2014–2015 and areas of exceptionally loss of woody cover were mapped. The MODIS fire product MCD45A1 was used to mask out pixels where bush-fires occurred within this period to isolate drought induced woody cover anomalies not impacted by fires.

2.8. Relation between Woody Vegetation and Rainfall

To test the patterns and response of woody population trends to rainfall, a Spearman rank correlation (rho) was conducted between in situ measured woody cover from 2000 to 2015 at all 24 CSE monitoring sites (Figure 1a) and ARC2 rainfall at the corresponding site. In detail, we compared (1) mean woody cover with mean annual rainfall; (2) woody cover trends with mean annual rainfall; (3) woody cover trends with rainfall trends; (4) annual woody cover with annual rainfall, and rainfall with a 1, 2 and 3 year lag; and (5) annual woody cover with integrated rainfall over 1 to 7 years. The effect of soils was tested by splitting the sites into two groups of sandy and shallow soils, respectively. Note that woody cover was measured in June before the rainy season starts, so the rainfall of the previous year was attributed to the surveys. For example, woody cover of 2015 compared with rainfall of 2014 means no lag, and a 1 year lag uses rainfall of 2013.

3. Results

3.1. Woody Cover Changes in 2000–2015

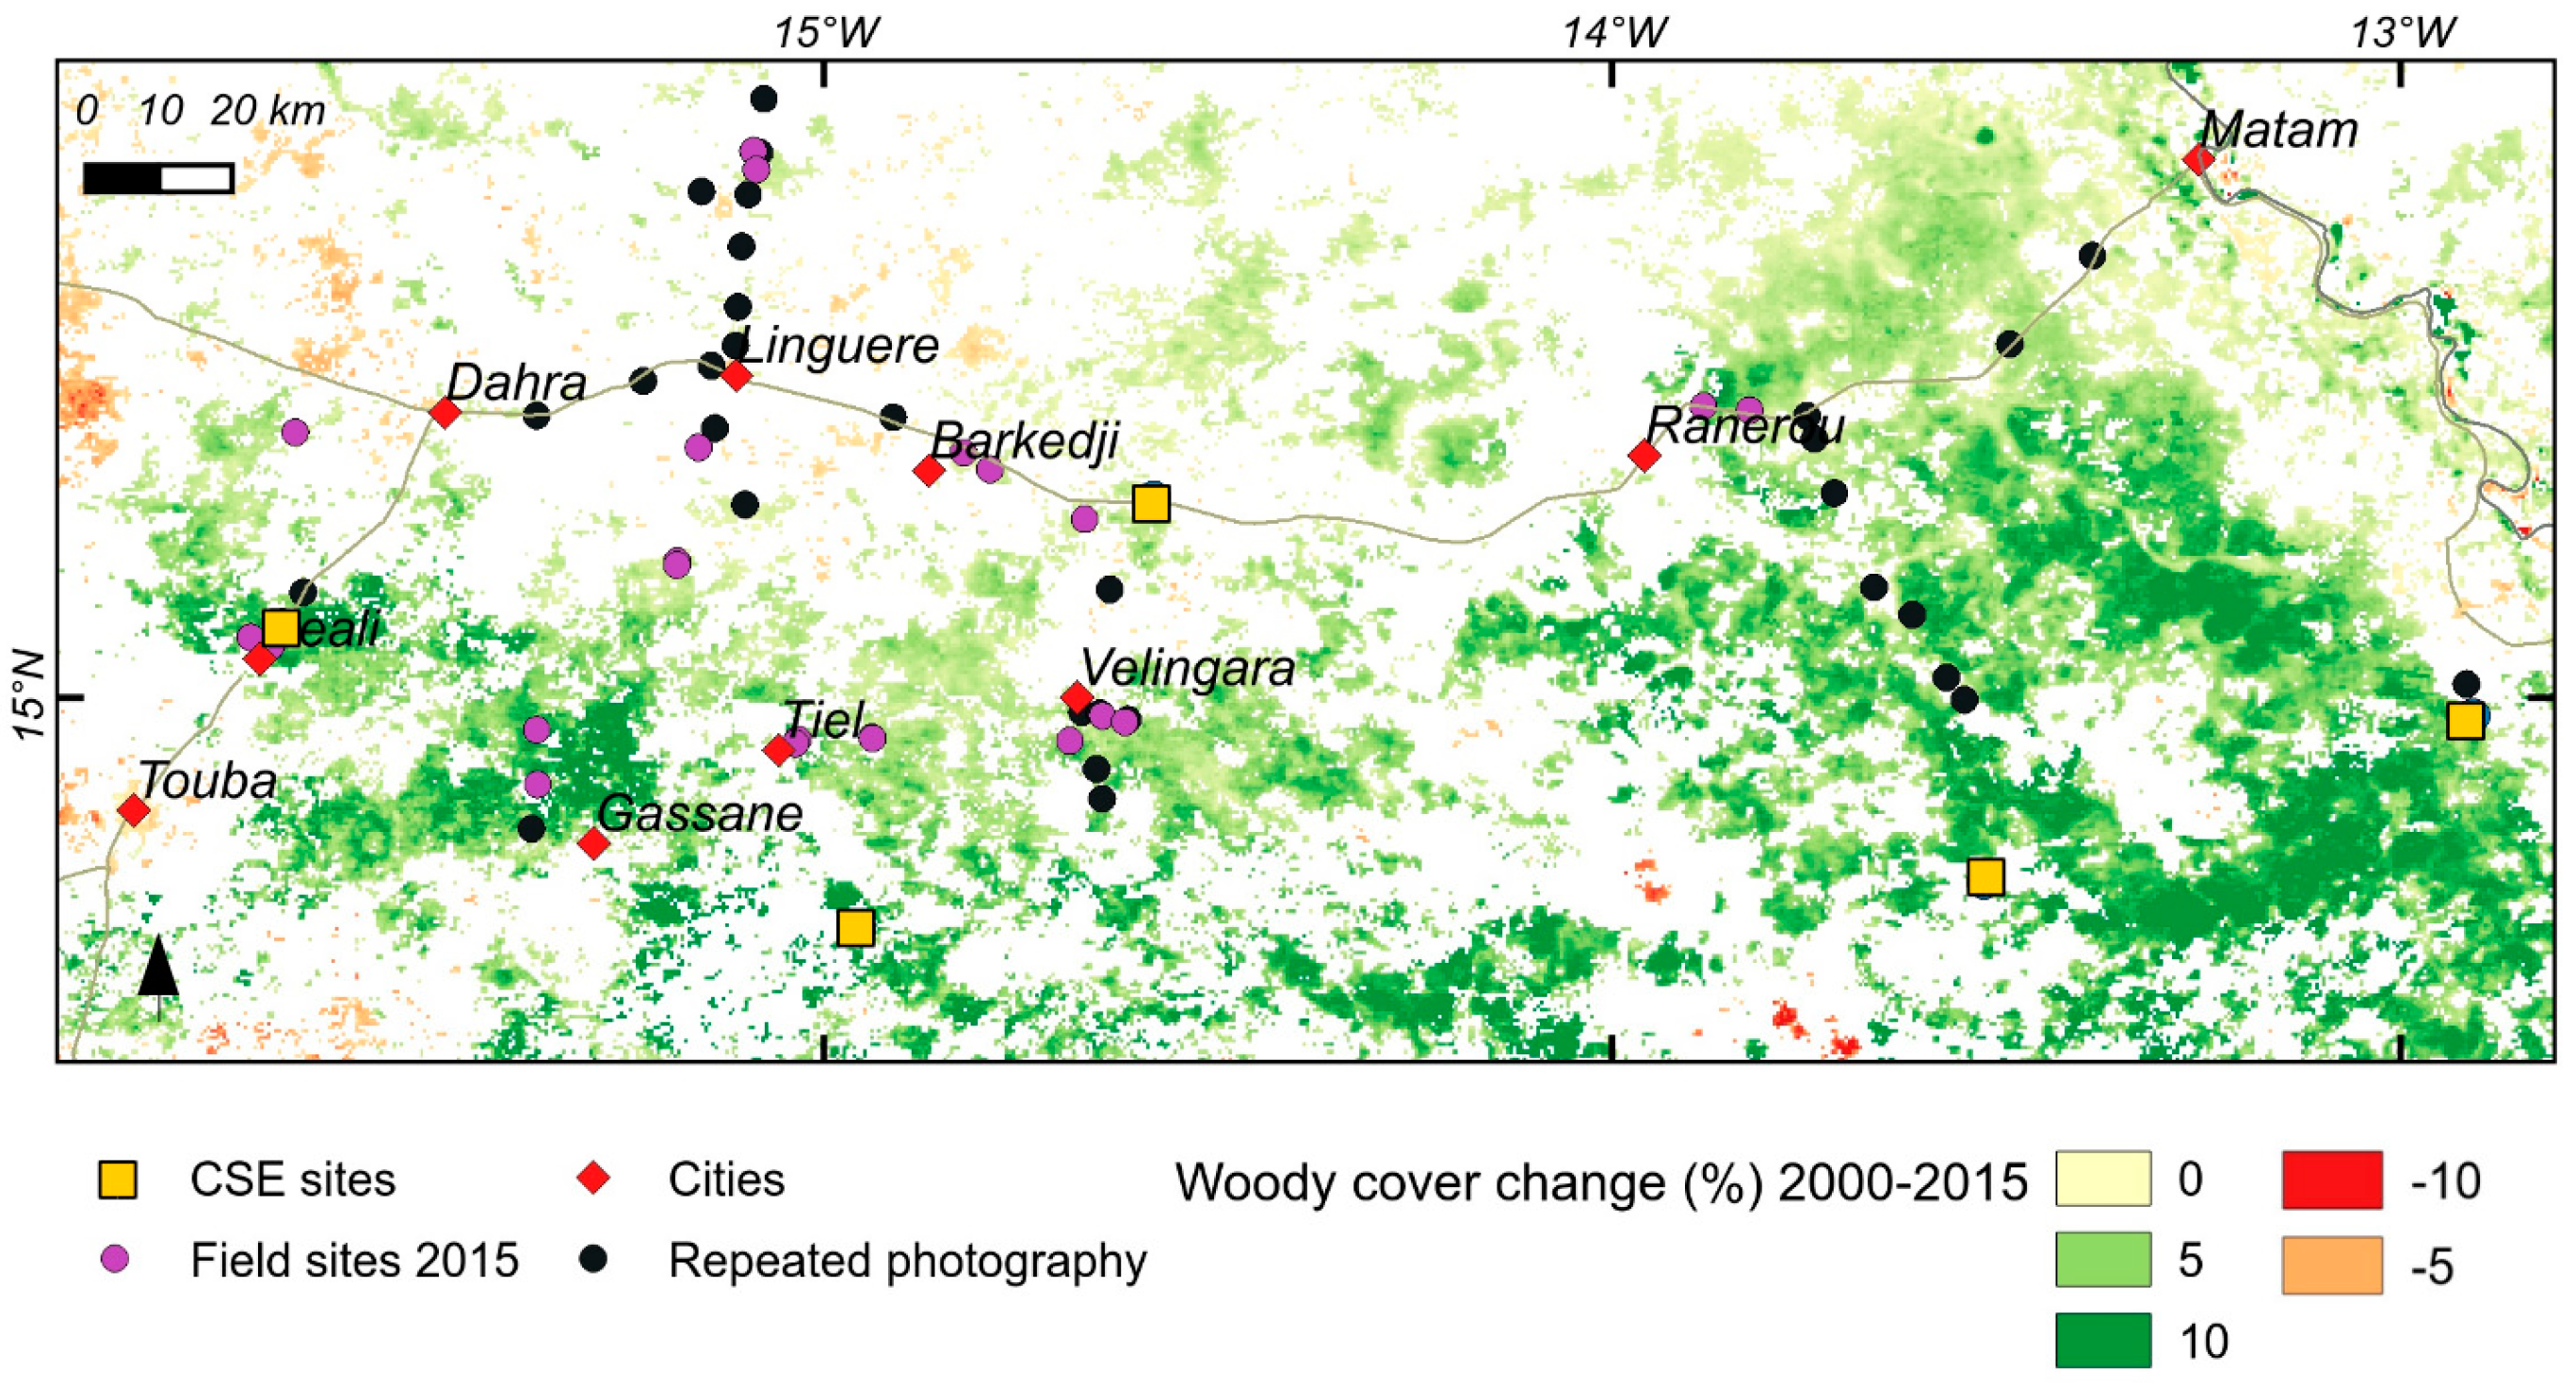
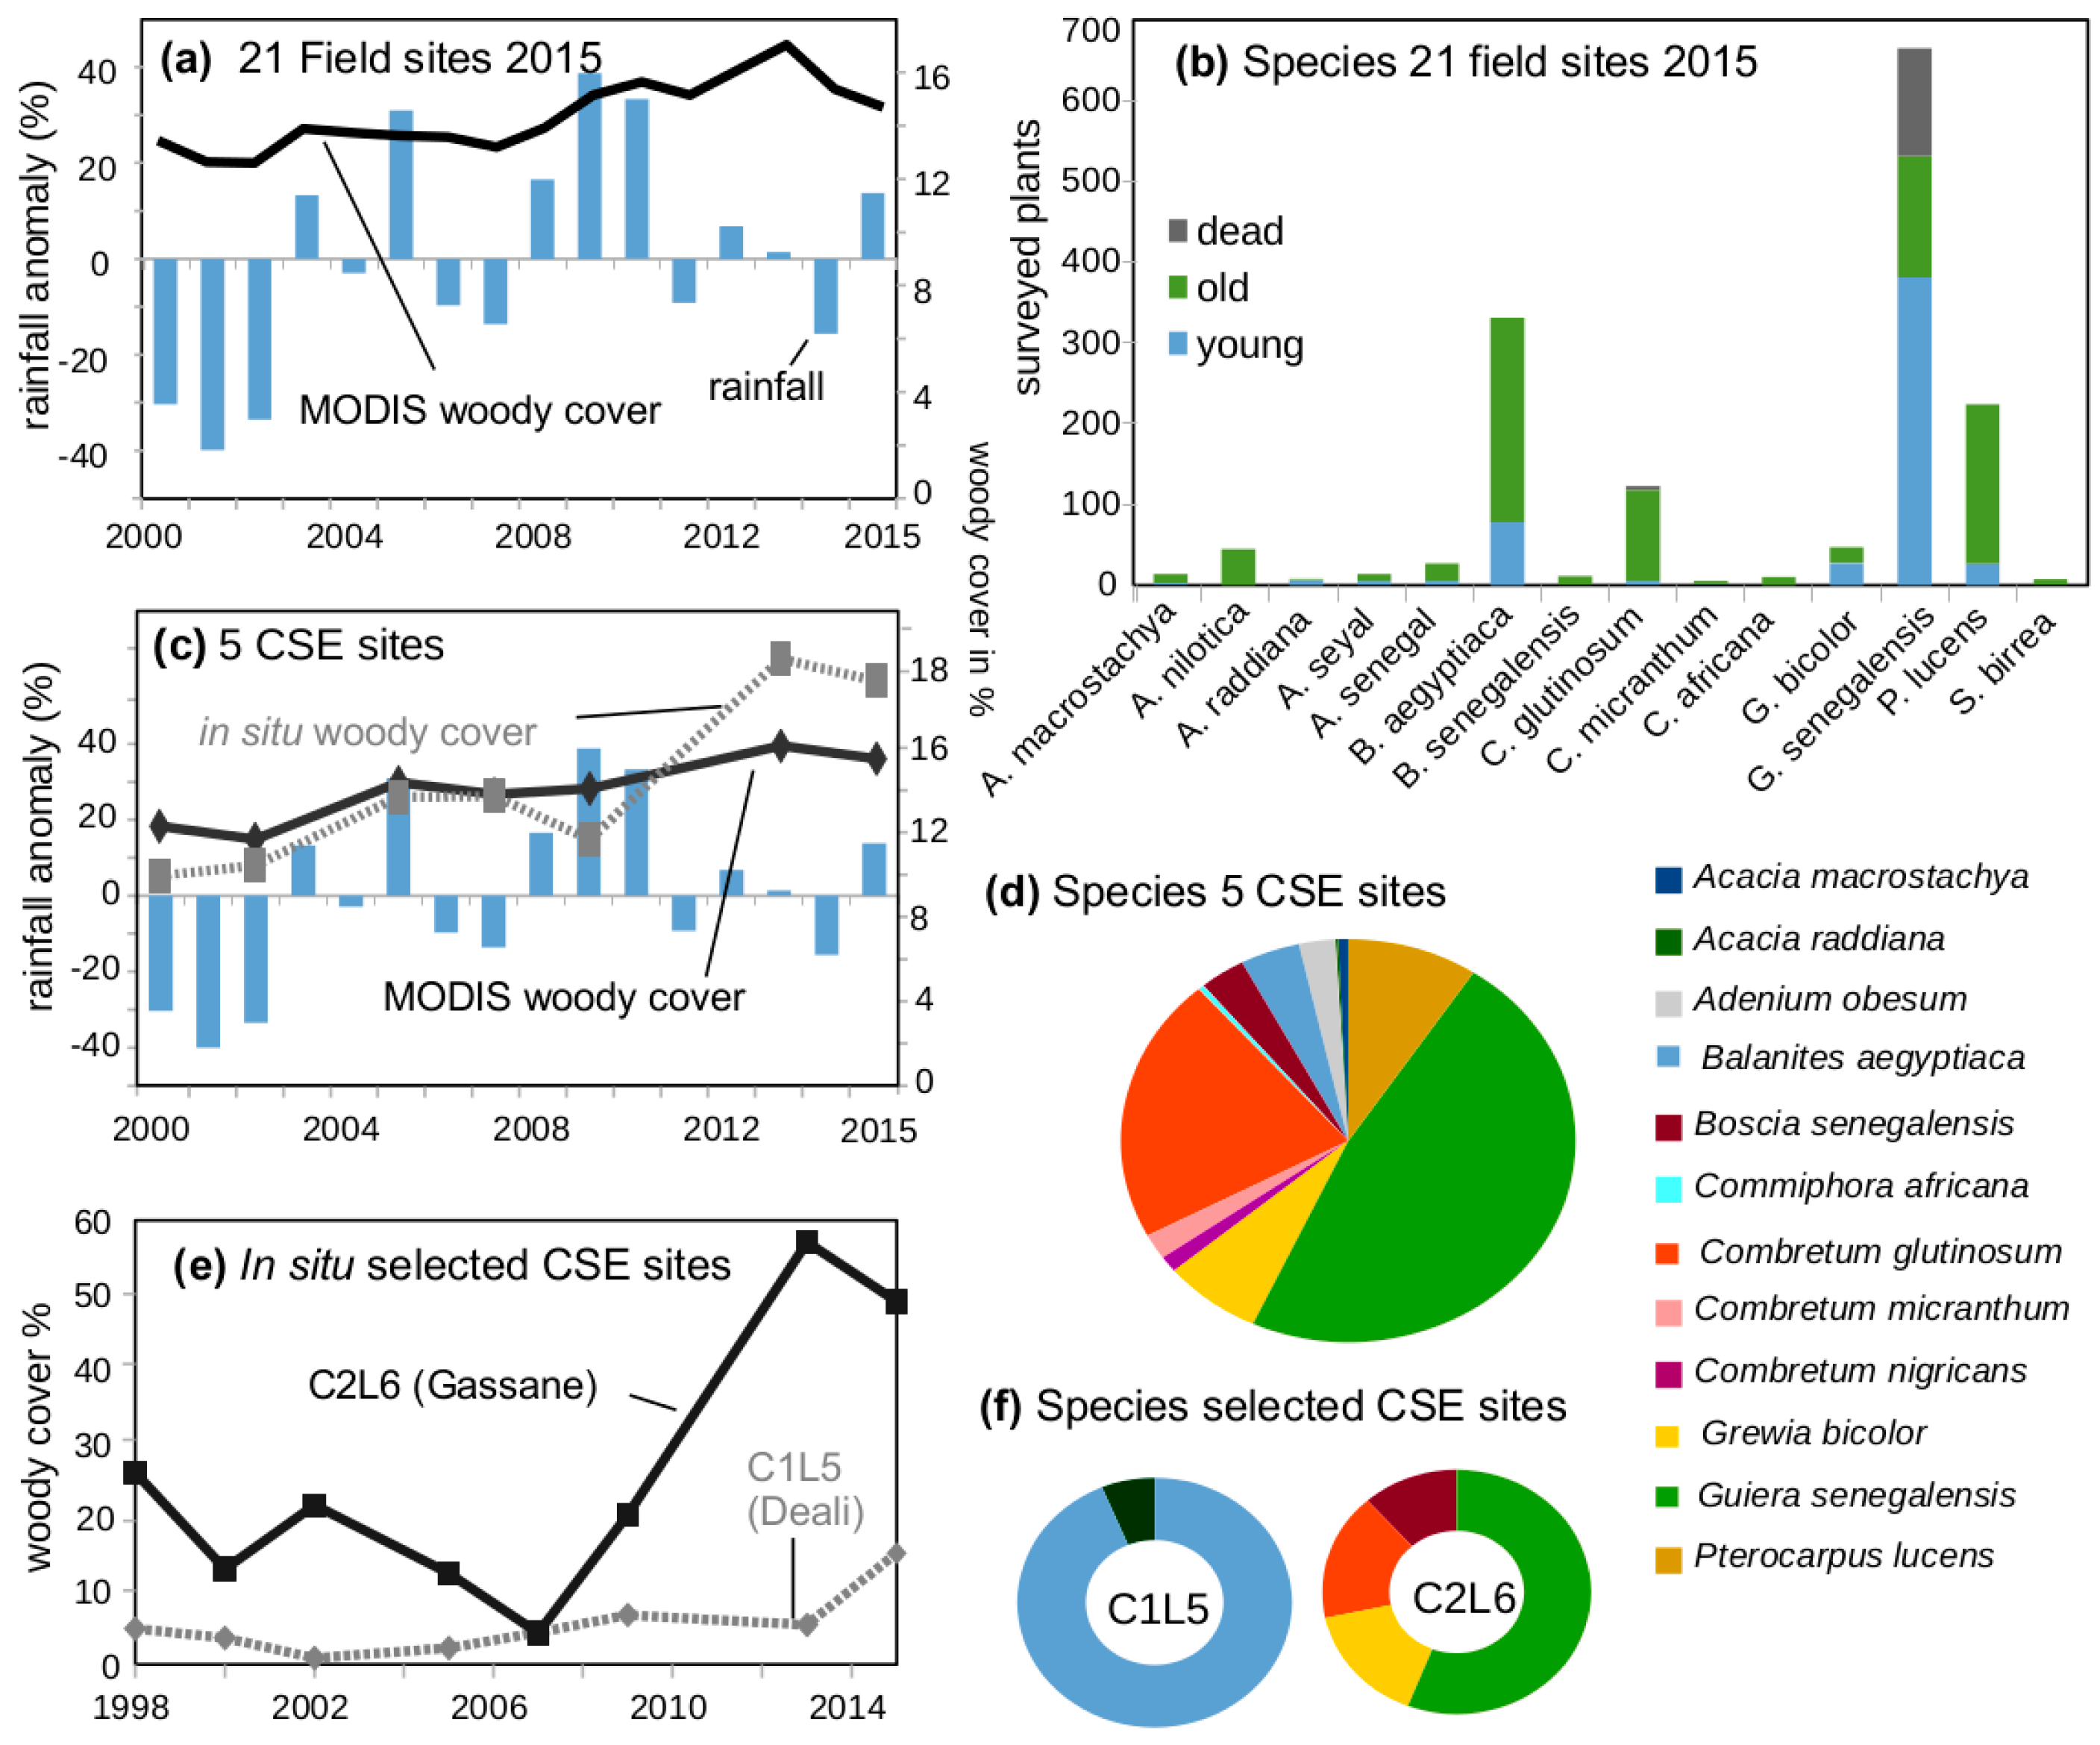
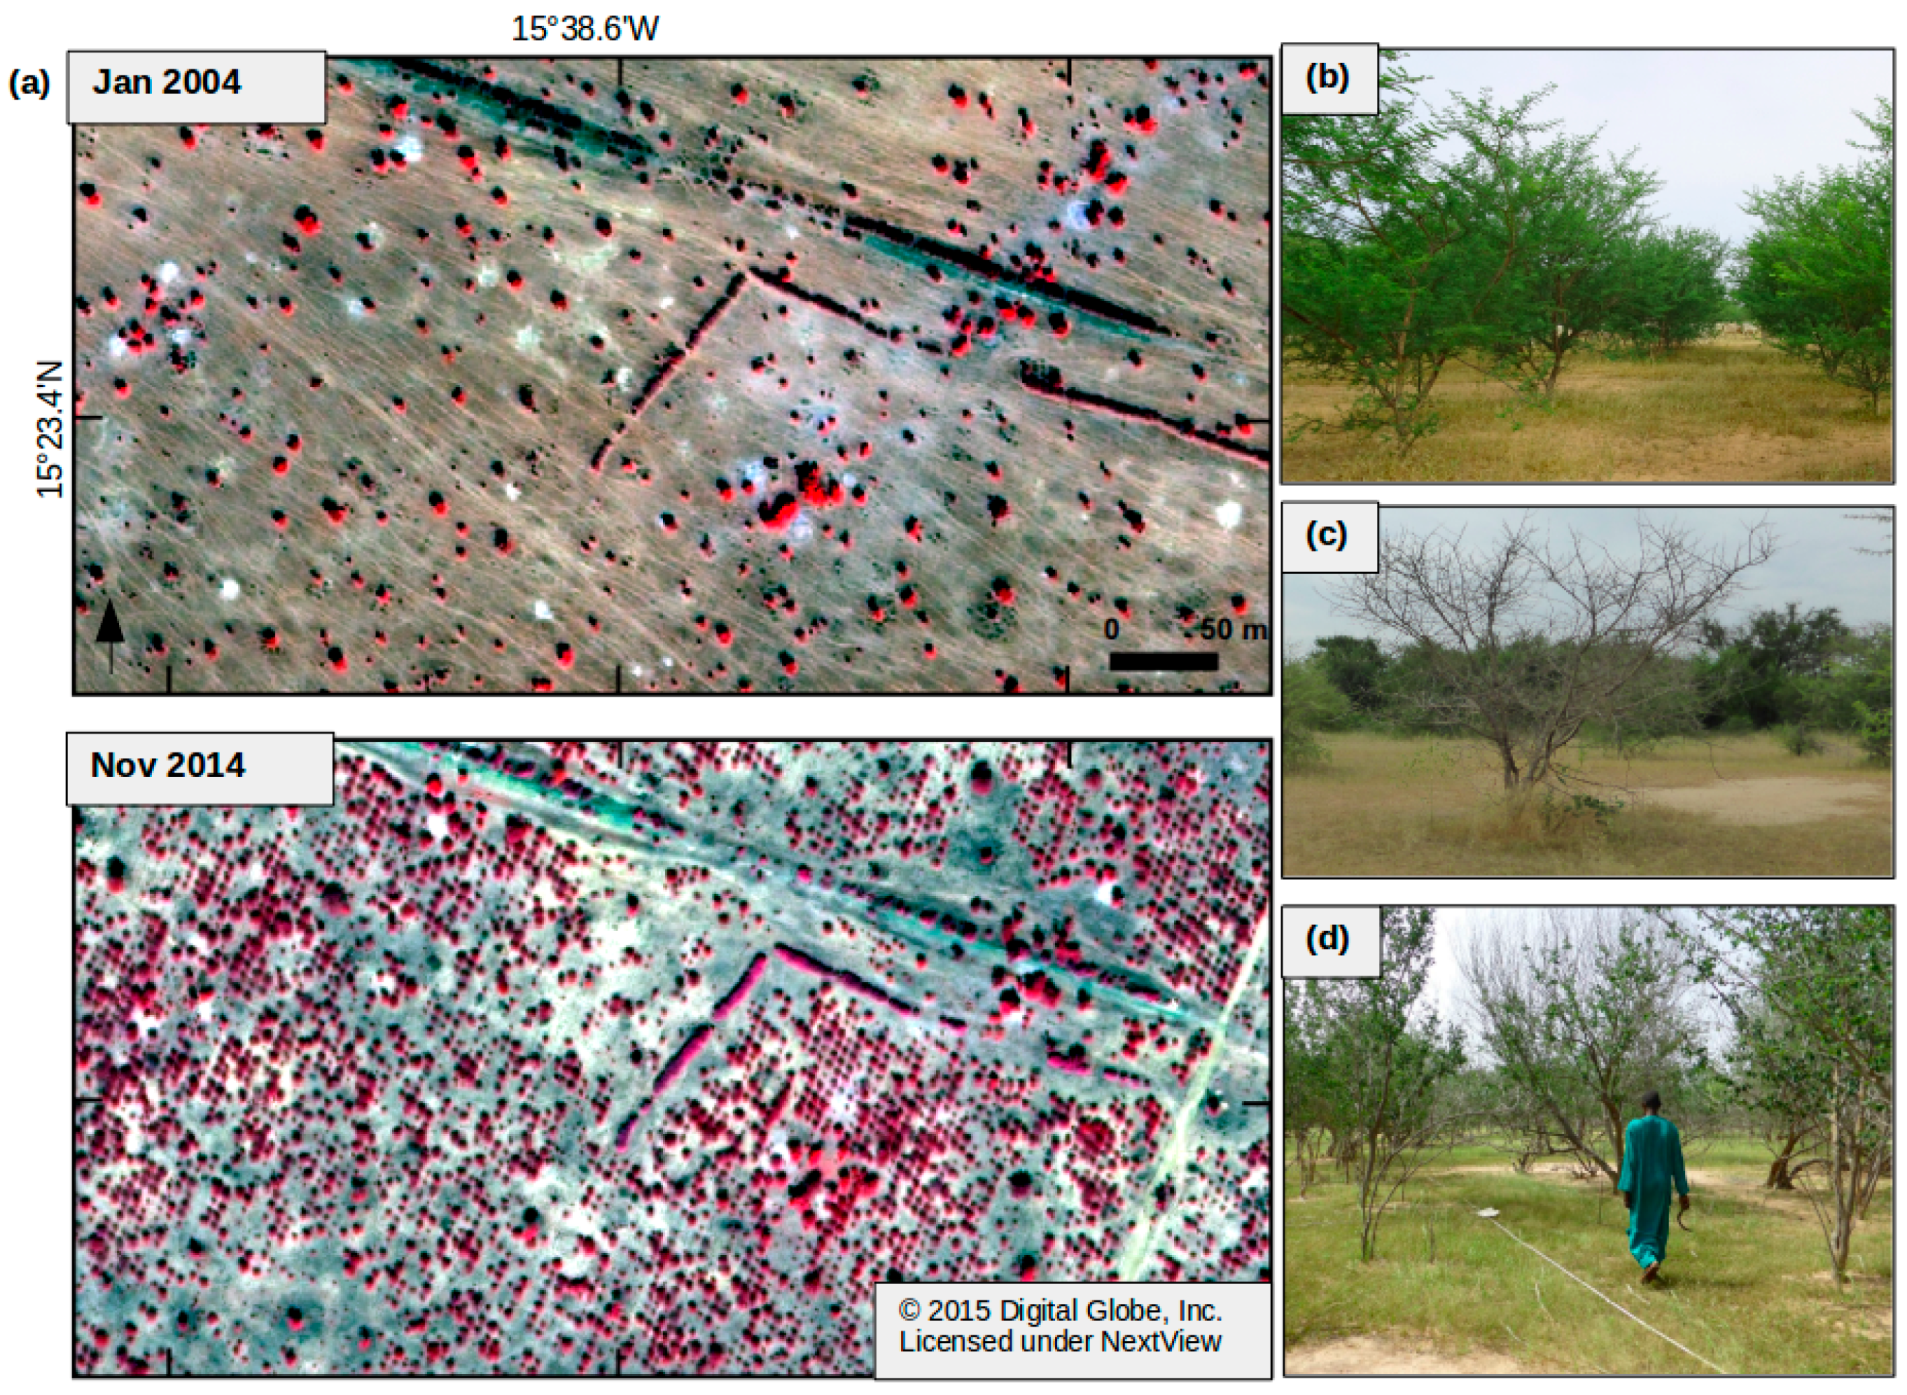
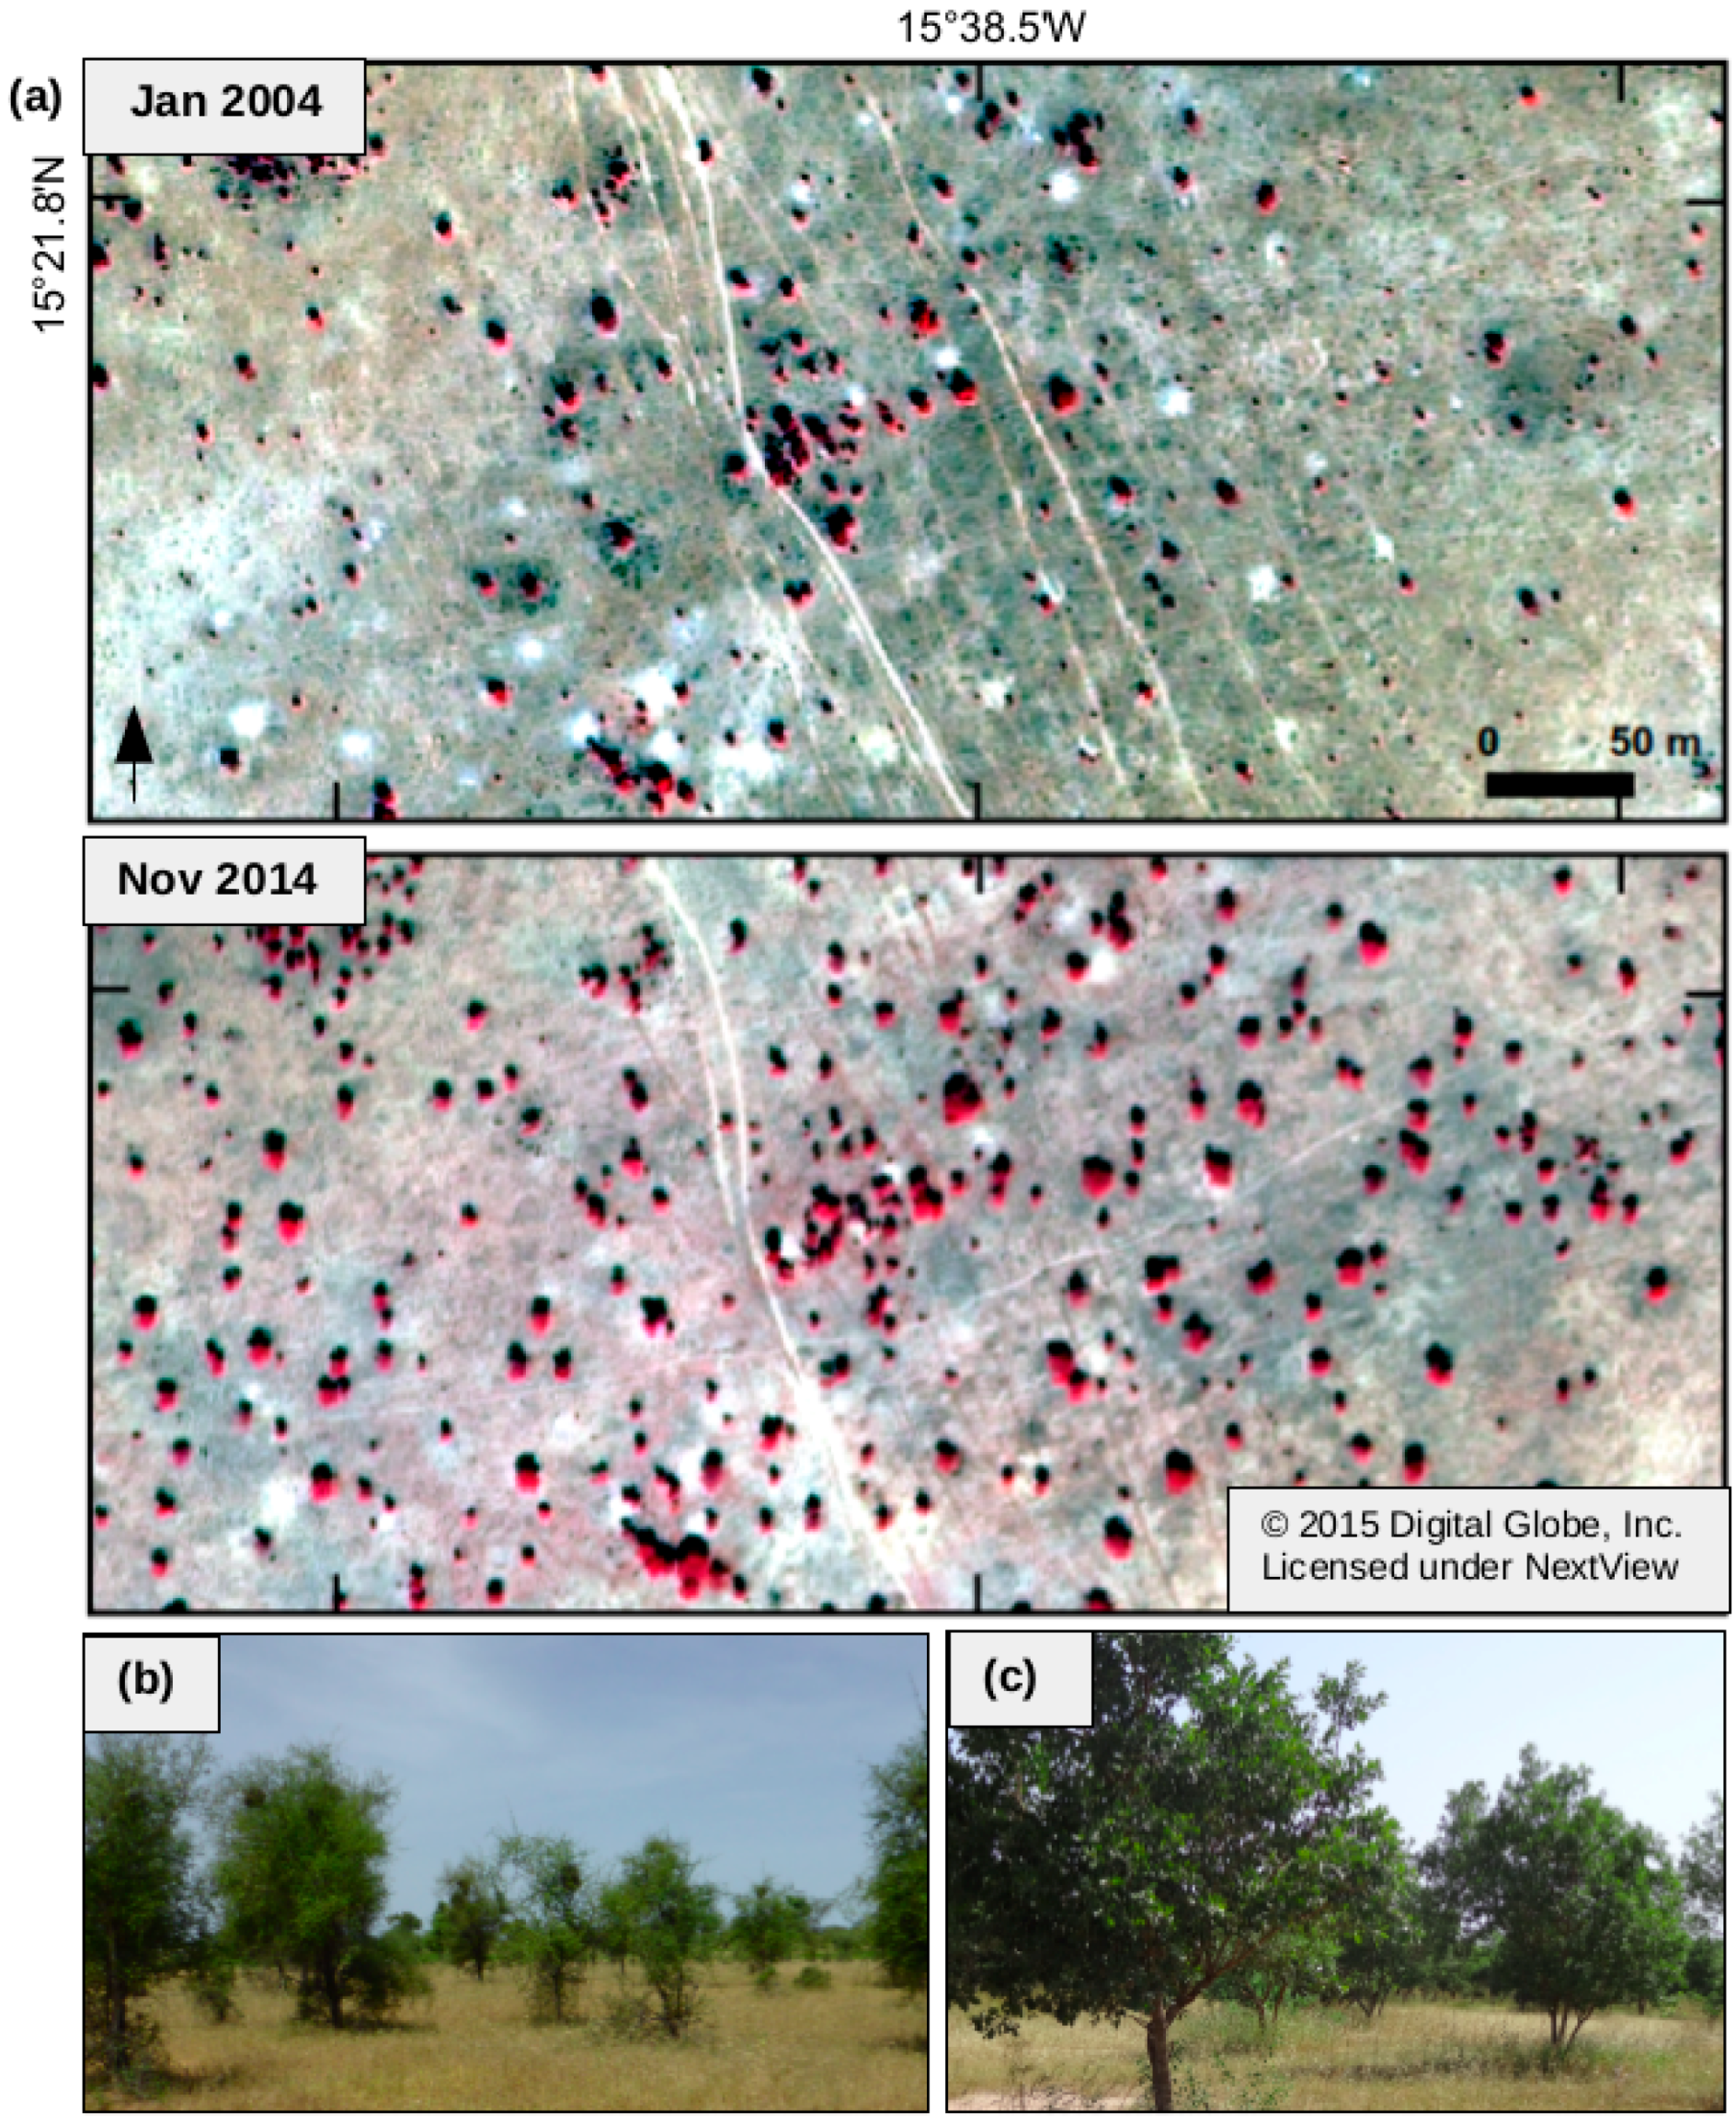
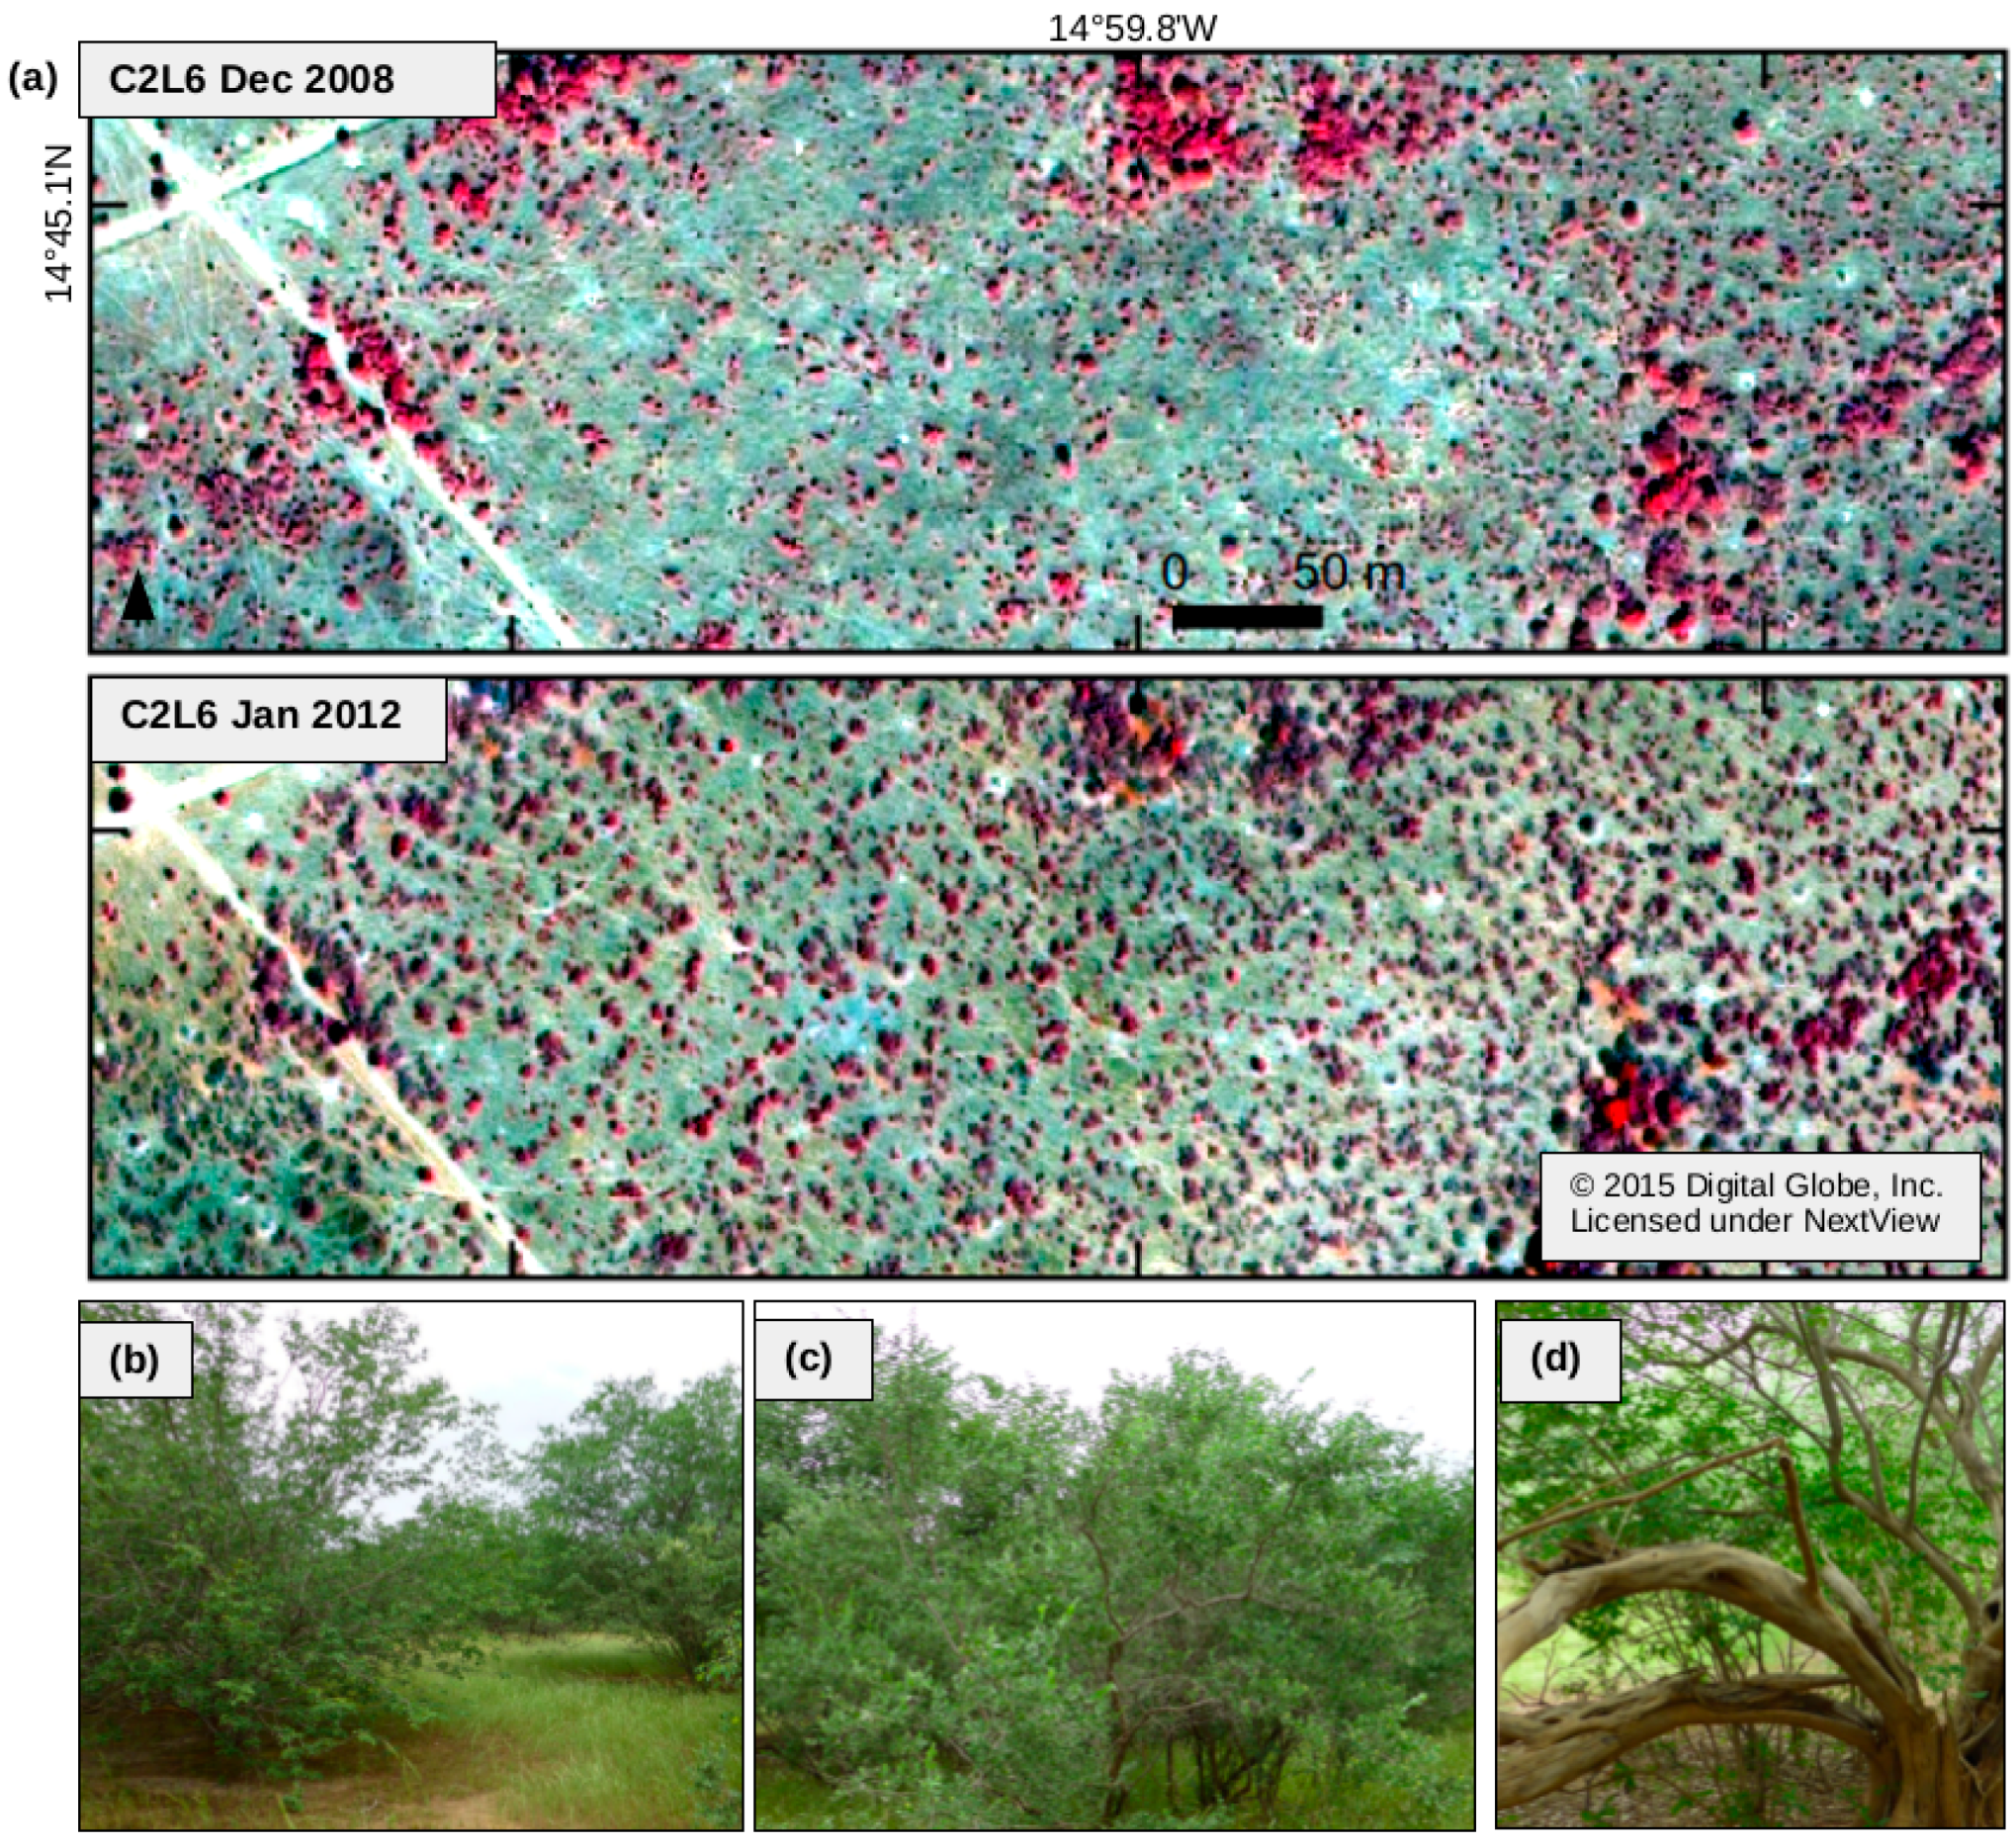
Changes in woody cover as mapped with MODIS data are shown in Figure 2 (Theil Sen trend analysis at 500 m resolution) and Figure 3a (annual scale average at 21 field sites). Increases were mainly observed in plantations (mainly Acacia senegal) (illustrated in Figure 4) and in sylvo-pastoral reserves (borders shown in Figure 1, illustrations in Figure 5 and Figure 6). Within these areas, large scale cropping is prohibited and human activities mainly consist of livestock grazing and browsing, and selective logging. Large scale increase in woody cover density is observed in low human population shrublands of eastern Senegal (Figure 6, Figure S2). Decreases in woody cover were observed near cities, large villages (e.g., Touba, Dahra, Linguère, Barkedji), and close to major roads. Likewise, there was no increase in woody cover following the road southeastwards from Matam within a 20 km buffer (Figure 2). Field sites surveyed in 2015 were located in areas of increased woody cover change, hereafter called “greening” areas. EO-based woody cover was extracted for all field site pixels (21 field sites in 2015) and showed stable conditions between 2000 and 2006, followed by significant increases of approximately 4% from 2007 to 2013 (Figure 3a). From 2011 to 2014, rainfall decreased again, but woody cover continued to increase. However, following years of average rainfall conditions and low rainfall in 2014, woody cover decreased 2014–2015. The overall woody cover development observed in our EO-based estimations is confirmed by in situ measurements averaged over the five CSE sites with a steady increase from 2000 to 2013 (Figure 3c).

3.2. Species Composition at “Woody Greening” Sites

Field measurements in 2015 reveal that the areas characterised by an increase in woody cover mainly consist of only a few woody species (Figure 3b). G. senegalensis dominates many sites (Figure 6a,c), especially in the eastern area with shallow soils. Here they are accompanied by Pterocarpus lucens (Figure 6b) of all ages and to a lesser extent by Grewia bicolor. Woody cover of sandy sites consist mainly of Balanites aegyptiaca (Figure 5a,b, more to the north and on compact sands locally called Barjal) or Combretum glutinosum (Figure 5c, more to the south and on loose sands locally referred to as Jor). The percentage of young (or resprouted) plants is highest for G. senegalensis and G. bicolor; however, B. aegyptiaca and P. lucens also show a considerable amount of regrowth. Figure 3e,f present multi-temporal in situ data for two field sites, implying that G. senegalensis is responsible for a rapid and strong increase in woody cover, followed by a considerable decrease, whereas B. aegyptiaca stands show stability or a subtle increase, even after the dry years.

3.3. Repeat Photography

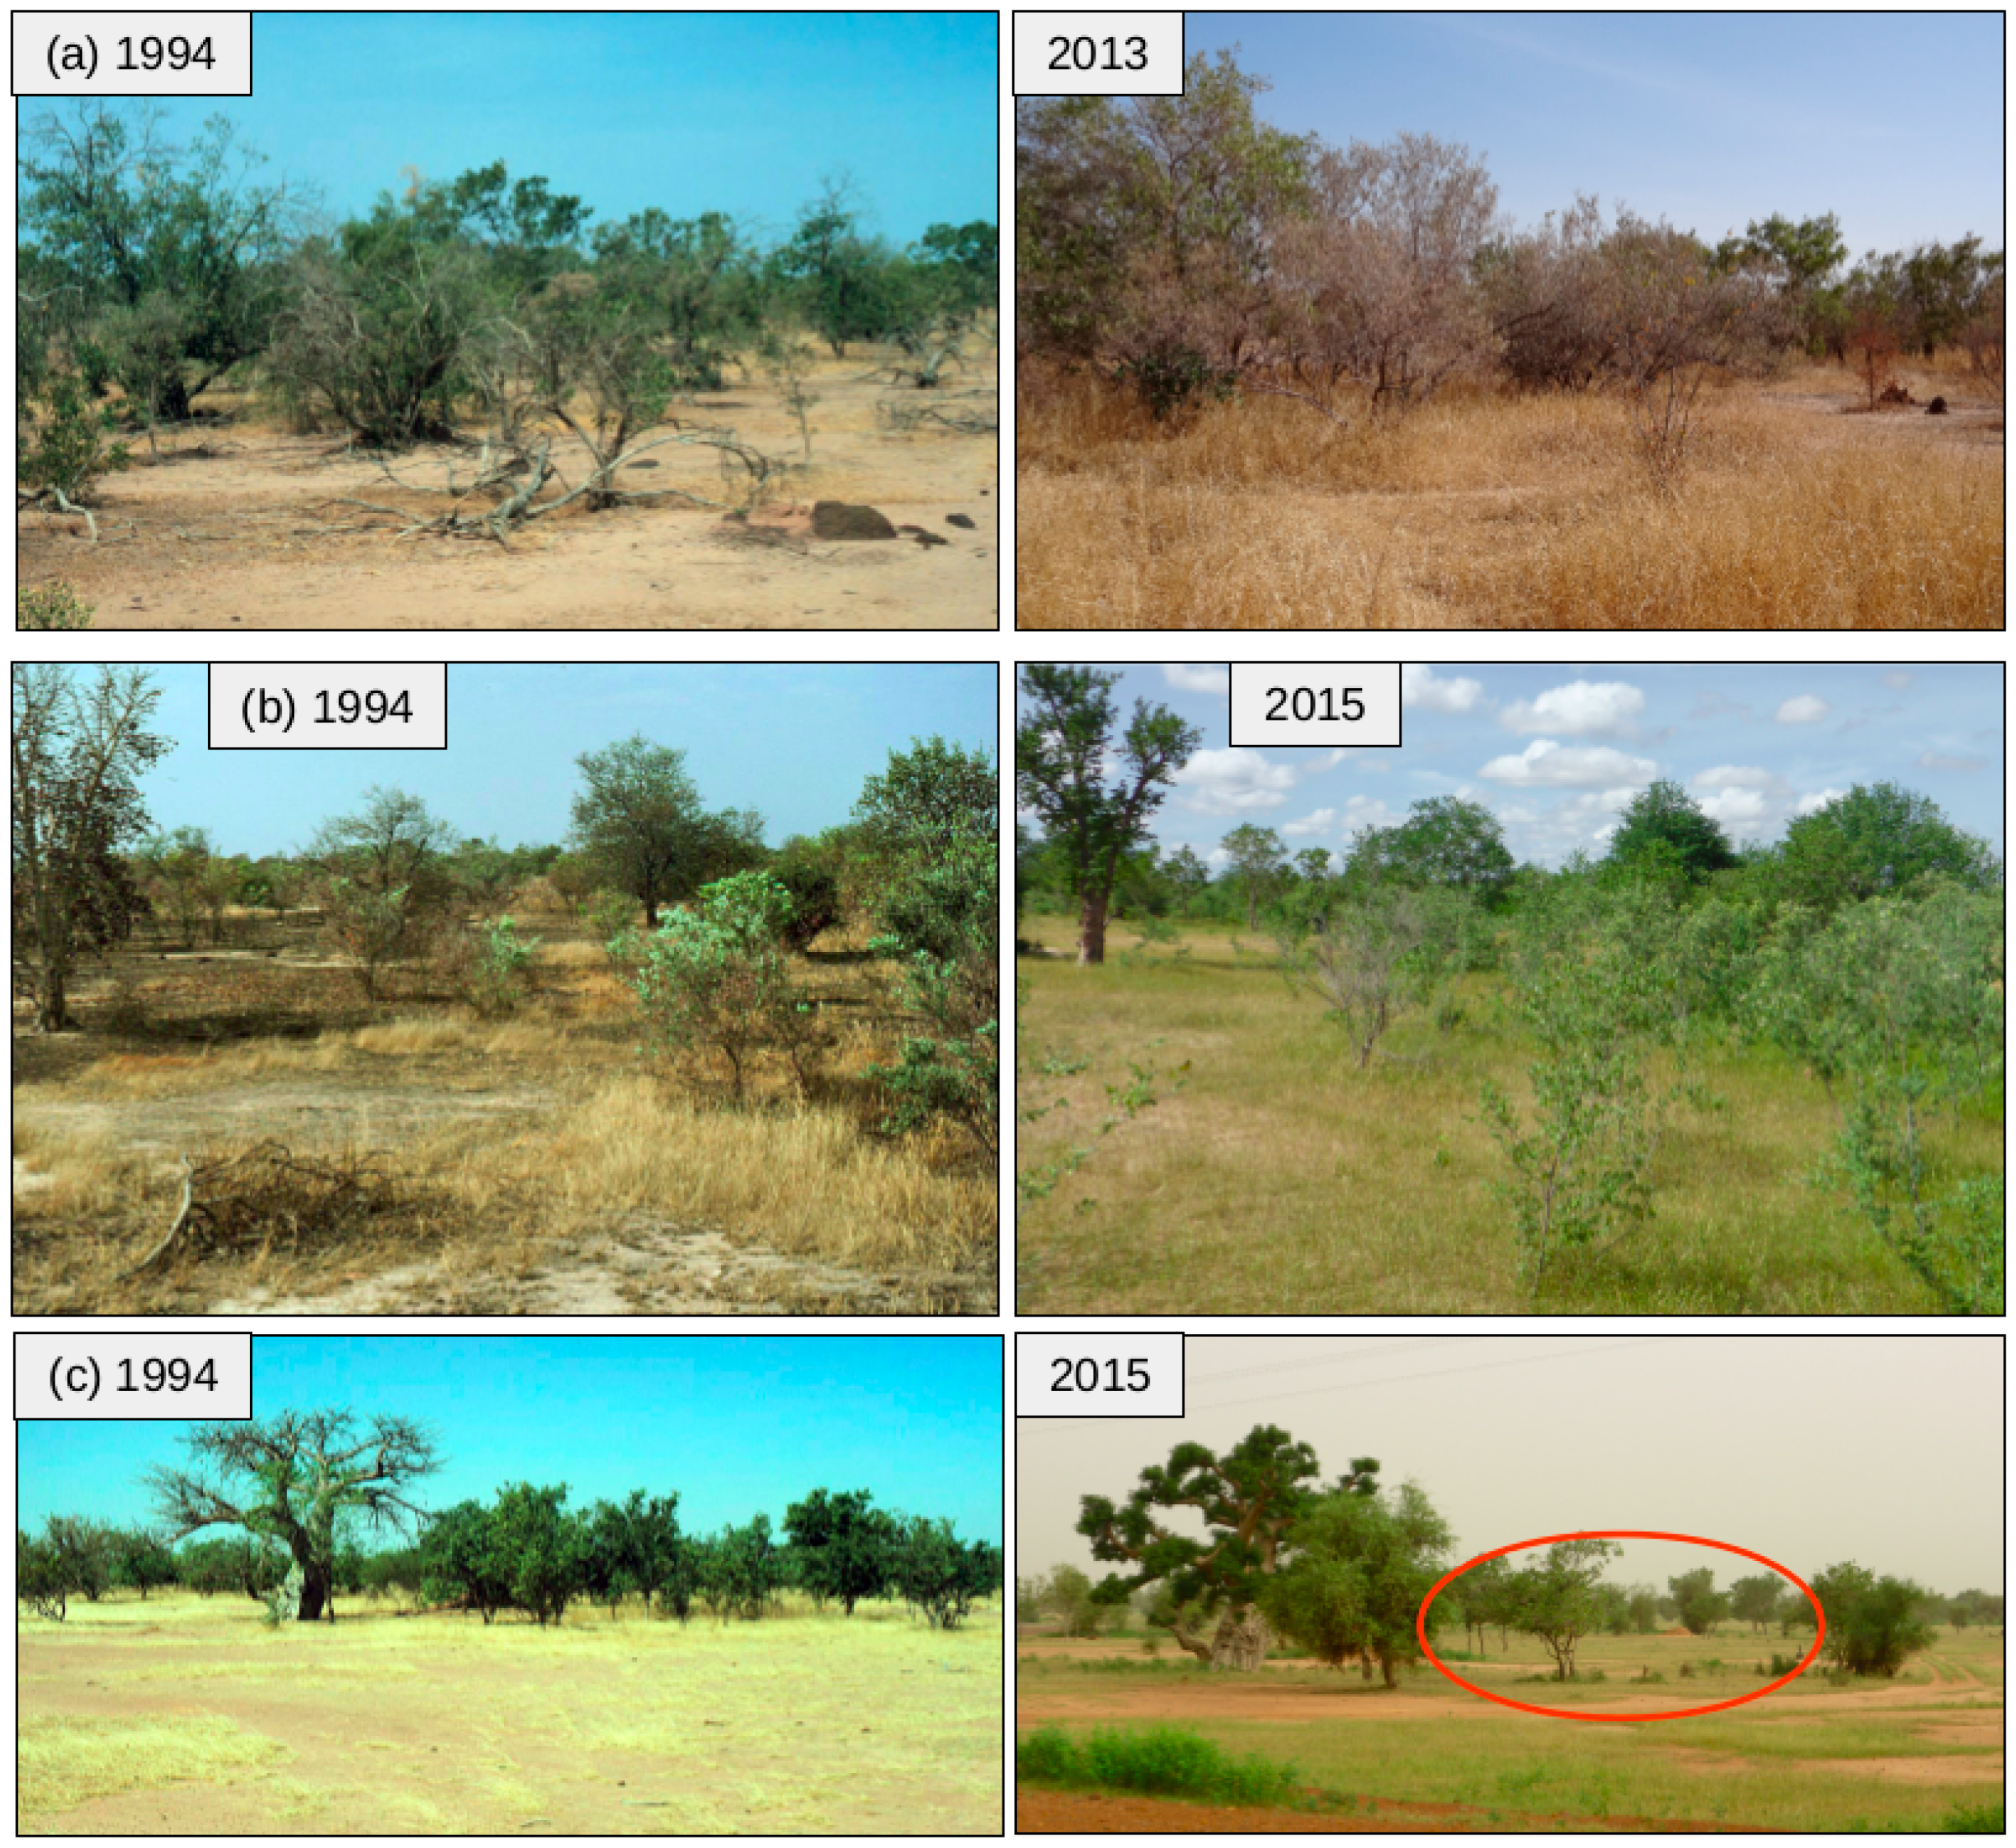
Repeat photography at 32 sites (location shown in Figure 2) show a generally stable woody cover between the 1983/1994 and 2013/2015 visits (Figure 7a,b). The main species observed in the photos are Balanites aegyptiaca, P. lucens, C. glutinosum and G. senegalensis and were consistent with the 2015 survey. Areas classified by EO time series as woody cover decrease were confirmed by the photo pairs. These areas are generally close to bigger cities, villages or main roads. Remaining stumps are evidence for tree removal (e.g., illustrated by the red oval in Figure 7c, photo taken close to the road to Barkedji–Linguère).

3.4. Earth Observation Based Mapping of Woody Mortality Rate

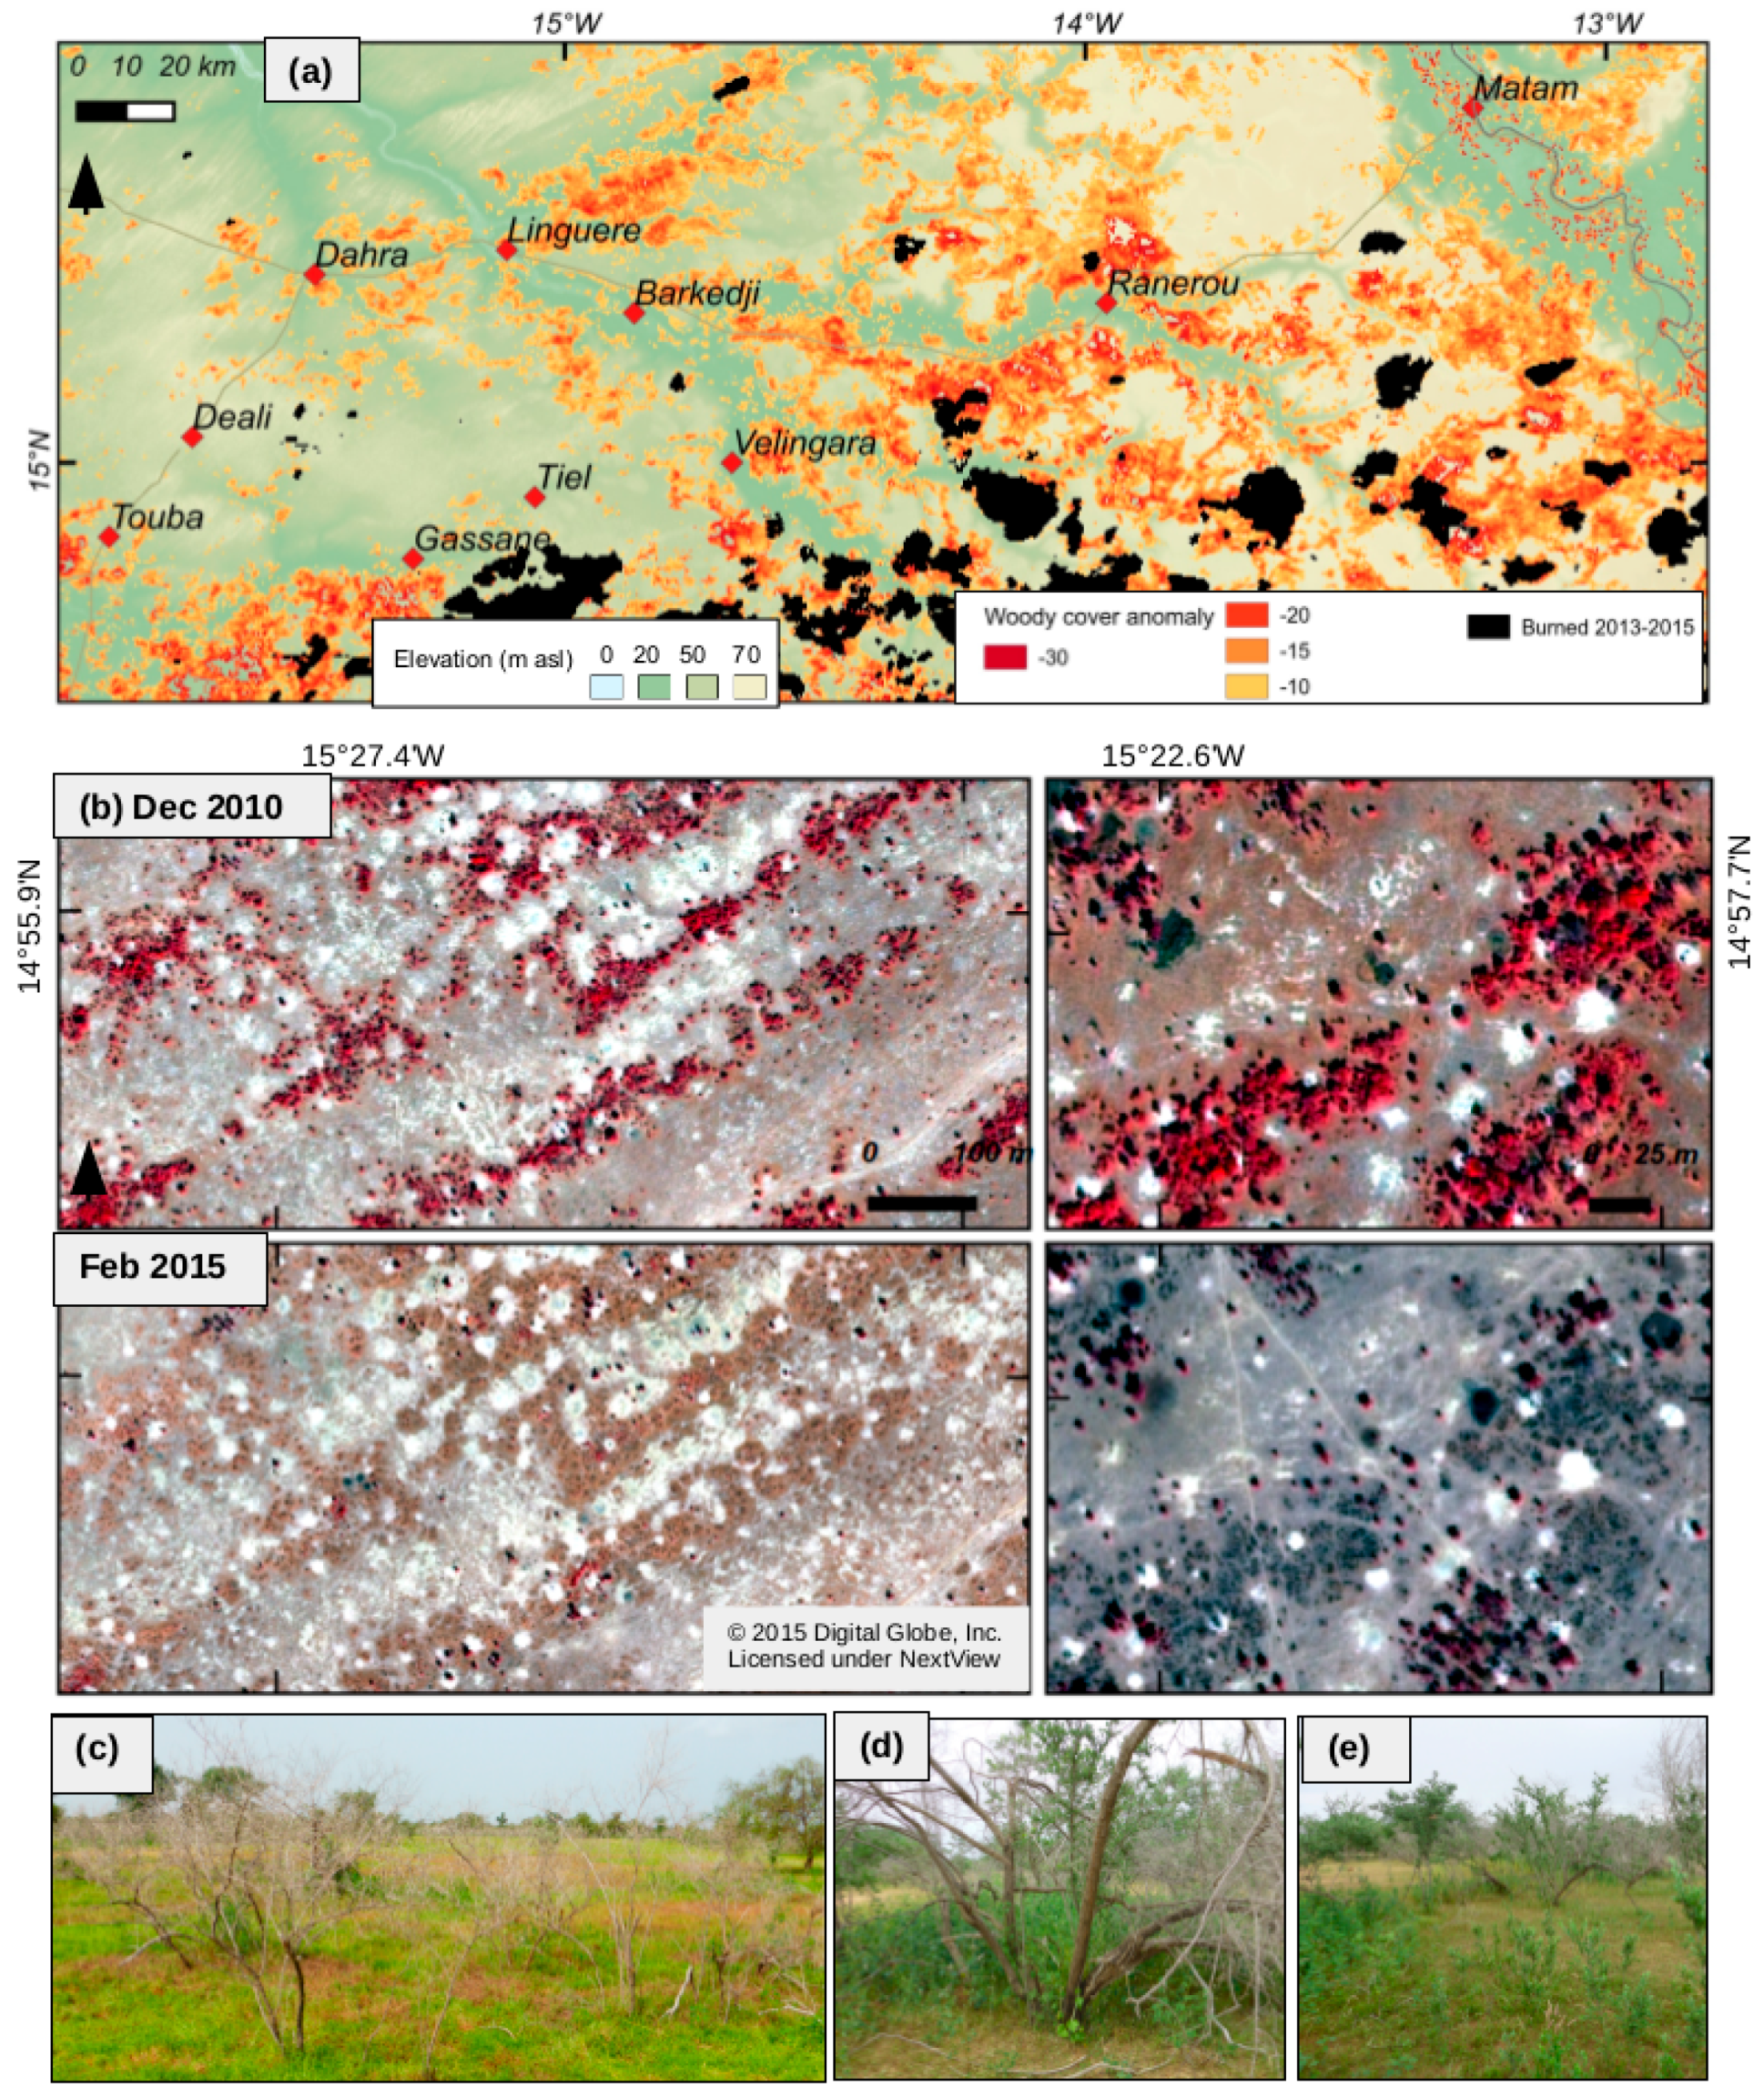
Strong negative woody cover anomalies were identified over large parts of the study area in 2014–2015. The enhanced water storage capacity of fossil valleys that intersect the plateaus in the east, temper the effect of low rainfall and consequently show a lower tree mortality rate (Figure 8a). While negative anomalies based on NDVI are not always equivalent to the mortality rate of woody plants, it can provide information on areas potentially affected. While tree mortality is greatest on the shallow soils of the plateau in the eastern part around Ranerou and Velingara, the sandy soils near Deali and Dahra shows only few woody plant anomalies (Figure 8a).

3.5. Mass Dying of Guiera senegalensis

Field validation of negative anomalies (Figure 8a) revealed a mass die off of G. senegalensis (Figure 8b–d). While G. senegalensis is generally robust to cutting and grazing (also poorly palatable), and known as a pioneer species in disturbed lands, it thrives in wetter regions (southern Sahel and Sudanian zone, confined to riverine areas in the north) and therefore experienced high mortality rates after the drought years of the 1980s and also the 1990s [6]. G. senegalensis had rapid growth between 2006 and 2013 and was responsible for a considerable amount of observed greening. In total, 20% of the surveyed G. senegalensis were found dead in 2015 (Figure 3b and Figure 8b). Die off was most prevalent among older woody plants and a high level of regrowth was already observed after sufficient rainfall in 2015 (Figure 8e and Figure 3b). Other species were observed as stressed following the drought (i.e., producing only a limited amount of green leaves; mainly C. glutinosum). These species, however, showed signs of recovery in the following wet year of 2015.

3.6. Rainfall Dynamics Impact on Woody Cover

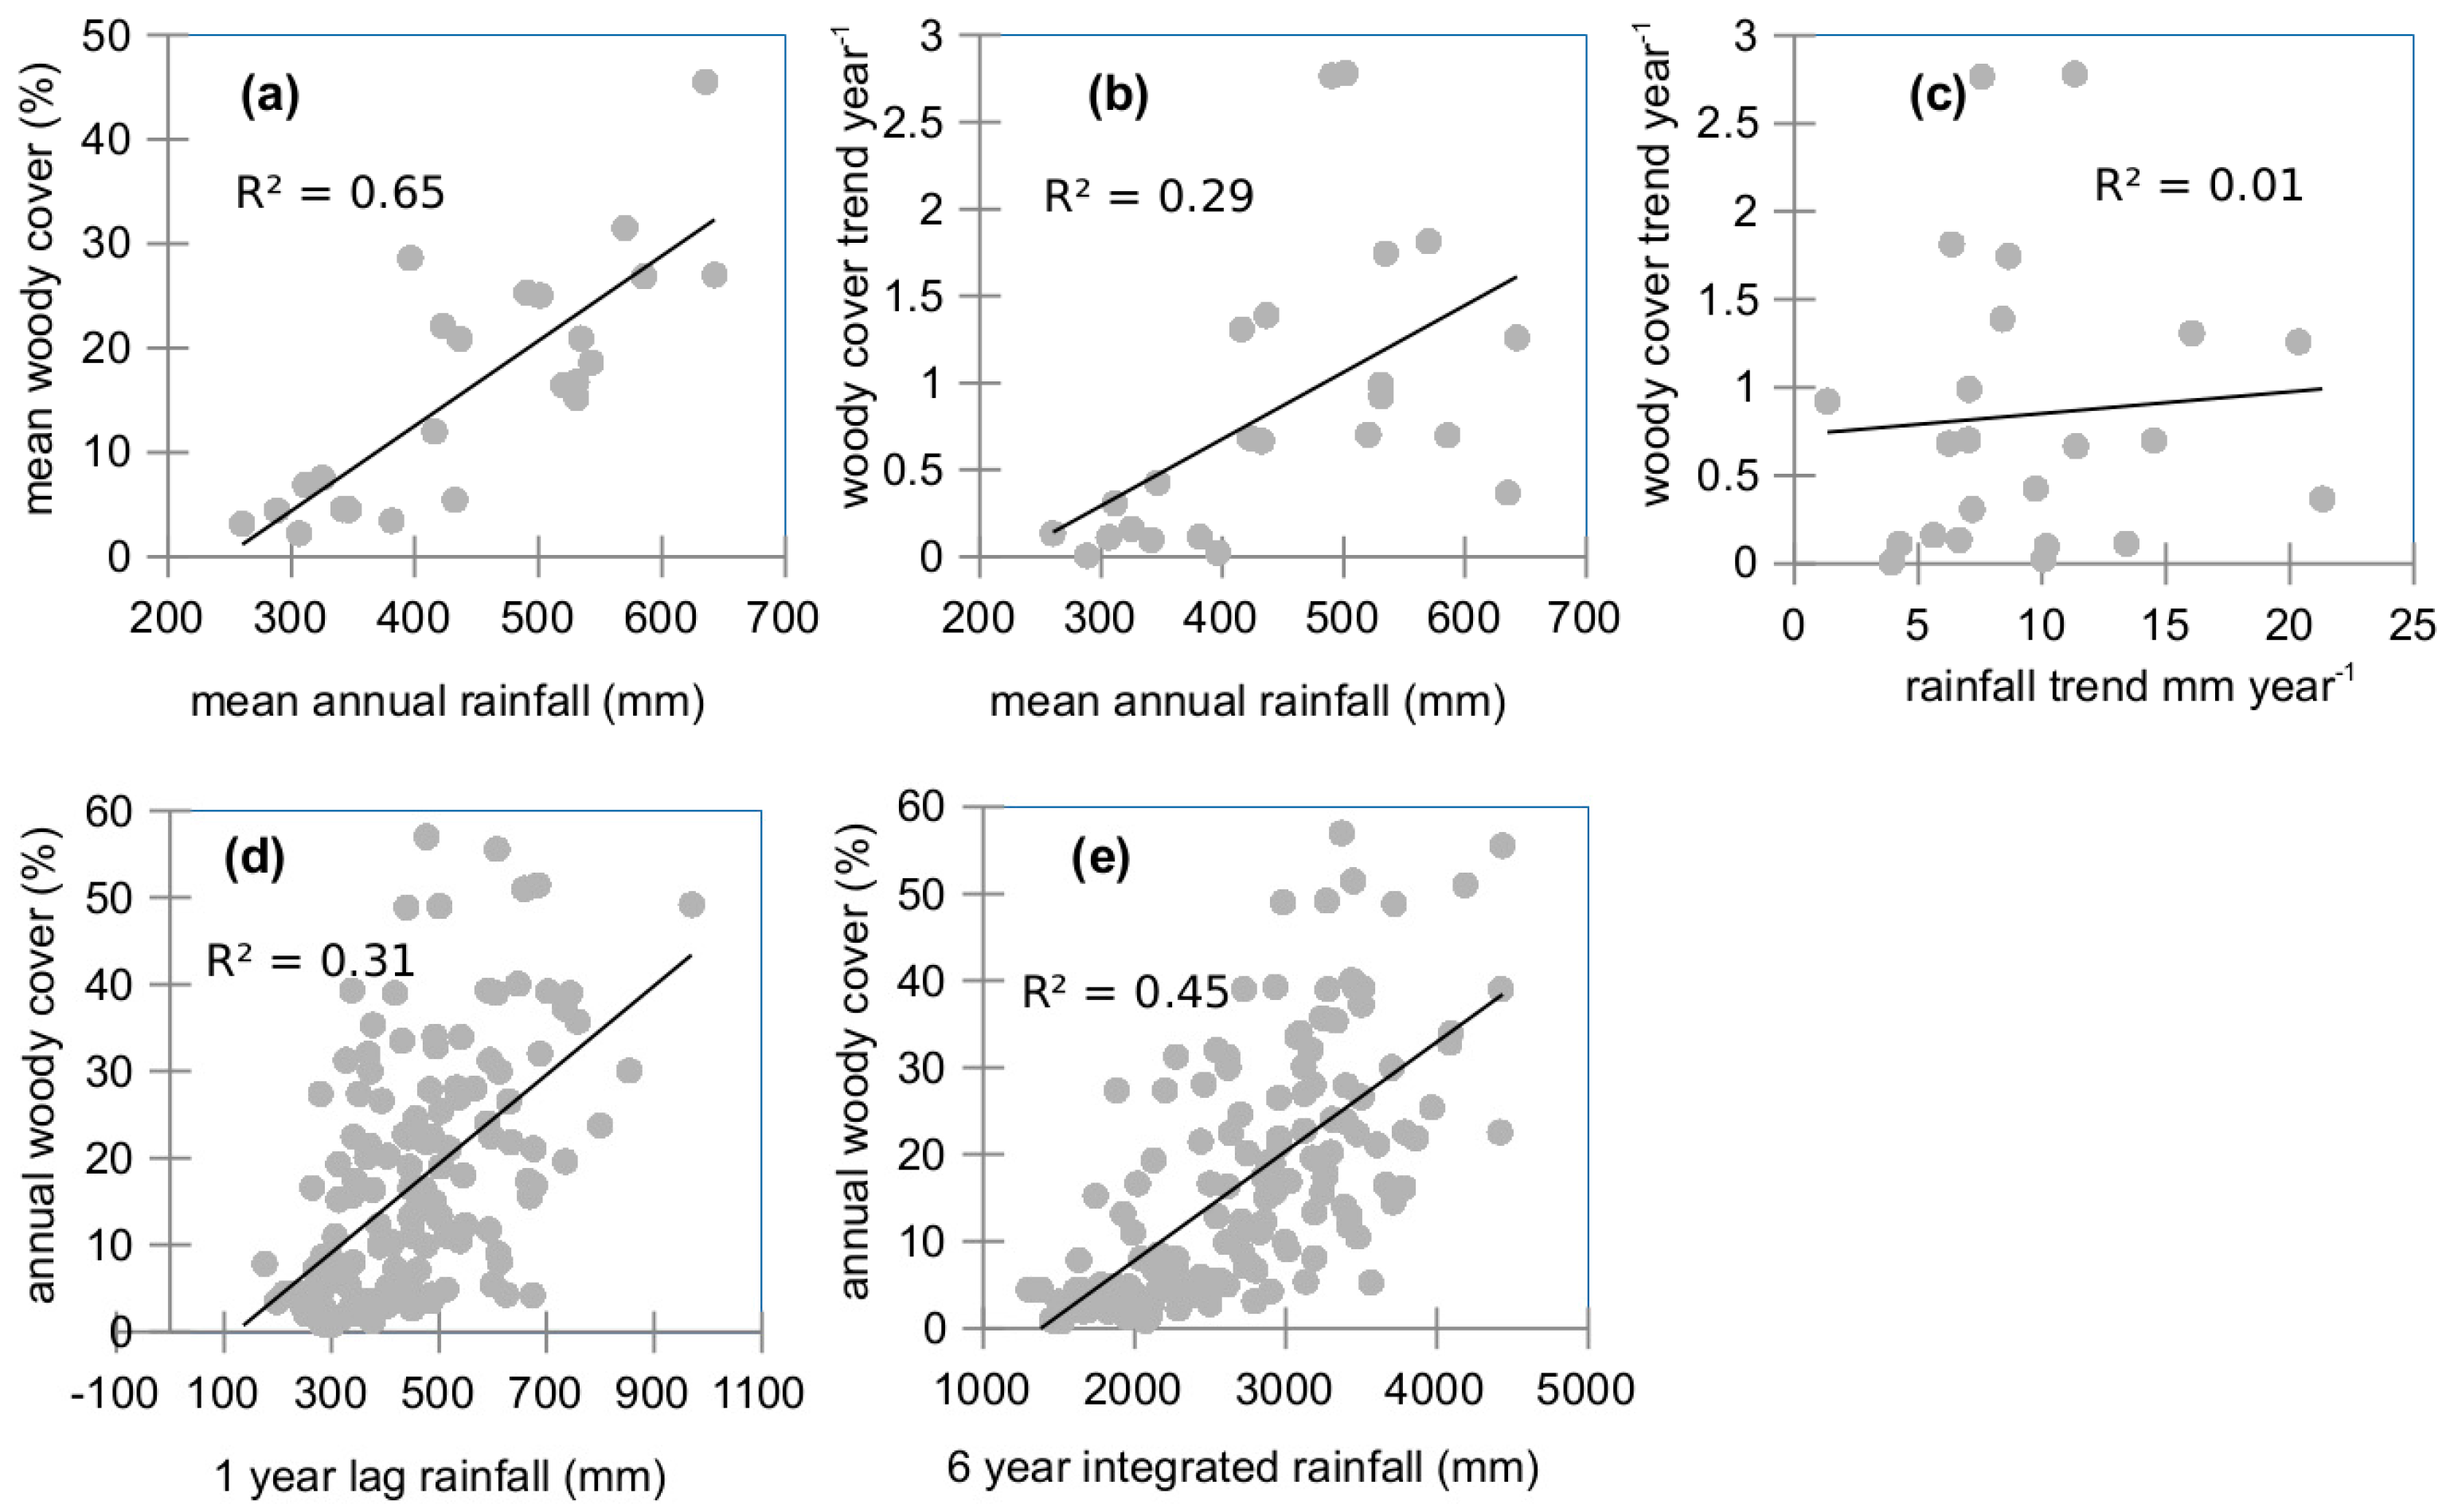
The general pattern of woody cover and woody cover trends is closely related to mean annual rainfall and stronger increases in canopy cover are observed in wetter areas (Figure 9a,b). Trends in rainfall and woody cover are however not related over the study period (2000–2015; R2 = 0.01) (Figure 9c) and a longer time frame (1990–2015; R2 = 0.07), even though all observed trends at the field sites are positive for both woody cover and rainfall. To find evidence for a more dynamic relationship, we compared annual in situ woody cover with different periods of lagged and integrated rainfall. Generally, the relation between annual in situ woody cover and rainfall is weak at short-term. This is not surprising, since years of high rainfall do not necessarily lead to an increase in woody populations and woody plant recruitment and growth needs several years of sufficient rainfall. The correlation increases with 1 year lag, is highest with a 2 year lag, and lower again after 3 years. If more years of rainfall are accumulated and compared with annual woody cover measurements, the correlation increases with each additional year (Table 2). It is fairly strong after 5 years (rho = 0.71, p < 0.05), which also reflects the general dependency of woody cover on long-term rainfall conditions (Figure 9a).
If the sites are split into sandy and shallow soils, it becomes clear that the shallow soils of the ferrugineous Ferlo react differently from sandy soils by only showing a short-term response to rainfall and a very weak relation with long-term sums (Table 2). The correlation here is negative, with very high rainfall sums related with a lower woody cover. A possible explanation for both the negative and missing long-term correlation may be the high run-off on rocky and shallow soils.

4. Discussion

The encroachment of woody vegetation in African savannas has been studied at continental scale [28,29] and in more detail in southern Africa [30,31,32,33], but there is still a lack of research in Sahel. After a serious reduction in canopy cover was reported in the 1990s [6], recent studies report that woody vegetation in Sahelian regions with a sparse human population shown signs of increase [11,34]. The pastoral zone of Senegal has been identified as the area with the largest increase in woody cover within the Sahel, and this study aimed at further exploring these findings. We applied the method developed by Brandt et al. [17] and included field observations and VHR satellite data for evaluation of woody cover change. All data show rapidly increasing woody vegetation cover in pastoral Senegal and thereby support the findings in Brandt et al. [26]. However, hidden by the linear character of the trend analysis, we also found a mass dying of G. senegalensis within the same area following several years of low rainfall. This demonstrates the need for more detailed and dynamic analyses when dealing with temporal trends at local scale.
Previous studies have attributed an increasing woody cover in Sahel to a recovery from the severe droughts in the 1970s and 1980s [7,10]. However, as woody encroachment is not restricted to Sahelian drylands but has been observed in savannas all over Africa and globally [29], drought recovery may not be the only reason for this phenomenon. Studies located in South Africa’s savannas suggest an increasing atmospheric CO2 level as an additional driver beside precipitation [31,32]. However, even though CO2 may be an important driver of woody encroachment in the long term [31], our results show that short and medium term rainfall dynamics control growth and mortality of Sahelian woody vegetation. Our field measurements over a 15 year period showed that the increase in annual rainfall until 2010 has led to a rapid spreading of mostly Combretaceae and B. aegyptiaca. Although the rainfall conditions returned to more average levels after 2010, woody vegetation continued to increase. Interestingly, after several years of average and below average rainfall, we observed a mass dying of G. senegalensis in 2015, while considerable regrowth was observed in the same year. This example shows that high annual rainfall likely favours the rapid growth of drought prone species which may die easily if there is a return to dry years. Gaze et al. [35] reported that the uptake of soil water in the top 4 m of soil by G. senegalensis was equivalent to 28% of the total rainfall for the year. This species thus depletes the deep soil water resources at a fast rate. Deeper rooted species may be able to mine water at lower soil depths, but may become susceptible after a drought until the deep moisture is replenished. The varying correlations between annual woody cover and rainfall with different lag and integration periods suggest more complex interaction which needs further research.
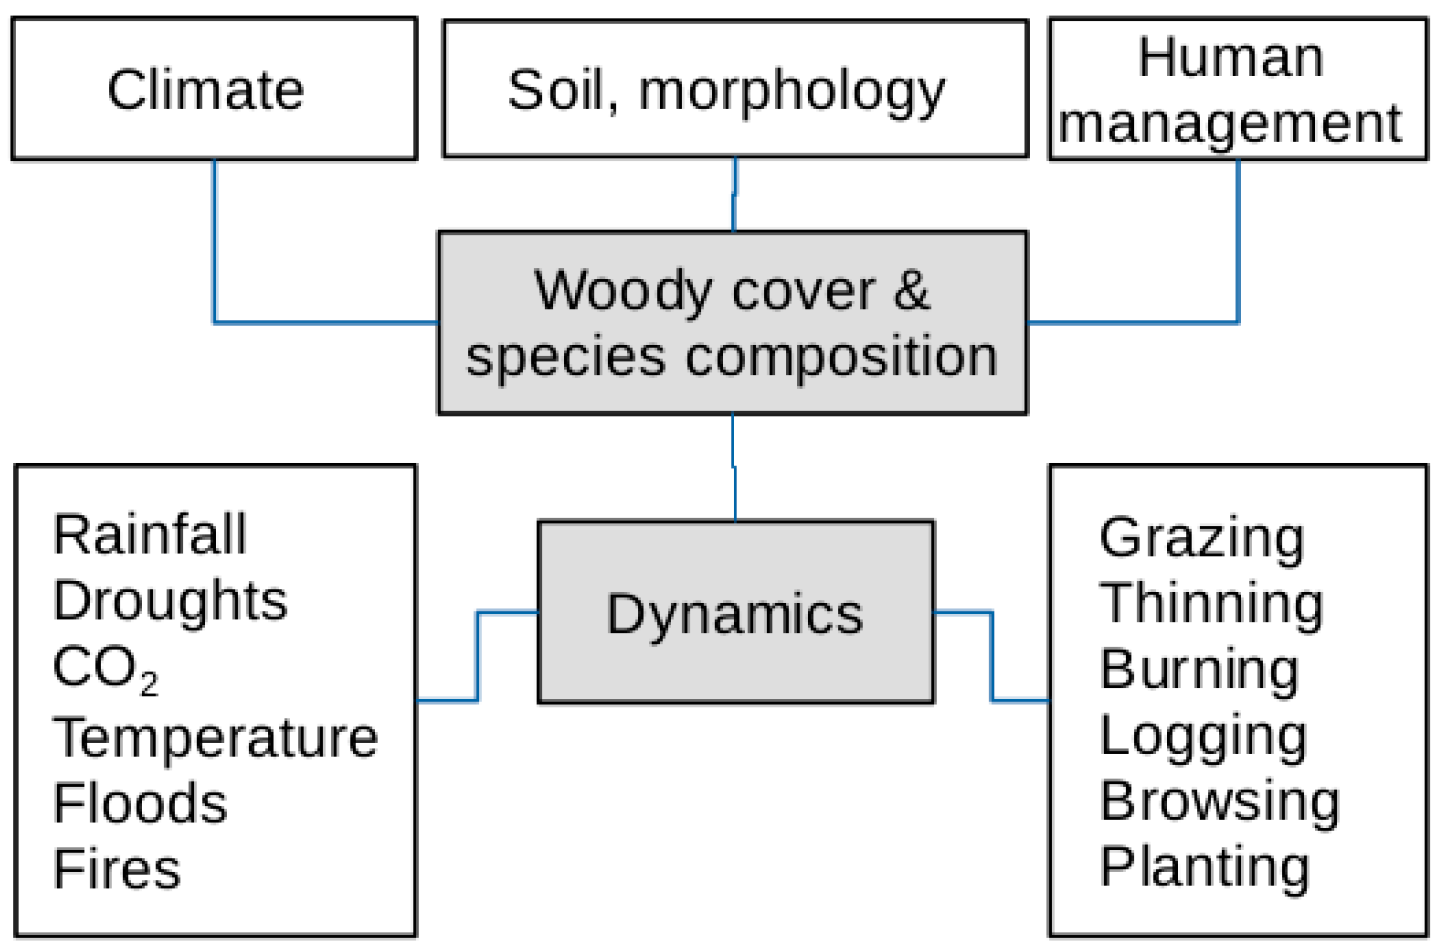
Even though trends (2000–2015) in both rainfall and woody cover were positive at all sites, we did not find a spatial relationship between these two variables. This is not surprising, as the inter-annual variability of rainfall in this area is high and woody population changes are expected to be more gradual. Moreover, various other factors, including fire, water redistribution depending on morphology and soil texture, as well as human management impact on woody plant growth and play an important role in explaining the patterns of woody cover trends (Figure 10). We have shown that woody cover on sandy soils follows the medium to long-term rainfall trends, whereas woody cover on shallow soils is more prone to water shortages and short-term variations. For the entire study period, the lateritic soils of the low-population ferrugineous Ferlo (east of Barkedji) show a positive trend in woody cover (Figure 2). Here, P. lucens, which is considered to have a poor regeneration rate [13], is among the spreading species. On the other hand, these soils also have the highest woody plant mortality following the recent dry years (Figure 7a). Woody cover on sandy soils (west of Barkedji and north of Gassane) is more stable, with an overall moderate increase in B. aegyptiaca, but no negative anomaly in the past dry years (Figure 7a). This has already been observed after the 1980s droughts, with mass dying of trees on lateritic soils and where the effect is mitigated on sandy soils [13]. When human pressure is kept low, there is a better chance of recovery through proper management practices that can protect vegetation and encourage regeneration. Moreover, the morphology can temper the effects of low rainfall. This is seen in the fossil valley network with its better water storage capability. However, these areas represent only a small fraction of the study area.
Finally, the human population is an important factor explaining the pattern of woody cover change in Sahel [17] (Figure S2). In Senegal, most areas of woody cover increase are located in sylvo-pastoral reserves (shown in Figure 1), which are semi-protected areas established at the beginning of the 20th century and merely used for grazing purposes. An increased grazing pressure on herbaceous plants can give woody plants an advantage in the competition on water, favouring woody vegetation growth [6]. Furthermore, compared to reforestation areas, these vast forest reserves provide a higher potential for increased woody cover in Senegal if national legislation on protection from logging is enforced by local authorities (according to local people, this is not always the case). Despite their proximity to a major road and to the cities of Touba and Dahra, reserves in Deali and Boulal are examples of successful protection and have shown a strong increase in woody cover (Figure 2).
The increasing woody vegetation which is observed in Senegal can be interpreted as regeneration after severe droughts and a prolonged dry period, and thus as a sign of resilience of an intact ecosystem in which droughts and fires are natural features [36]. This contradicts the outdated view of widespread deforestation and irreversible desertification in Sahel and points towards a rather stable ecosystem [37]. The substantial losses of G. senegalensis in 2015 and the observed regrowth are part of natural cycles in a non-equilibrium ecosystem [13,38] and we have affirmed these rainfall controlled dynamics. On the other hand, shrub encroachment and the loss of herbaceous vegetation in southern Africa is considered an undesired effect for livestock farmers [33,39], the situation in Sahel with less rainfall and infertile soils is however different, and the valuation of the effects of gains and losses in woody cover need to be carefully assessed. Moreover, the spreading of single species leads to a poor biodiversity. The low abundance of Acacia sp. within the greening areas may indicate a shift towards the dominance of Combretaceae and B. aegyptiaca (Figure 8). As our example demonstrated, the lower drought resistance of these species could mean a substantial loss of woody cover if prolonged drought events occur in this area.
In spite of this risk, this study concludes that a large scale woody cover increase is possible in the future if low anthropogenic pressure occurs in tandem with above average rainfall and generates the conditions for woody plants to recover and disperse. Gains in woody vegetation are most prevalent in protected areas (forêt classée), highlighting their utility in comparison to reforestation initiatives (like the Great Green Wall).

5. Conclusions and Outlook

With this study we have explored woody canopy cover dynamics in Senegal by means of several data sources based on remote sensing and in situ observations. A linear trend analysis showed an increase in woody vegetation for the period 2000 to 2015. This was caused mainly by Combretaceae and above normal rainfall conditions between 2003 and 2010. However, the linear character of the trend analysis hides a die off of Guiera senegalensis following several years of low rainfall (2011 to 2014). Woody cover and woody cover trends are highly correlated with mean annual rainfall, with stronger increases in more humid areas. However, although it is obvious that rainfall was the driving factor behind observed woody cover changes, statistical relationships between trends in rainfall and woody cover were weak, showing the importance of other factors (e.g., fire, soil, morphology, human management).
In general, and in spite of low resistance of several species towards short-term rainfall variability, woody cover in central Senegal was found to expand in areas of low human pressure. This includes rapid growth within years of high rainfall and also mass dying after drought years locally canceling the effect of “woody greening”. In the face of a warming climate, an applicable method for assessing woody encroachment and tree mortality is essential for an operational monitoring and enhances our understanding of climate-vegetation interactions and woody plant vulnerability. Our integrated approach based on remote sensing and in situ data gives quantitative and qualitative insights on the extent of changes, but further refinements are necessary to better assess spatial explicit patterns of tree mortality and growth. New data sources (e.g., very high resolution satellite images and passive microwave data) will facilitate woody vegetation assessment without using green foliage mass as proxy.
Finally, the combined impact of CO2 fertilisation, livestock grazing and fire on South Africa’s savanna woody cover and species dynamics have been thoroughly studied but needs to be further analysed in the Sahelian rangelands.

Supplementary Materials

The following are available online at www.mdpi.com/2072-4292/9/1/39/s1, Figure S1: Flowchart illustrating the method for MODIS based woody cover estimations. Adapted and modified from Brandt et al., [1], Figure S2: Human population density and woody cover changes [1]: (a) Human population density derived from the African Population Database for the year 2000 for Senegal. The pastoral reserves are sparsely populated. These are also the areas with the highest increase in woody cover; (b) Woody cover changes in Senegal vary greatly between areas with high and low human population density.

Acknowledgments

The project leading to this application has received funding from the European Union’s Horizon 2020 research and innovation programme under the Marie Sklodowska-Curie grant agreement No. 656564. Geoeye, Quickbird and Worldview 2 images were kindly provided by Compton J. Tucker (NextView License program). We thank Amadou Dieye and Abdoulaye Wele and everyone involved in collecting the ground data at the CSE, as well as Iben Bang Nielsen, Alioune Coumé and all guides and drivers who helped us in the field. We thank Pierre Hiernaux for sharing his knowledge in photo/image interpretation etc., and for his support on developing the methodology. Finally, we thank Brianna Lind, South Dakota State University, and Gene Fosnight, U.S. Geological Survey for their very helpful comments.

Author Contributions

M.B. and R.F. conceived and designed the experiments; M.B., A.D., G.B. and G.T. collected and prepared the data; M.B. and A.D. analyzed the data. M.B., R.F., C.M., A.D. and G.T. wrote the paper.

Conflicts of Interest

The authors declare no conflict of interest.

Appendix A

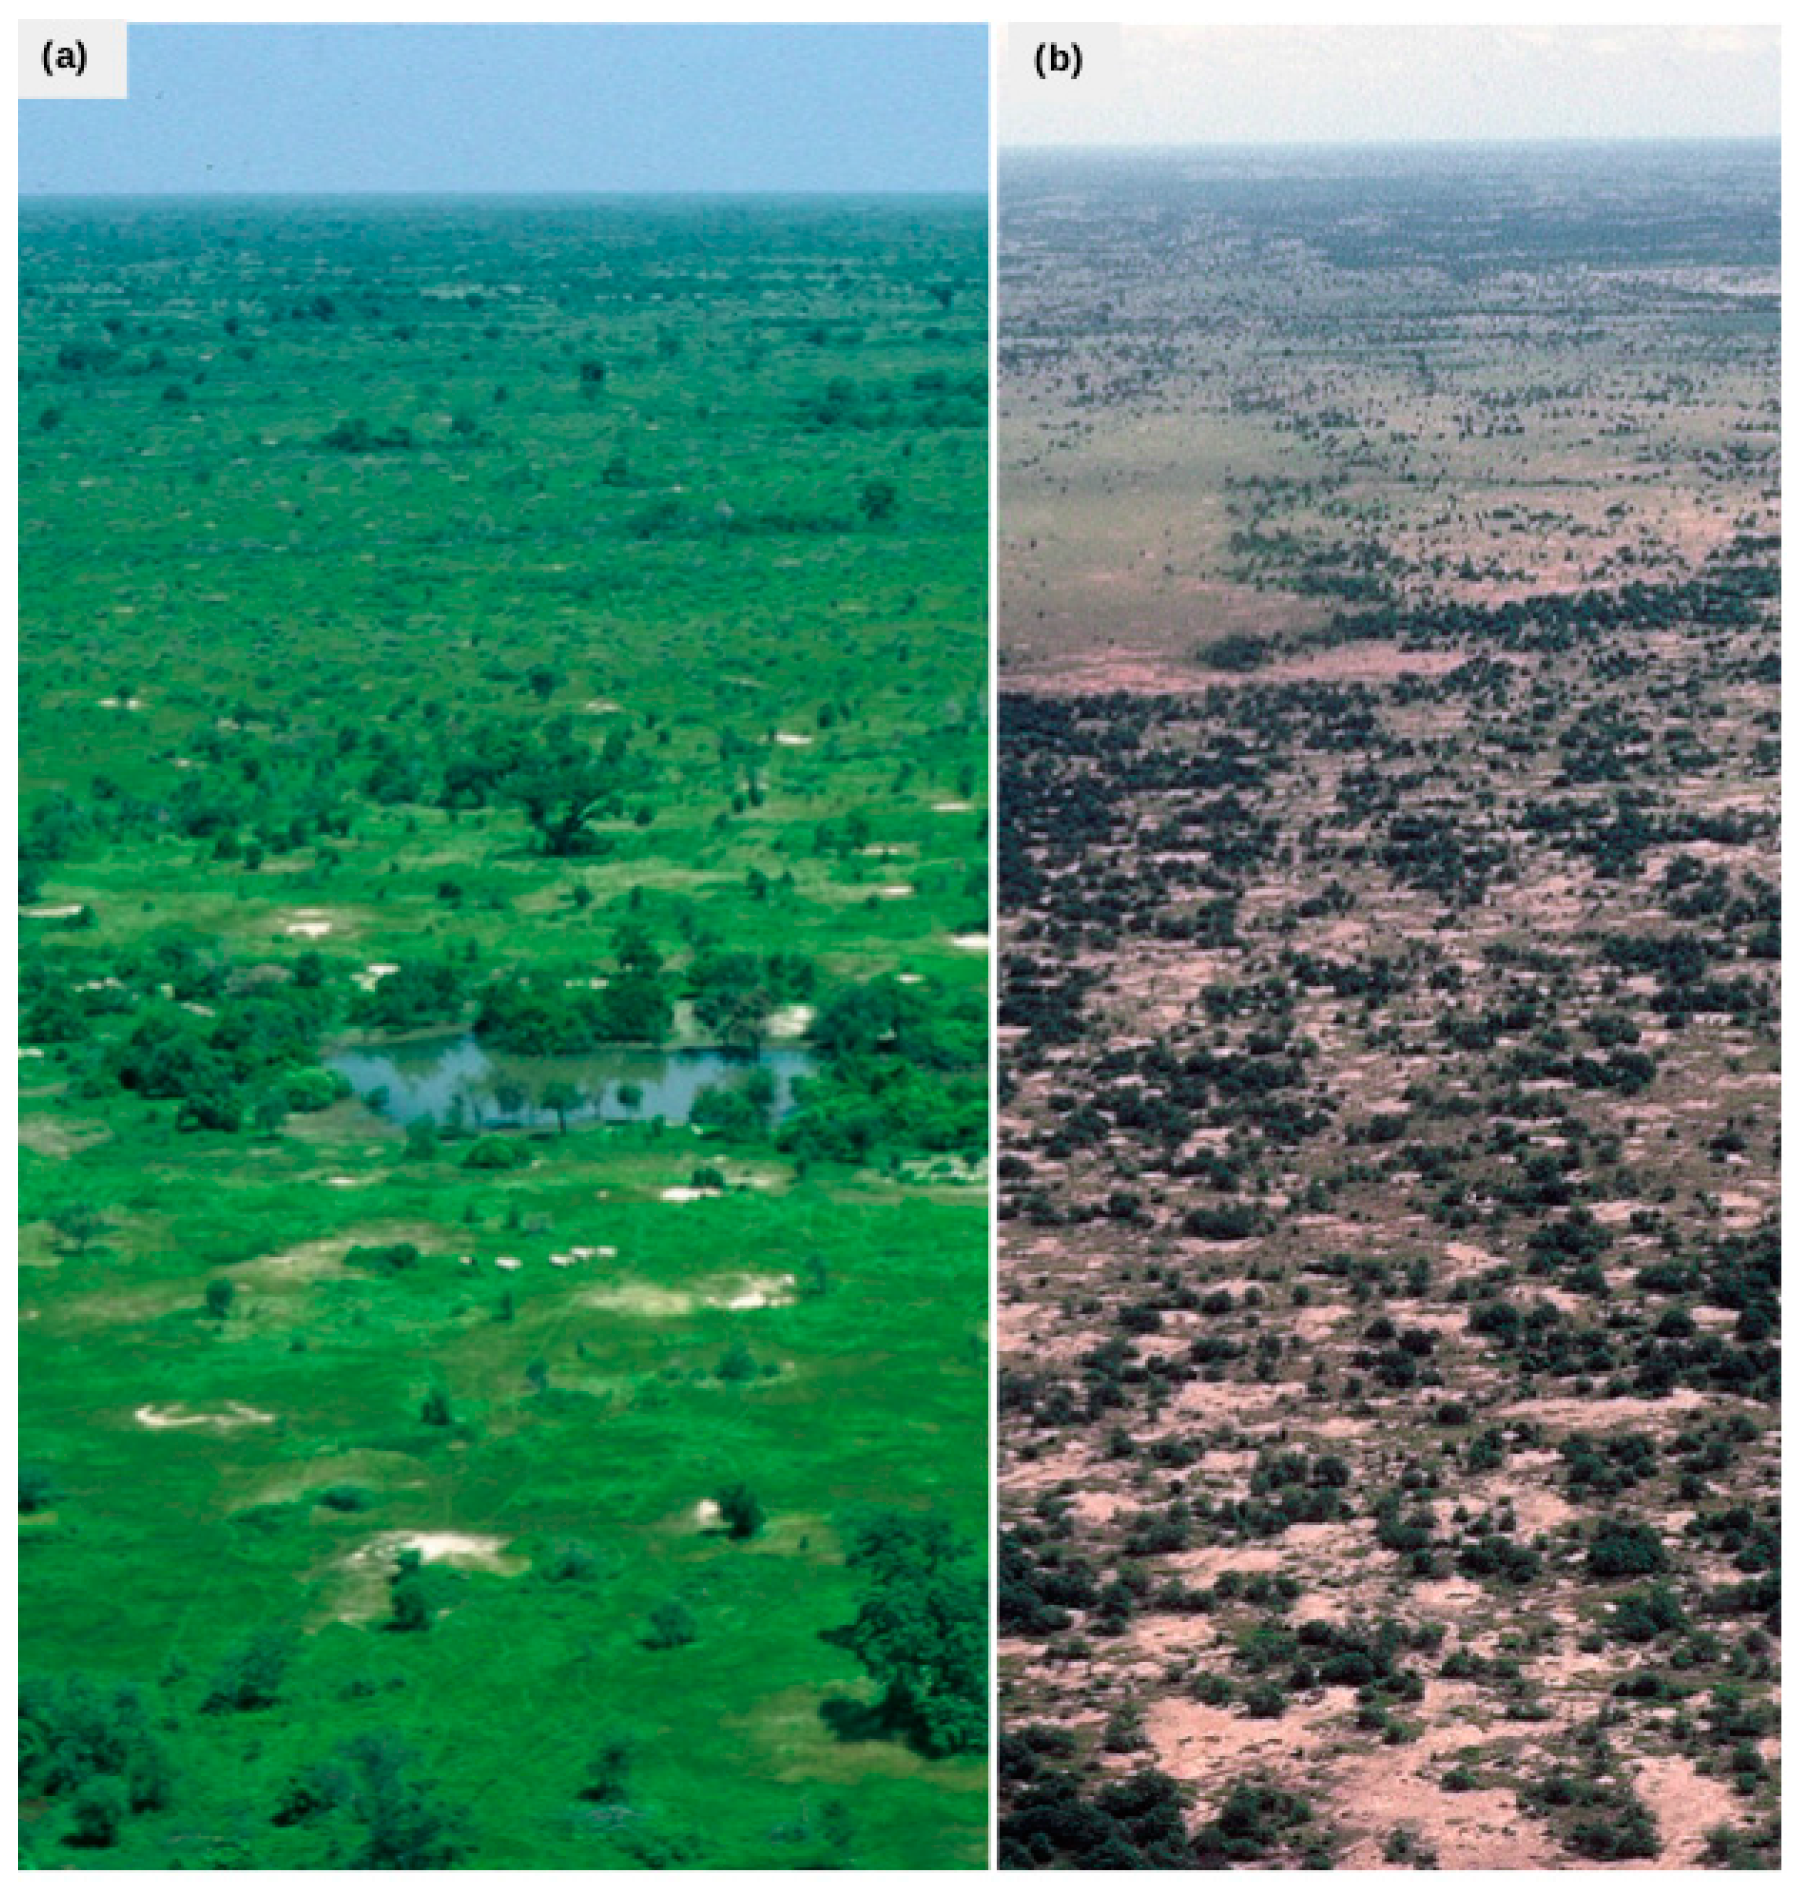
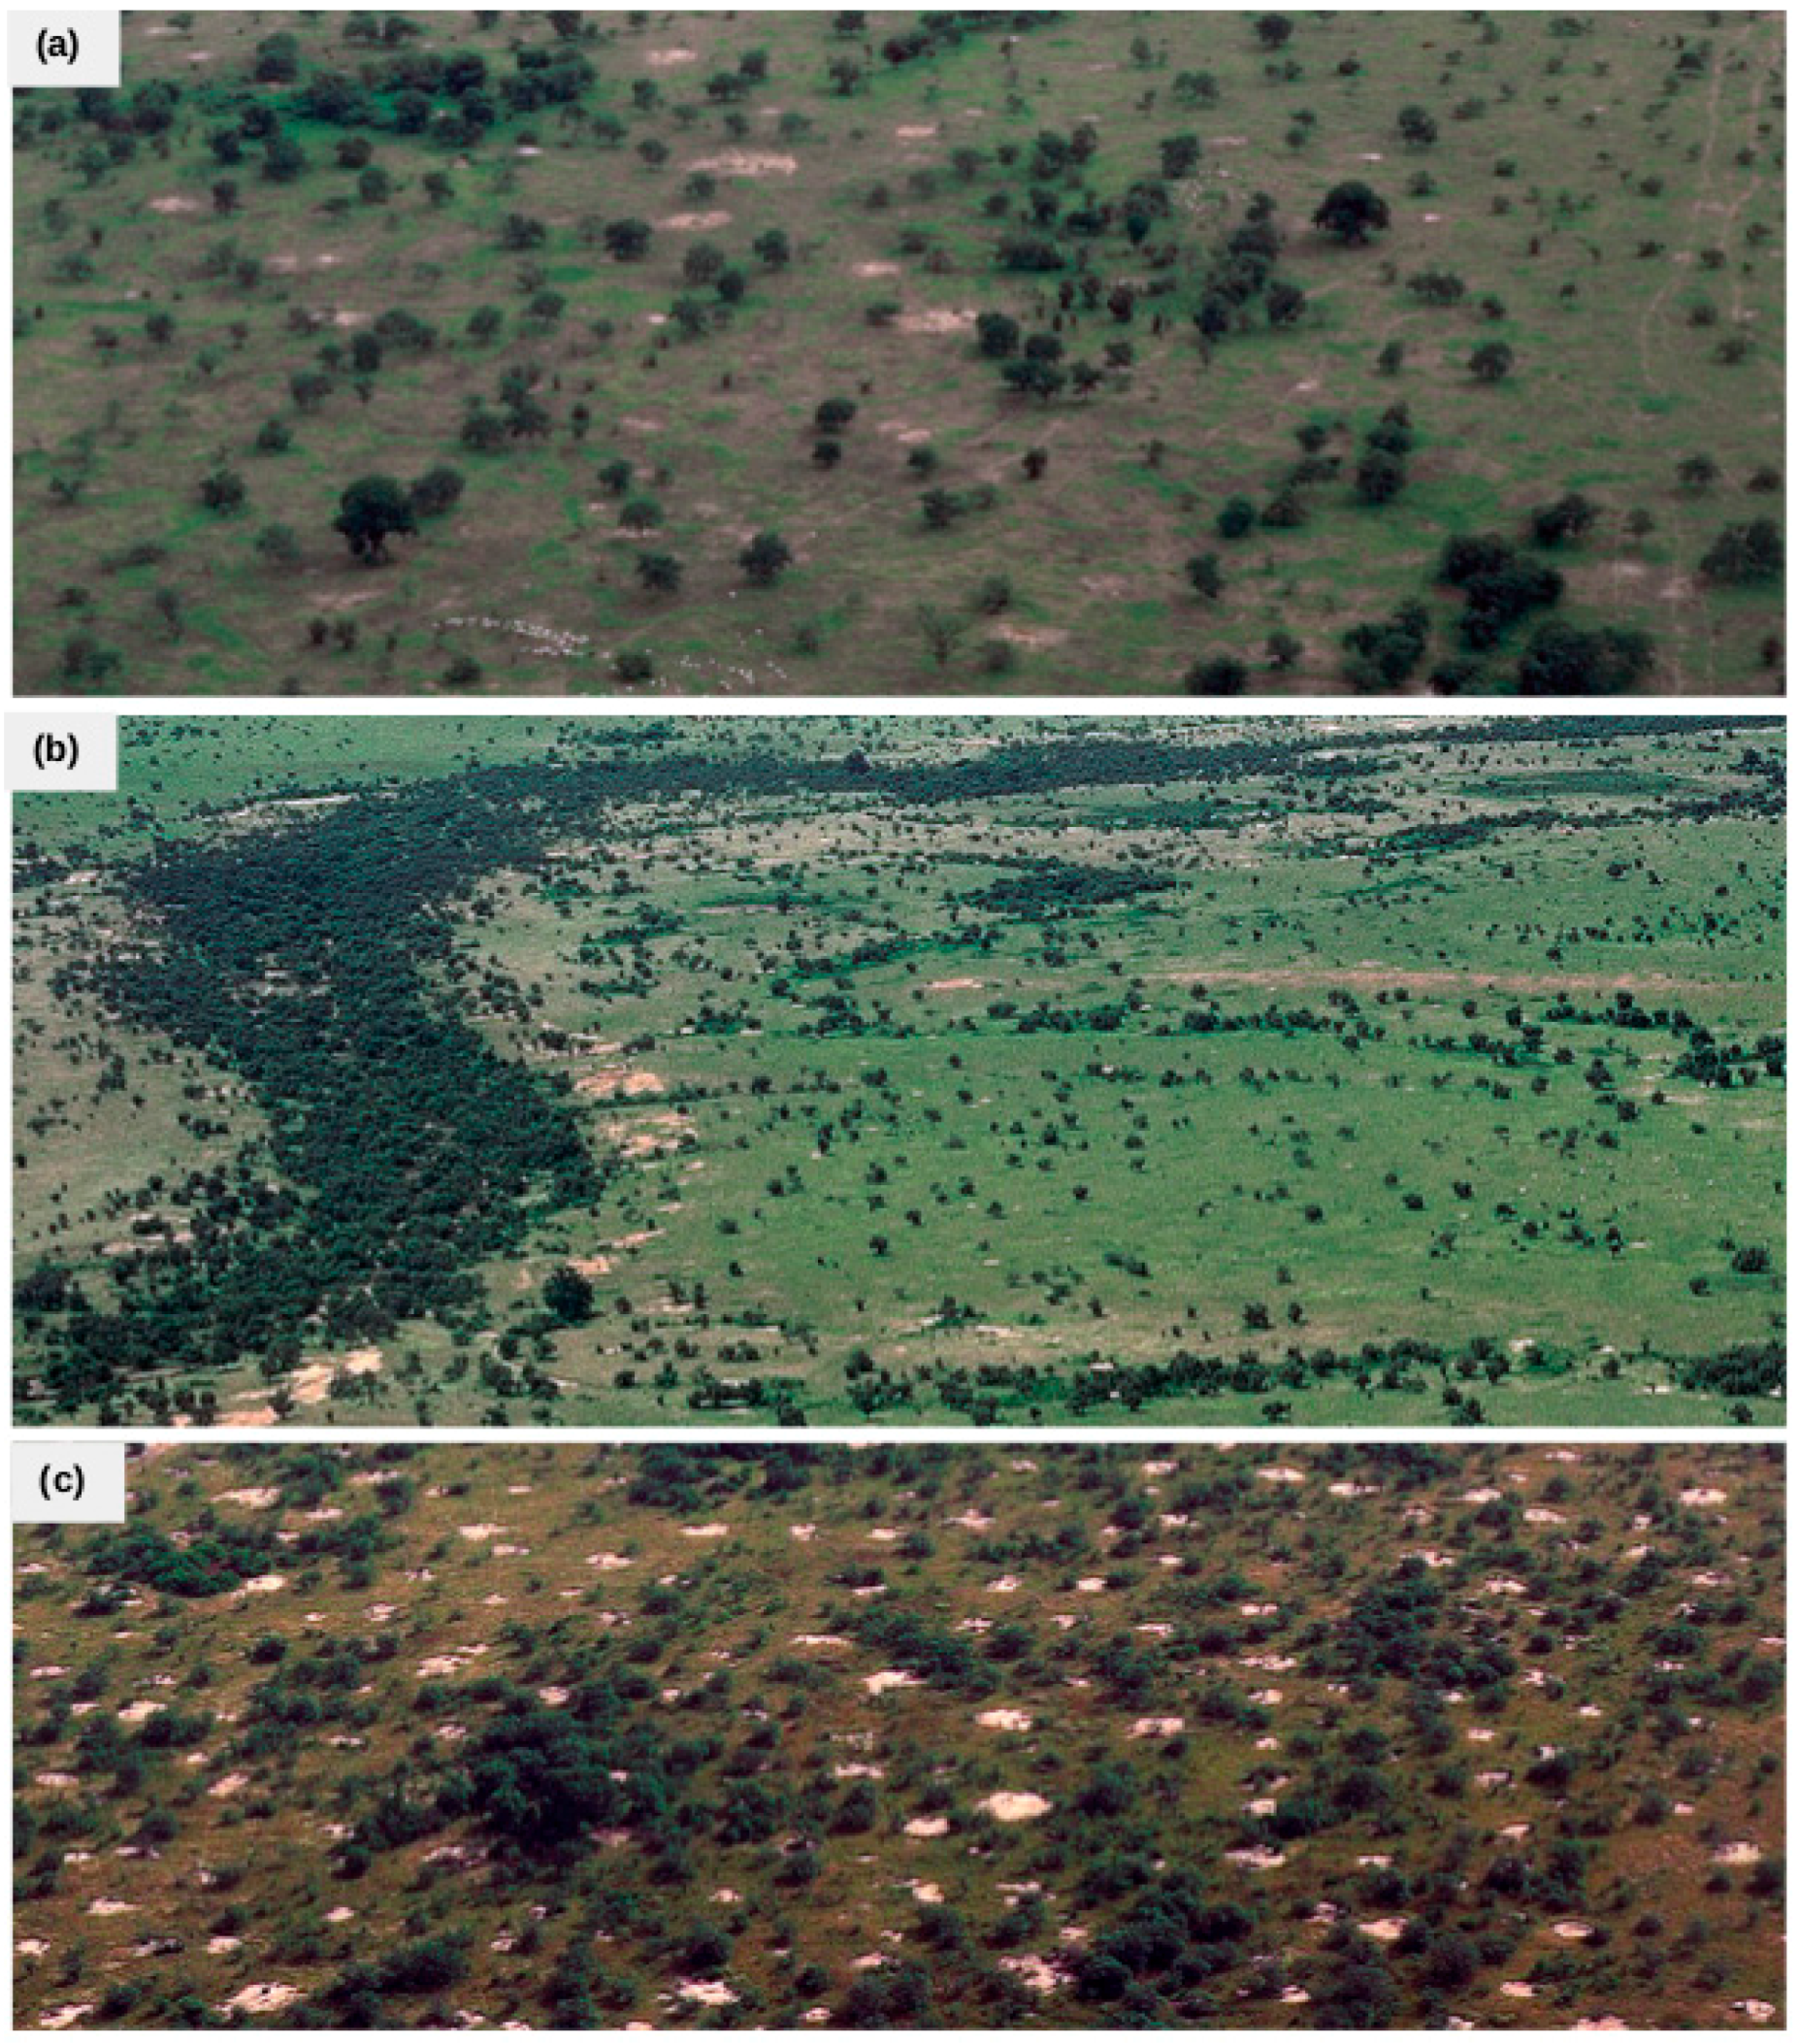
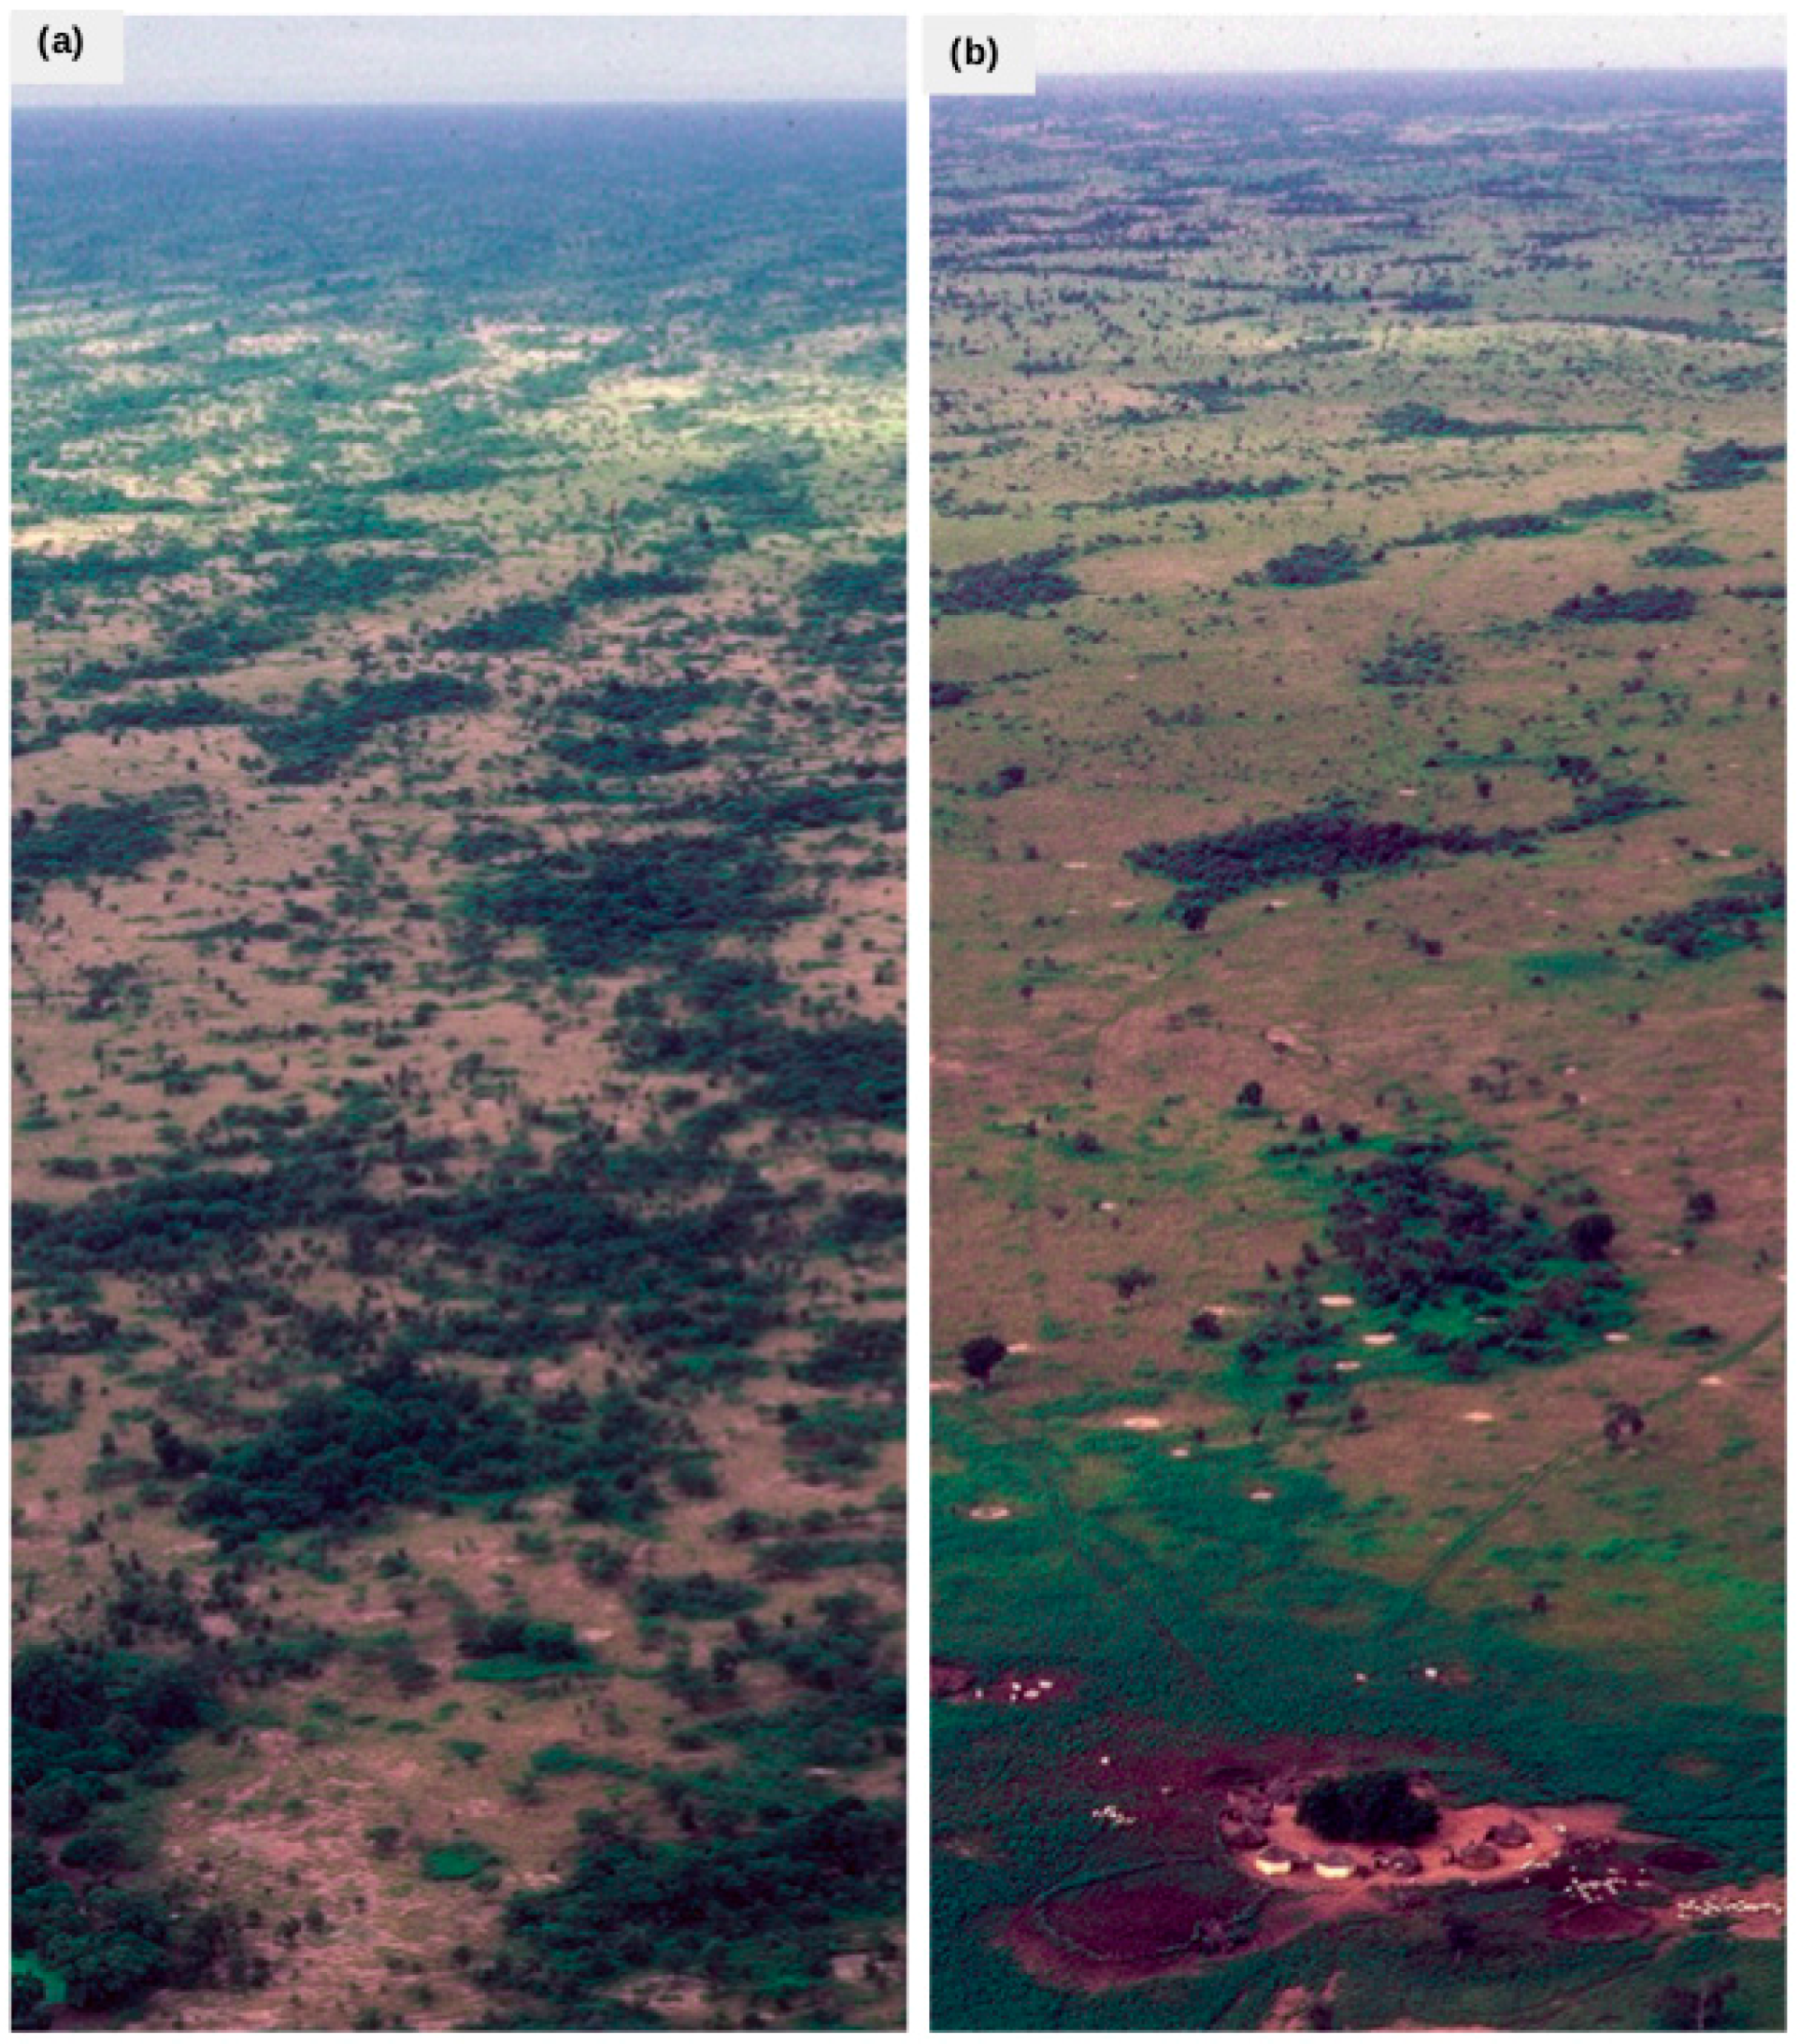
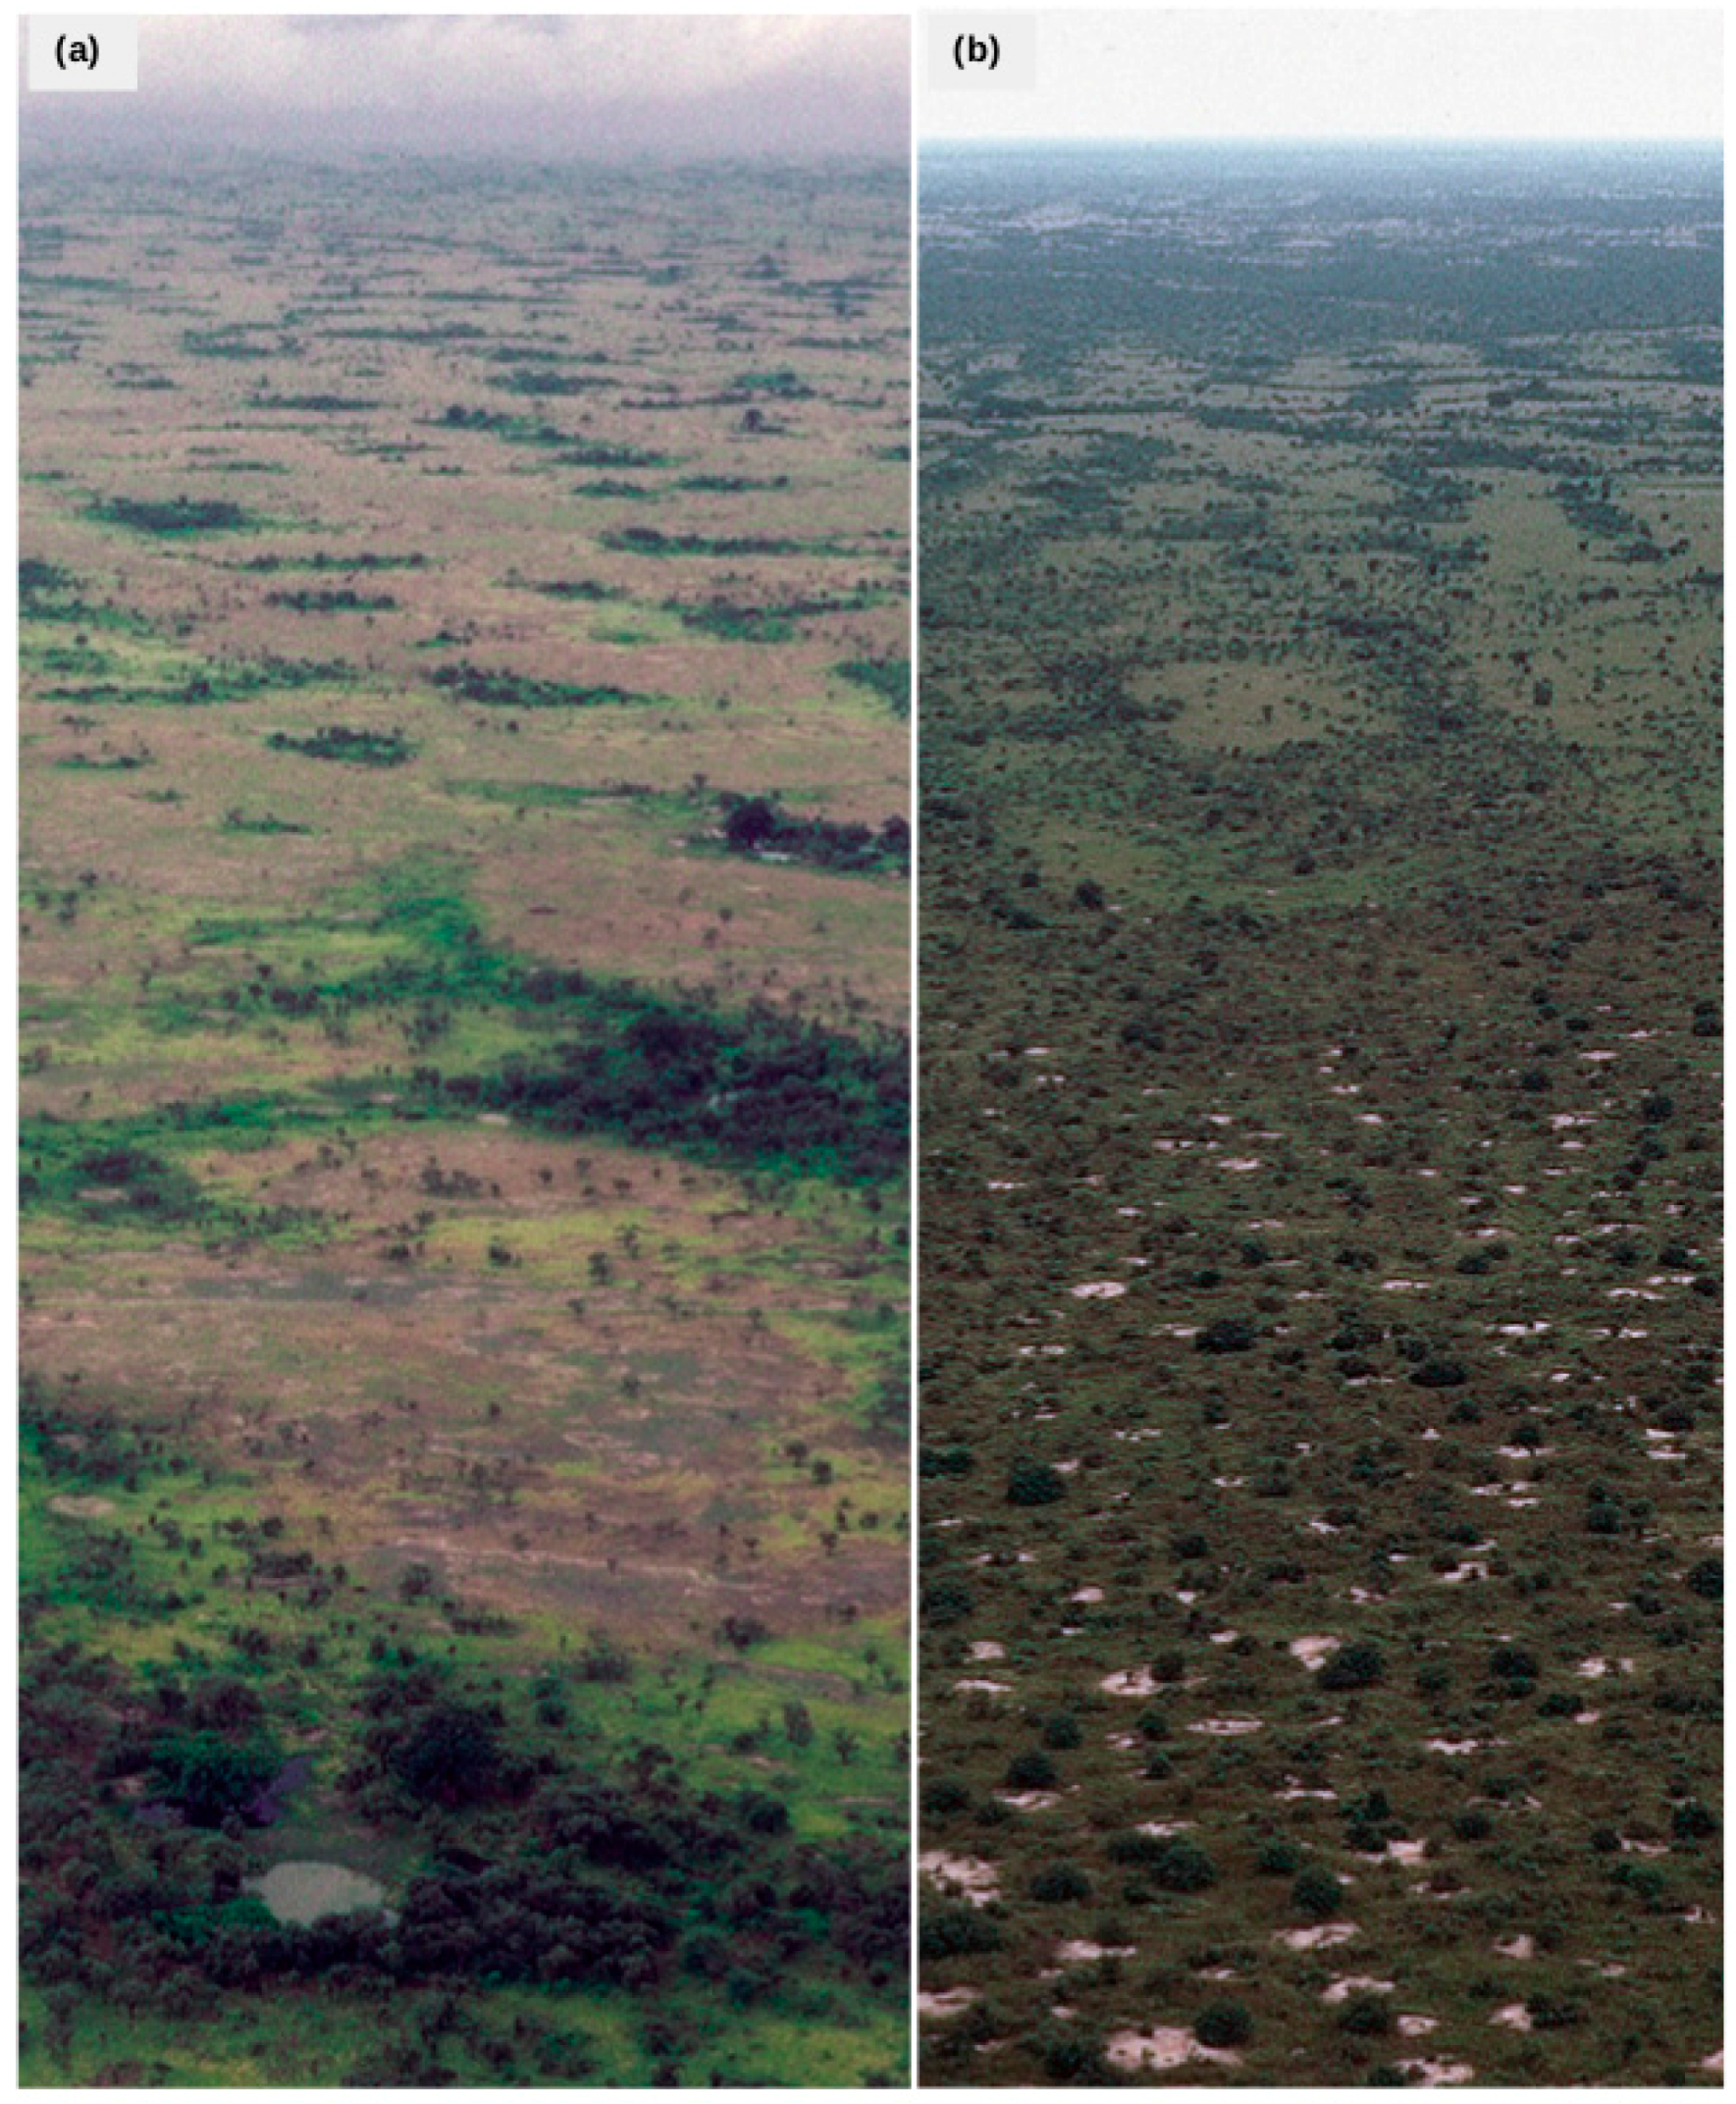
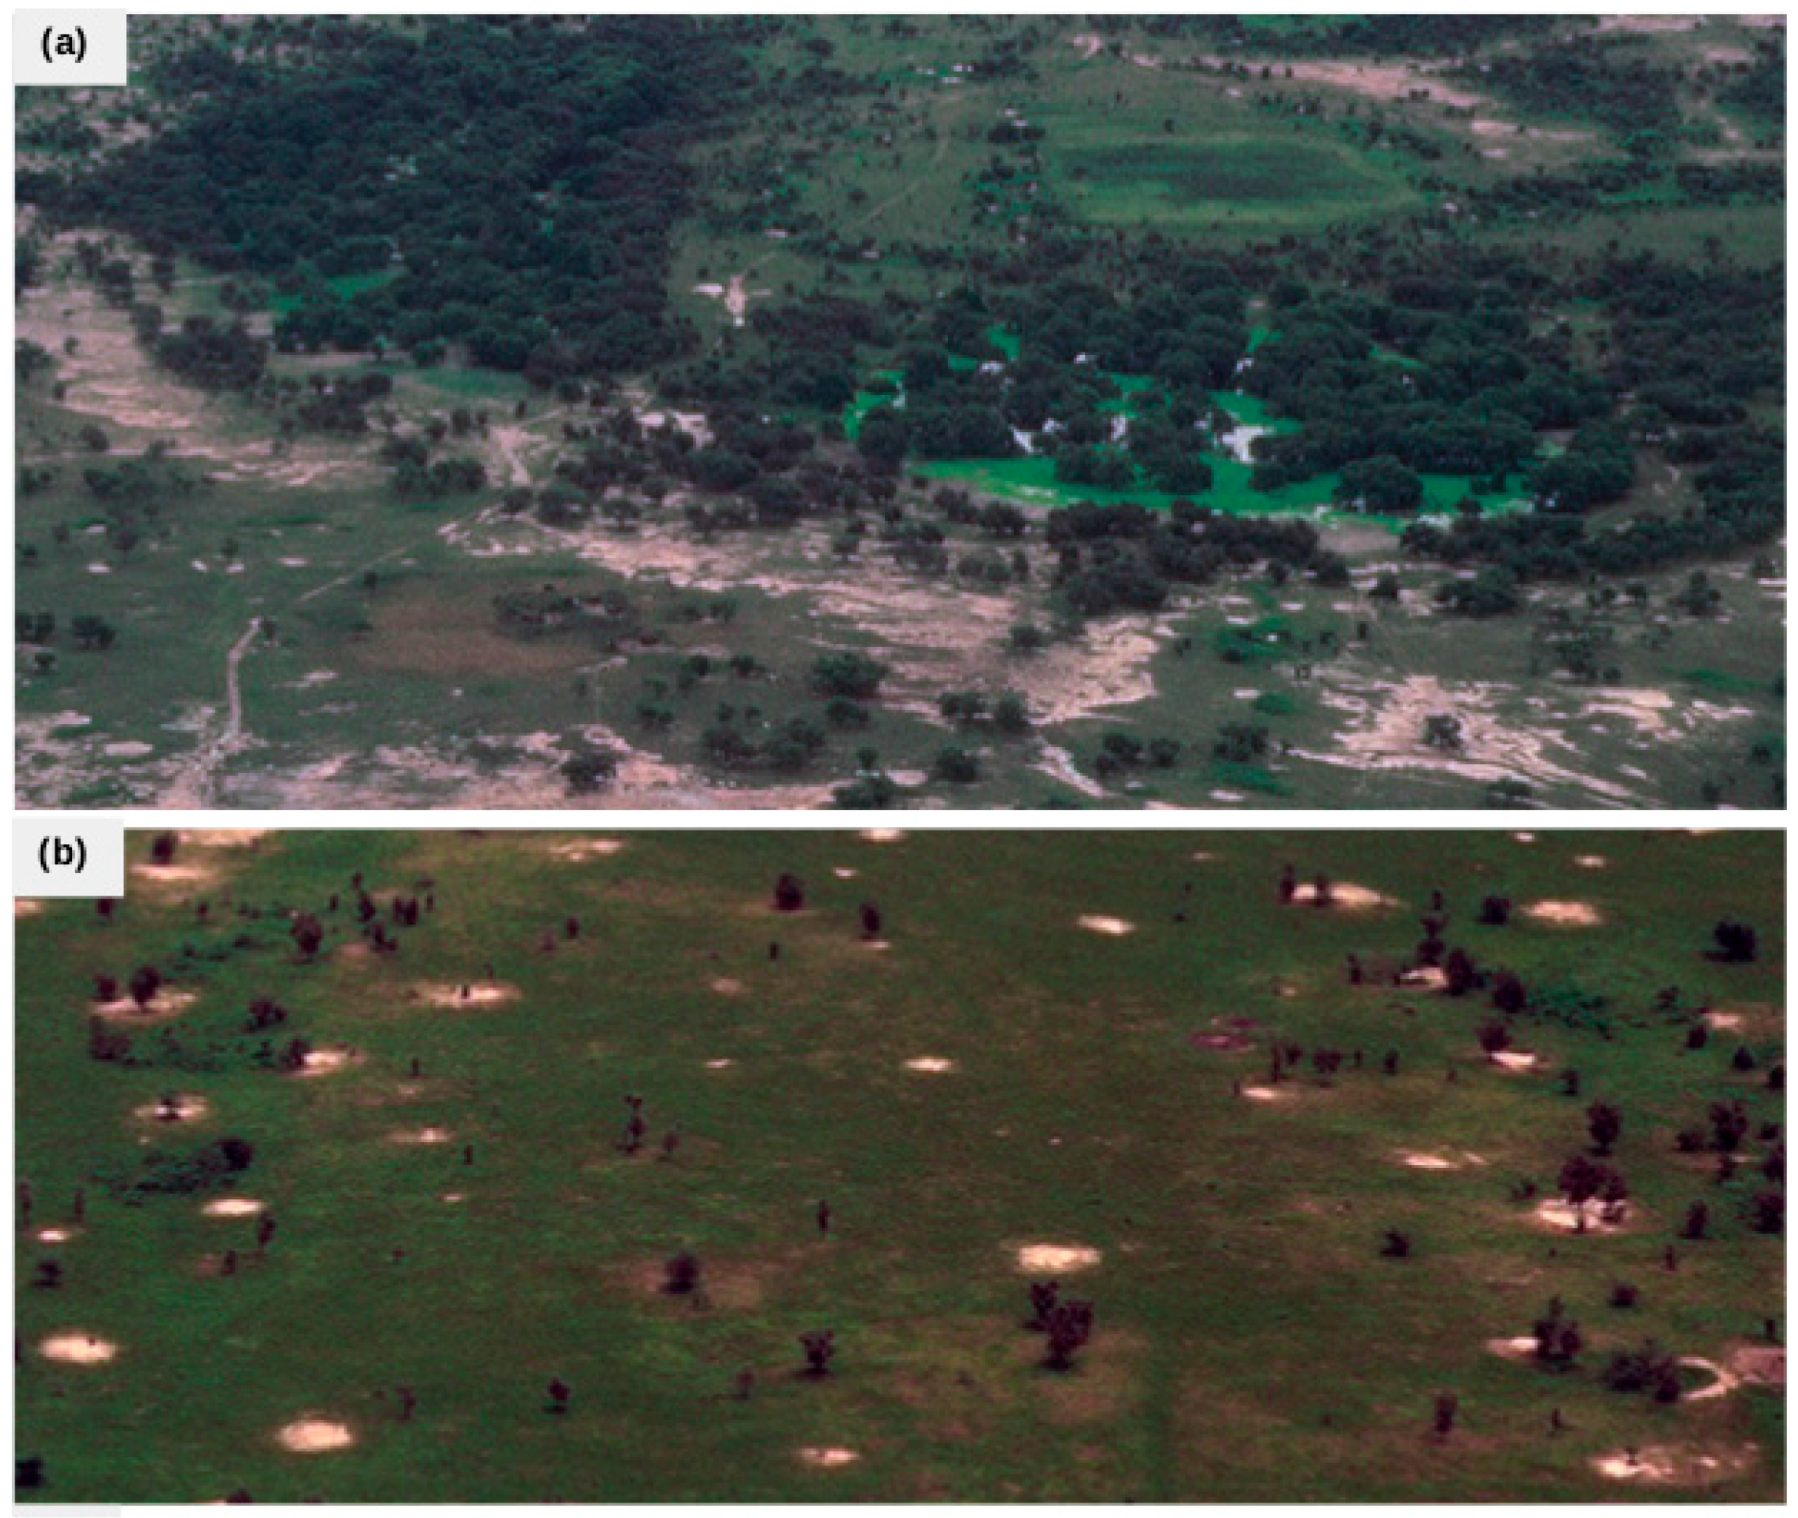
Figure A1. The location of the aerial views presented in Figure A2, Figure A3, Figure A4, Figure A5 and Figure A6 and Figure 1b (Figure 1c is part of A2b and Figure 1d part of A3c).
Remotesensing 09 00039 g011
Figure A2. (a) A low altitude (150 m) view of the shrub and tree savannas of the southern part of the Sandy Pastoral Zone, 26 km east of Gassane, in the Ranch de Doli. It shows one of the thousands of natural seasonal ponds that fill each rainy season. While most of the woody cover looks green and productive, careful interpretation shows a high level of mortality among some of the small trees and shrubs (greyish in appearance). Field work in 1994–1995 confirmed these to be mainly Guiera senegalensis plants; (b) A view of a relatively homogeneous shrub savanna (or bushland) typical of the Ferrugineous Pastoral Zone. Pterocarpus lucens is the dominant small tree. The view shows the often abrupt boundary between the Ferrugineous Pastoral Zone and the Sandy Pastoral Zone. Location: 17 km NE of Linguère.
Remotesensing 09 00039 g012
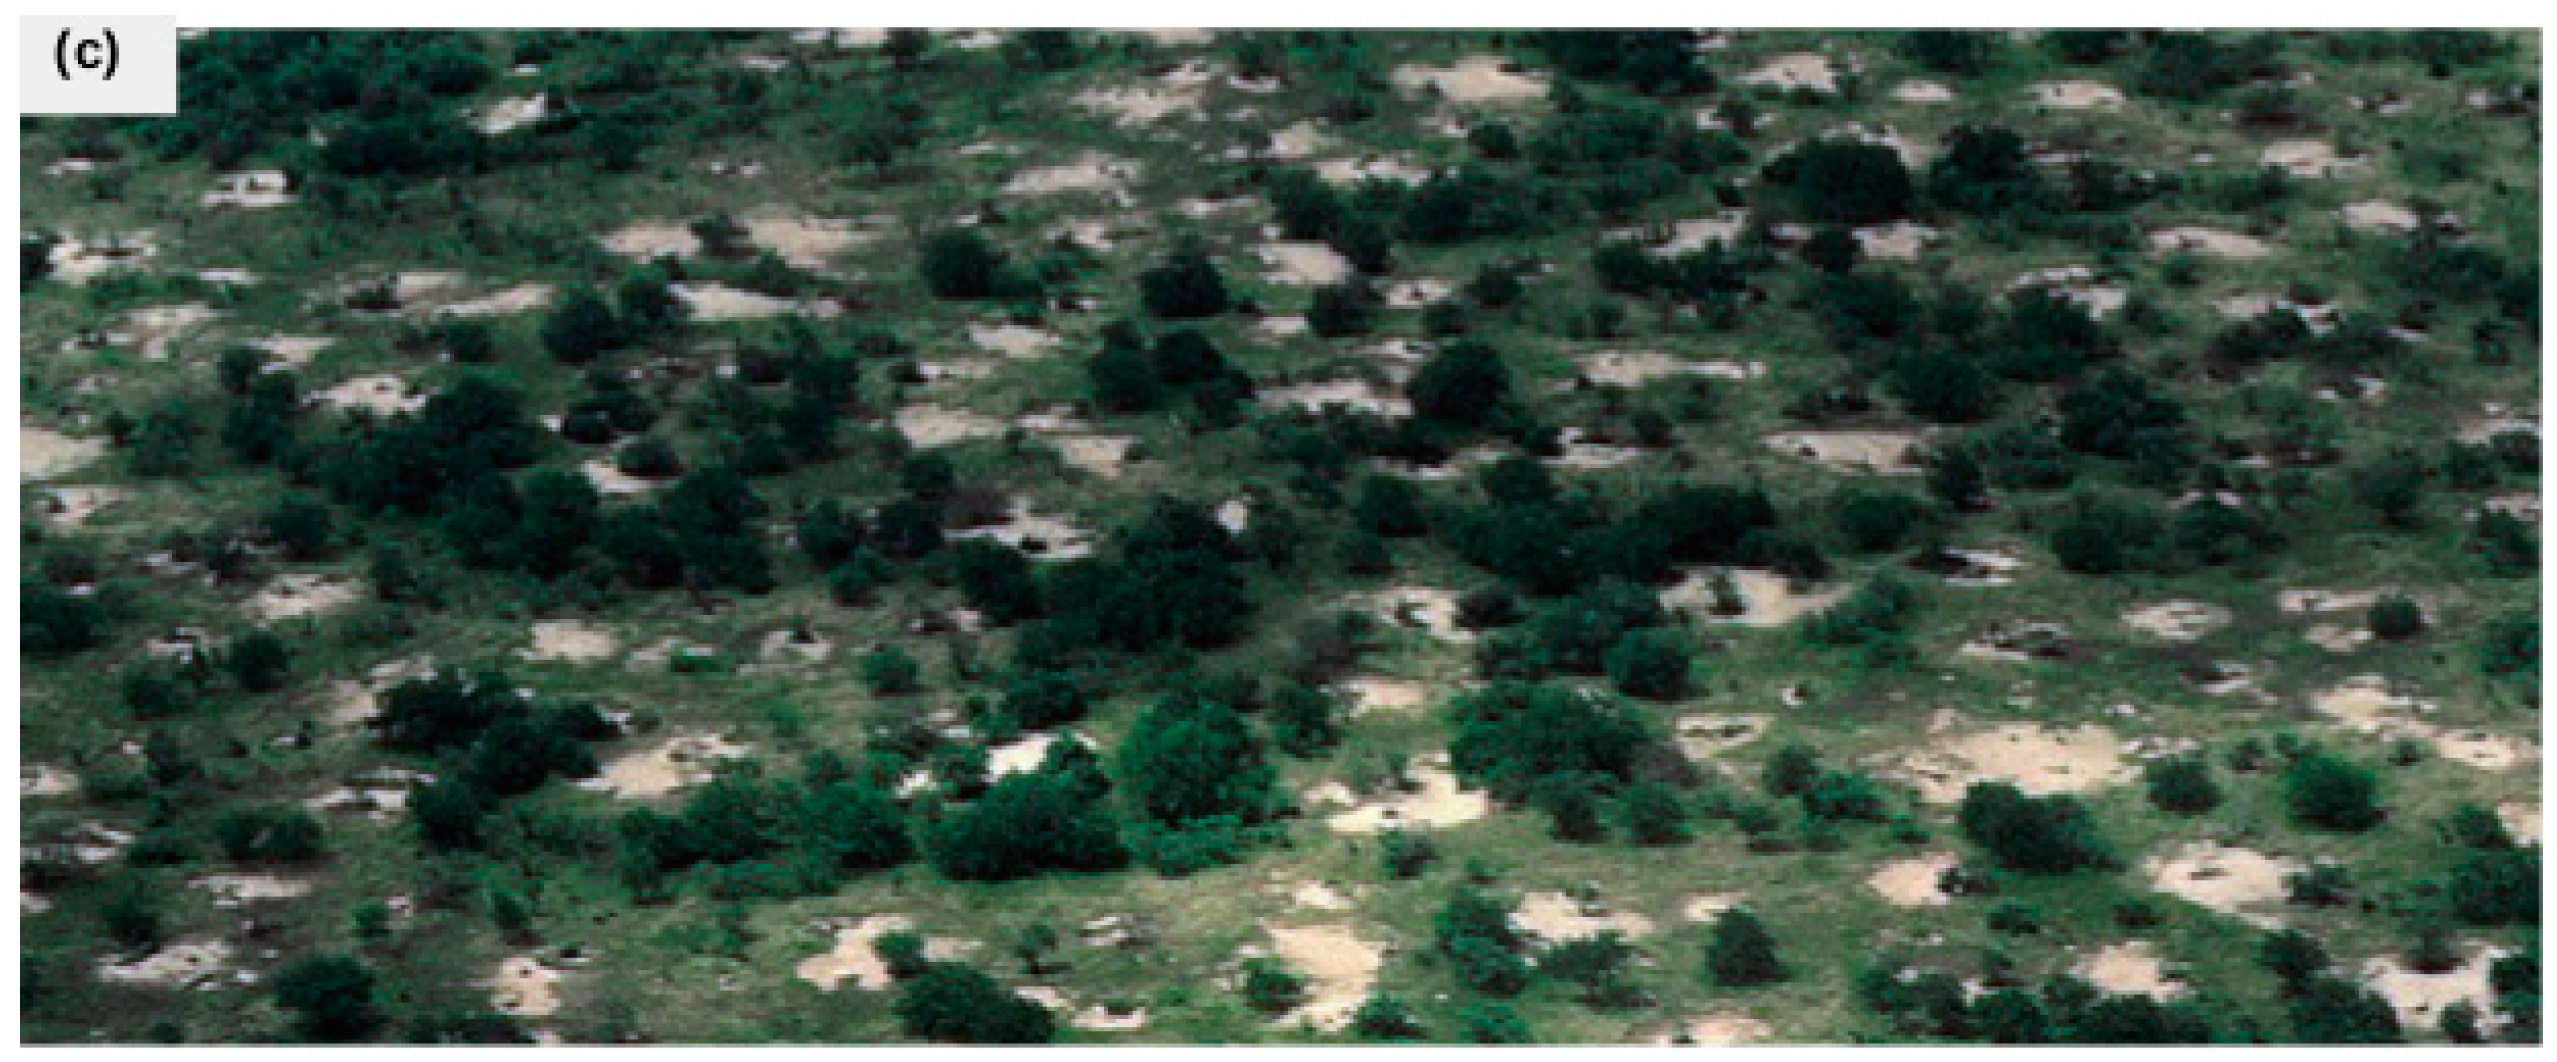
Figure A3. (a) A view of a landscape of ancient sand dunes, eroded to the nearly flat peneplain as observed today, with small depressions that support relatively denser woody vegetation. Grass cover is nearly continuous in the wet season. This view is in the Reserve Sylvo-Pastorale des Six Forages, in the Sandy Pastoral Zone 37 km north of Linguère; (b) An aerial view of the Tiangol Lougguéré, a major tributary to the Ferlo Valley, part of the fossil drainage network that dates to wetter times in during the early Quaternary. While water only flows in this valley briefly after major rainfall, it provides a niche for a relatively dense gallery forest, dominated by species of Acacia (A. nilotica and A. seyal) and Balanites aegyptiaca. The sandy slopes along the valley are beginning to erode as livestock pressure removes the vegetation. Location: 38 km northeast of Linguère; (c) Another view of the relatively homogeneous Ferrugineous Pastoral Zone, dominated by the small tree Pterocarpus lucens. The white patches are the bare soils associated with termite mounds. Termites play an important role in recycling nutrients in the ecosystem. This area is 25 km east of Barkedji.
Remotesensing 09 00039 g013
Figure A4. (a) A view of the more densely vegetated landscapes of the southern part of the Sandy Pastoral Zone, 42 km south-southwest of Linguère, in the Réserve Sylvo-Pastorale d’Oldou Debokol. The ancient longitudinal dune pattern is still clearly visible, with dense vegetation in the interdune depressions, and seasonal ponds that provide surface water to both wildlife and livestock; (b) Thousands of temporary ponds now occupy the depressions of this ancient erg of dunes. These depressions provide moisture for dense vegetation cover, forming a microclimate that represents a refuge of tree species from the Sudanian Zone, including Bombax costatum and Sterculia setigera. In the foreground, the small Fulani camp of Tambedu can be seen. Location: 19 km southwest of Linguère.
Remotesensing 09 00039 g014
Figure A5. (a) An aerial view of the ancient dune landscape, showing the regular pattern of depressions aligned between the ancient longitudinal dunes. The contrast between the wooded depressions and the herbaceous uplands is striking. These productive grasslands occur in the north part of the Reserve des Six Forages, 76 km north of Linguère; (b) An example of the sometimes abrupt contrast between the Ferrugineous Pastoral Zone (foreground) and the Sandy Pastoral Zone (in the distance). The morphology, biogeography and productivity of the two zones are quite different. Note the ancient dune and interdune pattern of the more open sandy zone. Termite mounds characterize the foreground landscape. Location: 25 km southeast of Linguère.
Remotesensing 09 00039 g015
Figure A6. (a) This view captures the local diversity one finds within the Ferlo Valley, part of a fossil drainage system that dates back to more humid periods in the geologic past. Today, the stream flow is ephemeral, and serves to refill the numerous depressions with rain water, creating some of the most important wetlands for migrating birds in the entire Ferlo. The location of the view is from half way between Linguère and Barkedji; (b) This view is typical for some of the most open and degraded landscapes of the Sandy Pastoral Zone, where much of the woody vegetation has been logged for firewood and charcoal production. The grass cover remains continuous and relatively productive. Scattered old termite mounds (most of them no longer functional) are observed. The view is 18 km northeast of Deali; (c) A more detailed view of the structure of the morphology and vegetation cover of the Ferrugineous Pastoral Zone. The thin soils and centuries of termite activity have created a random pattern of bare areas–erosional remnants of once-functional termite mounds. This view is 26 km north of Barkedji.
Remotesensing 09 00039 g016aRemotesensing 09 00039 g016b
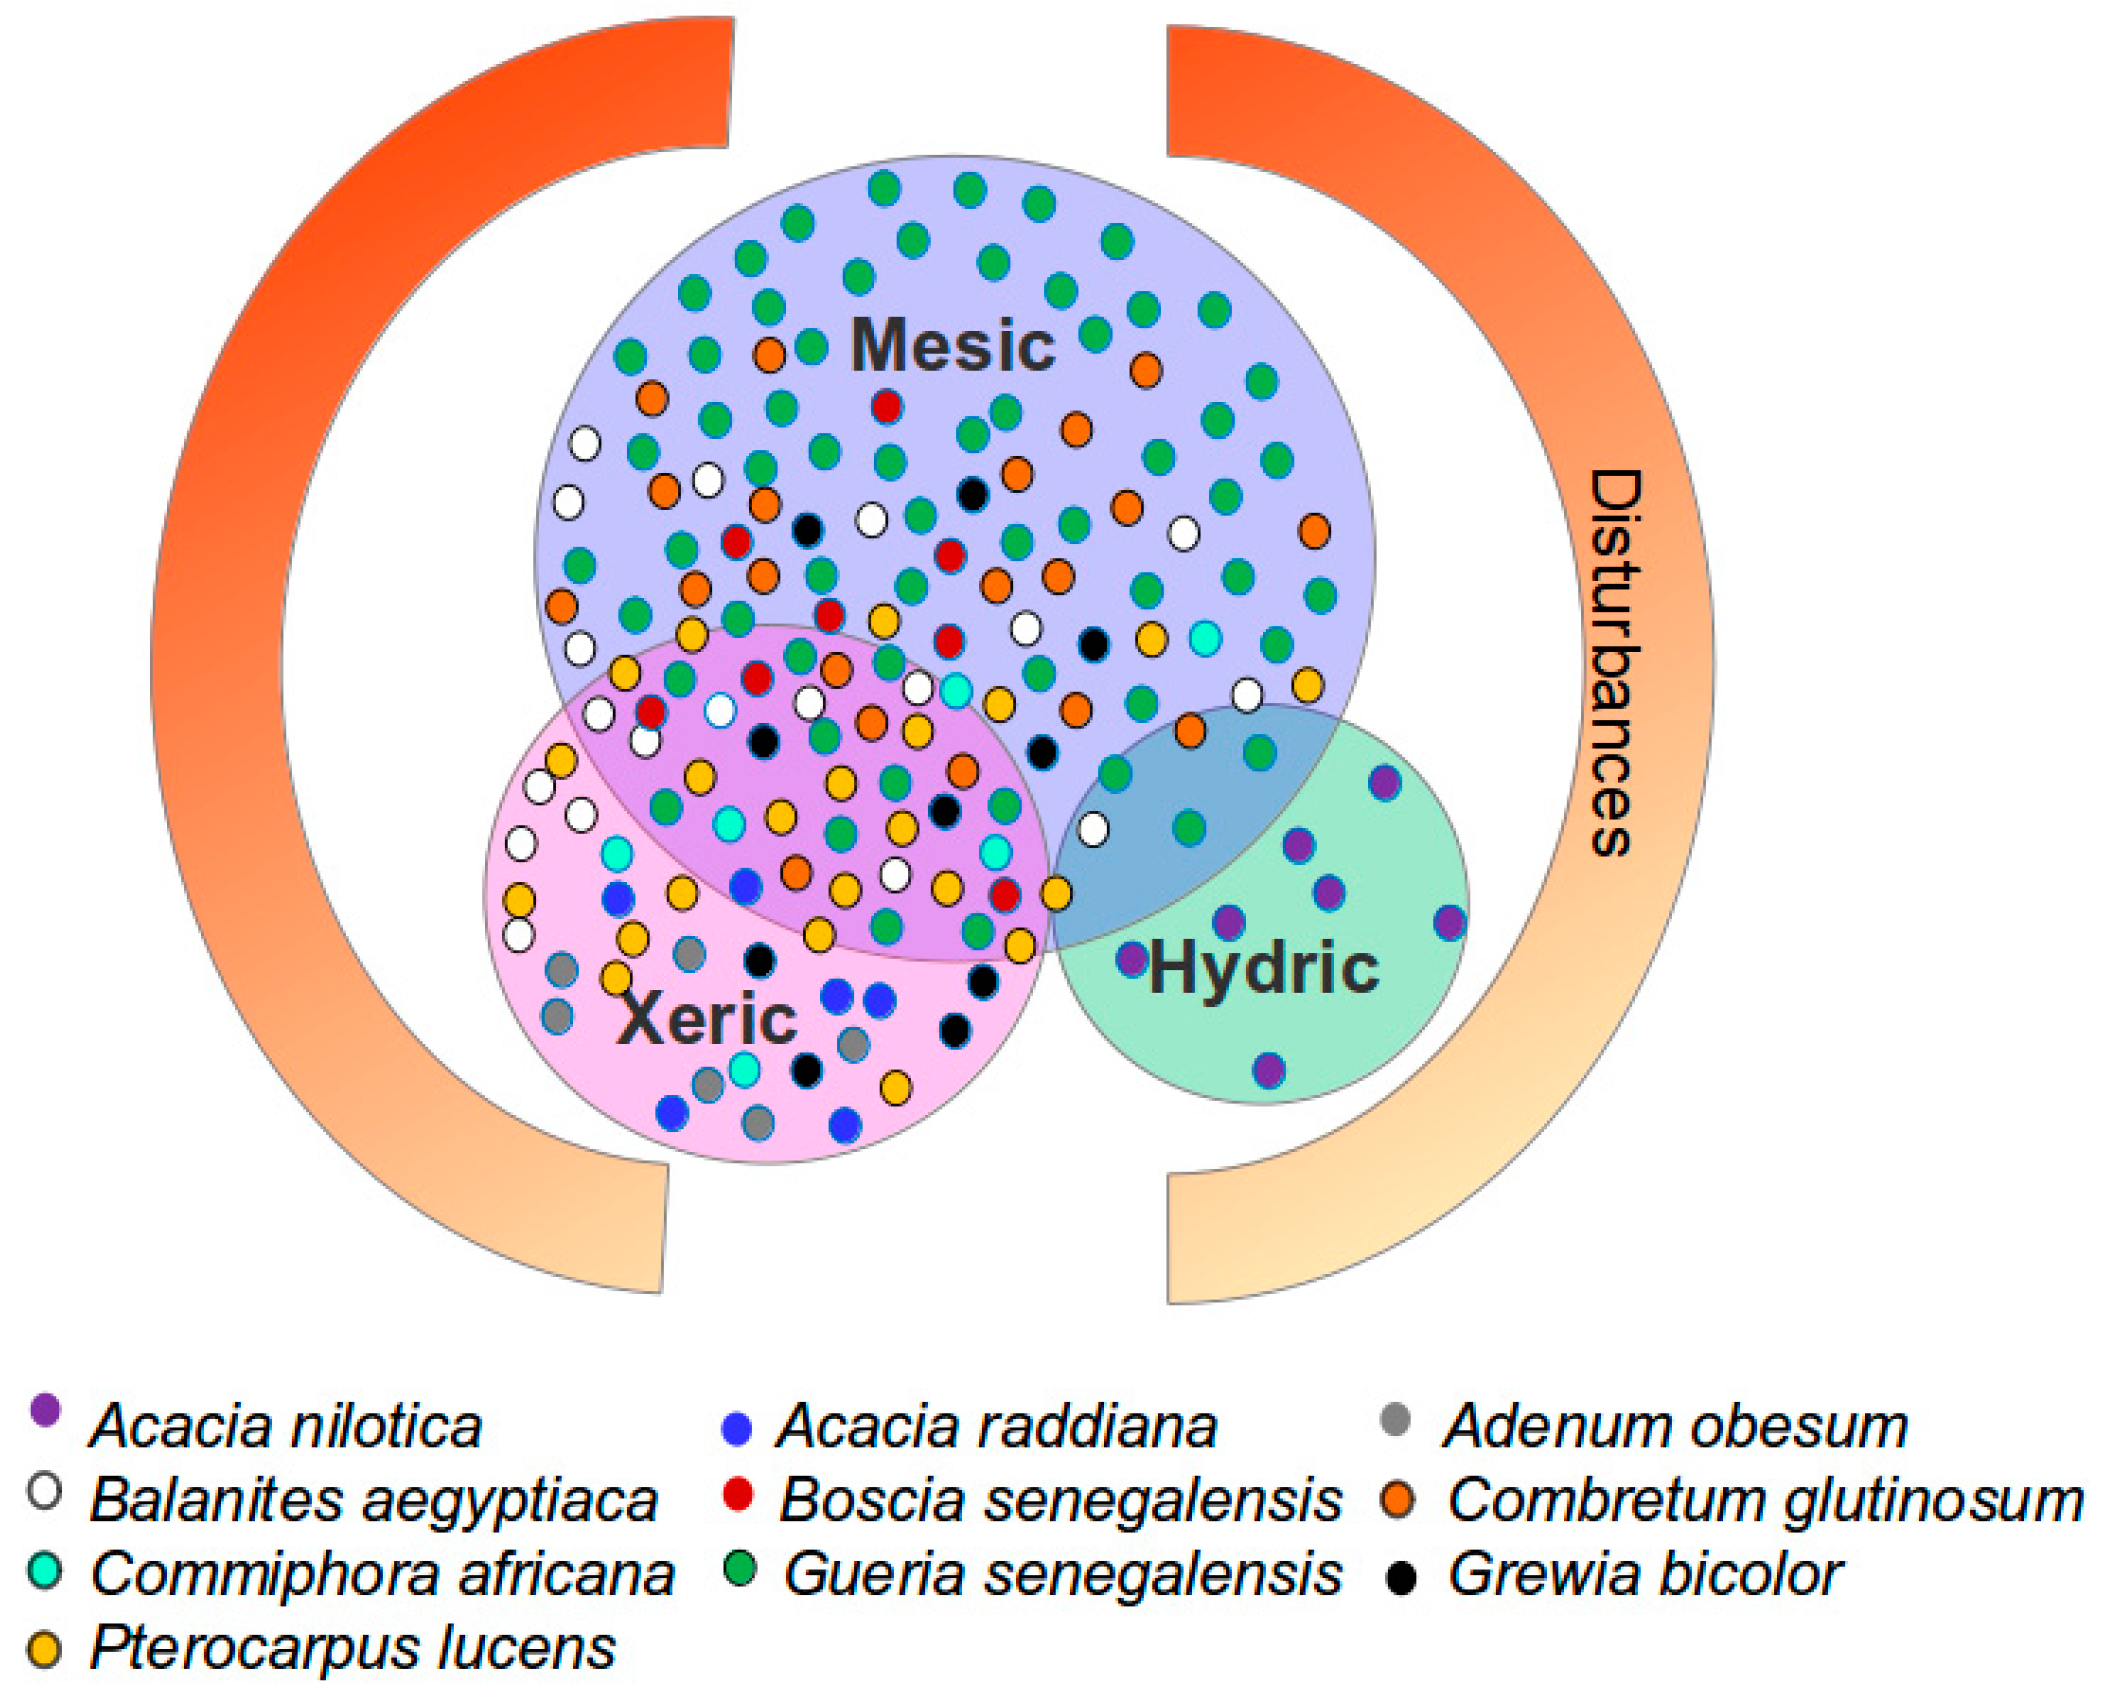
Figure A7. Distribution of woody species in the study area according to their habitat condition and disturbances (human and climate). The species density corresponds to Figure 3 (main text) and was normalized to 150. The size of the circles proportionally reflect the phytogeographic domains of the study area.
Remotesensing 09 00039 g017

References

  1. Karlson, M.; Ostwald, M. Remote sensing of vegetation in the Sudano-Sahelian zone: A literature review from 1975 to 2014. J. Arid Environ. 2016, 124, 257–269. [Google Scholar] [CrossRef]
  2. Mbow, C.; Brandt, M.; Ouedraogo, I.; de Leeuw, J.; Marshall, M. What four decades of Earth Observation tell us about land degradation in the Sahel? Remote Sens. 2015, 7, 4048–4067. [Google Scholar] [CrossRef]
  3. Knauer, K.; Gessner, U.; Dech, S.; Kuenzer, C. Remote sensing of vegetation dynamics in West Africa. Int. J. Remote Sens. 2014, 35, 6357–6396. [Google Scholar] [CrossRef]
  4. Rasmussen, K.; D’haen, S.; Fensholt, R.; Fog, B.; Horion, S.; Nielsen, J.O.; Rasmussen, L.V.; Reenberg, A. Environmental change in the Sahel: Reconciling contrasting evidence and interpretations. Reg. Environ. Chang. 2016, 16, 673–680. [Google Scholar] [CrossRef]
  5. Kaptué, A.T.; Prihodko, L.; Hanan, N.P. On regreening and degradation in Sahelian watersheds. Proc. Natl. Acad. Sci. USA 2015, 112, 12133–12138. [Google Scholar] [CrossRef] [PubMed]
  6. Breman, H.; Kessler, J.-J. Woody Plants in Agro-Ecosystems of Semi-Arid Regions: With an Emphasis on the Sahelian Countries, 1st ed.; Springer: Berlin, Germany, 1995. [Google Scholar]
  7. Brandt, M.; Mbow, C.; Diouf, A.A.; Verger, A.; Samimi, C.; Fensholt, R. Ground- and satellite-based evidence of the biophysical mechanisms behind the greening Sahel. Glob. Chang. Biol. 2015, 21, 1610–1620. [Google Scholar] [CrossRef] [PubMed]
  8. Herrmann, S.M.; Tappan, G.G. Vegetation impoverishment despite greening: A case study from central Senegal. J. Arid Environ. 2013, 90, 55–66. [Google Scholar] [CrossRef]
  9. Gonzalez, P.; Tucker, C.J.; Sy, H. Tree density and species decline in the African Sahel attributable to climate. J. Arid Environ. 2012, 78, 55–64. [Google Scholar] [CrossRef]
  10. Hiernaux, P.; Diarra, L.; Trichon, V.; Mougin, E.; Soumaguel, N.; Baup, F. Woody plant population dynamics in response to climate changes from 1984 to 2006 in Sahel (Gourma, Mali). J. Hydrol. 2009, 375, 103–113. [Google Scholar] [CrossRef] [Green Version]
  11. Brandt, M.; Grau, T.; Mbow, C.; Samimi, C. Modeling soil and woody vegetation in the Senegalese Sahel in the context of environmental change. Land 2014, 3, 770–792. [Google Scholar] [CrossRef]
  12. Vincke, C.; Diédhiou, I.; Grouzis, M. Long term dynamics and structure of woody vegetation in the Ferlo (Senegal). J. Arid Environ. 2010, 74, 268–276. [Google Scholar] [CrossRef]
  13. Tappan, G.G.; Sall, M.; Wood, E.C.; Cushing, M. Ecoregions and land cover trends in Senegal. J. Arid Environ. 2004, 59, 427–462. [Google Scholar] [CrossRef]
  14. Budde, M.E.; Tappan, G.; Rowland, J.; Lewis, J.; Tieszen, L.L. Assessing land cover performance in Senegal, West Africa using 1-km integrated NDVI and local variance analysis. J. Arid Environ. 2004, 59, 481–498. [Google Scholar] [CrossRef]
  15. Tian, F.; Brandt, M.; Liu, Y.Y.; Verger, A.; Tagesson, T.; Diouf, A.A.; Rasmussen, K.; Mbow, C.; Wang, Y.; Fensholt, R. Remote sensing of vegetation dynamics in drylands: Evaluating vegetation optical depth (VOD) using AVHRR NDVI and in situ green biomass data over West African Sahel. Remote Sens. Environ. 2016, 177, 265–276. [Google Scholar] [CrossRef]
  16. Tucker, C.J.; Vanpraet, C.; Boerwinkel, E.; Gaston, A. Satellite remote sensing of total dry matter production in the Senegalese Sahel. Remote Sens. Environ. 1983, 13, 461–474. [Google Scholar] [CrossRef]
  17. Brandt, M.; Hiernaux, P.; Rasmussen, K.; Mbow, C.; Kergoat, L.; Tagesson, T.; Ibrahim, Y.Z.; Wélé, A.; Tucker, C.J.; Fensholt, R. Assessing woody vegetation trends in Sahelian drylands using MODIS based seasonal metrics. Remote Sens. Environ. 2016, 183, 215–225. [Google Scholar] [CrossRef]
  18. Helman, D.; Lensky, I.; Tessler, N.; Osem, Y. A phenology-based method for monitoring woody and herbaceous vegetation in Mediterranean forests from NDVI time series. Remote Sens. 2015, 7, 12314–12335. [Google Scholar] [CrossRef]
  19. Dye, D.G.; Middleton, B.R.; Vogel, J.M.; Wu, Z.; Velasco, M. Exploiting differential vegetation Phenology for satellite-based mapping of semiarid grass vegetation in the Southwestern United States and Northern Mexico. Remote Sens. 2016, 8, 889. [Google Scholar] [CrossRef]
  20. De Keersmaecker, W.; Lhermitte, S.; Honnay, O.; Farifteh, J.; Somers, B.; Coppin, P. How to measure ecosystem stability? An evaluation of the reliability of stability metrics based on remote sensing time series across the major global ecosystems. Glob. Chang. Biol. 2014, 20, 2149–2161. [Google Scholar] [CrossRef] [PubMed]
  21. Diouf, A.A.; Brandt, M.; Verger, A.; Jarroudi, M.E.; Djaby, B.; Fensholt, R.; Ndione, J.A.; Tychon, B. Fodder biomass monitoring in Sahelian rangelands using phenological metrics from FAPAR time series. Remote Sens. 2015, 7, 9122–9148. [Google Scholar] [CrossRef]
  22. Myneni, R.B.; Hall, F.G. The interpretation of spectral vegetation indexes. IEEE Trans. Geosci. Remote Sens. 1995, 33, 481–486. [Google Scholar] [CrossRef]
  23. Dinku, T.; Ceccato, P.; Grover-Kopec, E.; Lemma, M.; Connor, S.J.; Ropelewski, C.F. Validation of satellite rainfall products over East Africa’s complex topography. Int. J. Remote Sens. 2007, 28, 1503–1526. [Google Scholar] [CrossRef]
  24. Toté, C.; Patricio, D.; Boogaard, H.; van der Wijngaart, R.; Tarnavsky, E.; Funk, C. Evaluation of satellite rainfall estimates for drought and flood monitoring in Mozambique. Remote Sens. 2015, 7, 1758–1776. [Google Scholar] [CrossRef]
  25. Novella, N.S.; Thiaw, W.M. African rainfall climatology version 2 for famine early warning systems. J. Appl. Meteorol. Climatol. 2013, 52, 588–606. [Google Scholar] [CrossRef]
  26. Brandt, M.; Hiernaux, P.; Tagesson, T.; Verger, A.; Rasmussen, K.; Diouf, A.A.; Mbow, C.; Mougin, E.; Fensholt, R. Woody plant cover estimation in drylands from Earth Observation based seasonal metrics. Remote Sens. Environ. 2016, 172, 28–38. [Google Scholar] [CrossRef]
  27. Bégué, A.; Vintrou, E.; Ruelland, D.; Claden, M.; Dessay, N. Can a 25-year trend in Soudano-Sahelian vegetation dynamics be interpreted in terms of land use change? A remote sensing approach. Glob. Environ. Chang. 2011, 21, 413–420. [Google Scholar] [CrossRef]
  28. Stevens, N.; Lehmann, C.E.R.; Murphy, B.P.; Durigan, G. Savanna woody encroachment is widespread across three continents. Glob. Chang. Biol. 2017, 23, 235–244. [Google Scholar] [CrossRef] [PubMed]
  29. Mitchard, E.T.A.; Flintrop, C.M. Woody encroachment and forest degradation in sub-Saharan Africa’s woodlands and savannas 1982–2006. Philos. Trans. R. Soc. Lond. B Biol. Sci. 2013, 368, 20120406. [Google Scholar] [CrossRef] [PubMed] [Green Version]
  30. O’Connor, T.G.; Puttick, J.R.; Hoffman, M.T. Bush encroachment in southern Africa: Changes and causes. Afr. J. Range Forage Sci. 2014, 31, 67–88. [Google Scholar] [CrossRef]
  31. Buitenwerf, R.; Bond, W.J.; Stevens, N.; Trollope, W.S.W. Increased tree densities in South African savannas: >50 years of data suggests CO2 as a driver. Glob. Chang. Biol. 2012, 18, 675–684. [Google Scholar] [CrossRef]
  32. Stevens, N.; Erasmus, B.F.N.; Archibald, S.; Bond, W.J. Woody encroachment over 70 years in South African savannahs: Overgrazing, global change or extinction aftershock? Philos. Trans. R. Soc. Lond. B Biol. Sci. 2016, 371, 20150437. [Google Scholar] [CrossRef] [PubMed]
  33. Wigley, B.J.; Bond, W.J.; Hoffman, M.T. Thicket expansion in a South African savanna under divergent land use: Local vs. global drivers? Glob. Chang. Biol. 2010, 16, 964–976. [Google Scholar] [CrossRef]
  34. Tian, F.; Brandt, M.; Liu, Y.Y.; Rasmussen, K.; Fensholt, R. Mapping gains and losses in woody vegetation across global tropical drylands. Glob. Chang. Biol. 2016. [Google Scholar] [CrossRef] [PubMed]
  35. Gaze, S.R.; Brouwer, J.; Simmonds, L.P.; Bromley, J. Dry season water use patterns under Guiera senegalensis L. shrubs in a tropical savanna. J. Arid Environ. 1998, 40, 53–67. [Google Scholar] [CrossRef]
  36. Hill, M.J.; Hanan, N.P. Ecosystem Function in Savannas: Measurement and Modeling at Landscape to Global Scales, 1st ed.; CRC Press: Boca Raton, FL, USA, 2010. [Google Scholar]
  37. The End of Desertification? Behnke, R.; Mortimore, M. (Eds.) Springer Earth System Sciences; Springer: Berlin, Germany, 2016.
  38. Hiernaux, P. Implications of the ‘new rangeland paradigm’ for natural resource management. In Proceedings of the 12th Danish Sahel Workshop, Copenhagen, Denmark, 3–5 January 2000; pp. 113–142.
  39. Kgosikoma, O.E.; Mogotsi, K. Understanding the causes of bush encroachment in Africa: The key to effective management of savanna grasslands. Trop. Grassl. Forrajes Trop. 2013, 1, 215–219. [Google Scholar] [CrossRef]
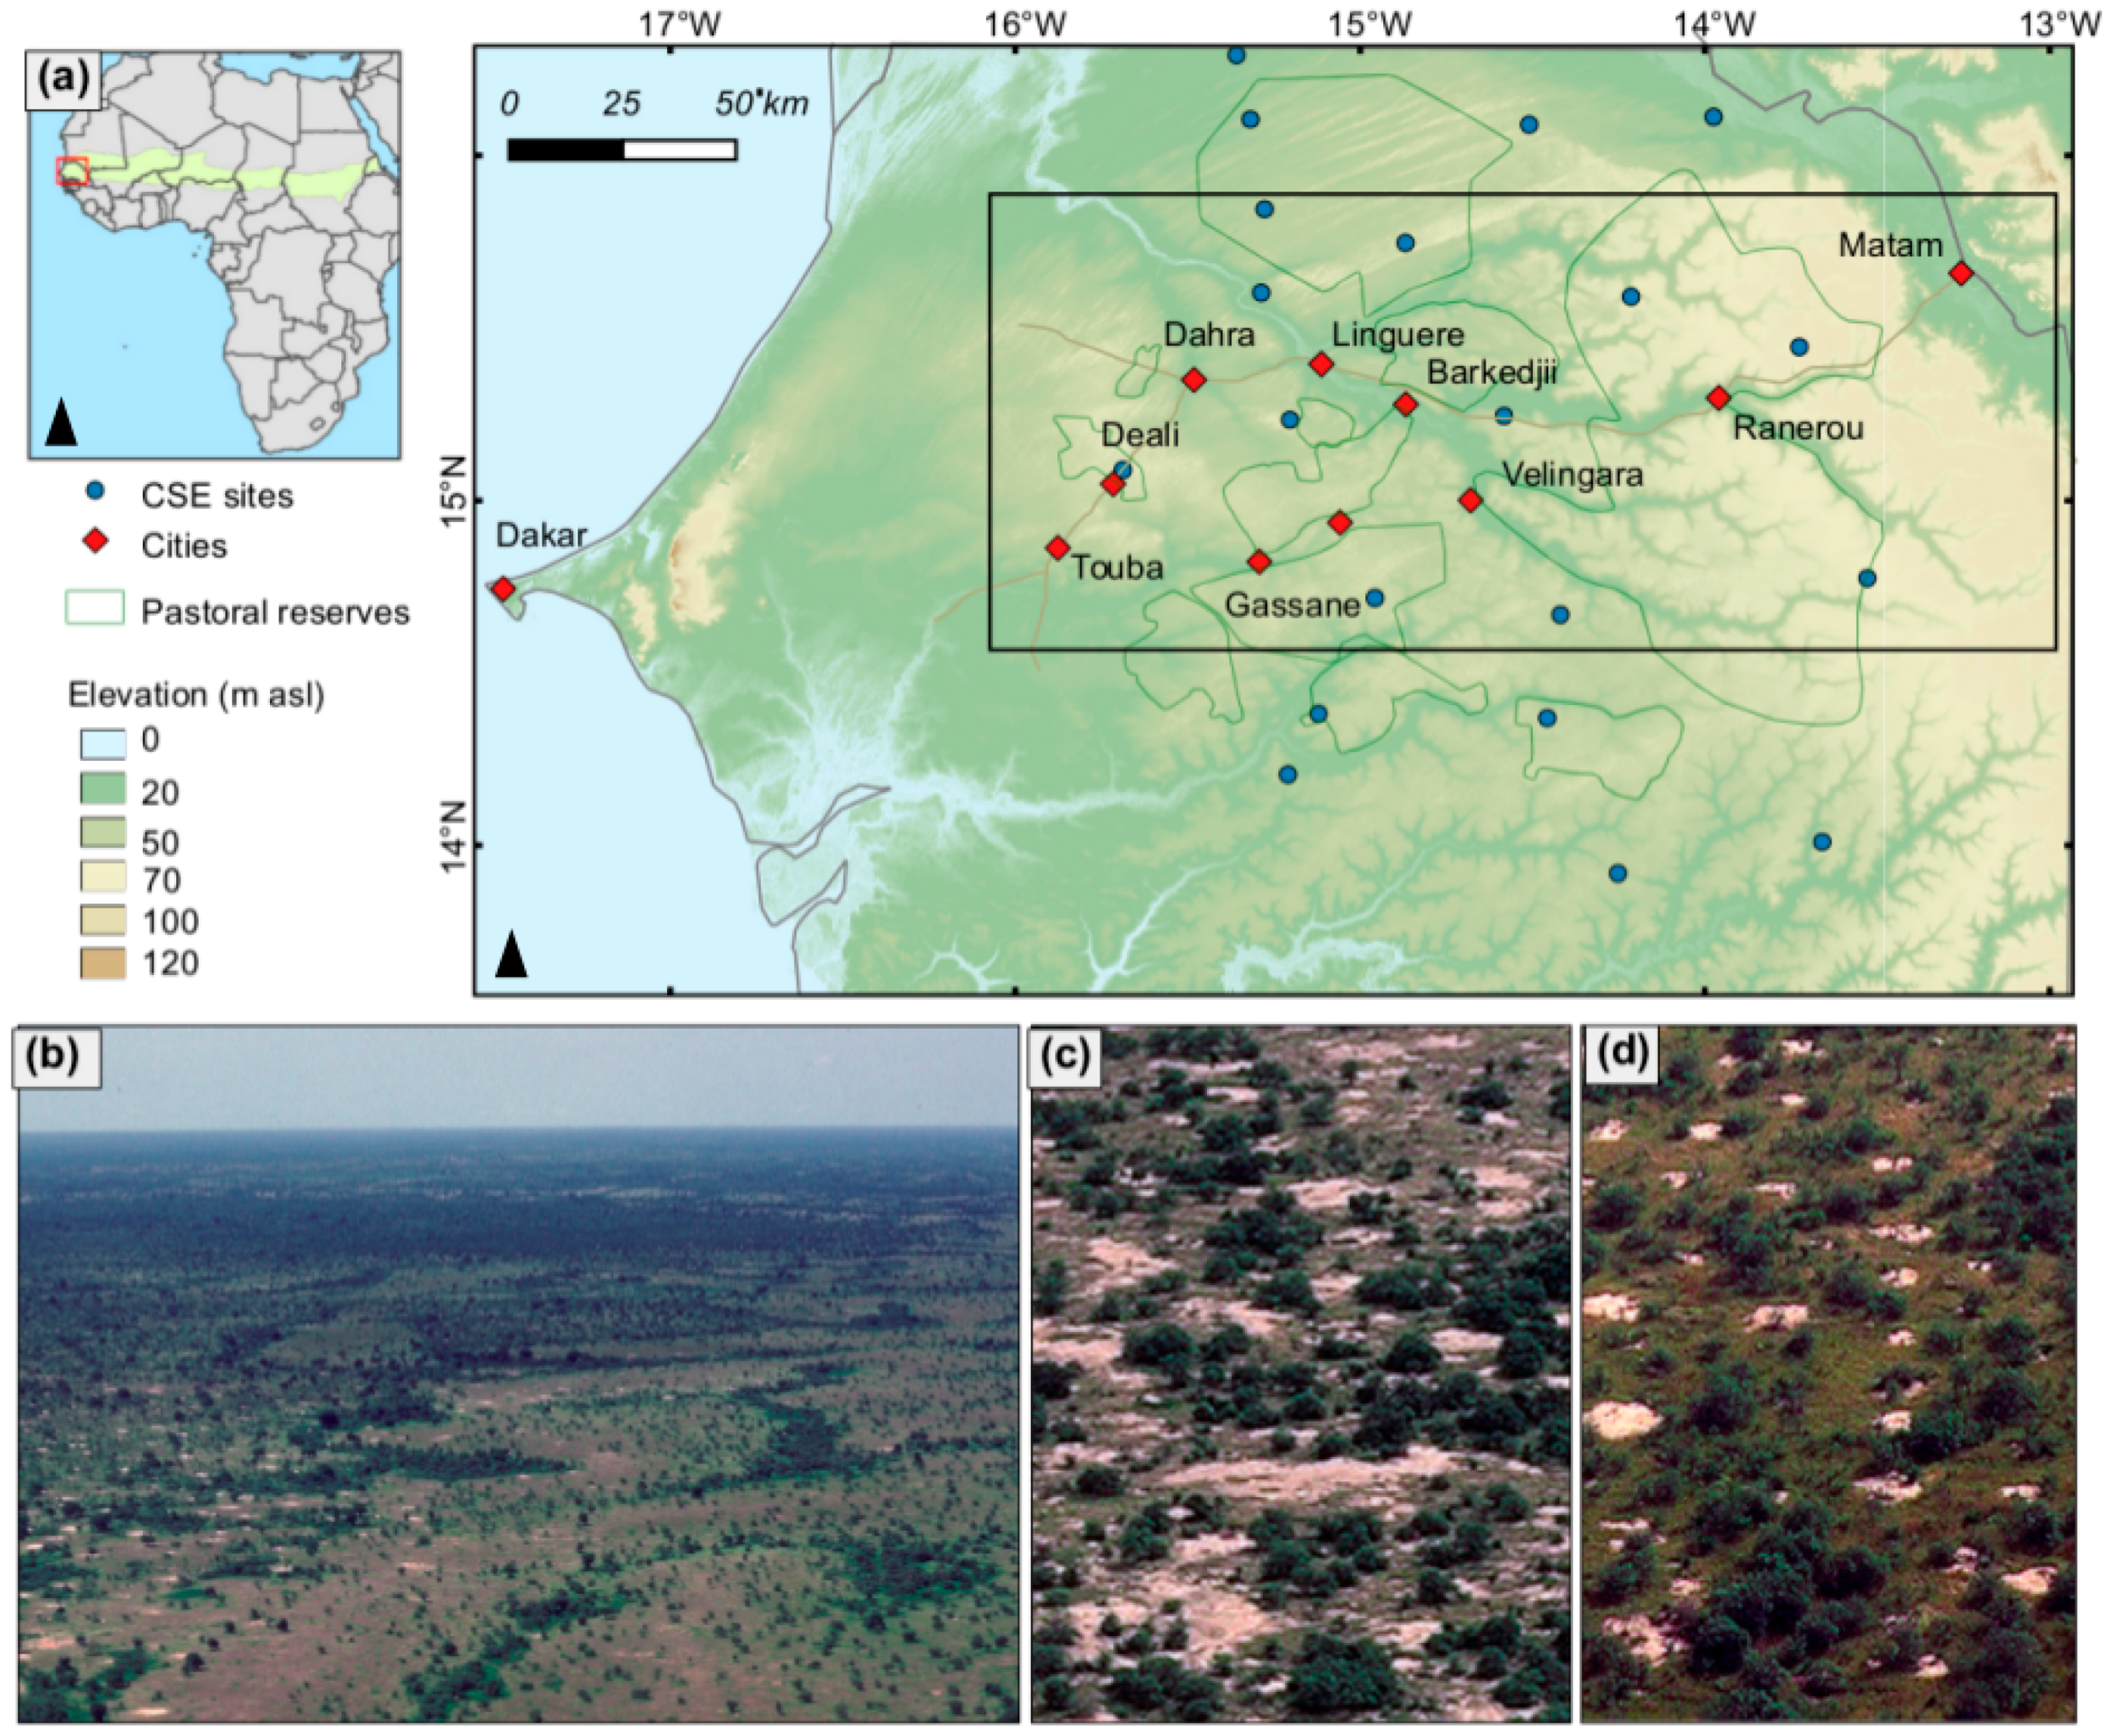
Figure 1. Location of the study area and aerial views (taken 1994 by G. Tappan). (a) The study area (rectangle in Senegal) and CSE (Centre de Suivi Ecologique) calibration sites, which are part of the woody cover model development [17] are shown. CSE sites located in the study area are also used for multi-temporal monitoring of woody cover. Pastoral reserves, major cities and villages as well as the topography (SRTMv4) within the study area are indicated; (b) An example of the diversity in the landscapes of the Sandy Pastoral Zone, ranging from open tree savanna to relatively dense savanna woodlands (at left). Dense ribbons of trees follow the drainage pattern that reflects ancient inter-dunal depressions; (c) A view of a relatively homogeneous shrub savanna (or bushland) typical of the Ferrugineous Pastoral Zone with its shallow soils. P. lucens is the dominant small tree; (d) Another example from the Ferrugienous Ferlo. The white patches are the bare soils associated with termite mounds. The location and more aerial views are found in Figure A1, Figure A2, Figure A3, Figure A4, Figure A5 and Figure A6.
Remotesensing 09 00039 g001
Figure 2. MODIS based woody cover changes (2000–2015) and location of the field sites. The area corresponds to the rectangle in Figure 1a. Insignificant (p > 0.05) trends are displayed in white, all colored trends are statistically significant (p < 0.05). CSE sites include species information and in situ woody cover for the period 1998–2015. Field sites 2015 provide information about species composition within greening areas in October 2015 and repeat photography portrays the vegetation in the years 1994 and 2015.
Remotesensing 09 00039 g002
Figure 3. (a) Annual woody cover development with a strong increase until 2013 and a significant drop in 2014/2015 (21 field sites 2015, see Figure 2); (b) Species composition for the same sites in 2015 from a total of 1563 individuals of trees and shrubs; (c) Estimated (MODIS based) and in situ measured woody cover at 5 CSE sites (location shown in Figure 2) as well as rainfall anomalies; (d) Woody species composition surveyed in 2015 at the 5 CSE sites; (e) In situ woody cover 1998–2015 for two individual sites showing that the increase between 2007 and 2013 and the drop in 2014 is only present at the G. senegalensis dominated site C2L6, whereas the B. aegyptiaca stand C1L5 shows a subtle increase, even after 2014 (species data from 2015). The site C1L5 is illustrated in Figure 5 and C2L6 in Figure 6.
Remotesensing 09 00039 g003
Figure 4. “Woody greening” part 1: (a) Reforestation areas are manifold in Senegal, here west of Dahra between 2004 and 2014. They re-establish (b) A. senegal, which is a robust species (c) and only very few died after the 2014 drought, whereas (d) P. lucens, G. senegalensis and C. glutinosum were more severely impacted. Field photos by M. Brandt October 2015.
Remotesensing 09 00039 g004
Figure 5. “Woody greening” part 2: (a) The pastoral reserve at Deali (close to C1L5) shows a strong increase in tree density (red objects are single trees) and canopy size between 2004 and 2014. The spreading species is (b) B. aegyptiaca. Areas further south are more dominated by (c) C. glutinosum, which regenerates well after cutting and browsing. Field photos by M. Brandt, October 2015.
Remotesensing 09 00039 g005
Figure 6. “Woody greening” part 3: (a) Field site C2L6 shows a strong increase in G. senegalensis between 2008 and 2012. Field photos (M. Brandt October 2015) at Ranerou show (b) P. lucens and (c) G. senegalensis. (d) Even though stems of P. lucens may die due to drought or fires, the trees are able to regrow.
Remotesensing 09 00039 g006
Figure 7. Repeat photography of field sites 1994 (left, G. Tappan) and 2015 (right, M. Brandt) show (a) mostly stable woody cover conditions; (b) A slight increase of G. senegalensis is seen; and (c), a decrease of C. glutinosum due to road construction is observed on these photo pairs. Note that the photos are not taken at the same time of the year causing differences in the greenness of the vegetation.
Remotesensing 09 00039 g007
Figure 8. (a) Negative woody cover anomalies in 2014/2015. Burned areas 2013–2015 (detected by MODIS MCD45) are masked out in black. The anomalies are mainly concentrated in areas dominated by G. senegalensis in the east, whereas B. aegyptiaca dominated areas in the west are stable. Moreover, the morphology plays a decisive role and valley systems can mitigate the effects of low rainfall, as seen by the valley from Linguère to Ranerou or Barkedji, and farther south. Note that an NDVI anomaly does not necessarily imply the death of woody plants (b) Dense woody plants in inter-dune depressions close to Gassane in December 2010. The same stand shows only few living plants in February 2015 and a mass dying of shrubs. Photo (c) was taken within the same frame whereas (d) were taken on shallow soils close to Velingara. Photo (e) shows regeneration in the foreground with dead woody plants in the background. Field photos by M. Brandt October 2015.
Remotesensing 09 00039 g008
Figure 9. Relation between in situ woody cover at the CSE sites and rainfall comparing (a) mean woody cover and mean annual rainfall; (b) woody cover trends (2000-2015) and mean annual rainfall; (c) woody cover trends (2000–2015) and rainfall trends (2000-2015); (d) annual woody cover observations and rainfall with a 1 year lag and (e) annual woody cover and 6 year integrated rainfall.
Remotesensing 09 00039 g009
Figure 10. Links between long term (climate, soil and human management) and short term (climate events, human activities) drivers of dynamics in woody cover and species composition. Concept derived from Breman and Kessler [6].
Remotesensing 09 00039 g010
Table 1. Dominant woody species in the study area. Information taken from [6] and own data (Figure 3). Height: - small shrub, + tree. Sites: Sandy (S) and Ferrugineous (F) Ferlo. Palatability of foliage: + high, - low. Resprouting: +++ very high, - low regeneration. Deep roots: - shallow, 0 deep roots and many superficial branch roots. A graphical illustration of the species distribution in the study area according to their habitat conditions can be found in Figure A7.
SpeciesHeightPhenologyCharacteristicsResproutingSitesPalatabilityDeep Roots
Acacia raddiana+Semi-deciduousDrought resistant0S+0
Commiphora africana0DeciduousFire and termite resistant-S+-
Balanites aegyptiaca0EvergreenDrought resistant+S, F+0
Boscia senegalensis-EvergreenPioneer0F+-
Guiera senegalensis-Semi-deciduousPioneer+++F, S00
Grewia biclor0DeciduousDrought resistant+S, F+-
Combretum glutinosum0EvergreenDrought and fire resistant++S, F00
Combretum micranthum-DeciduousDrought and fire resistant0F00
Pterocarpus lucens0DeciduousFire resistant0F+0
Table 2. Spearman correlation coefficient (rho) between annual in situ woody cover at the CSE sites (2000–2015) and rainfall with different lag and integration periods (1993–2015).
SoilsNo Lag1 Year Lag2 Year Lag3 Year Lag2 Year Sum3 Year Sum4 Year Sum5 Year Sum6 Year Sum7 Year Sum
All0.510.580.610.540.580.630.690.710.730.72
Sandy0.610.620.70.60.670.70.790.790.820.84
Shallow−0.43−0.11−0.080.03−0.33−0.29−0.35−0.28−0.18−0.18