
The Spatiotemporal Pattern of Urban Expansion in China: A Comparison Study of Three Urban Megaregions


Abstract
:
1. Introduction
2. Materials and Methods
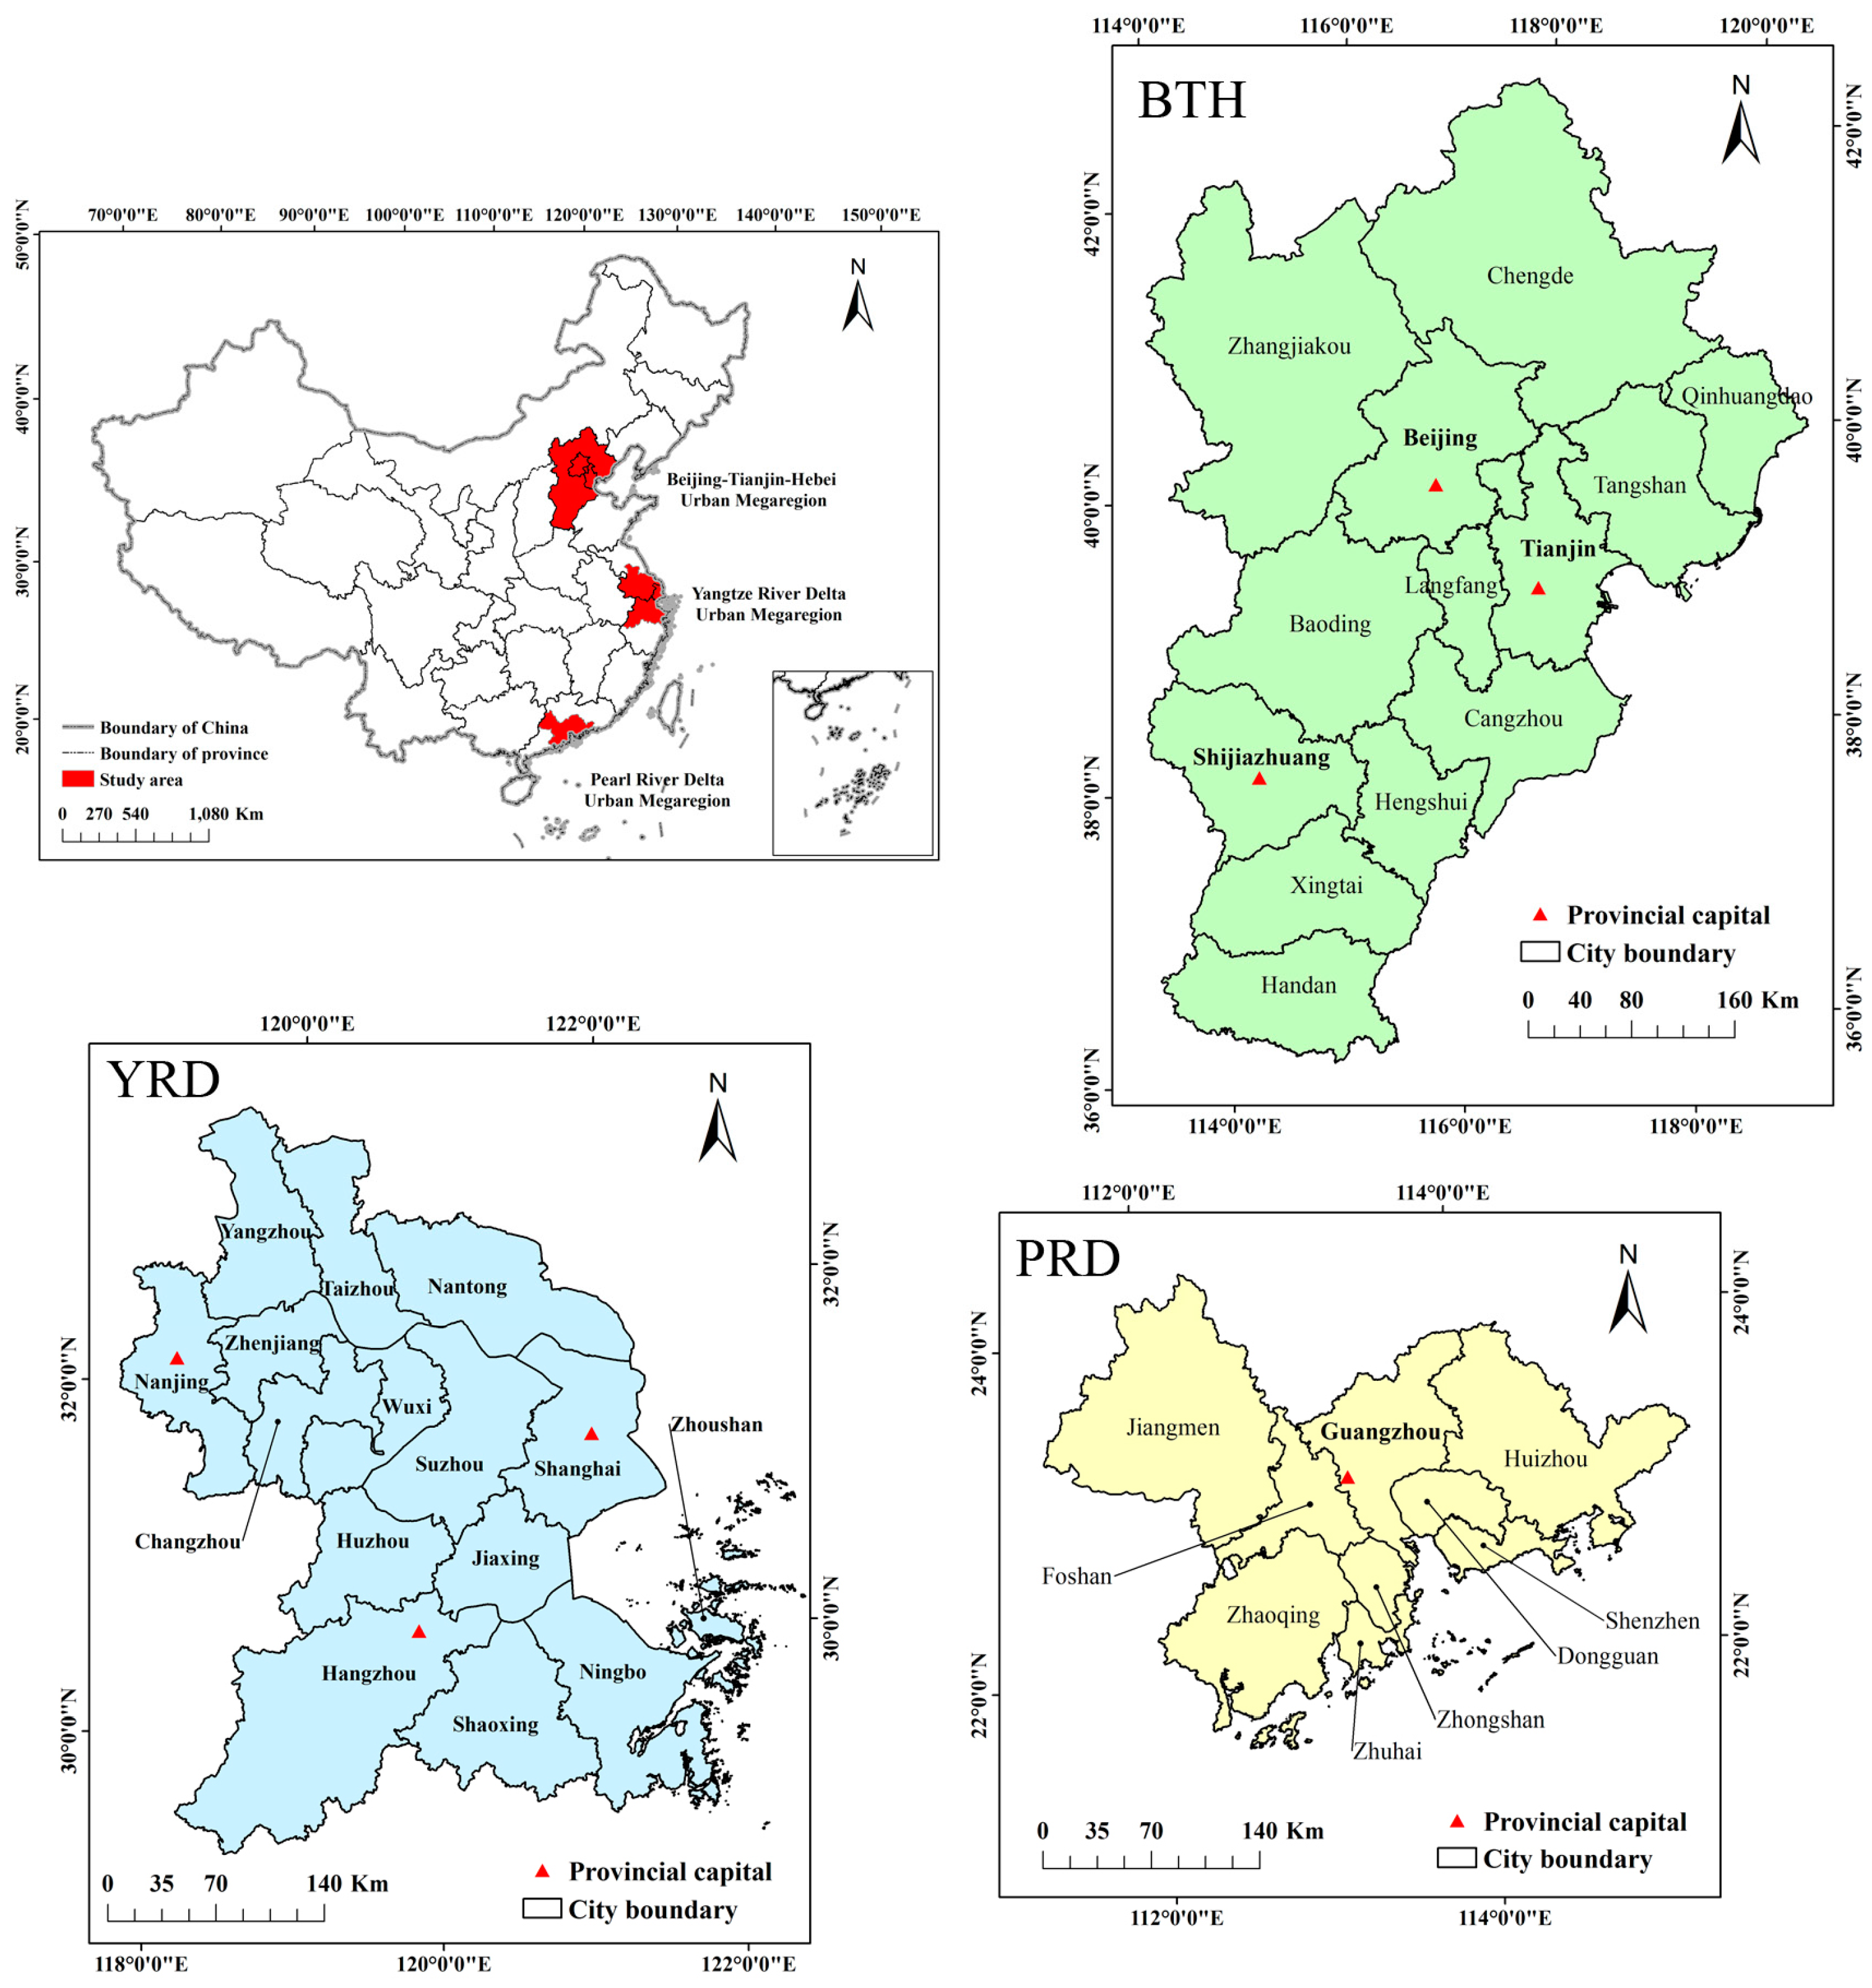
2.1. Study Area
2.2. Data
2.3. Typological Quantification for Urban Expansion
2.4. Statistical Analyses
3. Results
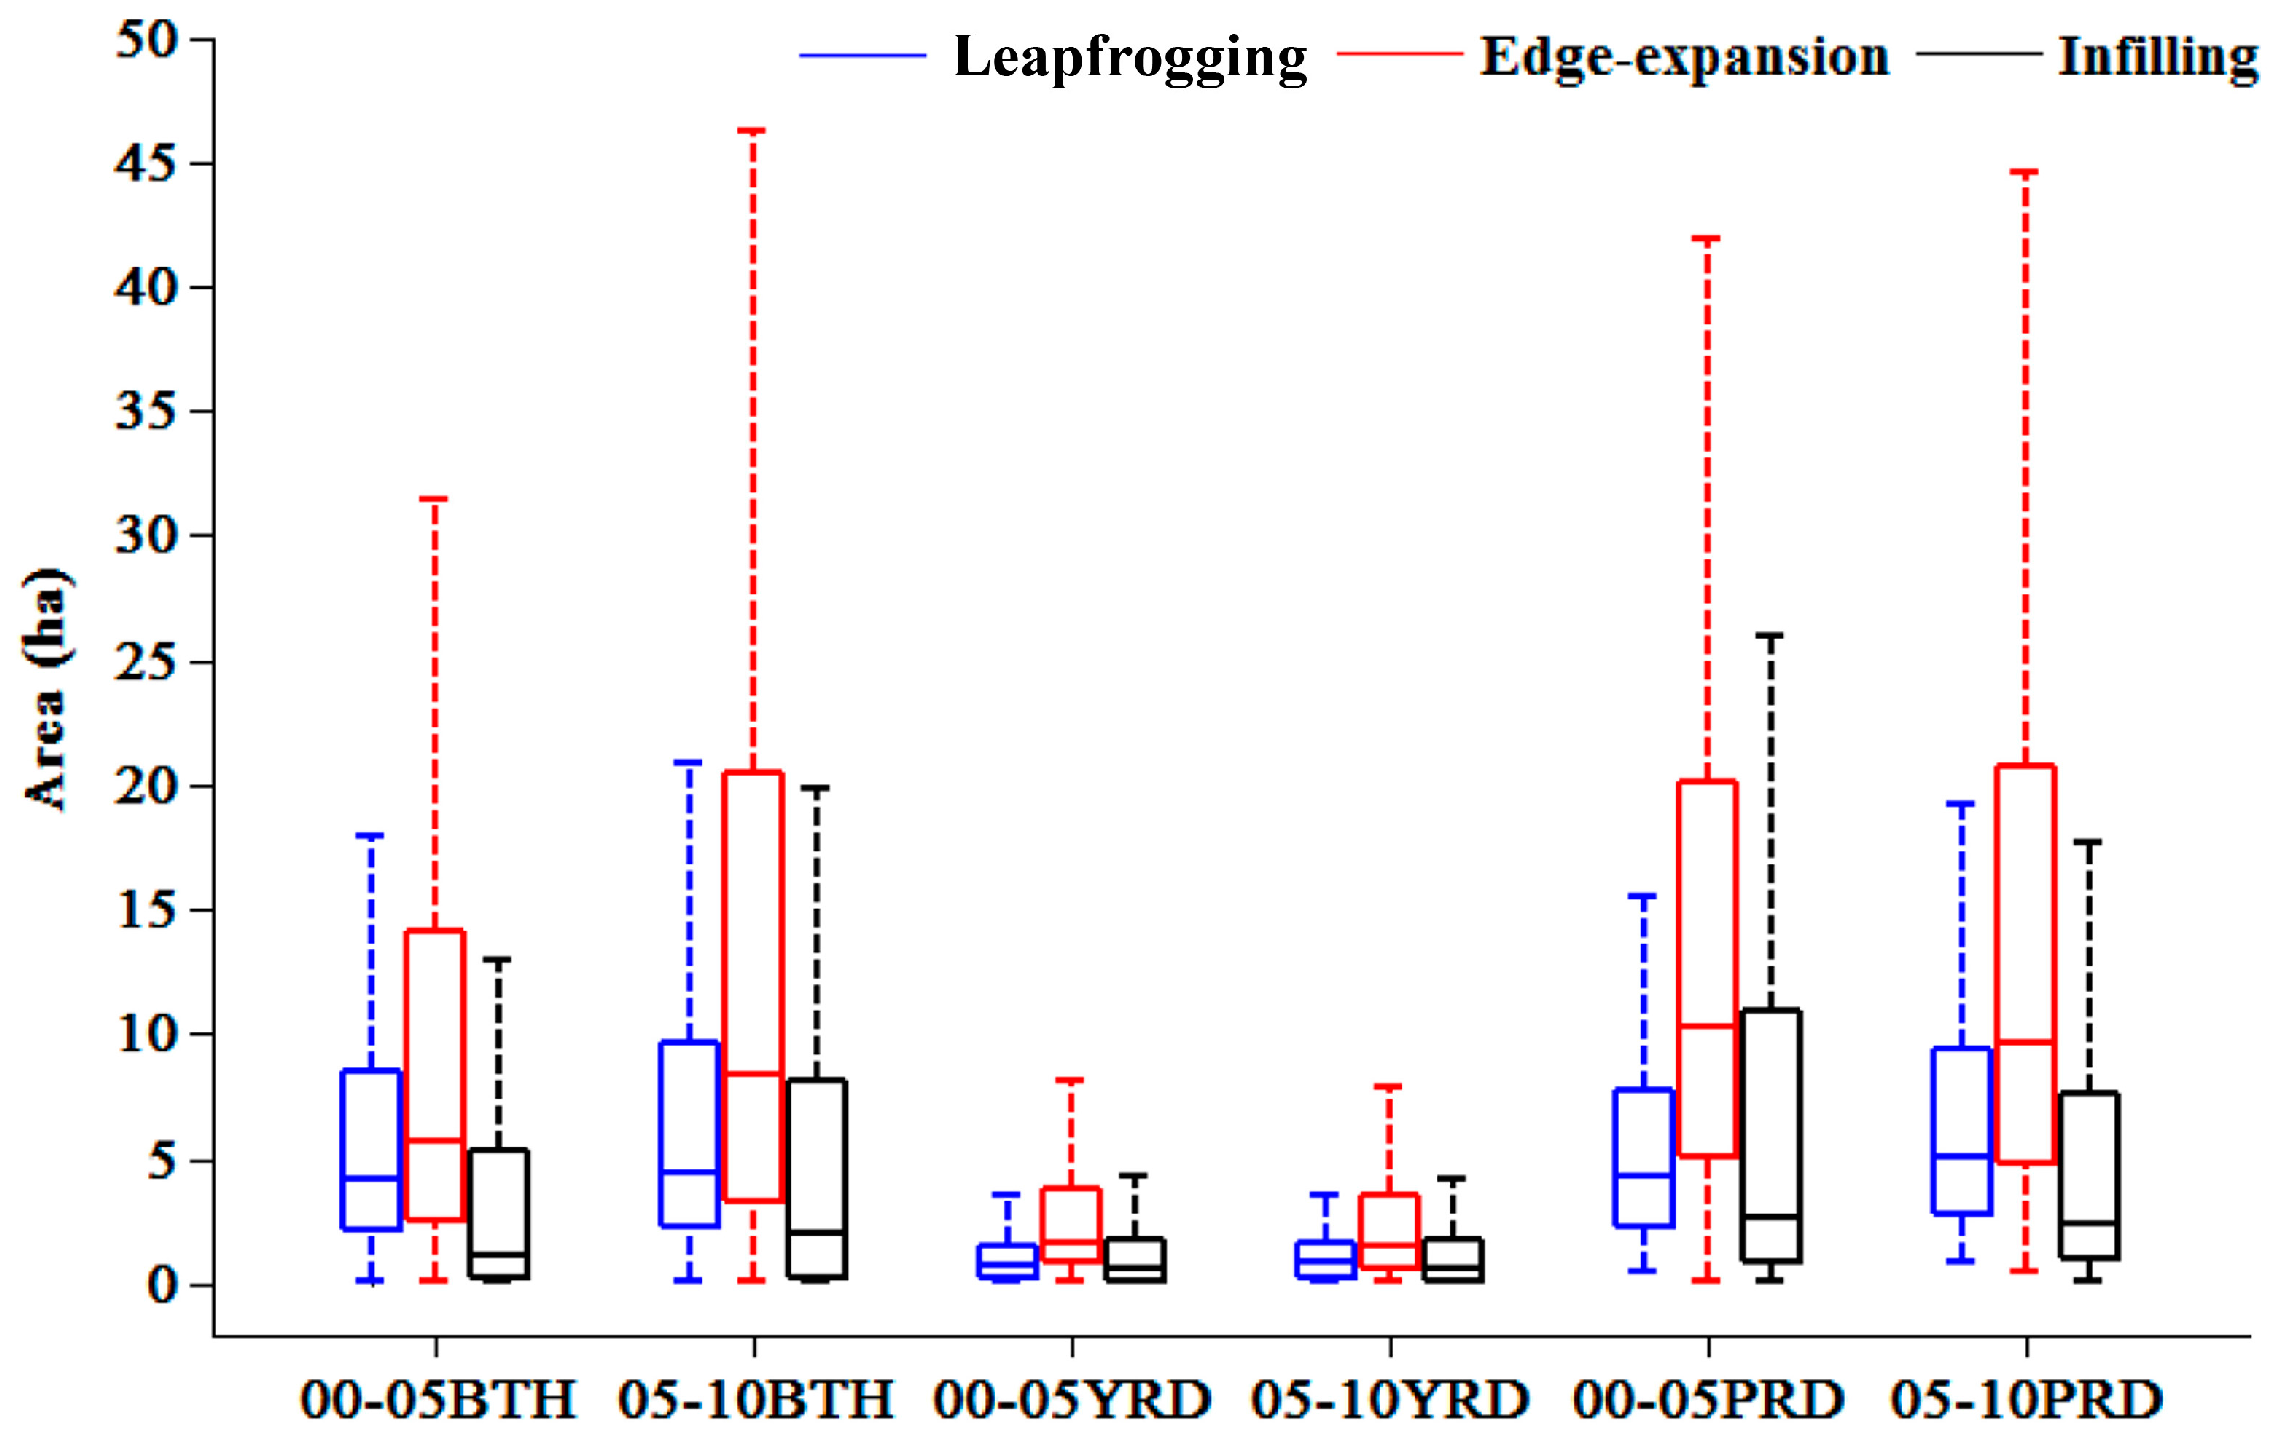
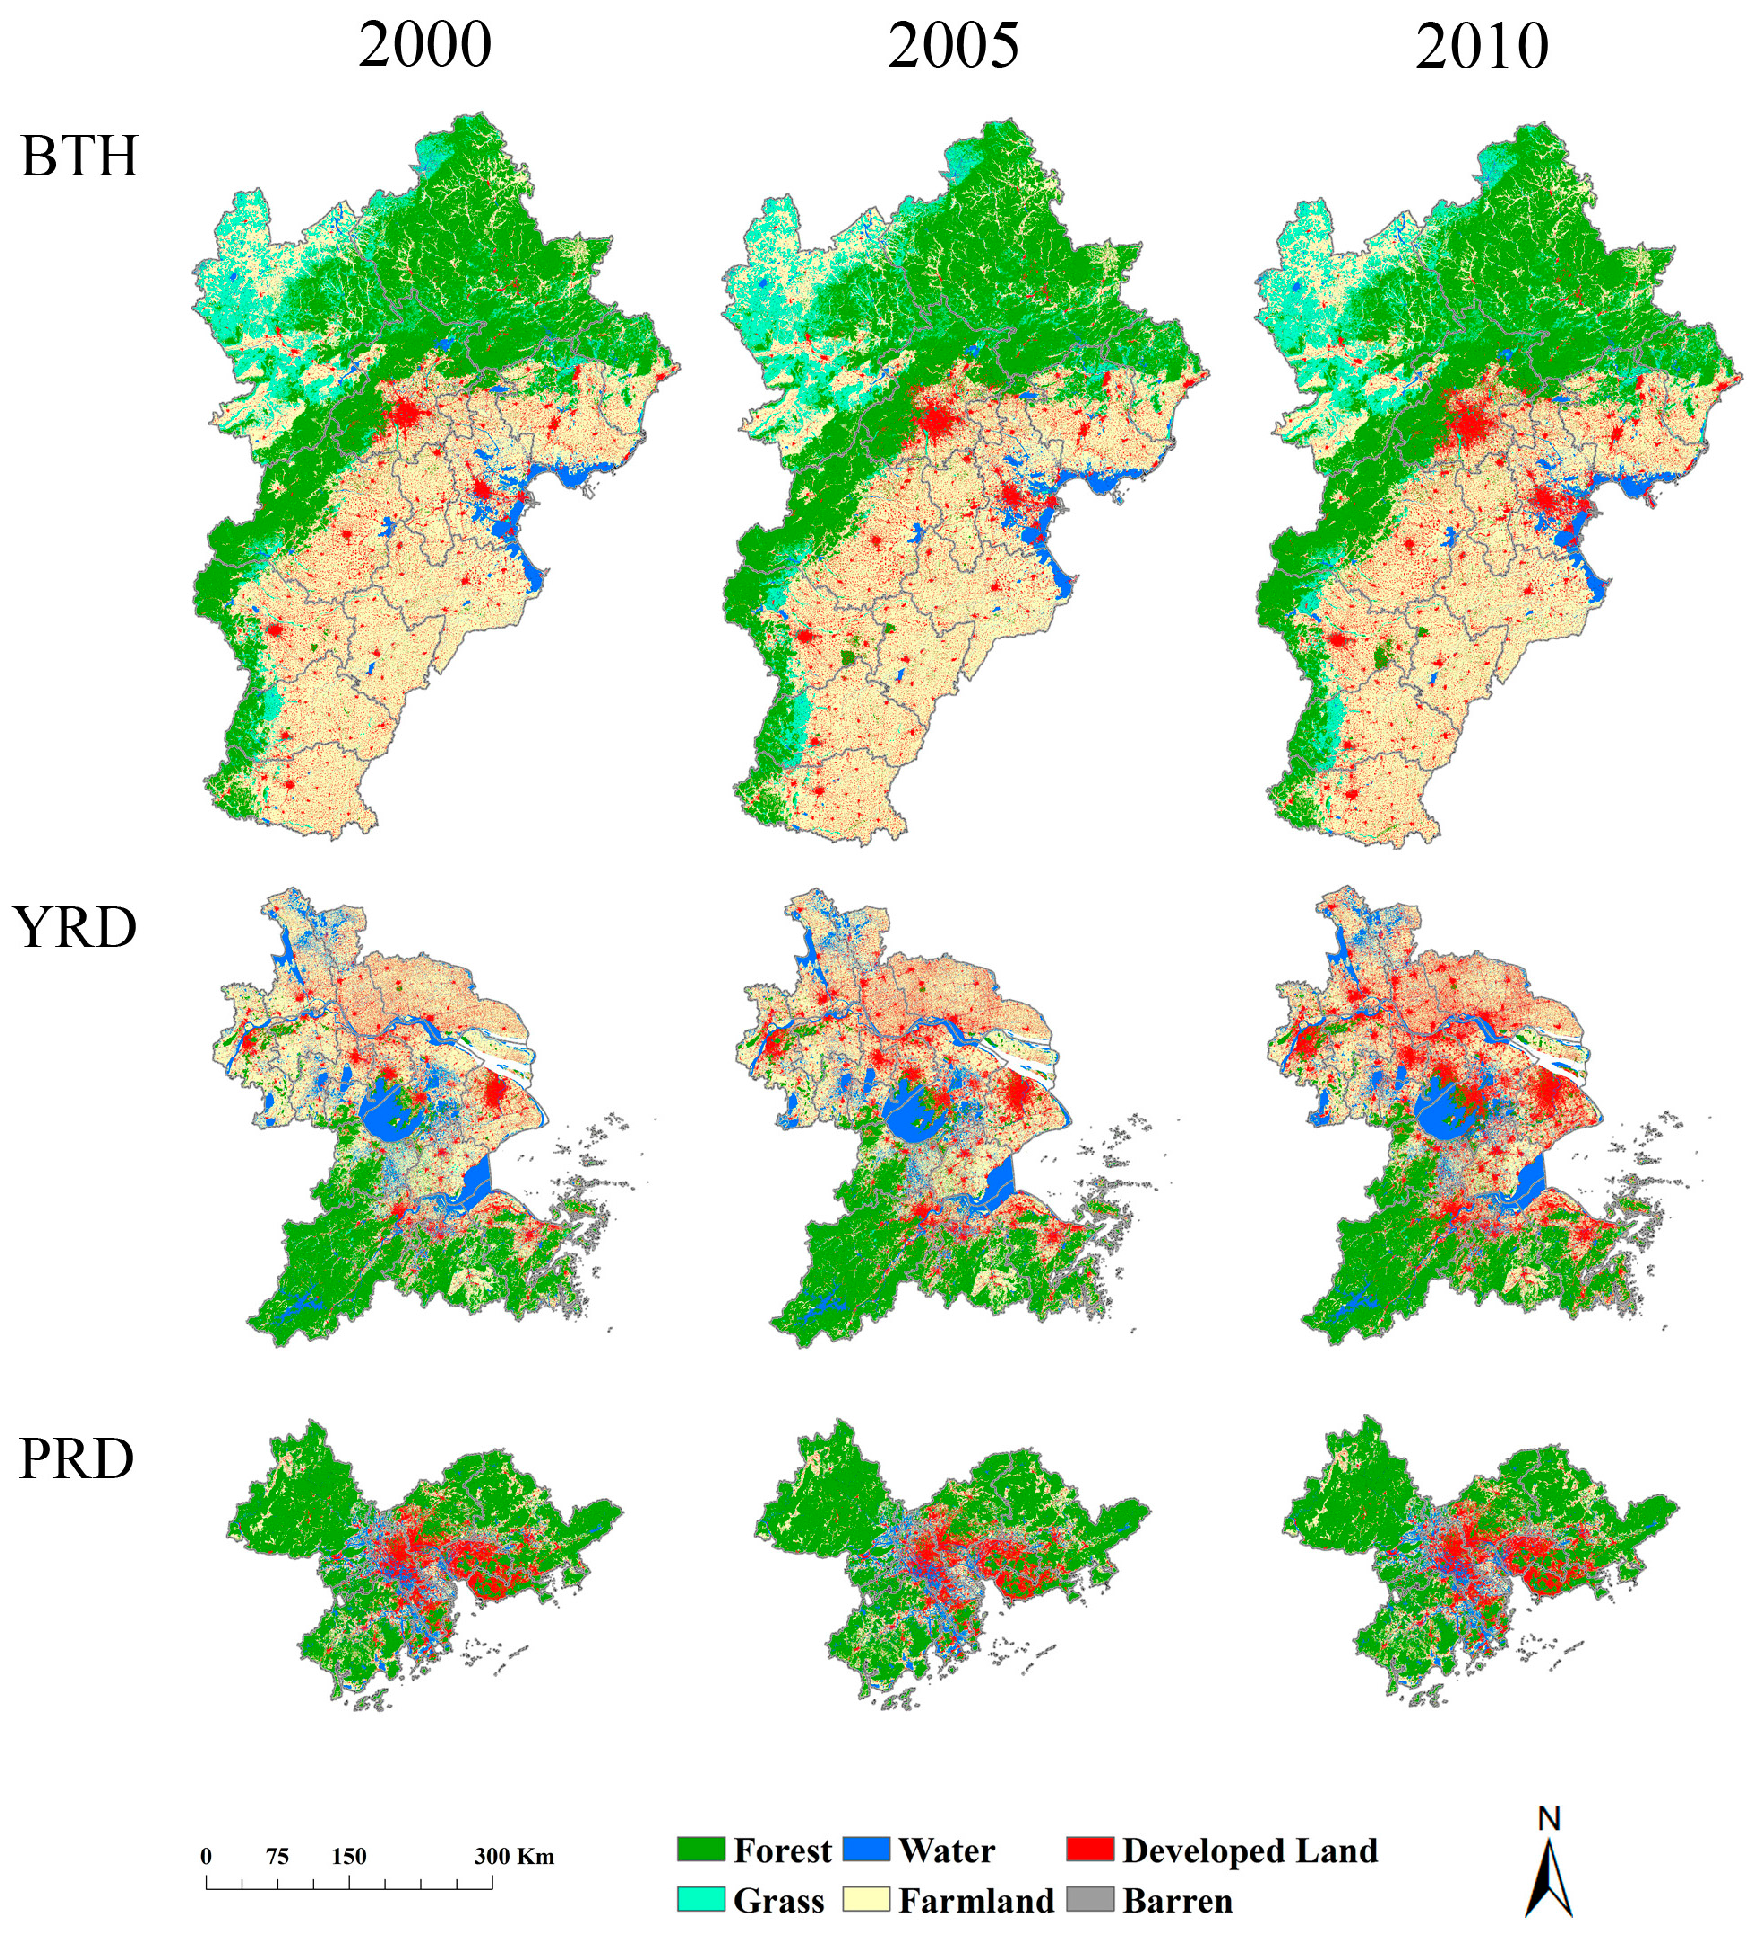
3.1. Spatiotemporal Pattern of Urban Expansion at the Urban Megaregion Scale
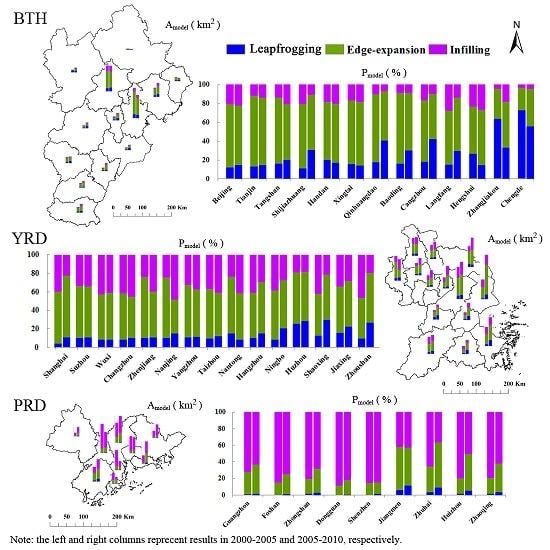
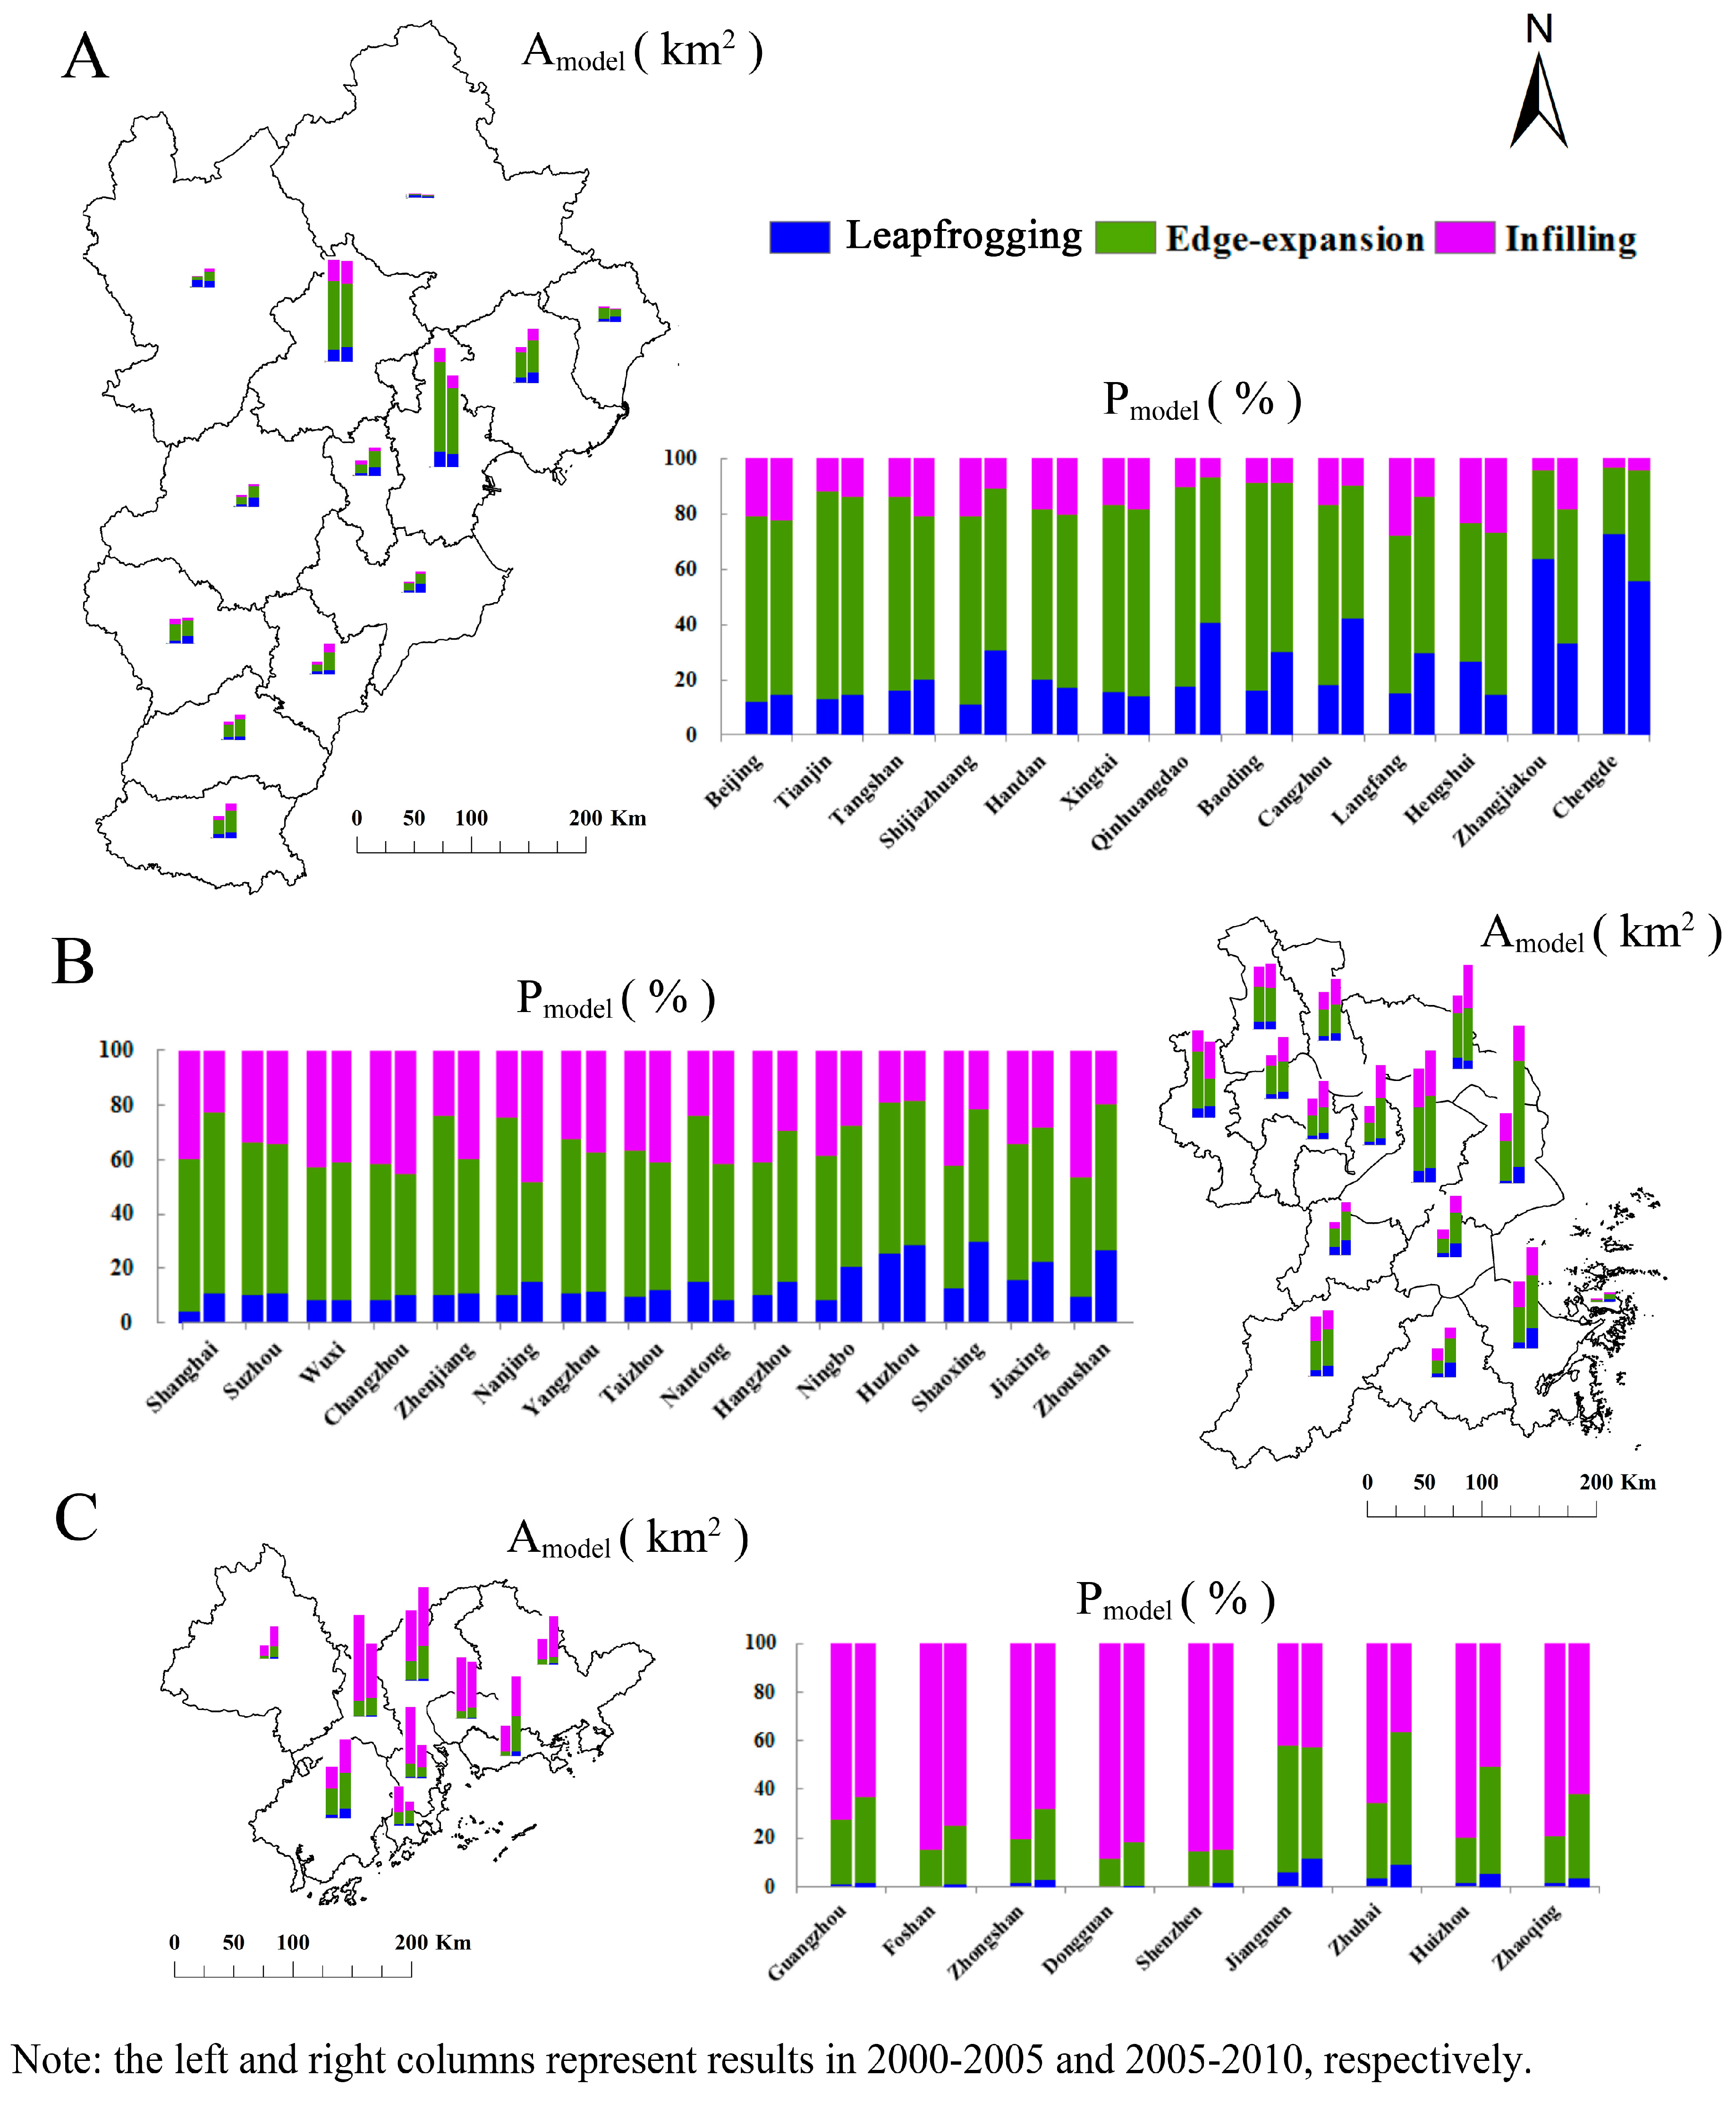
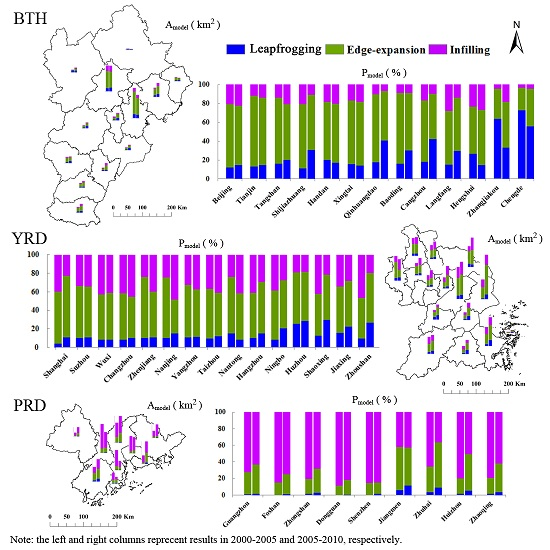
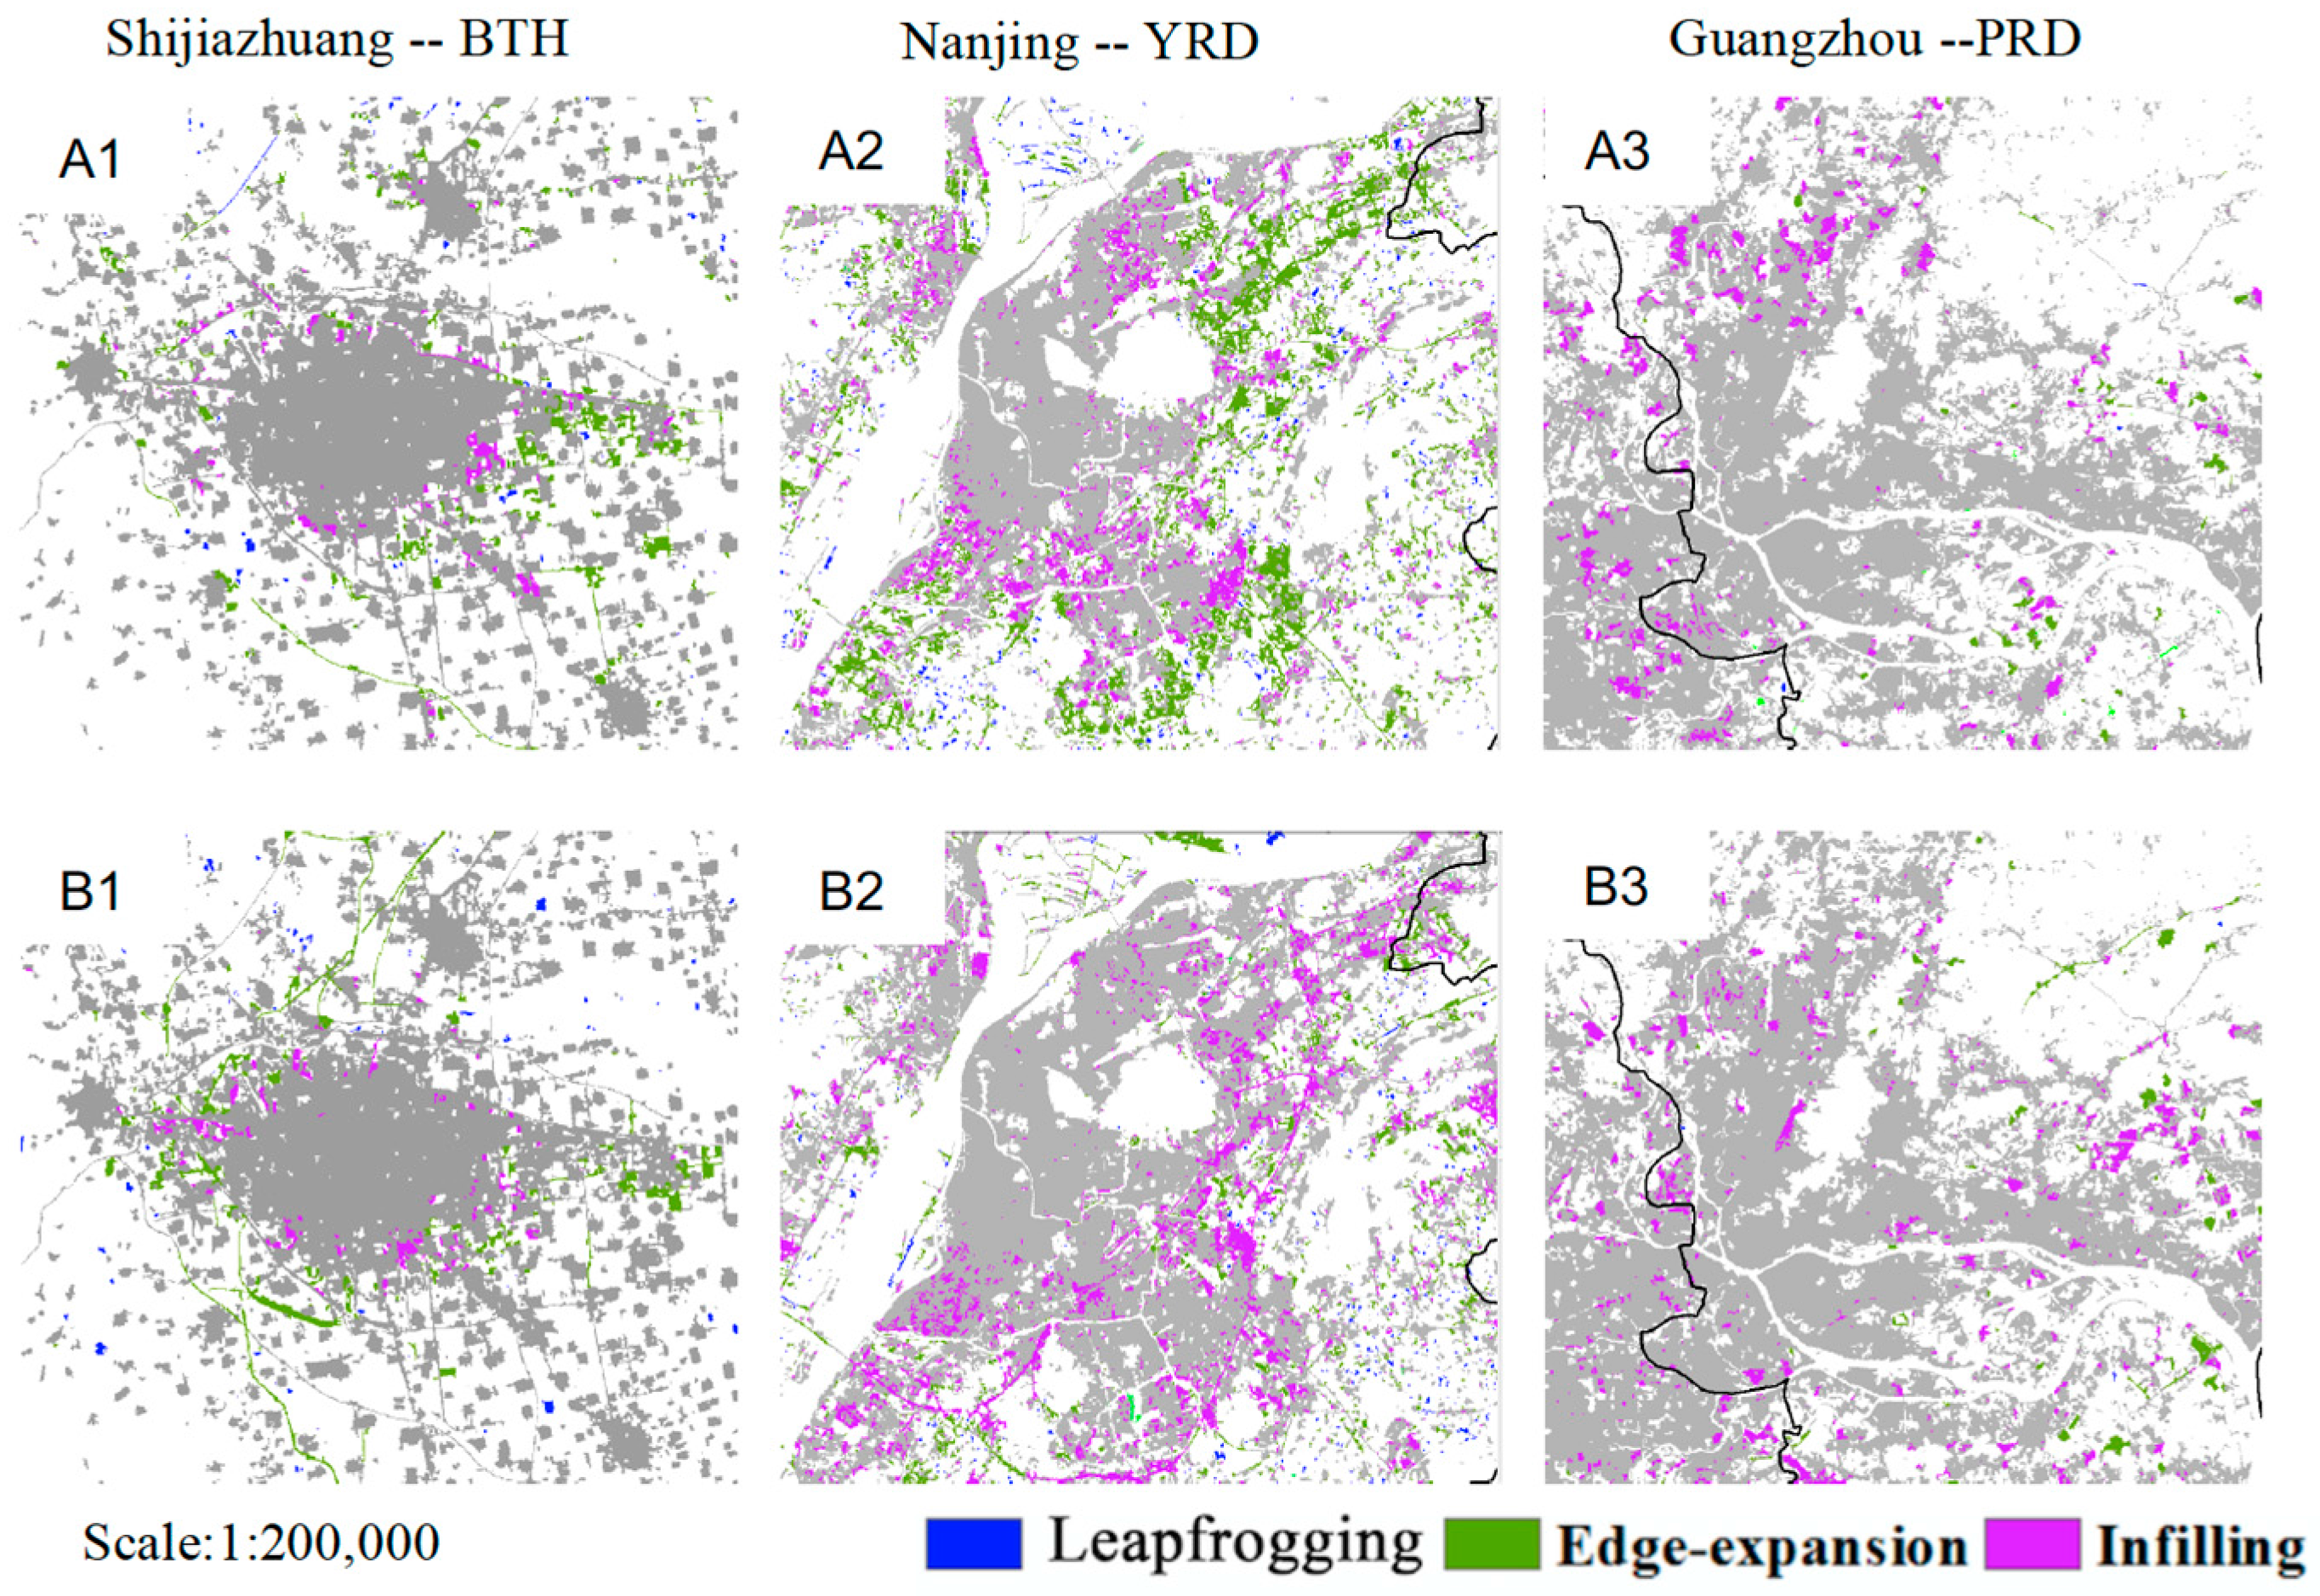
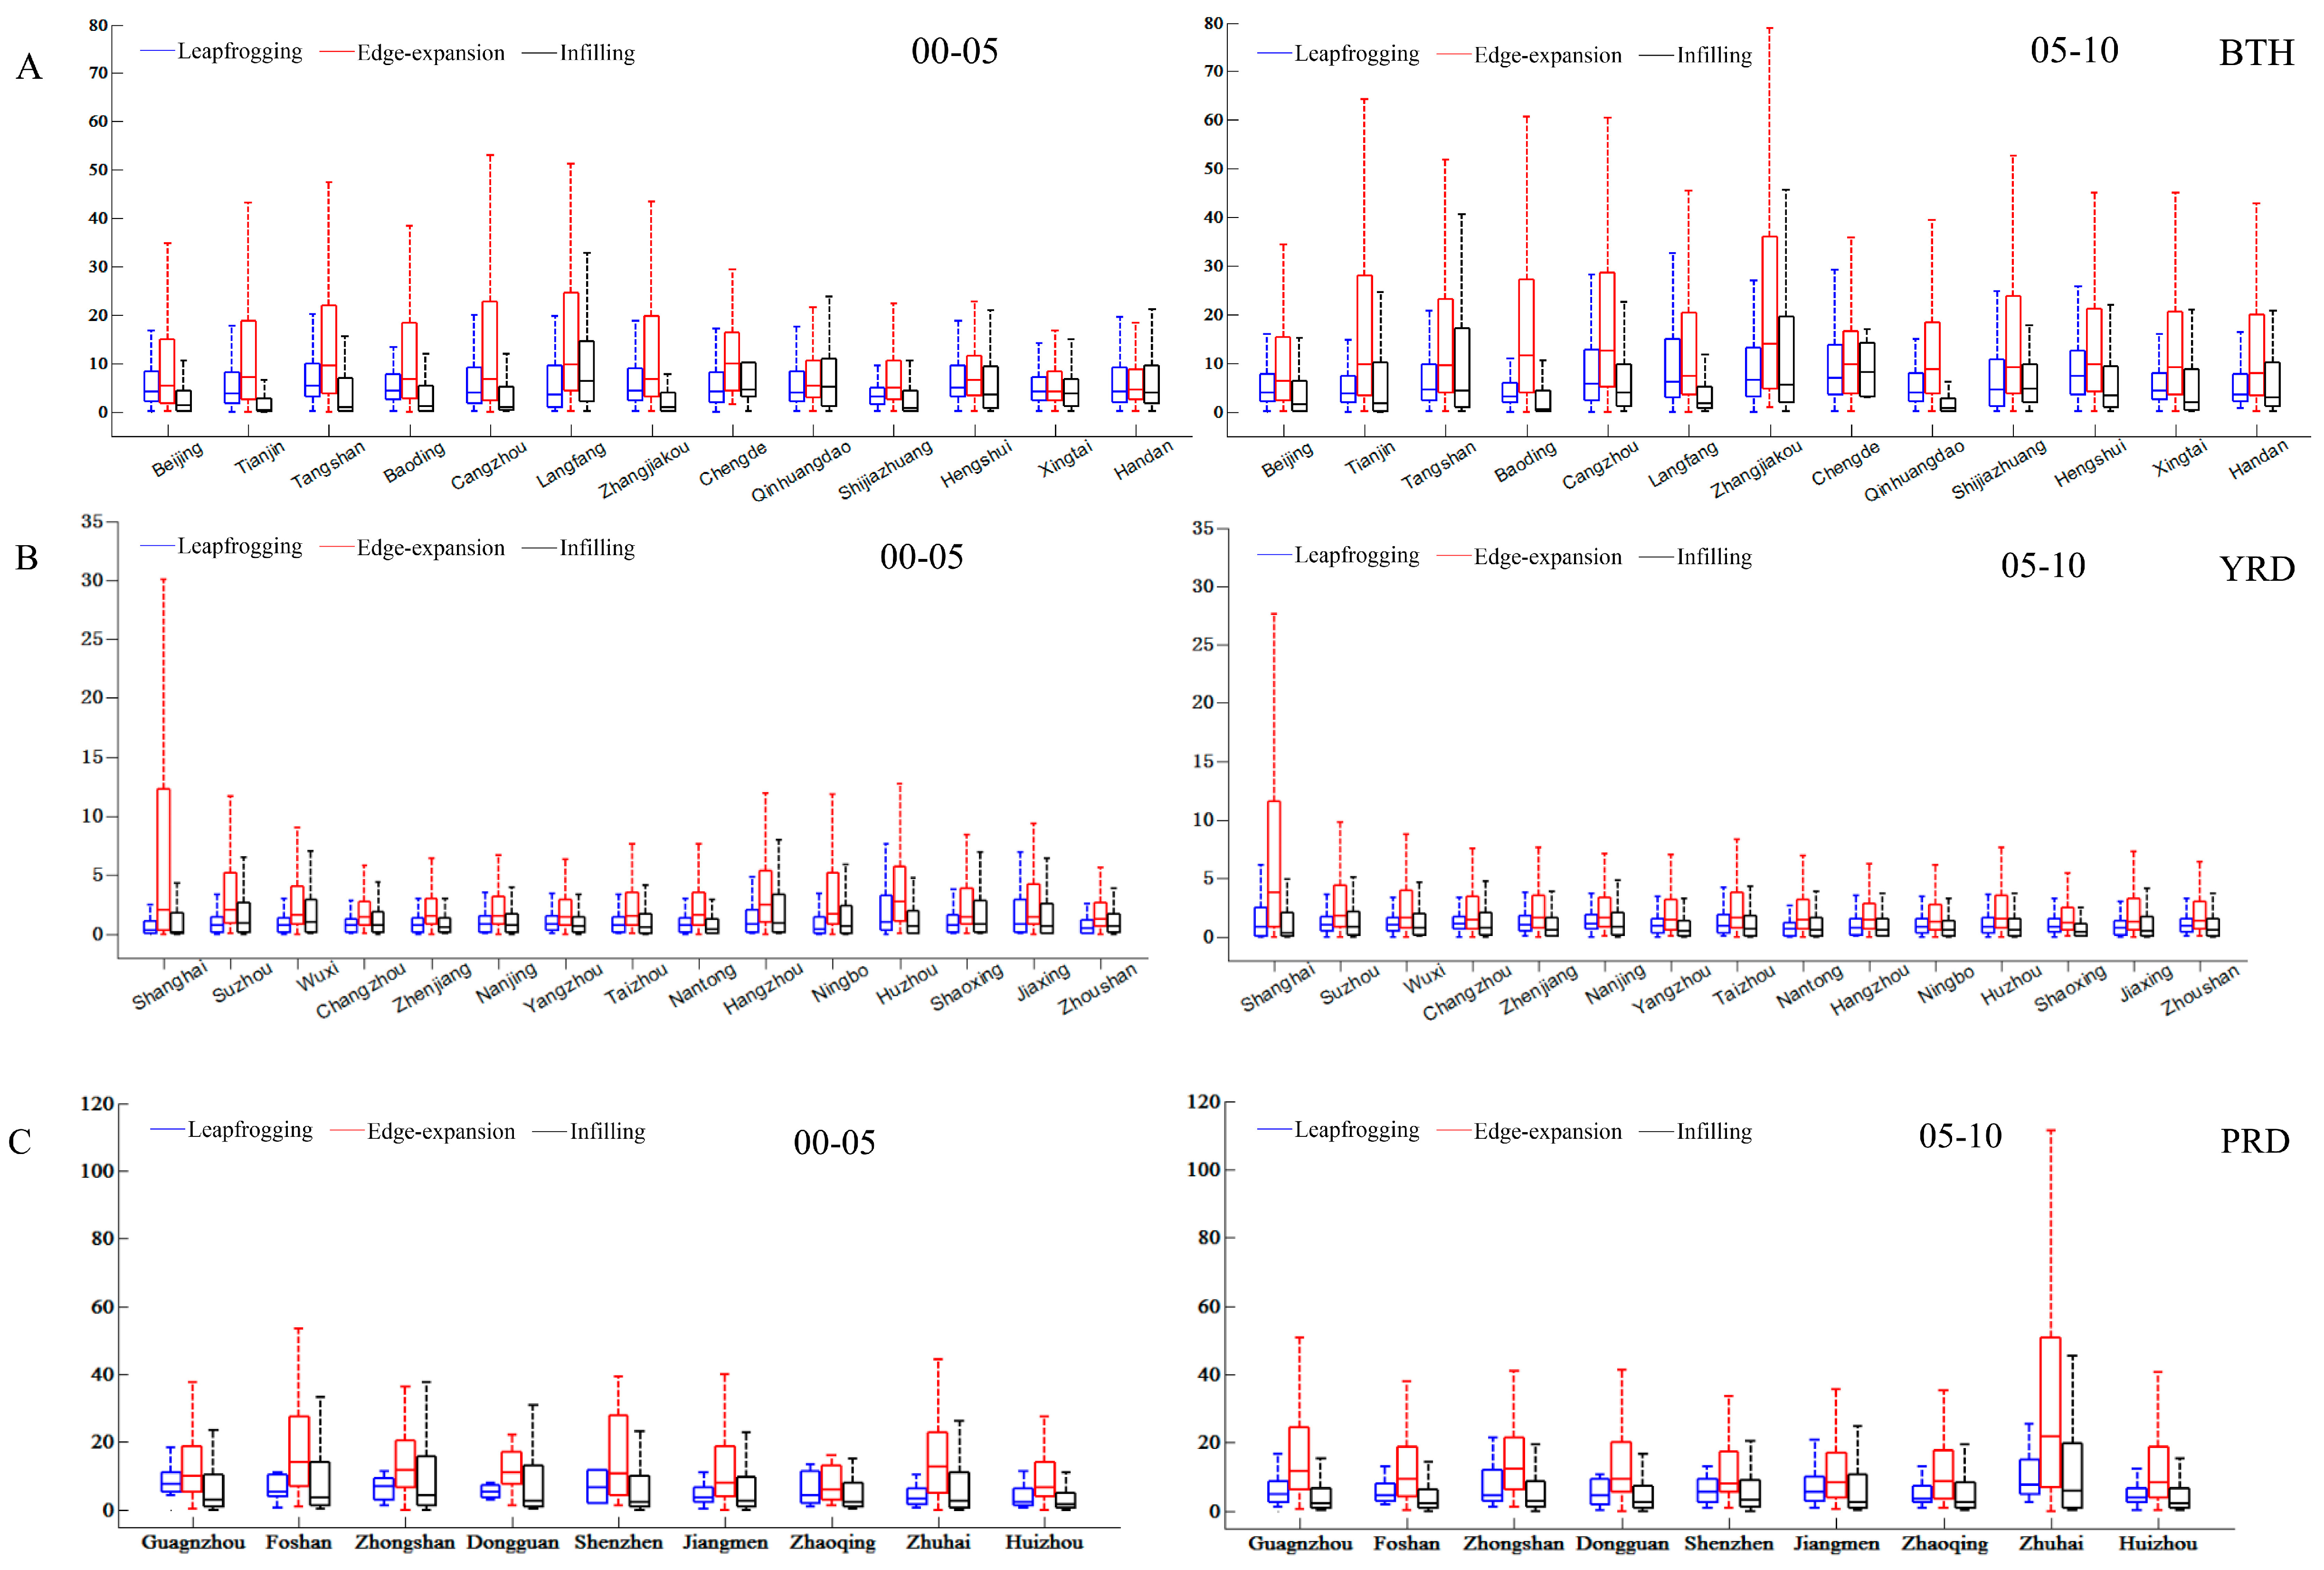
3.2. Spatiotemporal Pattern of Urban Expansion at the City Scale
3.3. The Effects of City’s Characteristics on Urban Expansion Models
4. Discussion
5. Conclusions
Acknowledgments
Author Contributions
Conflicts of Interest
References
- Grimm, N.B.; Faeth, S.H.; Golubiewski, N.E.; Redman, C.L.; Wu, J.G.; Bai, X.M.; Briggs, J.M. Global change and the ecology of cities. Science 2008, 319, 756–760. [Google Scholar] [CrossRef] [PubMed]
- Wu, J.G. Urban sustainability: An inevitable goal of landscape research. Landsc. Ecol. 2010, 25, 1–4. [Google Scholar] [CrossRef]
- Pickett, S.T.A.; Cadenasso, M.L.; Grove, J.M.; Boone, C.G.; Groffman, P.M.; Irwin, E.; Kaushal, S.S.; Marshall, V.; McGrath, B.P.; Nilon, C.H.; et al. Urban ecological systems: Scientific foundations and a decade of progress. J. Environ. Manag. 2011, 92, 331–362. [Google Scholar] [CrossRef] [PubMed]
- Forman, R.T.T.; Wu, J. Where to put the next billion people. Nature 2016, 537, 608–611. [Google Scholar] [CrossRef] [PubMed]
- Zhou, W.Q.; Qian, Y.G.; Li, X.M.; Li, W.F.; Han, L.J. Relationships between land cover and surface urban heat island: Seasonal variability and effects of spatial and thematic resolution of land cover data on predicting land surface temperature. Landsc. Ecol. 2014, 29, 153–167. [Google Scholar] [CrossRef]
- Grimm, N.B.; Foster, D.; Groffman, P.; Grove, J.M.; Hopkinson, C.S.; Nadelhoffer, K.J.; Pataki, D.E.; Peters, D.P.C. The changing landscape: Ecosystem responses to urbanization and pollution across climatic and societal gradients. Front. Ecol. Environ. 2008, 6, 264–272. [Google Scholar] [CrossRef]
- Han, L.J.; Zhou, W.Q.; Li, W.F. Increasing impact of urban fine particles (pm2.5) on areas surrounding Chinese cities. Sci. Rep. 2015. [Google Scholar] [CrossRef] [PubMed]
- Turner, M.G.; Gardner, R.H.; O’Neill, R.V. Landscape Ecology in Theory and Practice: Pattern and Process; Springer: New York, NY, USA, 2001. [Google Scholar]
- Wu, J.G.; Hobbs, R. Key issues and research priorities in landscape ecology: An idiosyncratic synthesis. Landsc. Ecol. 2002, 17, 355–365. [Google Scholar] [CrossRef]
- Zhou, W.Q.; Pickett, S.T.A.; Cadenasso, M.L. Shifting concepts of urban spatial heterogeneity and their implications for sustainability. Landsc. Ecol. 2016. [Google Scholar] [CrossRef]
- Kuang, W.H.; Chi, W.F.; Lu, D.S.; Dou, Y.Y. A comparative analysis of megacity expansions in china and the U.S.: Patterns, rates and driving forces. Landsc. Urban Plan. 2014, 132, 121–135. [Google Scholar] [CrossRef]
- Zhao, S.; Zhou, D.; Zhu, C.; Qu, W.; Zhao, J.; Sun, Y.; Huang, D.; Wu, W.; Liu, S. Rates and patterns of urban expansion in china’s 32 major cities over the past three decades. Landsc. Ecol. 2015, 30, 1541–1559. [Google Scholar] [CrossRef]
- Weng, Y.C. Spatiotemporal changes of landscape pattern in response to urbanization. Landsc. Urban Plan. 2007, 81, 341–353. [Google Scholar] [CrossRef]
- Luck, M.; Wu, J.G. A gradient analysis of urban landscape pattern: A case study from the phoenix metropolitan region, Arizona, USA. Landsc. Ecol. 2002, 17, 327–339. [Google Scholar] [CrossRef]
- Schneider, A.; Woodcock, C.E. Compact, dispersed, fragmented, extensive? A comparison of urban growth in twenty-five global cities using remotely sensed data, pattern metrics and census information. Urban Stud. 2008, 45, 659–692. [Google Scholar] [CrossRef]
- Forman, R.T.T. Land Mosaics: The Ecology of Landscape and Region; Cambridge University Press: Cambridge, UK, 1995. [Google Scholar]
- Dietzel, C.; Herold, M.; Hemphill, J.J.; Clarke, K.C. Spatio-temporal dynamics in California’s central valley: Empirical links to urban theory. Int. J. Geogr. Inf. Sci. 2005, 19, 175–195. [Google Scholar] [CrossRef]
- Forman, R.T.T. Urban Ecology: Science of Cities; Cambridge University Press: Cambridge, NY, USA, 2014. [Google Scholar]
- Xu, C.; Liu, M.S.; Zhang, C.; An, S.Q.; Yu, W.; Chen, J.M. The spatiotemporal dynamics of rapid urban growth in the Nanjing metropolitan region of china. Landsc. Ecol. 2007, 22, 925–937. [Google Scholar] [CrossRef]
- Li, C.; Li, J.X.; Wu, J.G. Quantifying the speed, growth modes, and landscape pattern changes of urbanization: A hierarchical patch dynamics approach. Landsc. Ecol. 2013, 28, 1875–1888. [Google Scholar] [CrossRef]
- Sun, C.; Wu, Z.F.; Lv, Z.Q.; Yao, N.; Wei, J.B. Quantifying different types of urban growth and the change dynamic in guangzhou using multi-temporal remote sensing data. Int. J. Appl. Earth Observ. Geoinform. 2013, 21, 409–417. [Google Scholar] [CrossRef]
- Deng, J.S.; Wang, K.; Hong, Y.; Qi, J.G. Spatio-temporal dynamics and evolution of land use change and landscape pattern in response to rapid urbanization. Landsc. Urban Plan. 2009, 92, 187–198. [Google Scholar] [CrossRef]
- Jensen, J.R.; Cowen, D.C. Remote sensing of urban/suburban infrastructure and socio-economic attributes. Photogramm. Eng. Remote Sens. 1999, 65, 611–622. [Google Scholar]
- Yin, J.; Yin, Z.E.; Zhong, H.D.; Xu, S.Y.; Hu, X.M.; Wang, J.; Wu, J.P. Monitoring urban expansion and land use/land cover changes of shanghai metropolitan area during the transitional economy (1979–2009) in China. Environ. Monit. Assess. 2011, 177, 609–621. [Google Scholar] [CrossRef] [PubMed]
- Schneider, A.; Mertes, C.M. Expansion and growth in Chinese cities, 1978–2010. Environ. Res. Lett. 2014, 9, 69–75. [Google Scholar] [CrossRef]
- Wu, J.; Jenerette, G.D.; Buyantuyev, A.; Redman, C.L. Quantifying spatiotemporal patterns of urbanization: The case of the two fastest growing metropolitan regions in the United States. Ecol. Complex 2011, 8, 1–8. [Google Scholar] [CrossRef]
- Jenerette, G.D.; Wu, J.G. Analysis and simulation of land-use change in the central Arizona-phoenix region, USA. Landsc. Ecol. 2001, 16, 611–626. [Google Scholar] [CrossRef]
- Shi, Y.Q.; Sun, X.; Zhu, X.D.; Li, Y.F.; Mei, L.Y. Characterizing growth types and analyzing growth density distribution in response to urban growth patterns in peri-urban areas of Lianyungang city. Landsc. Urban Plan. 2012, 105, 425–433. [Google Scholar] [CrossRef]
- Seto, K.C.; Fragkias, M. Quantifying spatiotemporal patterns of urban land-use change in four cities of china with time series landscape metrics. Landsc. Ecol. 2005, 20, 871–888. [Google Scholar] [CrossRef]
- Tian, G.J.; Jiang, J.; Yang, Z.F.; Zhang, Y.Q. The urban growth, size distribution and spatio-temporal dynamic pattern of the Yangtze River delta megalopolitan region, china. Ecol. Model. 2011, 222, 865–878. [Google Scholar] [CrossRef]
- Pickett, S.T.A.; Zhou, W. Global urbanization as a shifting context for applying ecological science toward the sustainable city. Ecosyst. Health Sustain. 2015, 1, 1–15. [Google Scholar] [CrossRef]
- Brugmans, G.; Buijs, S.; Tan, W.; Tunas, D. Megacities: Exploring a Sustainable Future; 010 Publishers: Rotterdam, The Netherlands, 2010. [Google Scholar]
- Seto, K.C.; Reenberg, A.; Boone, C.G.; Fragkias, M.; Haase, D.; Langanke, T.; Marcotullio, P.; Munroe, D.K.; Olah, B.; Simon, D. Urban land teleconnections and sustainability. Proc. Natl. Acad. Sci. USA 2012, 109, 7687–7692. [Google Scholar] [CrossRef] [PubMed]
- UN-HABITAT. State of the World’s Cities 2010/2011: Bridging the Urban Divide; Earthscan: London, UK, 2008. [Google Scholar]
- Yu, W.J.; Zhou, W.Q.; Qian, Y.G.; Yan, J.L. A new approach for land cover classification and change analysis: Integrating backdating and an object-based method. Remote Sens. Environ. 2016, 177, 37–47. [Google Scholar] [CrossRef]
- Seto, K.C.; Fragkias, M.; Guneralp, B.; Reilly, M.K. A meta-analysis of global urban land expansion. PLoS ONE 2011, 6, e23777. [Google Scholar] [CrossRef] [PubMed]
- Deng, X.; Huang, J.; Rozelle, S.; Uchida, E. Growth, population and industrialization, and urban land expansion of china. J. Urban Econ. 2008, 63, 96–115. [Google Scholar] [CrossRef]
- Li, X.; Zhou, W.; Ouyang, Z. Forty years of urban expansion in beijing: What is the relative importance of physical, socioeconomic, and neighborhood factors? Appl. Geogr. 2013, 38, 1–10. [Google Scholar]
- Ahmed, B.; Kamruzzaman, M.; Zhu, X.; Rahman, M.S.; Choi, K. Simulating land changes and their impacts on land surface temperature in Dhaka, Bangladesh. Remote Sens. 2013, 5, 5969–5998. [Google Scholar] [CrossRef]
- Rahman, M.T. Detection of land use/land cover changes and urban sprawl in Al-Khobar, Saudi Arabia: An analysis of multi-temporal remote sensing data. ISPRS Int. J. Geo-Inf. 2016, 5, 15. [Google Scholar] [CrossRef]
- Thapa, R.B.; Murayama, Y. Examining spatiotemporal urbanization patterns in Kathmandu Valley, Nepal: Remote sensing and spatial metrics approaches. Remote Sens. 2009, 1, 534–556. [Google Scholar] [CrossRef]
- Seto, K.C.; Woodcock, C.E.; Song, C.; Huang, X.; Lu, J.; Kaufmann, R.K. Monitoring land-use change in the pearl river delta using landsat tm. Int. J. Remote Sens. 2002, 23, 1985–2004. [Google Scholar] [CrossRef]
- Qi, Y.J.; Yang, Y.; Jin, F.J. China’s economic development stage and its patio-temporal evolution: A prefectural-level analysis. Acta Geogr. Sin. 2013, 68, 517–531. (In Chinese) [Google Scholar]
- Population Census Office under the State Council Department of Population and Employment Statistics National Bureau of Statistics. Tabulation on the 2000 Population Census of the People’s Republic of China by County; China Statistics Press: Beijing, China, 2000.
- Population Census Office under the State Council Department of Population and Employment Statistics National Bureau of Statistics. Tabulation on the 2010 Population Census of the People’s Republic of China by County; China Statistics Press: Beijing, China, 2010.
- Dewan, A.; Yamaguchi, Y. Land use and land cover change in greater Dhaka, Bangladesh: Using remote sensing to promote sustainable urbanization. Appl. Geogr. 2009, 29, 390–401. [Google Scholar] [CrossRef]
- Wu, K.; Zhang, H. Land use dynamics, built-up land expansion patterns and driving forces analysis of the fast-growth Hangzhou metropolitan area, eastern China (1978–2008). Appl. Geogr. 2012, 30, 137–145. [Google Scholar] [CrossRef]
- Jenerette, G.D.; Potere, D. Global analysis and simulation of land-use change associated with urbanization. Landsc. Ecol. 2010, 25, 657–670. [Google Scholar] [CrossRef]
- Jongman, R. Homogenisation and fragmentation of the european landscape: Ecological consequences and solutions. Landsc. Urban Plan. 2002, 58, 211–221. [Google Scholar] [CrossRef]
- Lv, Z.; Dai, F.; Sun, C. Evaluation of urban sprawl and urban landscape pattern in a rapidly developing region. Environ. Monit. Assess. 2012, 184, 6437–6448. [Google Scholar] [CrossRef] [PubMed]
- Brueckner, J.K. Urban sprawl: Diagnosis and remedies. Int. Reg. Sci. Rev. 2000, 23, 160–171. [Google Scholar] [CrossRef]
- Ewing, R.; Schmid, T.; Killingsworth, R.; Zlot, A.; Raudenbush, S. Relationship between urban sprawl and physical activity, obesity, and morbidity. Am. J. Health Promot. 2003, 18, 47–57. [Google Scholar] [CrossRef] [PubMed]
- Irwin, E.G.; Bockstael, N.E. The evolution of urban sprawl: Evidence of spatial heterogeneity and increasing land fragmentation. Proc. Natl. Acad. Sci. USA 2007, 104, 20672–20677. [Google Scholar] [CrossRef] [PubMed]
- Frumkin, H. Urban sprawl and public health. Public Health Rep. 2002, 117, 201. [Google Scholar] [CrossRef]


| Variable | Data Type | Description |
|---|---|---|
| Size | Metric variable | The area of developed land in a city in the starting time |
| Speed | Metric variable | The proportion of new developed land areas account for the developed land area in the starting area |
| Pop | Metric variable | The number of permanent resident population |
| TI | Metric variable | The percentage of the tertiary industry |
| CL1 | Nominal variable | The city located in the YRD urban megaregion |
| CL2 | Nominal variable | The city located in the PRD urban megaregion |
| 2000–2005 | 2005–2010 | |||||||||||||
|---|---|---|---|---|---|---|---|---|---|---|---|---|---|---|
| Leapfrogging | Edge-Expansion | Infilling | Size | Speed | Pop | TI | Leapfrogging | Edge-Expansion | Infilling | Size | Speed | Pop | TI | |
| Leapfrogging | 1 | 0.083 | −0.654 ** | 0.035 | −0.258 | −0.147 | −0.090 | 1 | 0.339 * | −0.811 ** | −0.014 | −0.263 | −0.147 | −0.199 |
| Edge-expansion | 1 | −0.809 ** | 0.535 ** | 0.131 | 0.338 * | −0.031 | 1 | −0.826 ** | 0.471 ** | 0.133 | 0.310 | −0.114 | ||
| Infilling | 1 | −0.427 ** | 0.052 | −0.170 | 0.077 | 1 | −0.285 | 0.075 | −0.105 | 0.190 | ||||
| Size | 1 | −0.241 | 0.830 ** | 0.118 | 1 | −0.179 | 0.824 ** | 0.153 | ||||||
| Speed | 1 | −0.127 | 0.095 | 1 | −0.123 | −0.029 | ||||||||
| Pop | 1 | 0.453 ** | 1 | 0.462 ** | ||||||||||
| TI | 1 | 1 | ||||||||||||
| BTH | YRD | PRD | ||||||||||
|---|---|---|---|---|---|---|---|---|---|---|---|---|
| Area (km2) | Percentage (%) | Anew (km2) | Pnew (%) | Area (km2) | Percentage (%) | Anew (km2) | Pnew (%) | Area (km2) | Percentage (%) | Anew (km2) | Pnew (%) | |
| 2000 | 17,858.10 | 8.27 | — | — | 13,391.91 | 13.26 | — | — | 5863.45 | 10.86 | — | — |
| 2005 | 19,522.99 | 9.05 | — | — | 17,089.88 | 16.92 | — | — | 6702.35 | 12.42 | — | — |
| 2010 | 21,634.86 | 10.02 | — | — | 22,335.54 | 22.11 | — | — | 7669.53 | 14.21 | — | — |
| 2000–2005 | — | — | 1764 | 9.88 | — | — | 3741 | 27.93 | — | — | 775 | 13.22 |
| 2005–2010 | — | — | 2085 | 10.68 | — | — | 5304 | 31.04 | — | — | 873 | 13.03 |
| BTH | YRD | PRD | ||||||||||
|---|---|---|---|---|---|---|---|---|---|---|---|---|
| 2000–2005 | 2000–2005 | 2000–2005 | 2000–2005 | 2000–2005 | 2000–2005 | |||||||
| Amodel (km2) | Pmodel (%) | Amodel (km2) | Pmodel (%) | Amodel (km2) | Pmodel (%) | Amodel (km2) | Pmodel (%) | Amodel (km2) | Pmodel (%) | Amodel (km2) | Pmodel (%) | |
| Leapfrogging | 287 | 16.27 | 437 | 20.95 | 404 | 10.80 | 743 | 14.00 | 12 | 1.56 | 39 | 4.41 |
| Edge-expansion | 1194 | 67.70 | 1287 | 61.71 | 2093 | 55.95 | 2768 | 52.19 | 171 | 22.05 | 286 | 32.80 |
| Infilling | 283 | 16.03 | 362 | 17.34 | 1244 | 33.25 | 1793 | 33.81 | 592 | 76.39 | 548 | 62.79 |
| BTH | YRD | PRD | ||||||||||||
|---|---|---|---|---|---|---|---|---|---|---|---|---|---|---|
| 2000–2005 | 2005–2010 | 2000–2005 | 2005–2010 | 2000–2005 | 2005–2010 | |||||||||
| Anew (km2) | Pnew (%) | Anew (km2) | Pnew (%) | Anew (km2) | Pnew (%) | Anew (km2) | Pnew (%) | Anew (km2) | Pnew (%) | Anew (km2) | Pnew (%) | |||
| Beijing | 426.97 | 18.20 | 423.25 | 14.79 | Shanghai | 295.98 | 17.90 | 666.44 | 35.28 | Guangzhou | 110.72 | 9.72 | 147.65 | 12.04 |
| Tianjin | 507.84 | 27.87 | 390.27 | 18.03 | Suzhou | 542.78 | 51.23 | 630.77 | 39.62 | Foshan | 160.56 | 16.67 | 115.52 | 11.04 |
| Tangshan | 159.65 | 8.59 | 243.63 | 17.51 | Wuxi | 196.38 | 24.13 | 399.50 | 38.69 | Zhongshan | 121.17 | 33.84 | 56.37 | 12.91 |
| Shijiazhuang | 107.31 | 6.65 | 112.88 | 6.43 | Changzhou | 208.38 | 28.71 | 300.17 | 32.62 | Dongguan | 108.85 | 11.99 | 101.23 | 10.47 |
| Handan | 97.97 | 6.70 | 153.48 | 9.62 | Zhenjiang | 201.22 | 40.28 | 288.30 | 40.21 | Shenzhen | 53.12 | 8.78 | 85.08 | 13.10 |
| Xingtai | 87.86 | 6.23 | 121.61 | 8.71 | Nanjing | 397.51 | 47.17 | 345.93 | 28.98 | Jiangmen | 74.58 | 17.76 | 113.84 | 21.99 |
| Qinhuangdao | 73.29 | 12.90 | 63.21 | 10.00 | Yangzhou | 297.52 | 34.82 | 311.80 | 27.28 | Zhuhai | 72.05 | 39.43 | 44.14 | 18.44 |
| Baoding | 66.71 | 2.56 | 129.80 | 5.11 | Taizhou | 231.94 | 21.01 | 293.88 | 22.18 | Huizhou | 45.57 | 9.39 | 141.54 | 23.21 |
| Cangzhou | 52.86 | 3.03 | 99.99 | 5.90 | Nantong | 381.44 | 21.14 | 539.82 | 25.10 | Zhaoqing | 25.47 | 8.61 | 61.92 | 17.98 |
| Langfang | 60.39 | 6.10 | 114.55 | 11.31 | Hangzhou | 276.28 | 26.82 | 306.03 | 23.62 | |||||
| Hengshui | 56.41 | 4.67 | 135.94 | 13.14 | Ningbo | 280.73 | 21.52 | 422.22 | 28.10 | |||||
| Zhangjiakou | 51.00 | 4.85 | 85.90 | 7.62 | Huzhou | 164.15 | 45.27 | 263.56 | 49.13 | |||||
| Chengde | 14.82 | 2.24 | 9.90 | 1.98 | Shaoxing | 128.55 | 16.14 | 219.66 | 24.14 | |||||
| Jiaxing | 120.04 | 18.74 | 267.50 | 35.78 | ||||||||||
| Zhoushan | 14.73 | −2.66 | 40.00 | 31.49 | ||||||||||
| 2000–2005 | 2005–2010 | ||
|---|---|---|---|
| Leapfrogging | Size | −0.012 ** (−0.439) | −0.011 ** (−0.516) |
| Speed | −0.092 (−0.087) | −0.403 (−0.373) | |
| TI | 0.082 (0.041) | 0.101 (0.069) | |
| CL1 | −30.903 ** (−0.904) | −29.251 ** (−1.004) | |
| CL2 | −17.331 ** (−0.581) | −6.38 (−0.251) | |
| Edge-expansion | Size | 0.010 * (0.270) | 0.005 (0.219) |
| Speed | 0.412 * (0.301) | 0.732 ** ( 0.652) | |
| TI | −0.039 (−0.015) | −0.051 (−0.033) | |
| CL1 | −34.027 ** (−0.775) | −24.866 ** (−0.822) | |
| CL2 | −9.498 (−0.247) | −21.035 ** (−0.795) | |
| Infilling | Size | 0.003 (0.054) | 0.006 (0.173) |
| Speed | −0.319 * (−0.178) | −0.329 (−0.183) | |
| TI | −0.043 (−0.198) | −0.050 (−0.224) | |
| CL1 | 64.934 ** (1.123) | 54.118 ** (1.113) | |
| CL2 | 26.834 ** (0.531) | 27.419 ** (0.645) |
© 2017 by the authors; licensee MDPI, Basel, Switzerland. This article is an open access article distributed under the terms and conditions of the Creative Commons Attribution (CC-BY) license (http://creativecommons.org/licenses/by/4.0/).
Share and Cite
Yu, W.; Zhou, W. The Spatiotemporal Pattern of Urban Expansion in China: A Comparison Study of Three Urban Megaregions. Remote Sens. 2017, 9, 45. https://doi.org/10.3390/rs9010045
Yu W, Zhou W. The Spatiotemporal Pattern of Urban Expansion in China: A Comparison Study of Three Urban Megaregions. Remote Sensing. 2017; 9(1):45. https://doi.org/10.3390/rs9010045
Chicago/Turabian StyleYu, Wenjuan, and Weiqi Zhou. 2017. "The Spatiotemporal Pattern of Urban Expansion in China: A Comparison Study of Three Urban Megaregions" Remote Sensing 9, no. 1: 45. https://doi.org/10.3390/rs9010045
APA StyleYu, W., & Zhou, W. (2017). The Spatiotemporal Pattern of Urban Expansion in China: A Comparison Study of Three Urban Megaregions. Remote Sensing, 9(1), 45. https://doi.org/10.3390/rs9010045