Article

Multi-Staged NDVI Dependent Snow-Free Land-Surface Shortwave Albedo Narrowband-to-Broadband (NTB) Coefficients and Their Sensitivity Analysis

1
State Key Laboratory of Remote Sensing Science, Institute of Remote Sensing and Digital Earth, Chinese Academy of Sciences, No. 20A Datun Road, P.O. Box 9718, Beijing 100101, China
2
University of Chinese Academy of Sciences, Beijing 100049, China
3
Joint Center for Global Change Studies, Beijing 100875, China
4
College of Global Change and Earth System Science, Beijing Normal University, No. 19 XinjiekouWai Street, Haidian District, Beijing 100875, China
*
Author to whom correspondence should be addressed.
Remote Sens. 2017, 9(1), 93; https://doi.org/10.3390/rs9010093
Submission received: 29 October 2016 / Revised: 31 December 2016 / Accepted: 11 January 2017 / Published: 20 January 2017

Abstract

:
Narrowband-to-broadband conversion is a critical procedure for mapping land-surface broadband albedo using multi-spectral narrowband remote-sensing observations. Due to the significant difference in optical characteristics between soil and vegetation, NTB conversion is influenced by the variation in vegetation coverage on different surface types. To reduce this influence, this paper applies an approach that couples NTB coefficient with the NDVI. Multi-staged NDVI dependent NTB coefficient look-up tables (LUT) for Moderate Resolution Imaging Spectroradiometer (MODIS), Polarization and Directionality of Earth’s Reflectance (POLDER) and Advanced Very High Resolution Radiometer (AVHRR) were calculated using 6000 spectra samples collected from two typical spectral databases. Sensitivity analysis shows that NTB conversion is affected more by the NDVI for sensors with fewer band numbers, such as POLDER and AVHRR. Analysis of the validation results based on simulations, in situ measurements and global albedo products indicates that by using the multi-staged NDVI dependent NTB method, the conversion accuracies of these two sensors could be improved by 2%–13% on different NDVI classes compared with the general method. This improvement could be as high as 15%, on average, and 35% on dense vegetative surface compared with the global broadband albedo product of POLDER. This paper shows that it is necessary to consider surface reflectance characteristics associated with the NDVI on albedo-NTB conversion for remote sensors with fewer than five bands.

Graphical Abstract

1. Introduction

Land-surface broadband albedo is a critical parameter in the energy budget, the climate model, the evapotranspiration estimation and in global change, and it is quantified as the fraction of solar radiation reflected by the earth’s land surface [1,2,3,4,5]. Thus, albedo is relative to land-surface reflectance, which can be described using the Bidirectional Reflectance Distribution Function (BRDF) [6]. When integrating directional reflectance to hemispherical albedo, satellite remote sensing provides the most practical way to consistently map land-surface albedo. Recent middle- and low-resolution remote sensors, such as Moderate Resolution Imaging Spectroradiometer (MODIS) [7], Polarization and Directionality of Earth’s Reflectance (POLDER) [8], and Advanced Very High Resolution Radiometer (AVHRR) [9], provide important data from which to produce global land-surface albedo using the BRDF model [10,11,12].
However, these satellite sensors do not always have a consistent spectral band and sometimes have several limited narrowband wavelengths. To obtain shortwave band-length albedo, conversion coefficients are usually used for inverting narrowband albedo to broadband albedo, which is a crucial step in the land-surface albedo estimation using remote-sensing images [13].
Early research to derive the conversion coefficients for AVHRR and Landsat were mainly dependent on field or top-of-atmosphere (TOA) measurements [14,15,16,17]. Model simulation is preferable for calculating conversion coefficients because ground measurements are expensive under different atmospheric and surface conditions [18]. Thus, conversion coefficients for most sensor systems, such as MODIS, Multi-angle Imaging SpectroRadiometer (MISR), Medium Resolution Imaging Spectrometer (MERIS), POLDER, and Visible/Infrared Imager/Radiometer Suite (VIIRS), are all based on similar simulation methods [19,20,21,22,23]. The basic method establishes the multiple linear regression relationship between narrowband and broadband albedos, which is influenced by both the surface reflectance characteristic and atmospheric condition.
Land-surface albedos from various remote sensors were simulated under a series of different atmospheric conditions, and the conversion coefficients were calculated and validated [18,24]. The influence of the surface reflectance characteristic is challenging to determine because individual land-surface type regressions have significantly different characteristics [25]. Thus, NTB regression should be divided into a series of sets for different surface types. Some global albedo products, such as MODIS, POLDER and CYCLPES, have divided their conversion coefficients into snow and snow-free, two types to emphasize the unusual reflective characteristic of snow surfaces [10,11,26]. However, NTB conversion on snow-free ground is also strongly dependent on the surface types due to the great difference in optical reflectance between soil and vegetation. Land-surface classification is a straightforward method by which to distinguish surface types, but the variability of land cover due to vegetation phenology makes it difficult to capture the surface type instantaneously [
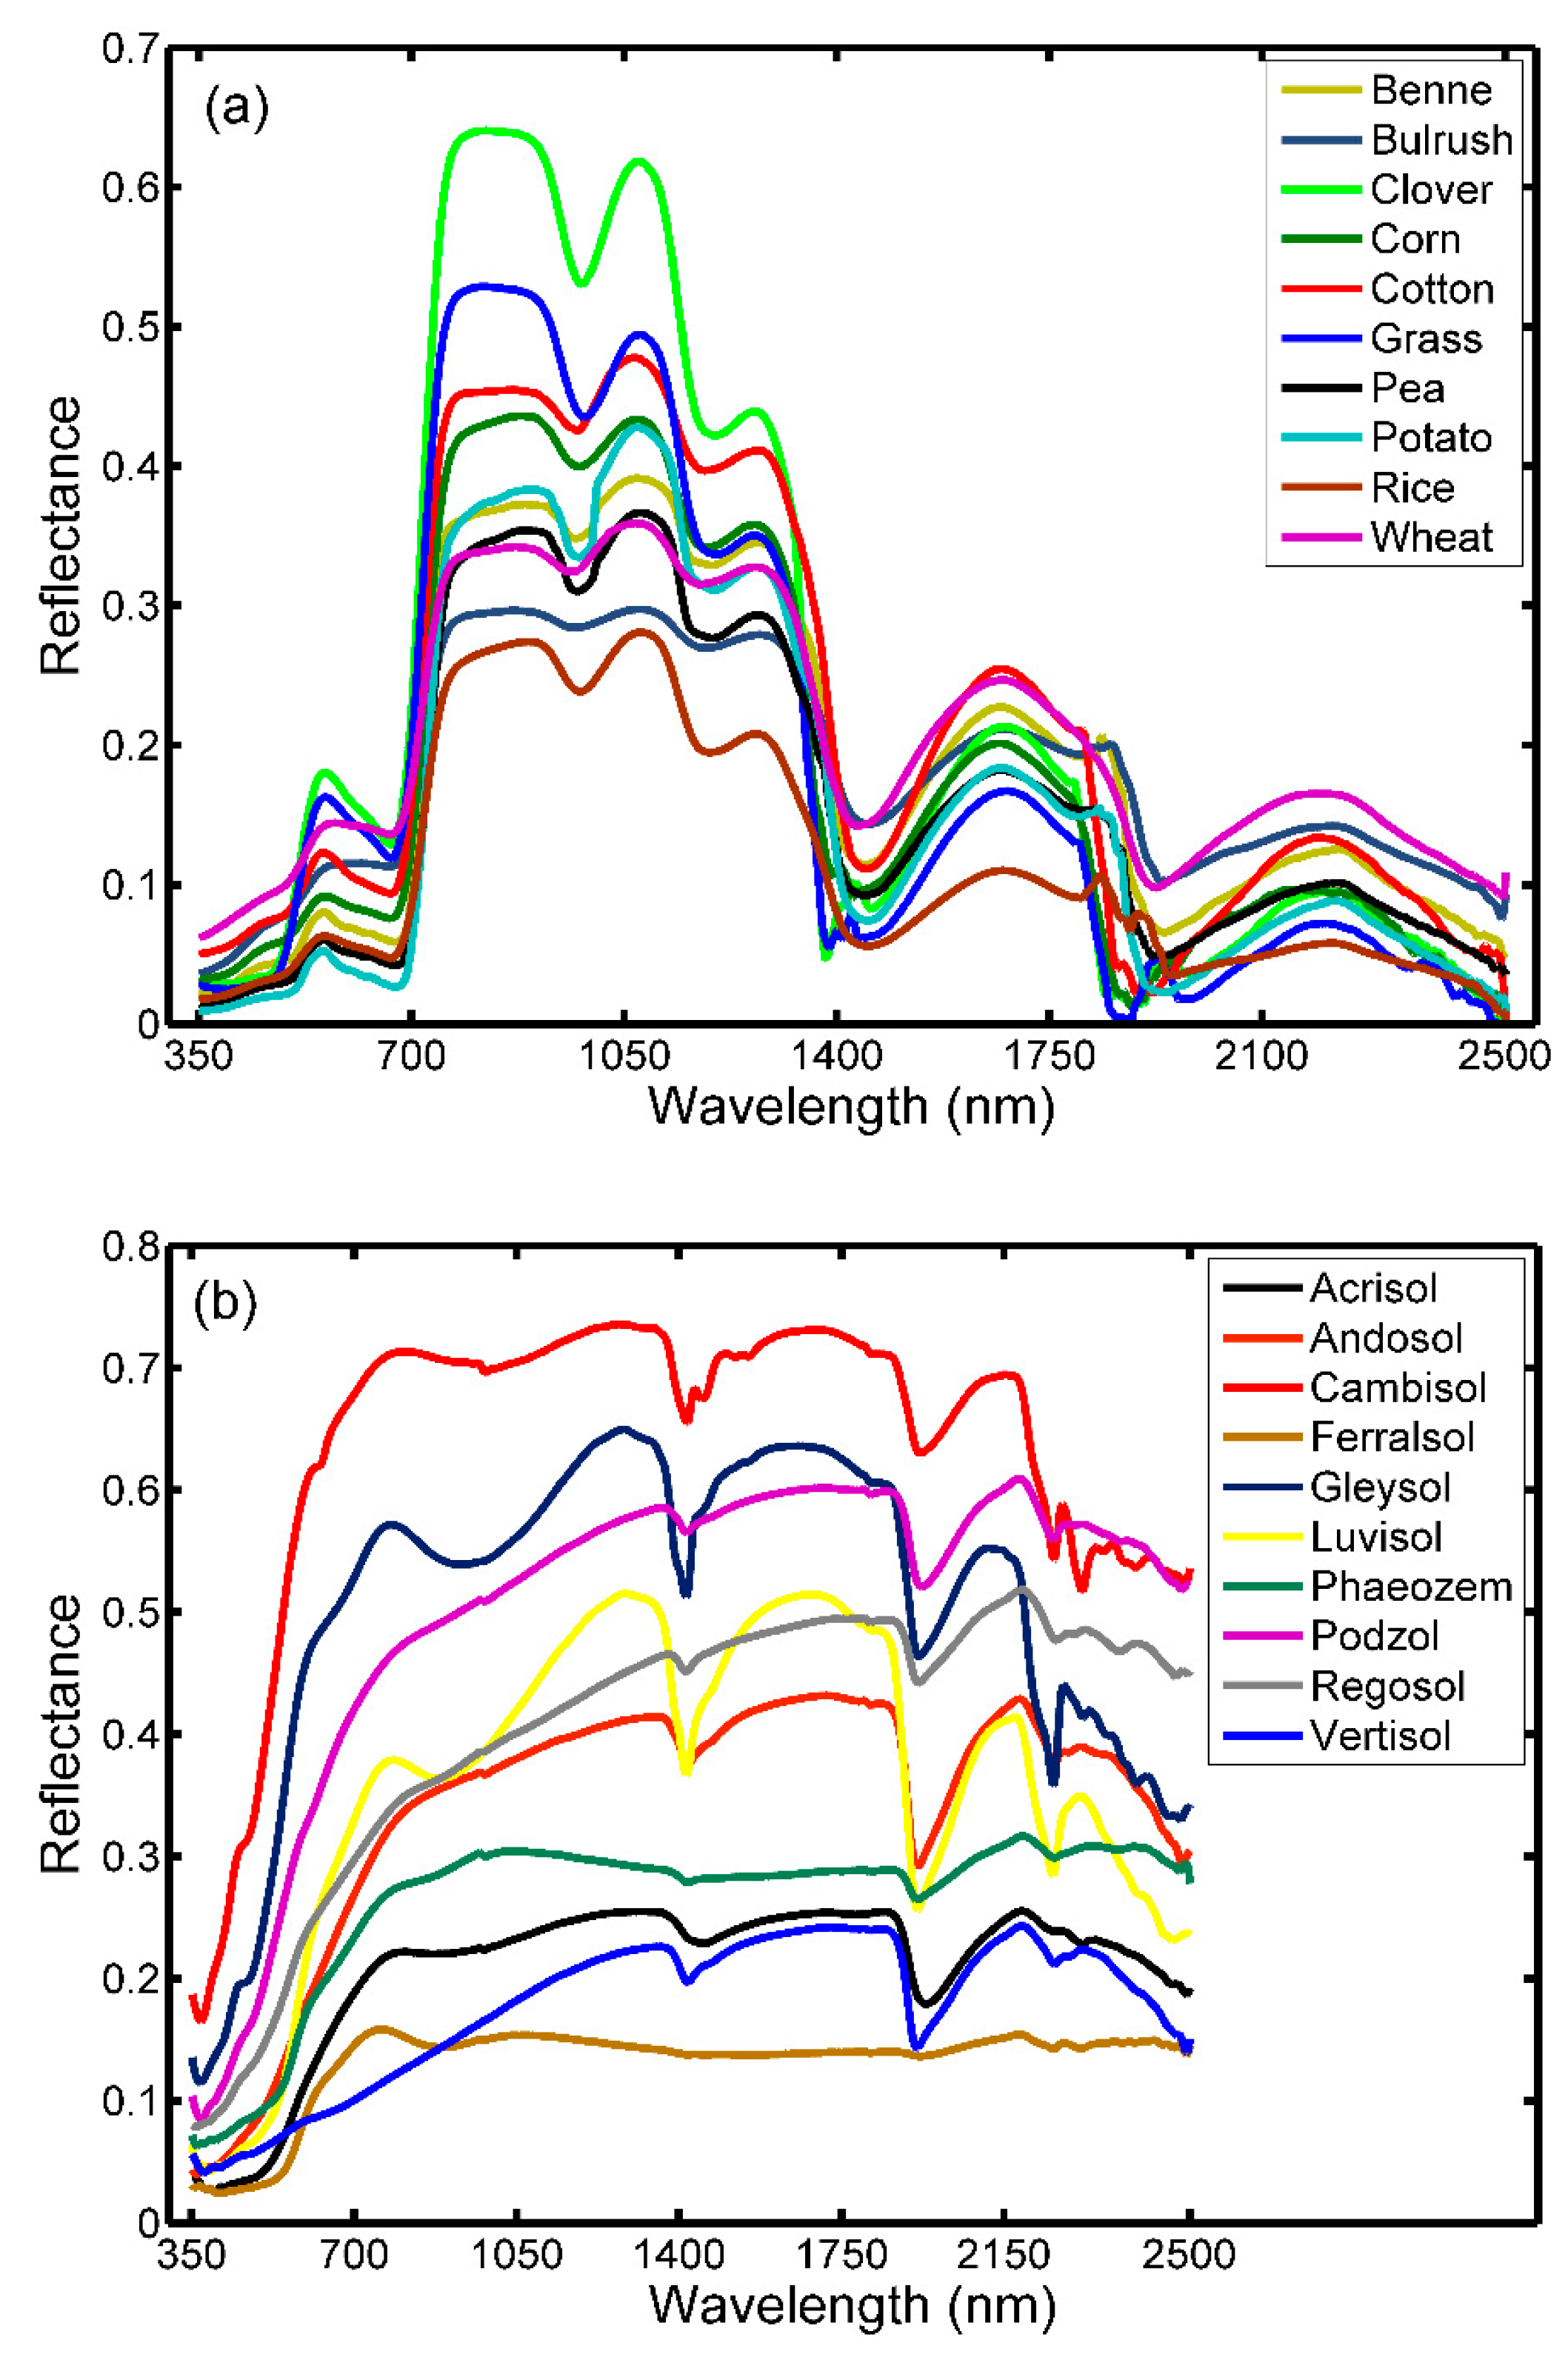
27]. Furthermore, the land surface reflectance, which plays a very significant role in the NTB conversion, has been proven to be related to the Normalized Difference Vegetation Index (NDVI). Furthermore, the NDVI-based disaggregation technique has been evaluated to be a more effective strategy than the land cover based technique or the crop type based technique in the research field of BRDF-adjustment [28,29,30]. Thus, NDVI is considered the most suitable parameter for analyzing and solving the impact of the surface reflectance characteristic to NTB conversion [31]. A previous study used NDVI as a variable to build quadratic polynomials to calculate the red and infrared bands’ conversion coefficients [32]. This method is a desirable solution for sensor with only these two bands such as AVHRR, but may not be suitable for other sensors with more than these two bands. In general, NTB coefficient regression is more robust when information from multiple bands are used compared with the same calculation using two or fewer bands. Thus, for sensors with more than red and infrared bands, using such quadratic polynomials to calculate the conversion coefficients will reduce the information from multiple bands, which will introduce more uncertainties. Moreover, the accuracy of such method may be unstable, because the NDVI error can be directly propagated into the calculated conversion coefficients by the quadratic polynomials.
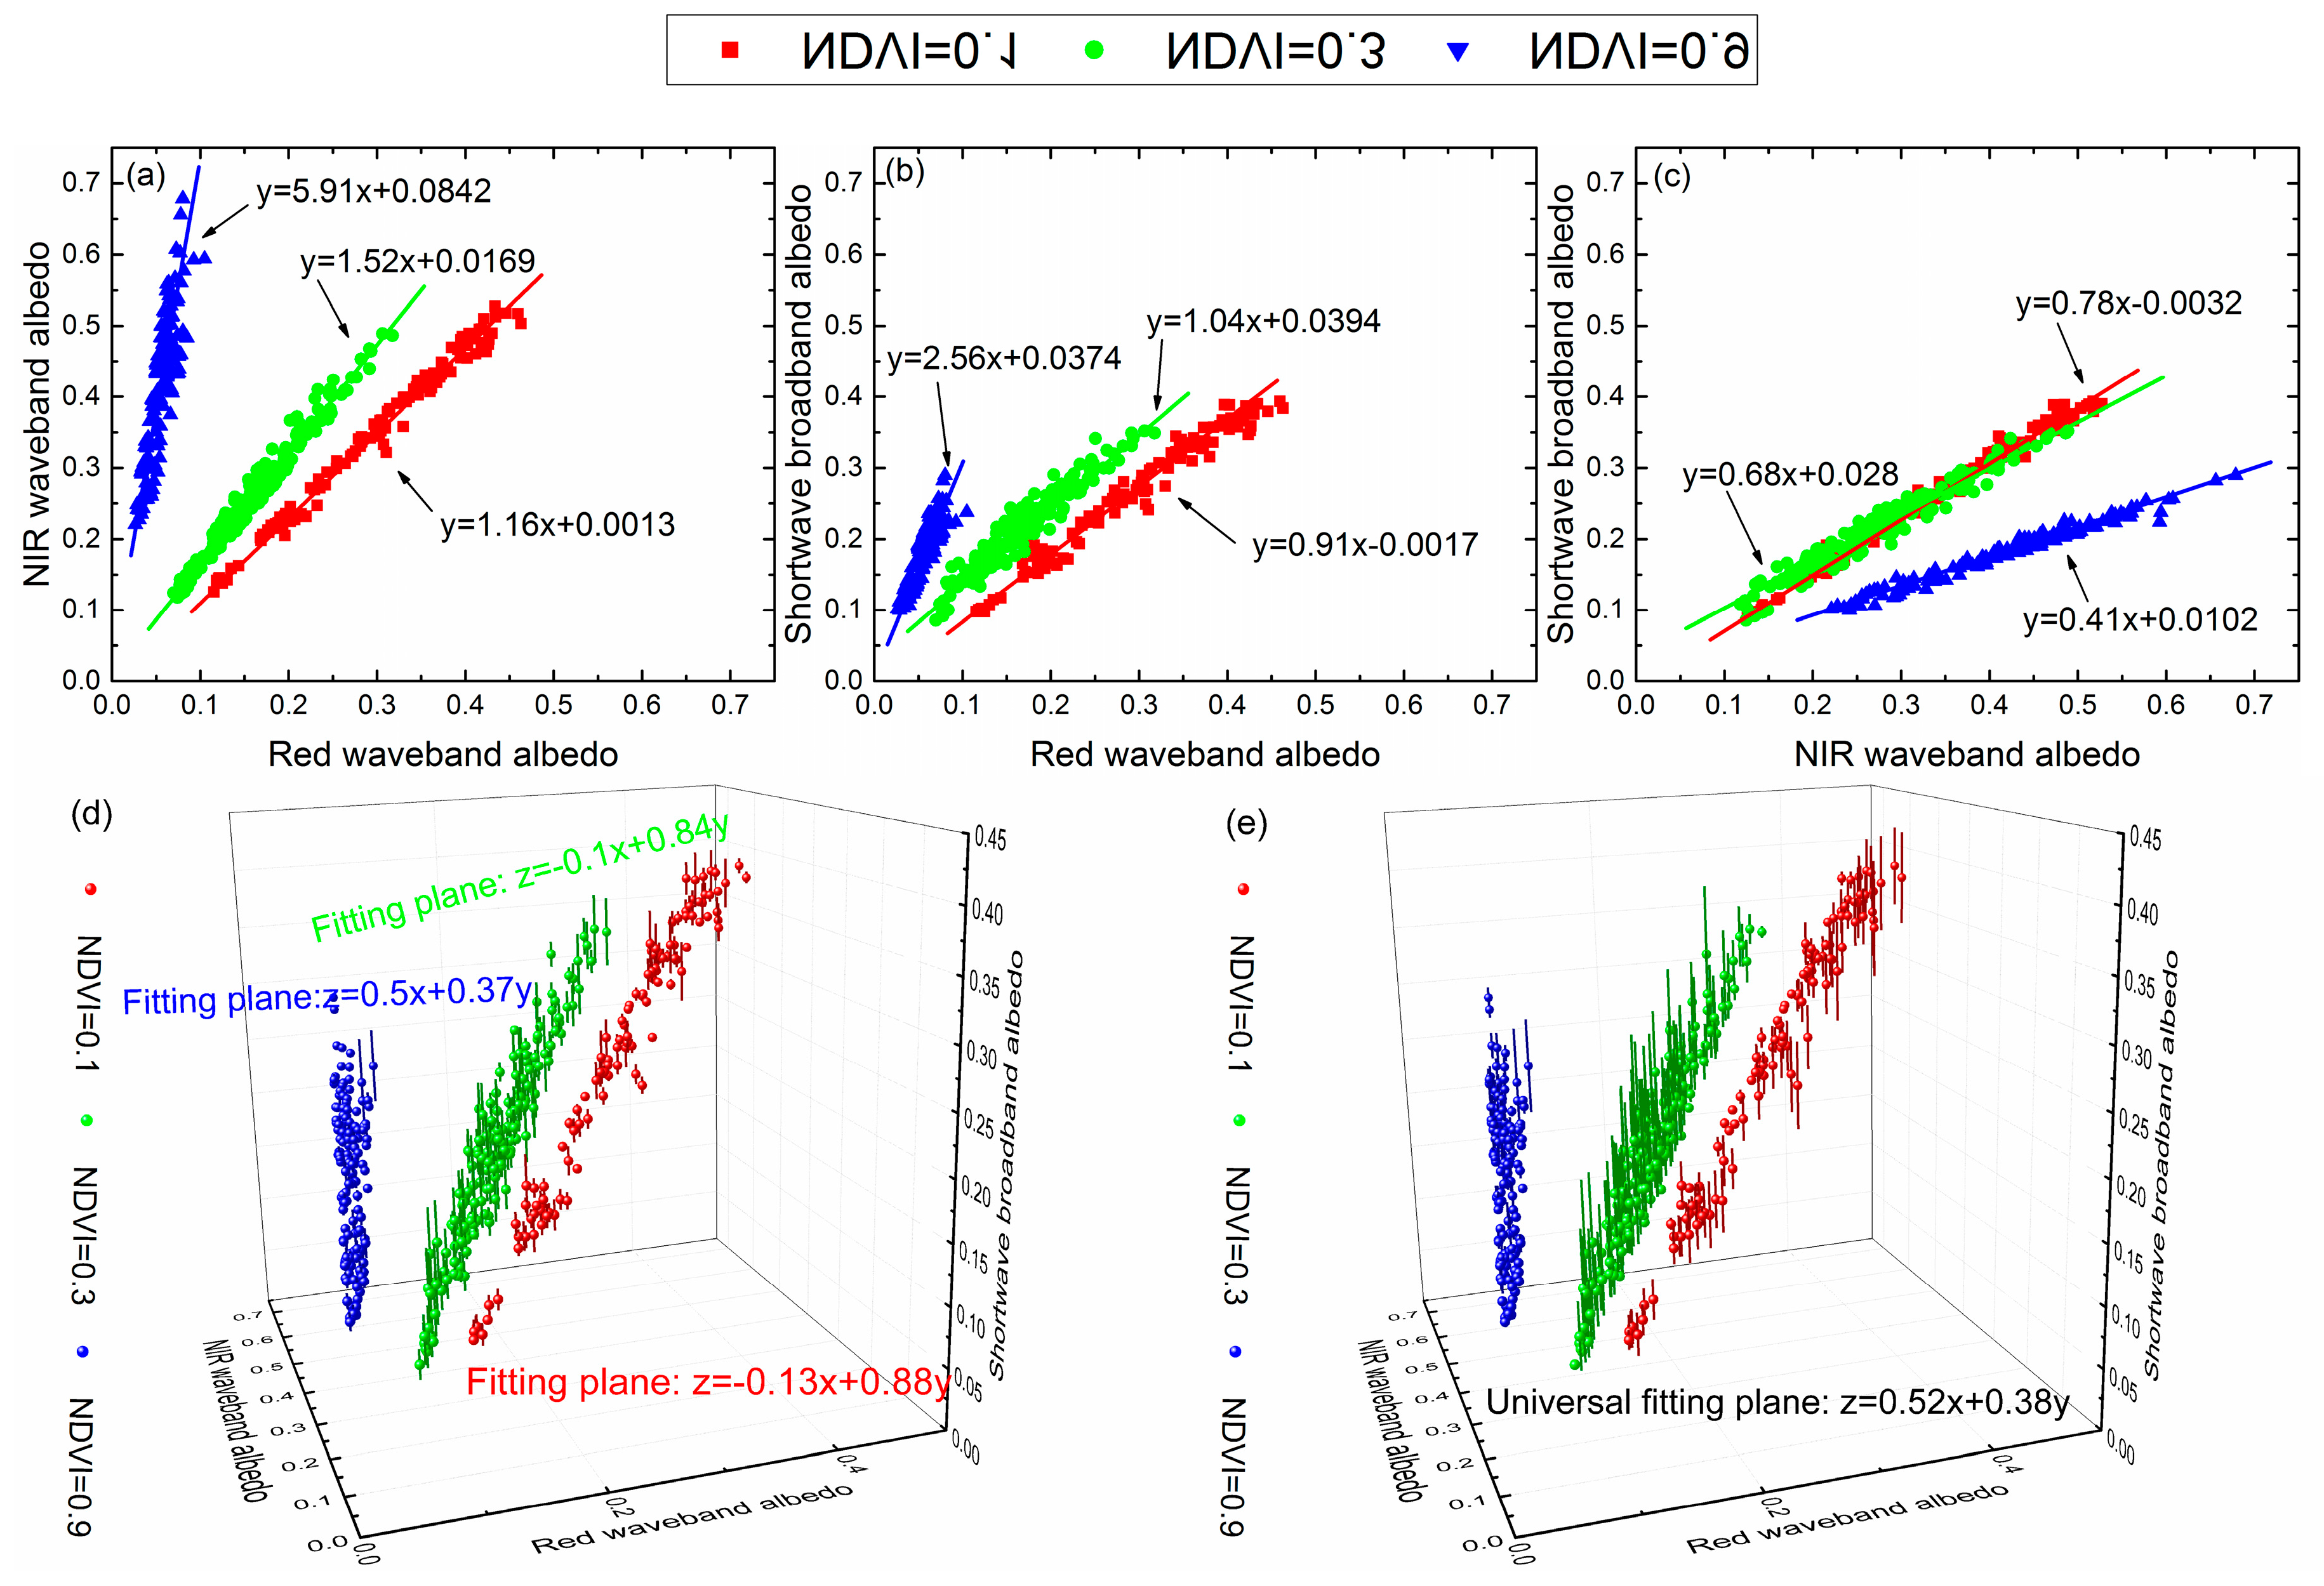
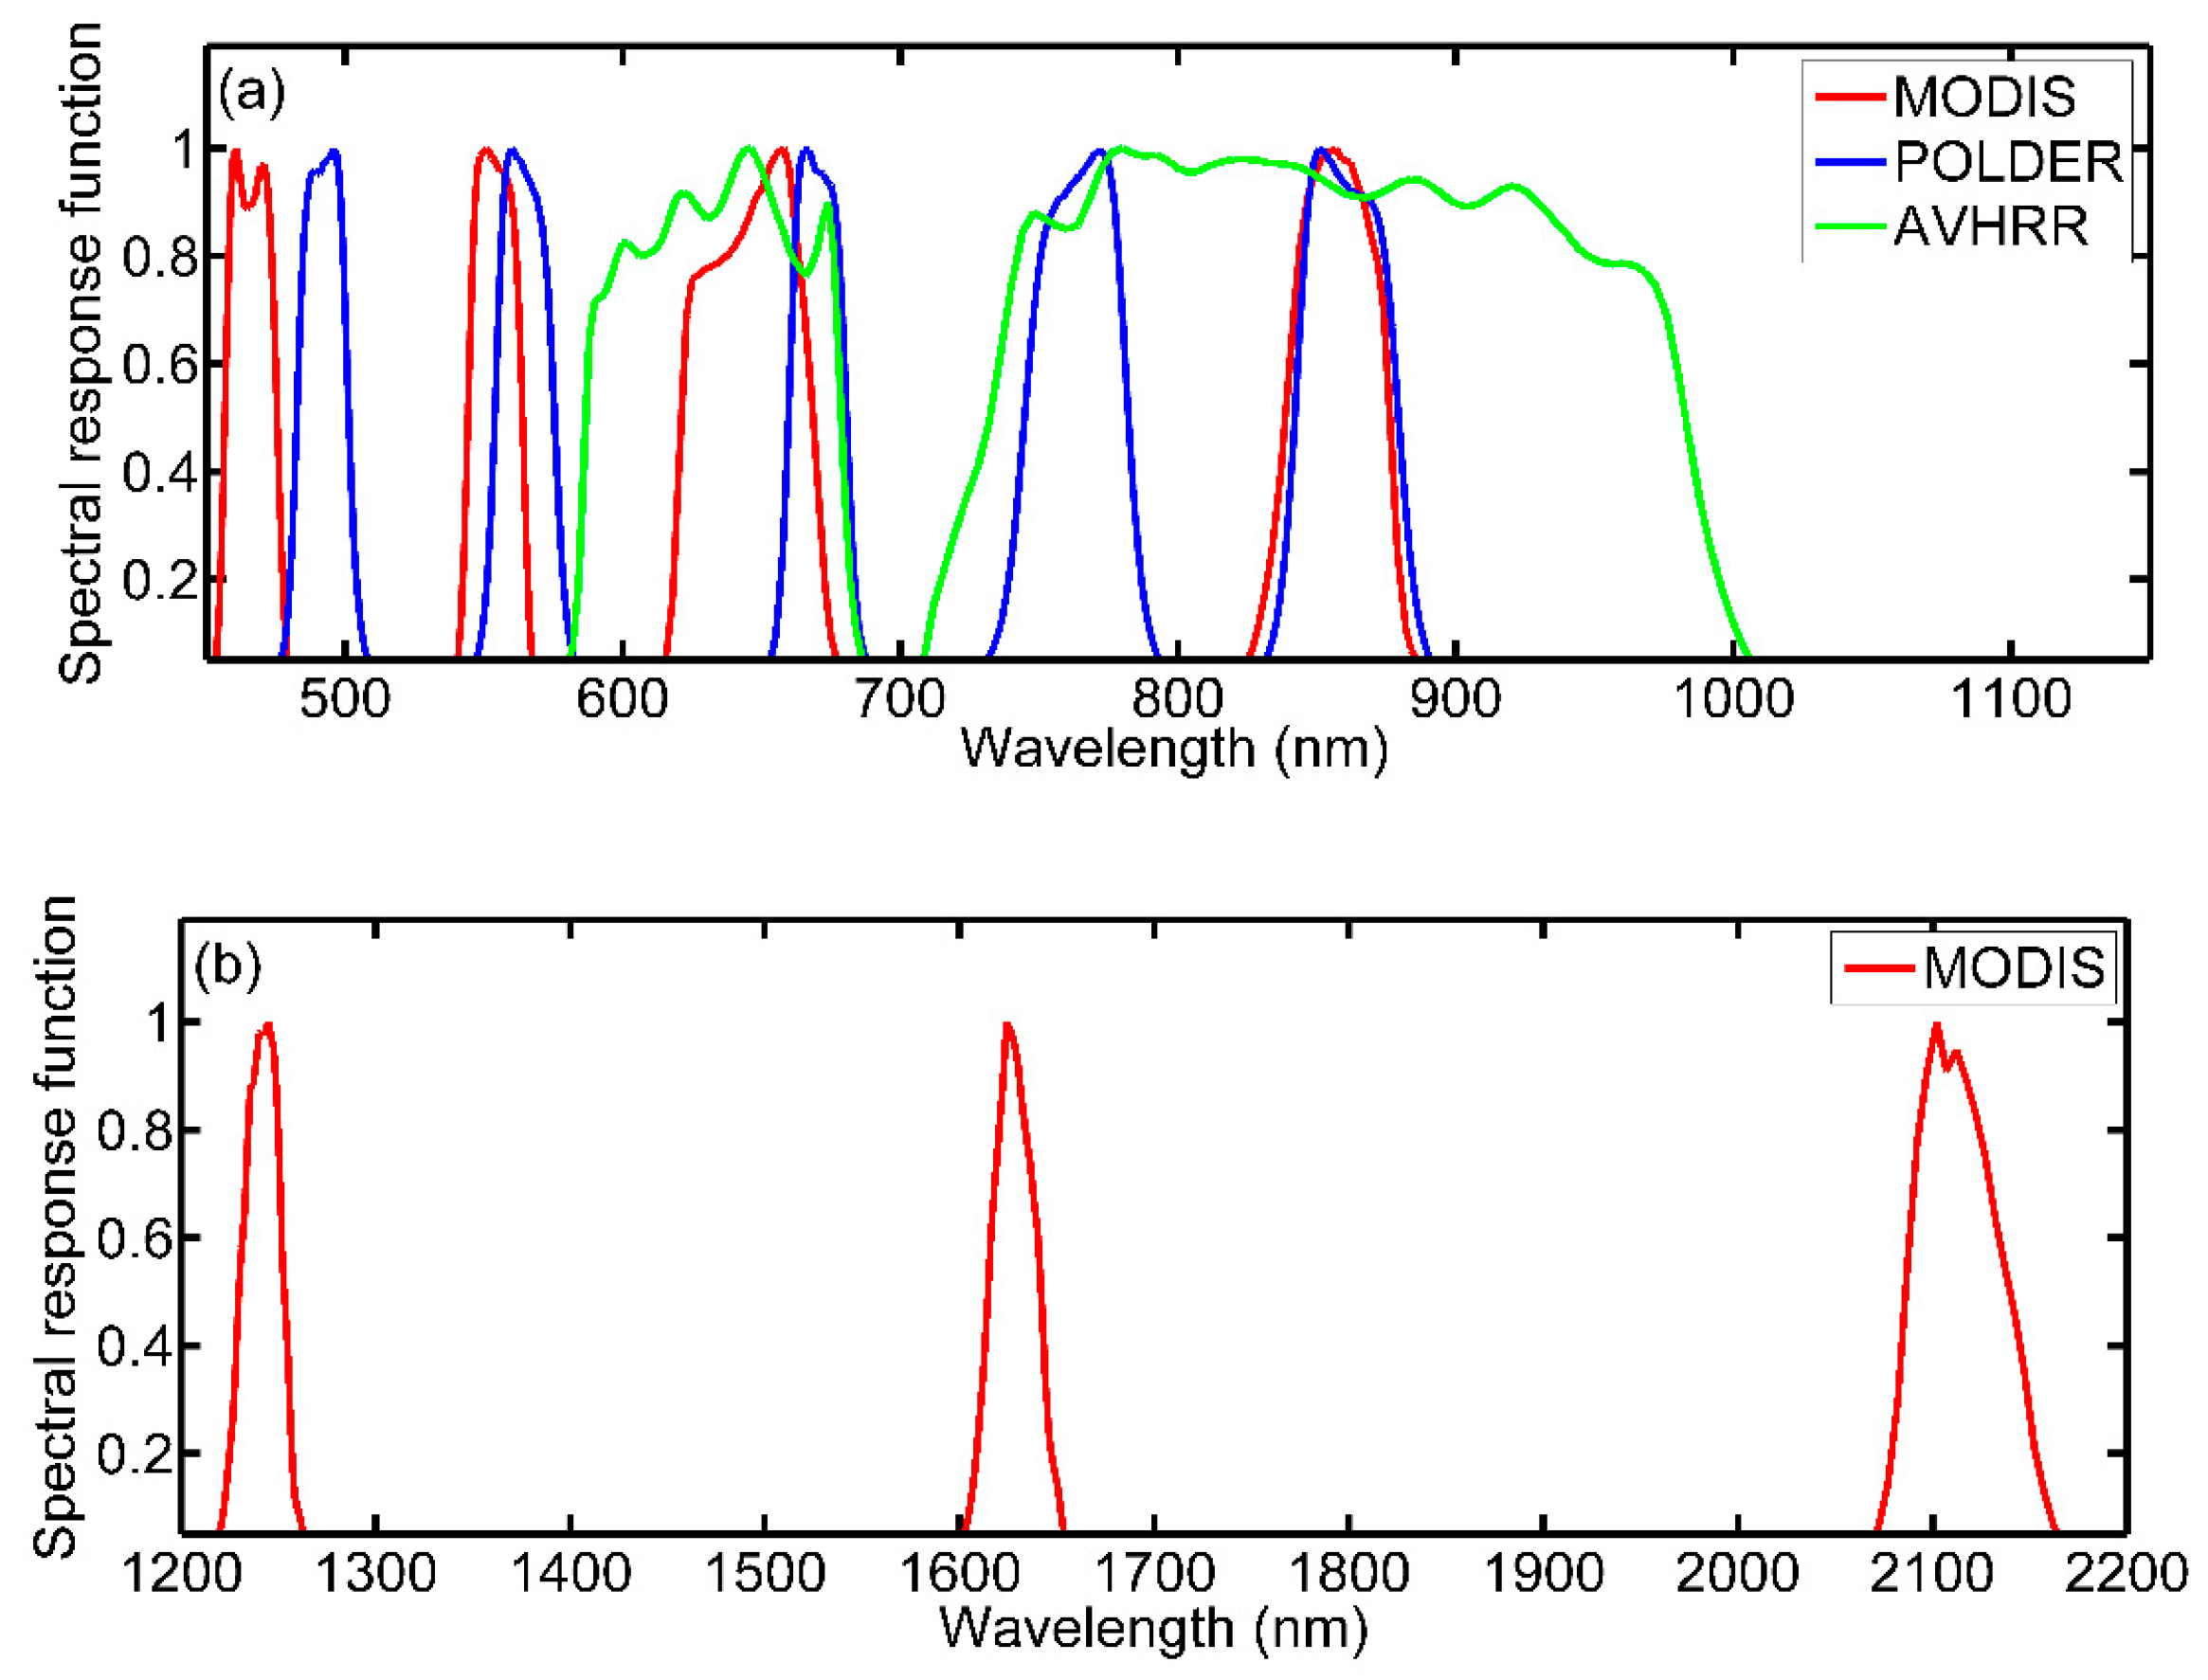
In this study, we used a NDVI dependent disaggregation look up table method to generate the multi-staged NTB coefficients of different NDVI classes of MODIS, POLDER and AVHRR broadband albedo estimation, whose band numbers were 7, 5 and 2, respectively. This method considers both the multiple band information and land-surface type, so that all of the sensors’ band information can be used to understand the different land-surface reflectance characteristics. Furthermore, the indirect approach to couple NTB coefficient with NDVI can avoid the direct error-propagation. A sensitivity analysis was performed to assess the effect of NDVI on NTB conversion and its relationship with the sensor’s placement and number of wavebands. The result is significant for determined whether a remote sensor is necessary to consider the different surface reflectance characteristics during its NTB conversion approach.
In this paper, we first address the theoretical basis of the multi-staged NDVI dependent NTB method in Section 2, followed by the description of data in Section 3. Further, we provide the NTB coefficients derived by the new method, and their sensitivity analyses and accuracy evaluations results in Section 4. Then we discuss the results in detail in Section 5. Finally, we present a summary in Section 6.

2. Methods

2.1. Basic Theory of Albedo

Surface broadband albedo a ( θ i ; Λ ) is simply defined as the ratio of the upwelling irradiance F u ( θ i ; Λ ) to the downward irradiance F d ( θ i ; Λ ) at the solar zenith angle θ i :
a ( θ i ; Λ ) = F u ( θ i ; Λ ) F d ( θ i ; Λ ) = λ 1 λ 2 F d ( θ i ; λ ) a ( θ i ; λ ) d λ λ 1 λ 2 F d ( θ i ; λ ) d λ
where F d ( θ i ; λ ) and a ( θ i ; λ ) are the solar downward spectral energy flux and surface spectral albedo at wavelength λ , respectively, and Λ is the waveband range from the lower limits λ 1 to the upper limits λ 2 . As observed from Equation (1), the surface broadband albedo is determined by both the surface reflection characteristics and atmospheric status. To focus on the effect of the surface reflection characteristics in NTB conversion, a surface broadband inherent albedo was adopted, which is independent of the atmospheric conditions and defined as the ratio of surface upwelling irradiance to an undamped downward irradiance [19]:
a I ( θ i ; Λ ) = λ 1 λ 2 F O ( θ i ; λ ) a I ( θ i ; λ ) d λ λ 1 λ 2 F O ( θ i ; λ ) d λ
as F O ( θ i ; λ ) is the extraterrestrial solar downward irradiance at TOA.

2.2. Multi-Staged NDVI Dependent NTB Coefficient

For multispectral remote-sensing systems, the continuous spectral albedo a ( θ i ; λ ) is difficult to observe directly. Indeed, they usually obtain the albedos in a limited number of wavebands within narrow wavelength ranges, which is called narrowband albedo. According to the energy rule, the shortwave broadband albedo can be expressed as linear integrated by narrowband albedos with NTB coefficients. Thus, Equation (1) can be simplified as following:
a ( θ i ; Λ ) = k = 1 N c k a ( θ i ; Λ k n a r )
where c k and Λ k n a r are the conversion coefficient and narrowband range of the k band, and N is the band amount of the multispectral sensor.
Ideally, the narrowband and broadband albedo should be calculated using the spectral albedo with high quality and good representativeness to the globally various land covers. However, the available ground measured spectral albedo are very scarce due to the difficulty and complexity of the measurement. Thus, there are two alternative choices: using the radiation transfer model simulated spectral albedo or taking the ground measured spectral nadir reflectance as the spectral albedo with the assumption of Lambertian. For the simulations, it is still a challenge to obtain sufficient and high-quality spectral albedo, as the adequate and accurate configurations of the model parameters are not easy to achieve to represent the complex and various land covers. However, for the second choice, a large quantity of reflectance spectra can be collected globally to meet the requirement of the sufficient repressiveness of various land surfaces. Furthermore, the surface inherent spectral albedo in Equation (2) is similar to the representative surface spectral nadir reflectance with a less uncertainty expect in the surface with dominating 3-D structures [24]. Thus, using the measured reflectance is regarded as an acceptable compromise between the representativeness and data quality. Under the Lambertian assumption, the surface inherent narrowband albedo a I ( θ i ; Λ k n a r ) can be expressed as:
a I ( θ i ; Λ k n a r ) = λ 1 λ 2 F O ( θ i ; λ ) ρ S ( θ i ; λ ) f r e s ( λ ) d λ λ 1 λ 2 F O ( θ i ; λ ) f r e s ( λ ) d λ
where the solar downward TOA irradiance F O ( θ i ; λ ) was simulated by using four extraterrestrial radiation solar spectrums (ChKur, CebKur, NewKur and ThKur) of MODTRAN over seven solar zenith angles (0, 10, 20, 30, 40, 50 and 60), the surface spectral nadir reflectance ρ S ( θ i ; λ ) were collected from spectra library [33,34], the f r e s ( λ ) was the spectral response function. Table 1 and Figure 1 present the MODIS, POLDER and AVHRR spectral response functions. The shortwave inherent broadband albedo was simulated as following:
a I ( θ i ; Λ ) = λ 1 λ 2 F O ( θ i ; λ ) ρ S ( θ i ; λ ) d λ λ 1 λ 2 F O ( θ i ; λ ) d λ
where the λ 1 is 350 μm and λ 2 is 2500 μm.
The conversion coefficient c k is correlated with the surface reflectance characteristic, which varies greatly over different land surfaces. Various parameters, such as the surface coverage type, fractional vegetation cover, and leaf area index (LAI), could be used to classify the conversion coefficient. However, in this paper, the NDVI is employed as the classification indicator because it can be obtained directly from the reflectivity observations of multi-spectral remote sensing systems.
The NDVI was defined as the fraction of band math:
NDVI = ρ N I R ρ R E D ρ N I R + ρ R E D
where ρ N I R is the near-infrared reflectance and ρ R E D is the red reflectance.
NDVI was segmented into 10 classes with equal interval of 0.1 representing the different snow-free reflectance characteristics of surfaces and limited from 0 to 1 due to the snow-free NDVI is always positive. For each region, the least squares solution was conducted to get the conversion coefficient c k :
c k = [ a I ( θ i ; Λ k n a r ) T a I ( θ i ; Λ k n a r ) ] 1 a I ( θ i ; Λ k n a r ) T a I ( θ i ; Λ )
Then, the NTB coefficients of different NDVI classes were integrated into look-up tables (LUT) which were stratified into ten layers by interval of 0.1.

2.3. The Coefficients Evaluation Method

To validate the Multi-staged NDVI dependent NTB coefficient, we evaluated and compared the conversion error between the presented method and general method in both simulated and in situ measured validation data. The general method is to derive the NTB coefficient without the consideration of different reflectance characteristics of surface.
The Bias, root-mean-square error (RMSE) and correlation coefficient (R) are selected to show the NTB coefficient accuracy, uncertainty and goodness-of-fit in the scatter plots, which are formulized as the following forms:
Bias = i = 1 n ( a C i ( Λ ) a i ( Λ ) ) / n
RMSE = i = 1 n ( a C i ( Λ ) a i ( Λ ) ) 2 n
R = i = 1 n ( a C i ( Λ ) a C i ( Λ ) ¯ ) ( a i ( Λ ) a i ( Λ ) ¯ ) i = 1 n ( a C i ( Λ ) a C i ( Λ ) ¯ ) 2 ( a i ( Λ ) a i ( Λ ) ¯ ) 2
where a C i ( Λ ) is the converted broadband albedo and a i ( Λ ) is the simulated or in situ measured broadband albedo. In order to show the distribution of conversion error over different NDVIs, a mean relative error (MRE) histogram is taken, which is expressed as following:
MRE = 100 i = 1 n ( a C i ( Λ ) a i ( Λ ) ) / a i ( Λ ) ¯ n

3. Data

3.1. Spectra Reflectance Data Set

A total of 7400 reflectance spectra, including 96 soil types (3200 samples) and 28 vegetation types (4200 samples), were collected from the ICRAF-ISRIC Global Soil Spectral Library and the Ground Object SPEctral Library (GOSPEL), as shown in Figure 2. The soil spectra were from 58 countries spanning five continents and measured at the World Agroforestry Center’s Soil and Plant Spectral Diagnostic Laboratory [33]. The GOSPEL spectral library is established by Institute of Remote Sensing and Digital Earth, Northeast Institute of Geography and Agroecology, Northwest Institute of Eco-Environment and Resources Chinese Academy of Sciences, and Beijing Normal University [34]. This spectra library consists of Chinese typical visible near infrared spectra of vegetation, soil, rock, water, manual object, snow and ice in the scales of component, canopy, and pixel of remote sensing image. The vegetation spectra selected in this paper were measured from most field areas of China at different phenology phases in a canopy scale. Compared with the simulated spectral data used in many previous studies, the measured data are more representative and physical. We selected 6000 spectral samples to calculate the multi-staged NDVI dependent NTB coefficients. The number of spectra samples in each NDVI interval is sufficient (at least 90) to ensure the reasonability of the NTB coefficients on all NDVI classes. The remaining 1400 samples were used to validate the multi-staged NDVI dependent NTB method in the simulation experiment.

3.2. Validation Data Sets

A total of 1400 samples of spectra, independent of the spectra used to generate the coefficient LUTs, were collected to validate the accuracy of the LUTs in a simulated strategy. These spectra were used to simulate the narrowband and broadband albedos on different NDVI classes. The narrowband albedos were converted to broadband albedos using the coefficients of the multi-staged NDVI dependent NTB method and the general method. Then, the spectra-simulated broadband albedos were used as the true values to validate the accuracy of the converted broadband albedos.
The simulated validation strategy uses the theoretical true albedo value and can guarantee that the only difference in the comparison analysis is the conversion coefficient. However, many other uncertainties remain, such as atmospheric effects, algorithm errors, measuring errors and so on, affecting the actual production of global albedos. These uncertainties cannot be reflected in the simulated experiment. Therefore, the performance of the conversion coefficient must be assessed by using actual measurements and albedo products. Thus, in situ albedo measurements and global albedo products of MODIS and POLDER were collected in a validation attempt.
The in situ albedos were measured using the flux towers of the FLUXNET, which is a global network for providing observations of exchanges between terrestrial ecosystems and the atmosphere [35]. Tower-based albedos at 26 flux sites, ranging from one-year measurement periods, were acquired from the FLUXNET (free download from http://fluxnet.fluxdata.org). These albedo observations covered a broad range of climate models, spanning from low latitude to high latitude, and ecosystem types, including croplands (CRO), woody savannas (WSA), evergreen broadleaf forests (EBF), evergreen needle leaf forests (ENF), open shrub lands (OSH), deciduous broadleaf forests (DBF) and grasslands (GRA), all of which are shown in Table 2. The representativeness of the selected flux sites have been evaluated in the previous researches of Román et al. [36] and Cescatti et al. [37]. Tower-based daily surface-measured albedos were derived by calculating the mean of available cloud-free data within a 30-min window centered at a local solar noon.
The MODIS global 500 m albedo product MCD43A3 (free download from https://ladsweb.nascom.nasa.gov/data) was generated by the MODIS Land Science Team and operationally produced every eight days over a 16-day temporal window. The POLDER Land-surface level 3 global albedo product (free download from http://postel.mediasfrance.org) was provided by the Centre National d’Études Spatiales research team. It has a spatial resolution of 6 km and a temporal resolution of 10 days. Both of these two global albedo products were calculated using the kernel-driven BRDF model, which depends on the weighted sum of kernel functions [10]. The two narrowband albedo products were converted to broadband albedo products using the coefficients of the multi-staged NDVI dependent NTB method and the general method. To determine which coefficient in the LUTs should be used at a specific location and time, the corresponding global NDVI products of MODIS (MYD13A1) and POLDER were also used in this paper. The MODIS aerosol product MOD04_L2 were collected to calculate the ratio of diffuse sky-light through a look up table, which was pre-calculated with the 6S code, and using an open-source procedure provided by Feng Gao (free download from ftp://rsftp.eeos.umb.edu/data01/Website/actual_albedo.tar) [38]. The blue-sky albedos were computed by interpolating between black-sky and white-sky albedos using the calculated ratio of diffuse skylight. Then, the blue-sky narrowband albedo were converted to blue-sky broadband albedo.
The in situ albedo measurements were used to assess the accuracy of the converted surface broadband albedos. In addition, the accuracy of the global broadband albedo products of MODIS and POLDER, which were converted using their operational conversion coefficients [19,20], were also assessed. The detailed comparison of these three conversion results is described in Section 4.4. Because the AVHRR research team does not provide global albedo products, the validation of the coefficient LUT for AVHRR was implemented only in the simulation strategy.

4. Results

4.1. Multi-Staged NDVI Dependent NTB Coefficient Look-Up Tables

The multi-staged NDVI dependent NTB coefficient LUTs of MODIS, POLDER and AVHRR are shown in Table 3, Table 4 and Table 5. Table 6 shows the NTB coefficients computed by the same 6000 spectral samples using the general method (without consideration of the NDVI-based land-surface division).
Table 7 shows the fitting residuals of the NTB coefficient LUTs for the three sensors. The terms Median, correlation coefficient (R), and RMSE represent the average residual, and the minimum (Min) and maximum (Max) represent the worst situations, respectively. It is clear that MODIS had the smallest fitting residual with an RMSE of 0.0015. For POLDER and AVHRR, the RMSE increased to 0.0055 and 0.0068, respectively, and the values of the Min and the Max were larger than that of MODIS. This is mainly because these two sensors do not have as many bands as MODIS has. Despite the different fitting results from the three sensors, the overall residuals of the multi-staged NDVI dependent NTB method were low. Table 8 summarizes the fitting residuals of the coefficients computed using the general method for the three sensors. When we compare Table 7 with Table 8, we find that the fitting residuals of the multi-staged NDVI dependent NTB method were much smaller than those from the general method for all three sensors and evaluation terms.

4.2. Sensitivity Analysis of NDVI on NTB Conversion

Given a series of narrowband and broadband albedos, the conversion coefficients are usually calculated using multiple linear regression; thus, the result depends on the linear features and relationships of input albedos. Theoretically, if the corresponding narrowband and broadband albedos have similar linear relationship, the regression result will be quite stable. However, the large difference in optical reflectance characteristics between vegetation and soil causes the linear relationship of narrowband and broadband albedos to vary significantly over different NDVIs. Here we take the red waveband and near-infrared (NIR) waveband for example, because these two narrowband are directly linked to the NDVI. A low NDVI represented soil land-dominated land-surface type, middle NDVI represented soil and vegetation mixed land-surface type and high NDVI represented dense vegetation.
The Figure 3a–c shows the linear relationship between the red waveband, NIR waveband and shortwave broadband albedos through the NDVI of 0.1, 0.3 and 0.9. From the Figure 3a we can find that, when the NDVI was equal to 0.1, values of the red and NIR narrowband albedo were quite close due to the characteristic of soil reflectance, so the slope of the linear relationship between these two narrowband was nearly to 1. However, as the NDVI increased, the slope appeared to increase sharply (to be 5.91 in NDVI of 0.9) because the characteristics of vegetation reflectance lead to much lower red waveband albedos and higher NIR waveband albedos. Furthermore, the same variation trend occurred between the red narrowband and shortwave broadband as showed in Figure 3b. For the NIR narrowband and shortwave broadband, it varied when the NDVI increased to 0.9. This is mainly because the NIR narrowband albedo increases when the NDVI becomes larger, meanwhile the shortwave broadband albedo decreases as the canopy absorbs more radiation energy compared with the soil. We can confirm in Figure 3a–c that: (1) the linear feature and relationships between the red narrowband, NIR narrowband and shortwave broadband albedos in each NDVI class were consistent and stable; (2) these linear feature and relationships varied sharply though different NDVI classes; and (3) these variations were limited and linked to the reflectance characteristic of soil and vegetation.
To illustrate how these variations impact the NTB conversion, we specified the red waveband albedo as x coordinate axis, the NIR waveband albedo as y coordinate axis, and the shortwave broadband albedo as z coordinate axis to transform these samples into three-dimensional linear space, as shown in Figure 3d,e. It should be noted that to retrieve the NTB coefficient of the corresponding narrowband and broadband albedos is equal to find the most suitable fitting plane to fit the points in the multidimensional linear space with lowest error.
It can be seen from Figure 3d that the distributions of the points from different NDVI classes were greatly discrete, which indicated each NDVI class should have its unique fitting plane. When using these unique fitting planes to fit the points of corresponding NDVI class, the error bars were very small. The other way to solve this problem was to build a universal fitting plane for all the points (like most previous NTB conversion researches have done). We calculated the universal fitting plane (z = 0.52x + 0.38y) of all these input samples, and we found it is quite similar to the unique fitting plane of NDVI = 0.9 (z = 0.5x + 0.37y). As a result, the fitting error bars tended to be much larger in the NDVI classes of 0.1 and 0.3 when using this universal fitting plane to fit the points (showed in the Figure 3e). It is worthy to note that the universal fitting plane is not always close to unique fitting plane of NDVI = 0.9. In fact, it is dependent on the number and proportion of the samples in different NDVI classes. If the bare soil dominated the largest proportion of all the samples, the universal fitting plane will be more close to the unique fitting plane of NDVI = 0.1. However, no matter which specific NDVI class it is close to, the fitting error of the other NDVI classes will certainly become larger.
In the previous analysis, we only considered the red and NIR waveband, which is consistent with AVHRR but not for the other remote sensors. To illustrate quantitatively the sensitivity of NDVI-to-NTB conversion, sensitivity analyses of proposed Multi-staged NDVI dependent NTB coefficient LUTs of MODIS, POLDER and AVHRR were implemented using the simulated validation data set. The basic assumption of this sensitivity analysis is that, for one sensor, if its NTB conversion is not sensitive to NDVI, the coefficient of any NDVI class will yield stable and constant fitting error through all the 10 NDVI scenes. On the contrary, if one sensor’s NTB conversion is sensitive to NDVI, the fitting error of one NDVI class will fluctuate over different NDVI ground scenes.
We used the NTB coefficient of each NDVI class to convert the broadband albedo of each NDVI scene, and the conversion performance of all the 100 situations were described in Figure 4 by the evaluating index of MRE. For MODIS, the sensitivity of NDVI-to-NTB was very low, the MRE of most situations (65%) were less than 5%, and the largest MRE was only 30% for three situations. However, for POLDER and AVHRR, the NTB coefficient of each NDVI class tended to be only suitable for its corresponding NDVI scene (showed by the pixels in the 45° diagonal), and the MRE increased obviously (from the minimum value of 10% to the maximum value of 135%) when the NDVI of scene changed. This finding indicated that the sensibility of the NDVI-to-NTB conversion was related to the placement and number of sensor waveband. The more bands one sensor has, the more effective elements will be involved in its NTB conversion procedure. As a result, the impact of NDVI will be reduced, which is consistent with Adams et al. [39].

4.3. Accuracy Evaluation Based on Simulation Data

We compared NTB conversion results of the multi-staged NDVI dependent NTB method (shown in Figure 5a–c) and the general method (shown in Figure 5d–f) using the same validation spectra data set against the sensitivity analysis experiment. The best conversion performance occurred in MODIS, the Bias and RMSE of these two methods were both very small. In the case of POLDER, the accuracy decreased compared with MODIS. RMSE of the general method increased to 0.0106, and R decreased to 0.9891. When using the multi-staged NDVI dependent NTB method, RMSE reduced by 0.004, and R improved by 0.005. With the lowest conversion accuracy, the converted albedos form general method of AVHRR had noticeable deviation, which showed obviously underestimation with the simulated albedos below 0.25 but sharply overestimation with the simulated albedos above 0.4. By using the multi-staged NDVI dependent NTB method, this deviation can be reduced effectively: the RMSE was reduced from 0.01496 to 0.0092, and the R was increased from 0.9804 to 0.9918.
Figure 6 shows the detailed comparison of conversion results of the multi-staged NDVI dependent NTB method with the general method though different NDVI classes. For MODIS, these two methods had comparable performance in most NDVI classes except when the NDVI was >0.9, in which MRE of the multi-staged NDVI dependent NTB method was 2.5% lower than that of general method. In the case of the other two sensors, the MRE of the multi-staged NDVI dependent NTB method was obviously decreased compared to the general method. This decrease mainly appeared in NDVI classes of 0.3, 0.4, 0.5, 0.7 and 1 with a value of 3% to 6% for POLDER. However, it tended to be more obvious in NDVI classes of 0.1, 0.3, 0.5 and 1 with a value of 3% to 13% for AVHRR.

4.4. Accuracy Evaluation Using Global Albedo Products and In Situ Measurements

Figure 7 shows the in situ measured broadband albedo and the converted broadband albedos of MODIS global narrowband albedo product by using the multi-staged NDVI dependent NTB method, the general method and its operational coefficient. One can notice from Figure 7a that all the three methods showed comparative agreement with ground observations with low overall MRE of ±2%. Figure 7b indicates that the MRE of the multi-staged NDVI dependent NTB method was slightly lower than that of the other two methods over NDVIs of 0.1, 0.4, 0.6, 0.8 and 1, but the result showed the opposite for the remaining five NDVIs (0.2, 0.3, 0.5, 0.7 and 0.9). Despite the small differences in conversion results, the accuracies of these three methods were very similar with the very close Bias, RMSE and R, as shown in Figure 7c–e.
For POLDER, as shown in Figure 8a, the conversion result of the multi-staged NDVI dependent NTB method was significantly better than that of the other two methods, especially for the soil-vegetation-mixed surface type (0.4 < NDVI < 0.7) and dense vegetation surface type (NDVI > 0.7), in which the converted albedos of those two methods showed obvious overestimation. Using the multi-staged NDVI dependent NTB method, the overall MRE was reduced by 7% and 15% compared with the general method and the operational coefficient of POLDER. Furthermore, it can be seen from Figure 8b, these improvements could be as high as 18% and 35% for surface types with an NDVI of 0.7. It should also noticed from Figure 8c–e that the Bias and RMSE of the multi-staged NDVI dependent NTB method decreased by 0.01 and 0.004 compared with general NTB method, and these values could be 0.023 and 0.013 against the POLDER operational NTB coefficient.

5. Discussion

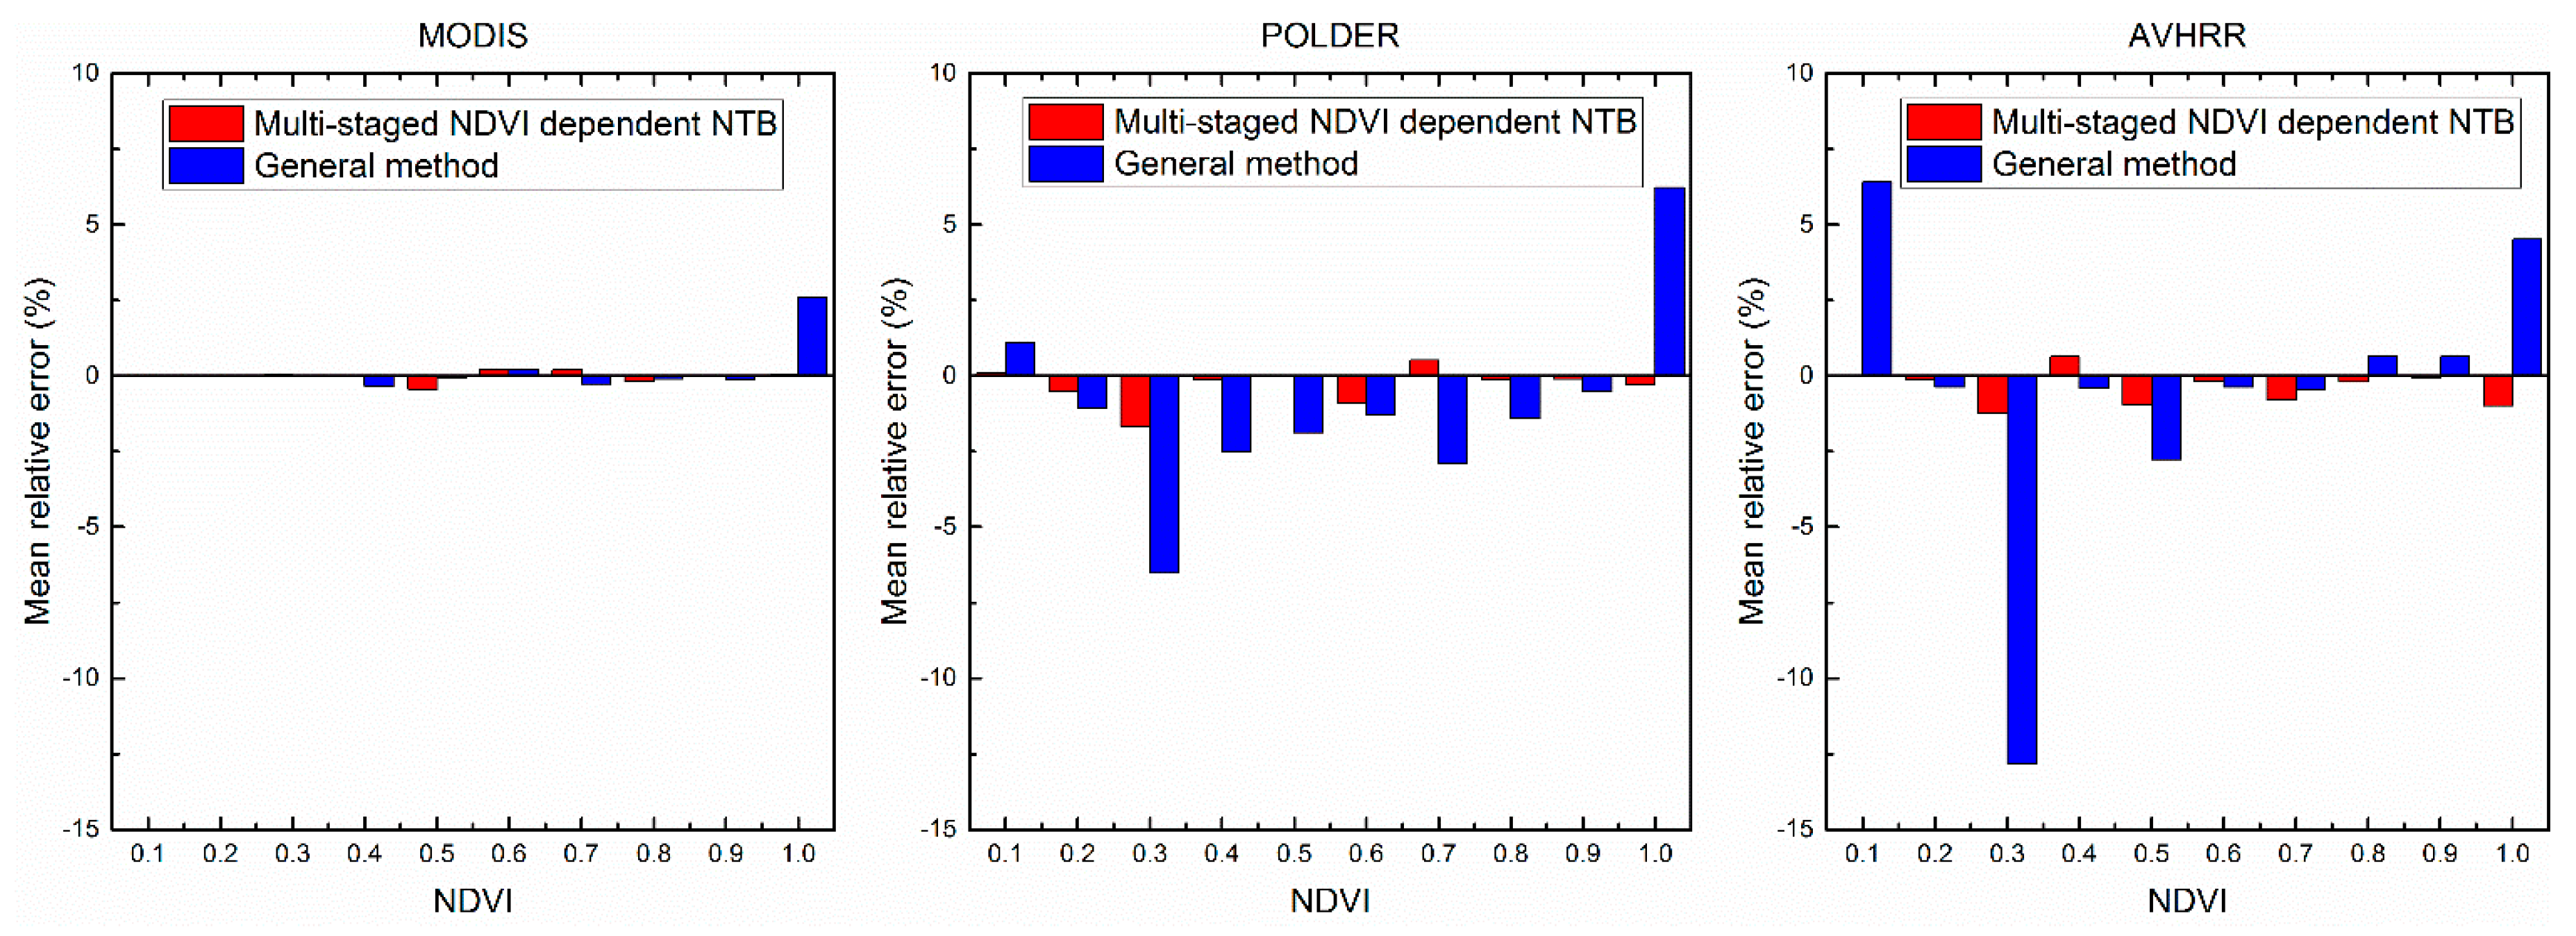
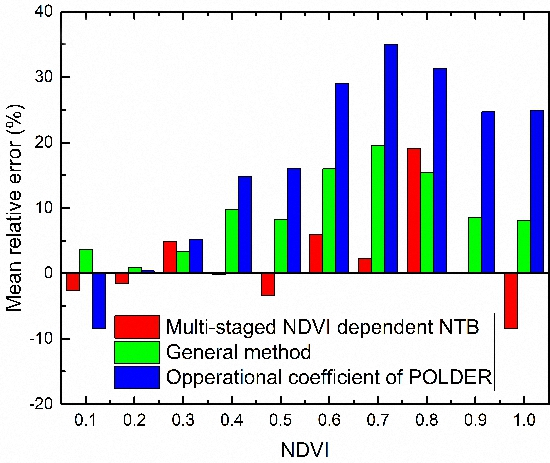
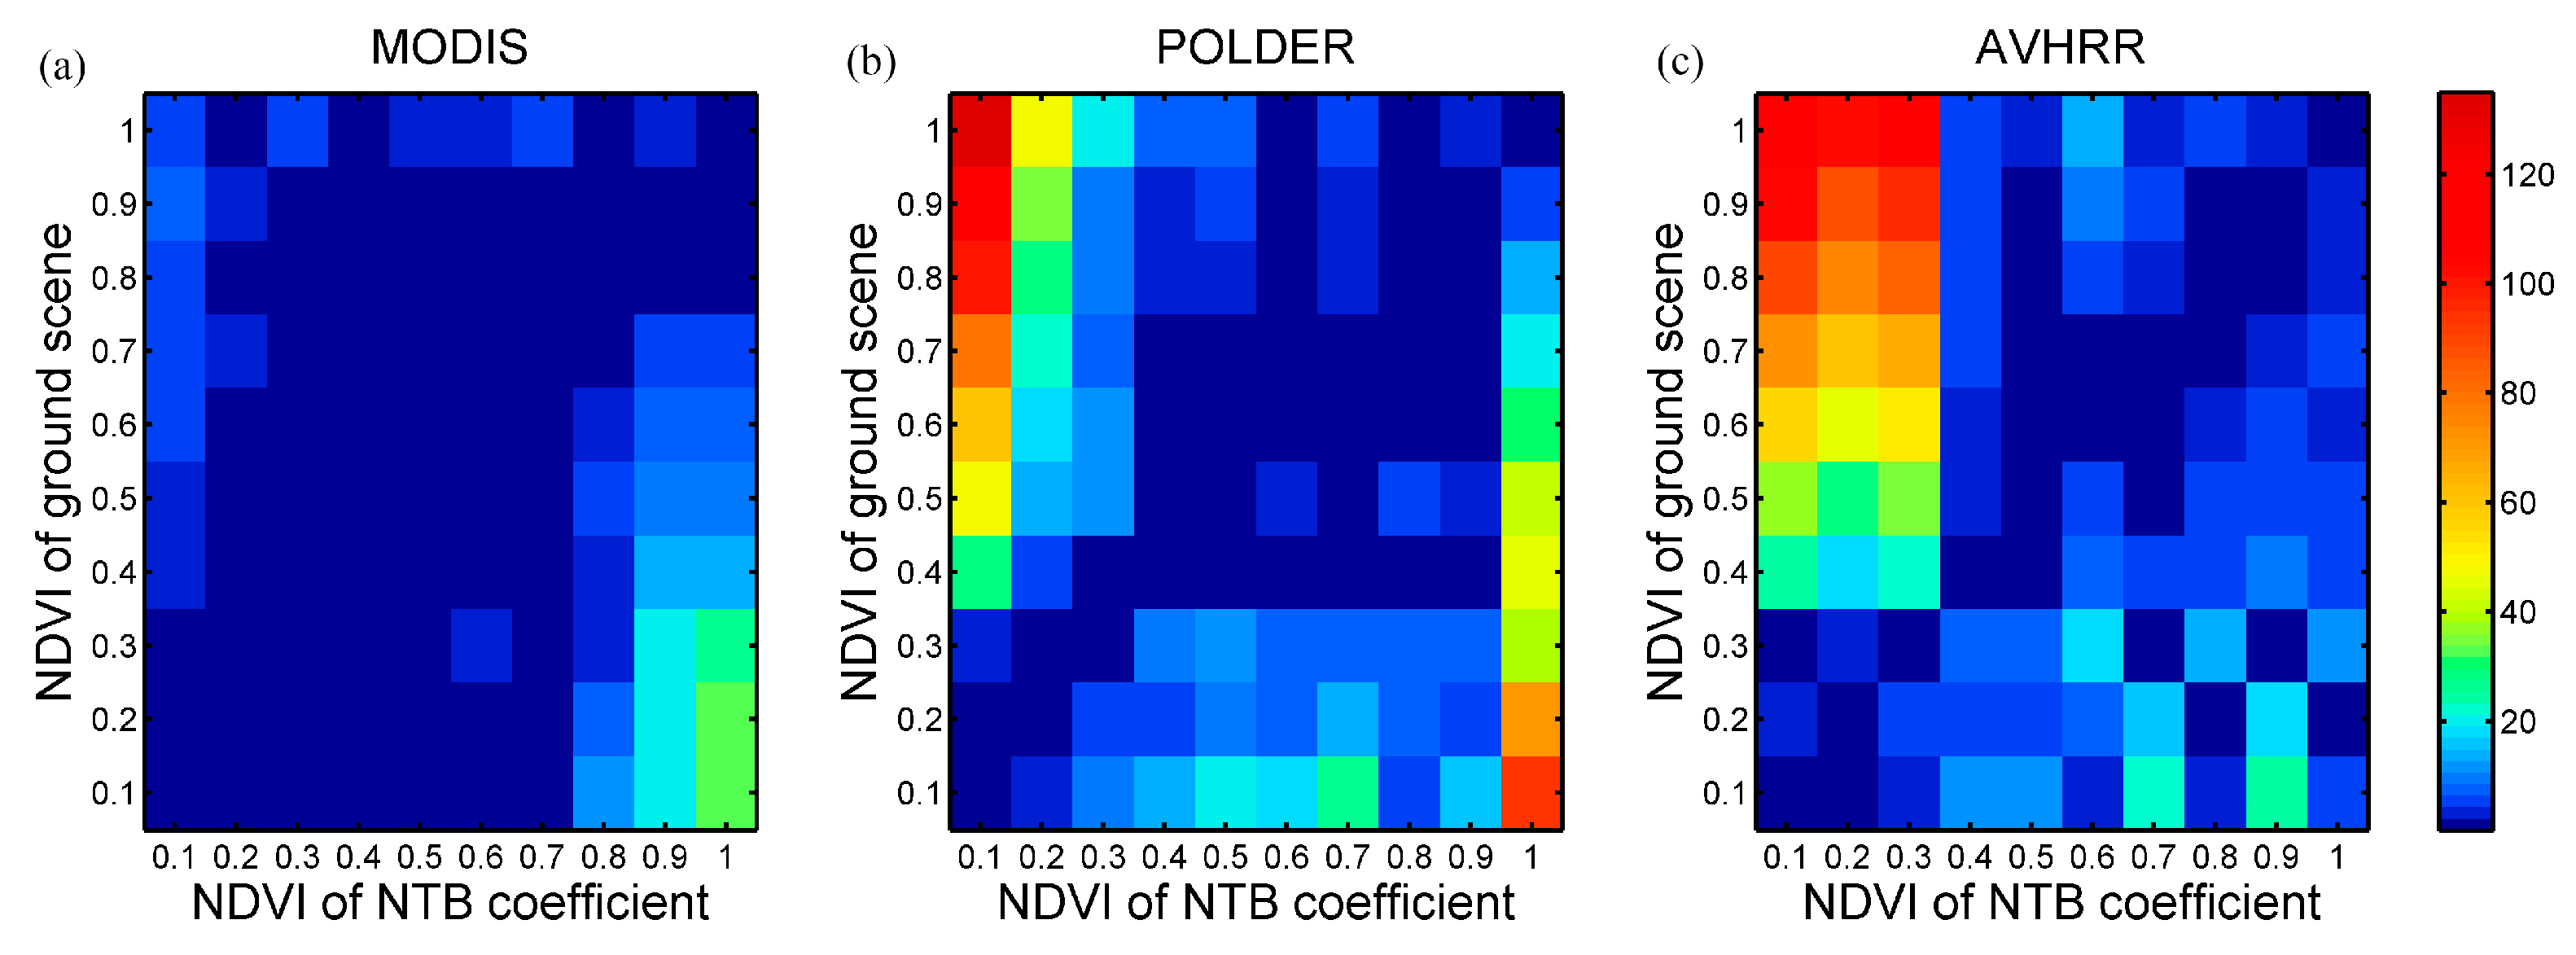
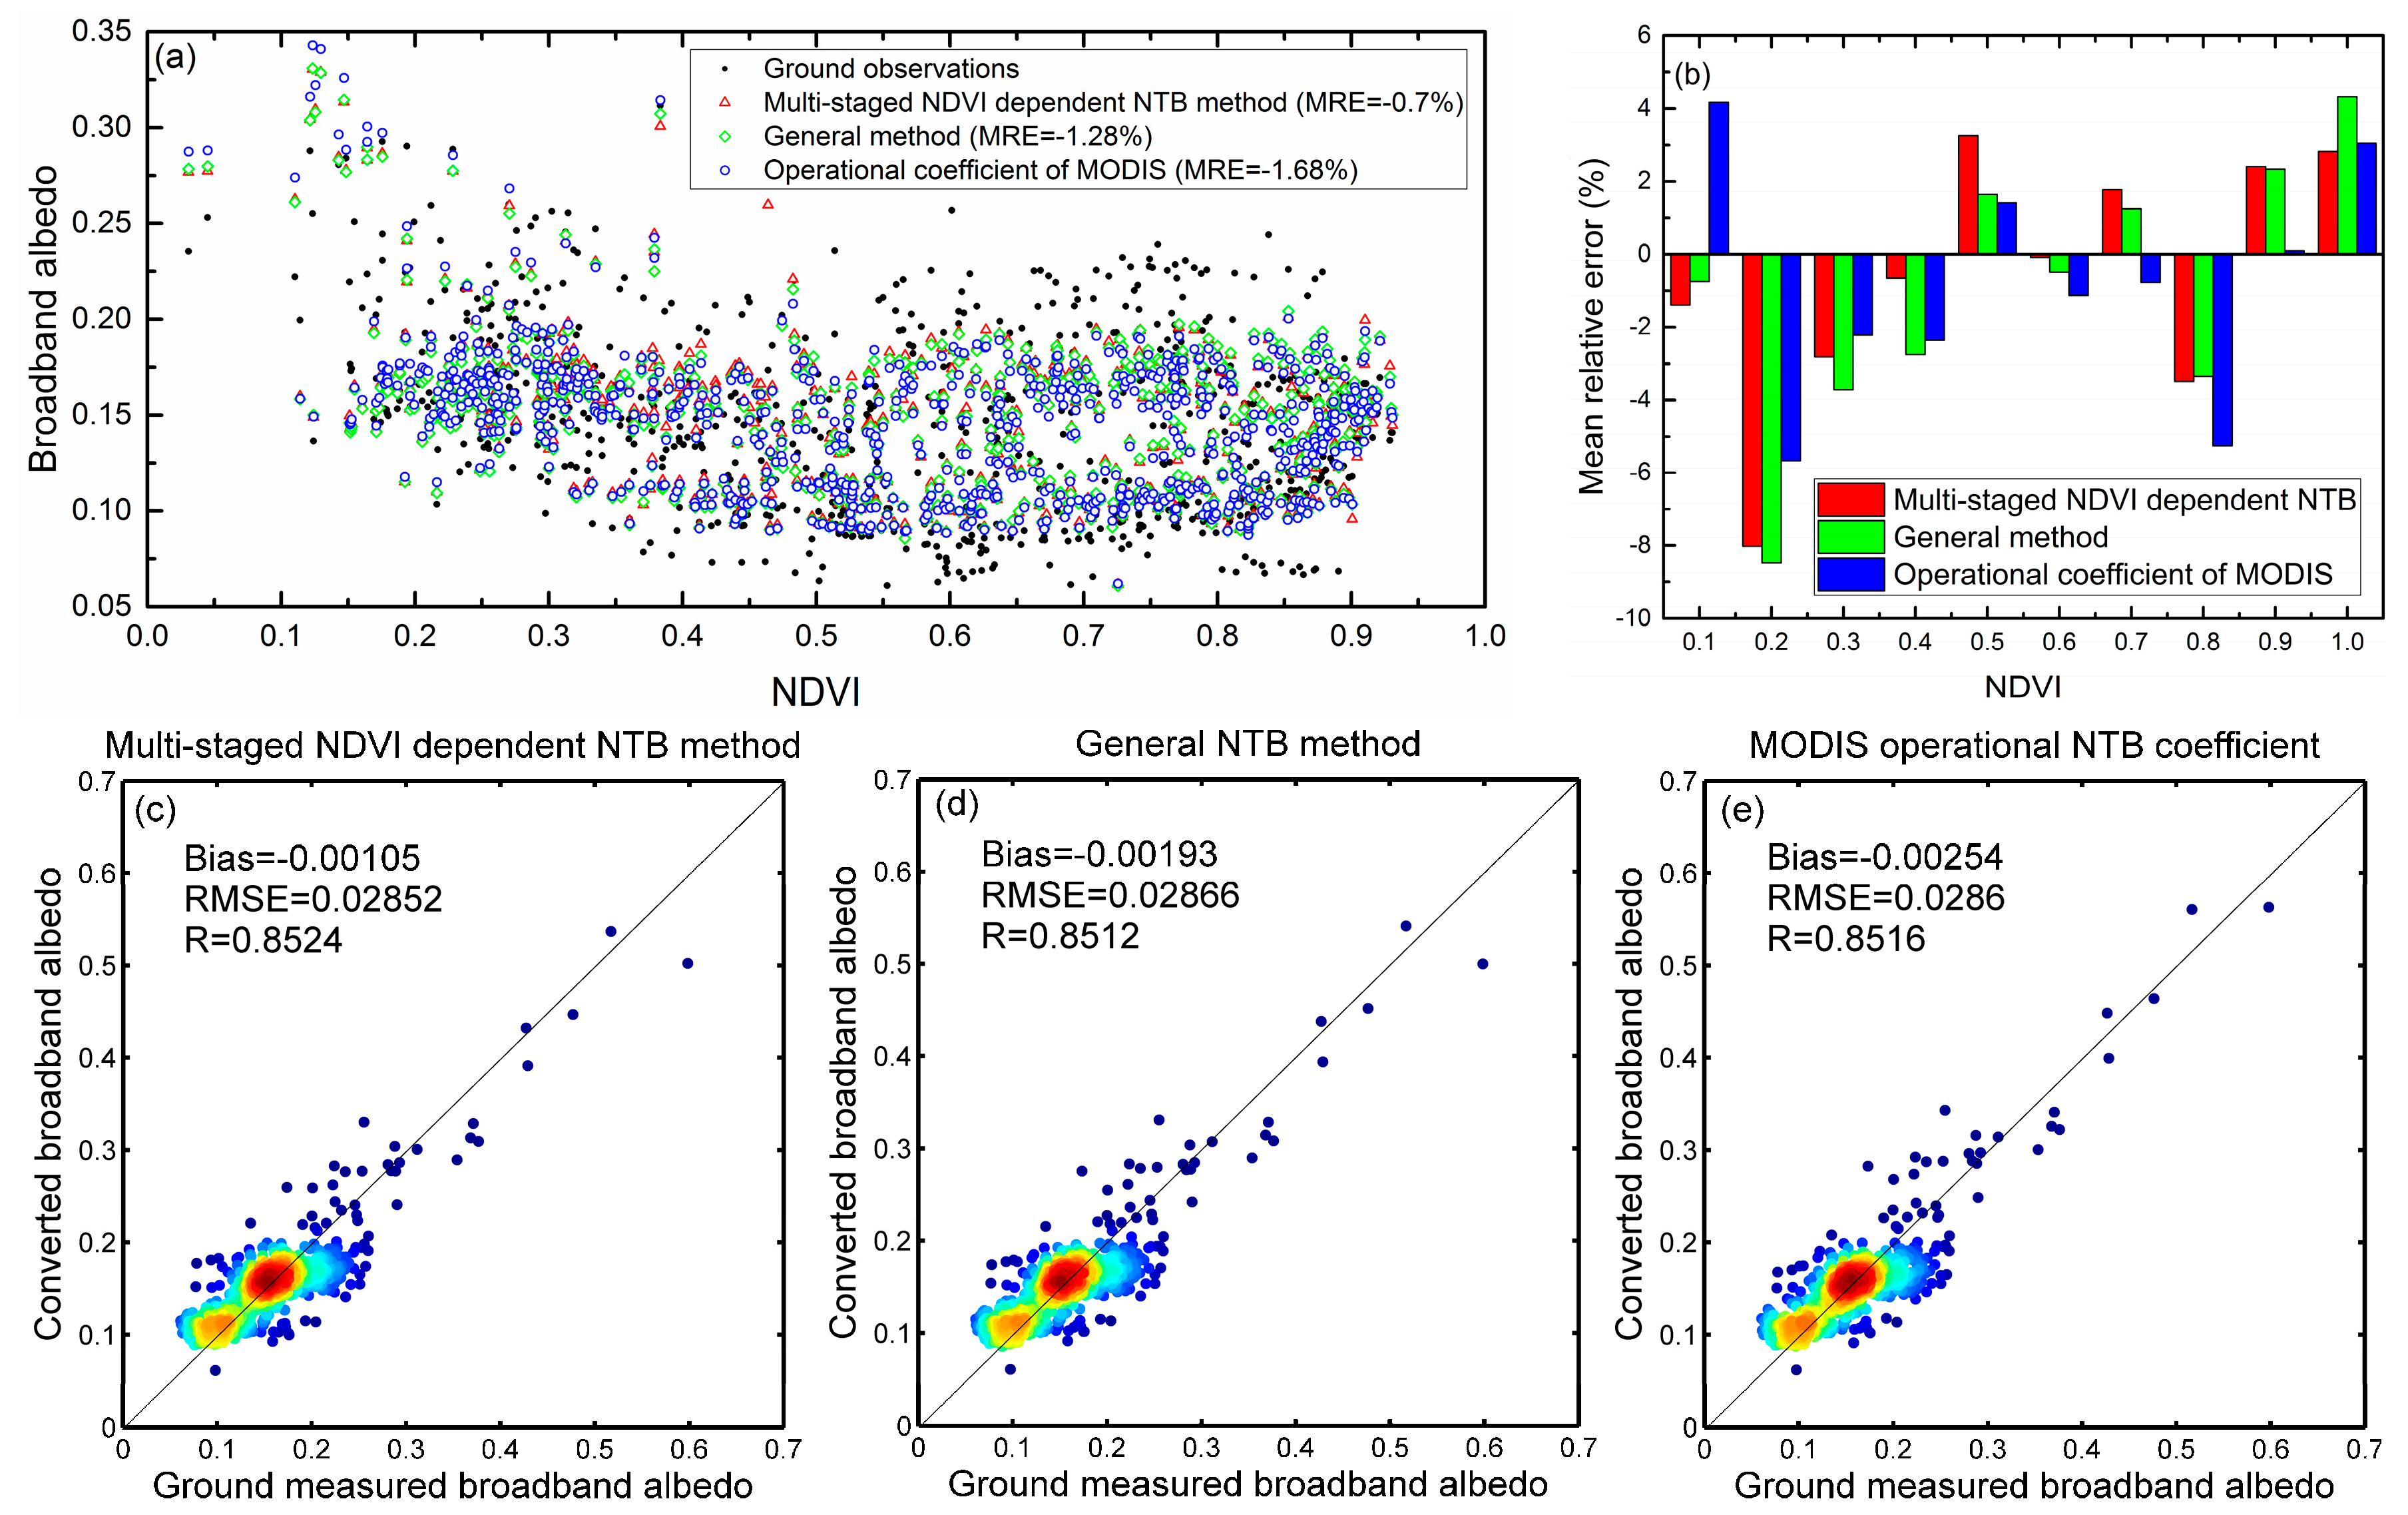
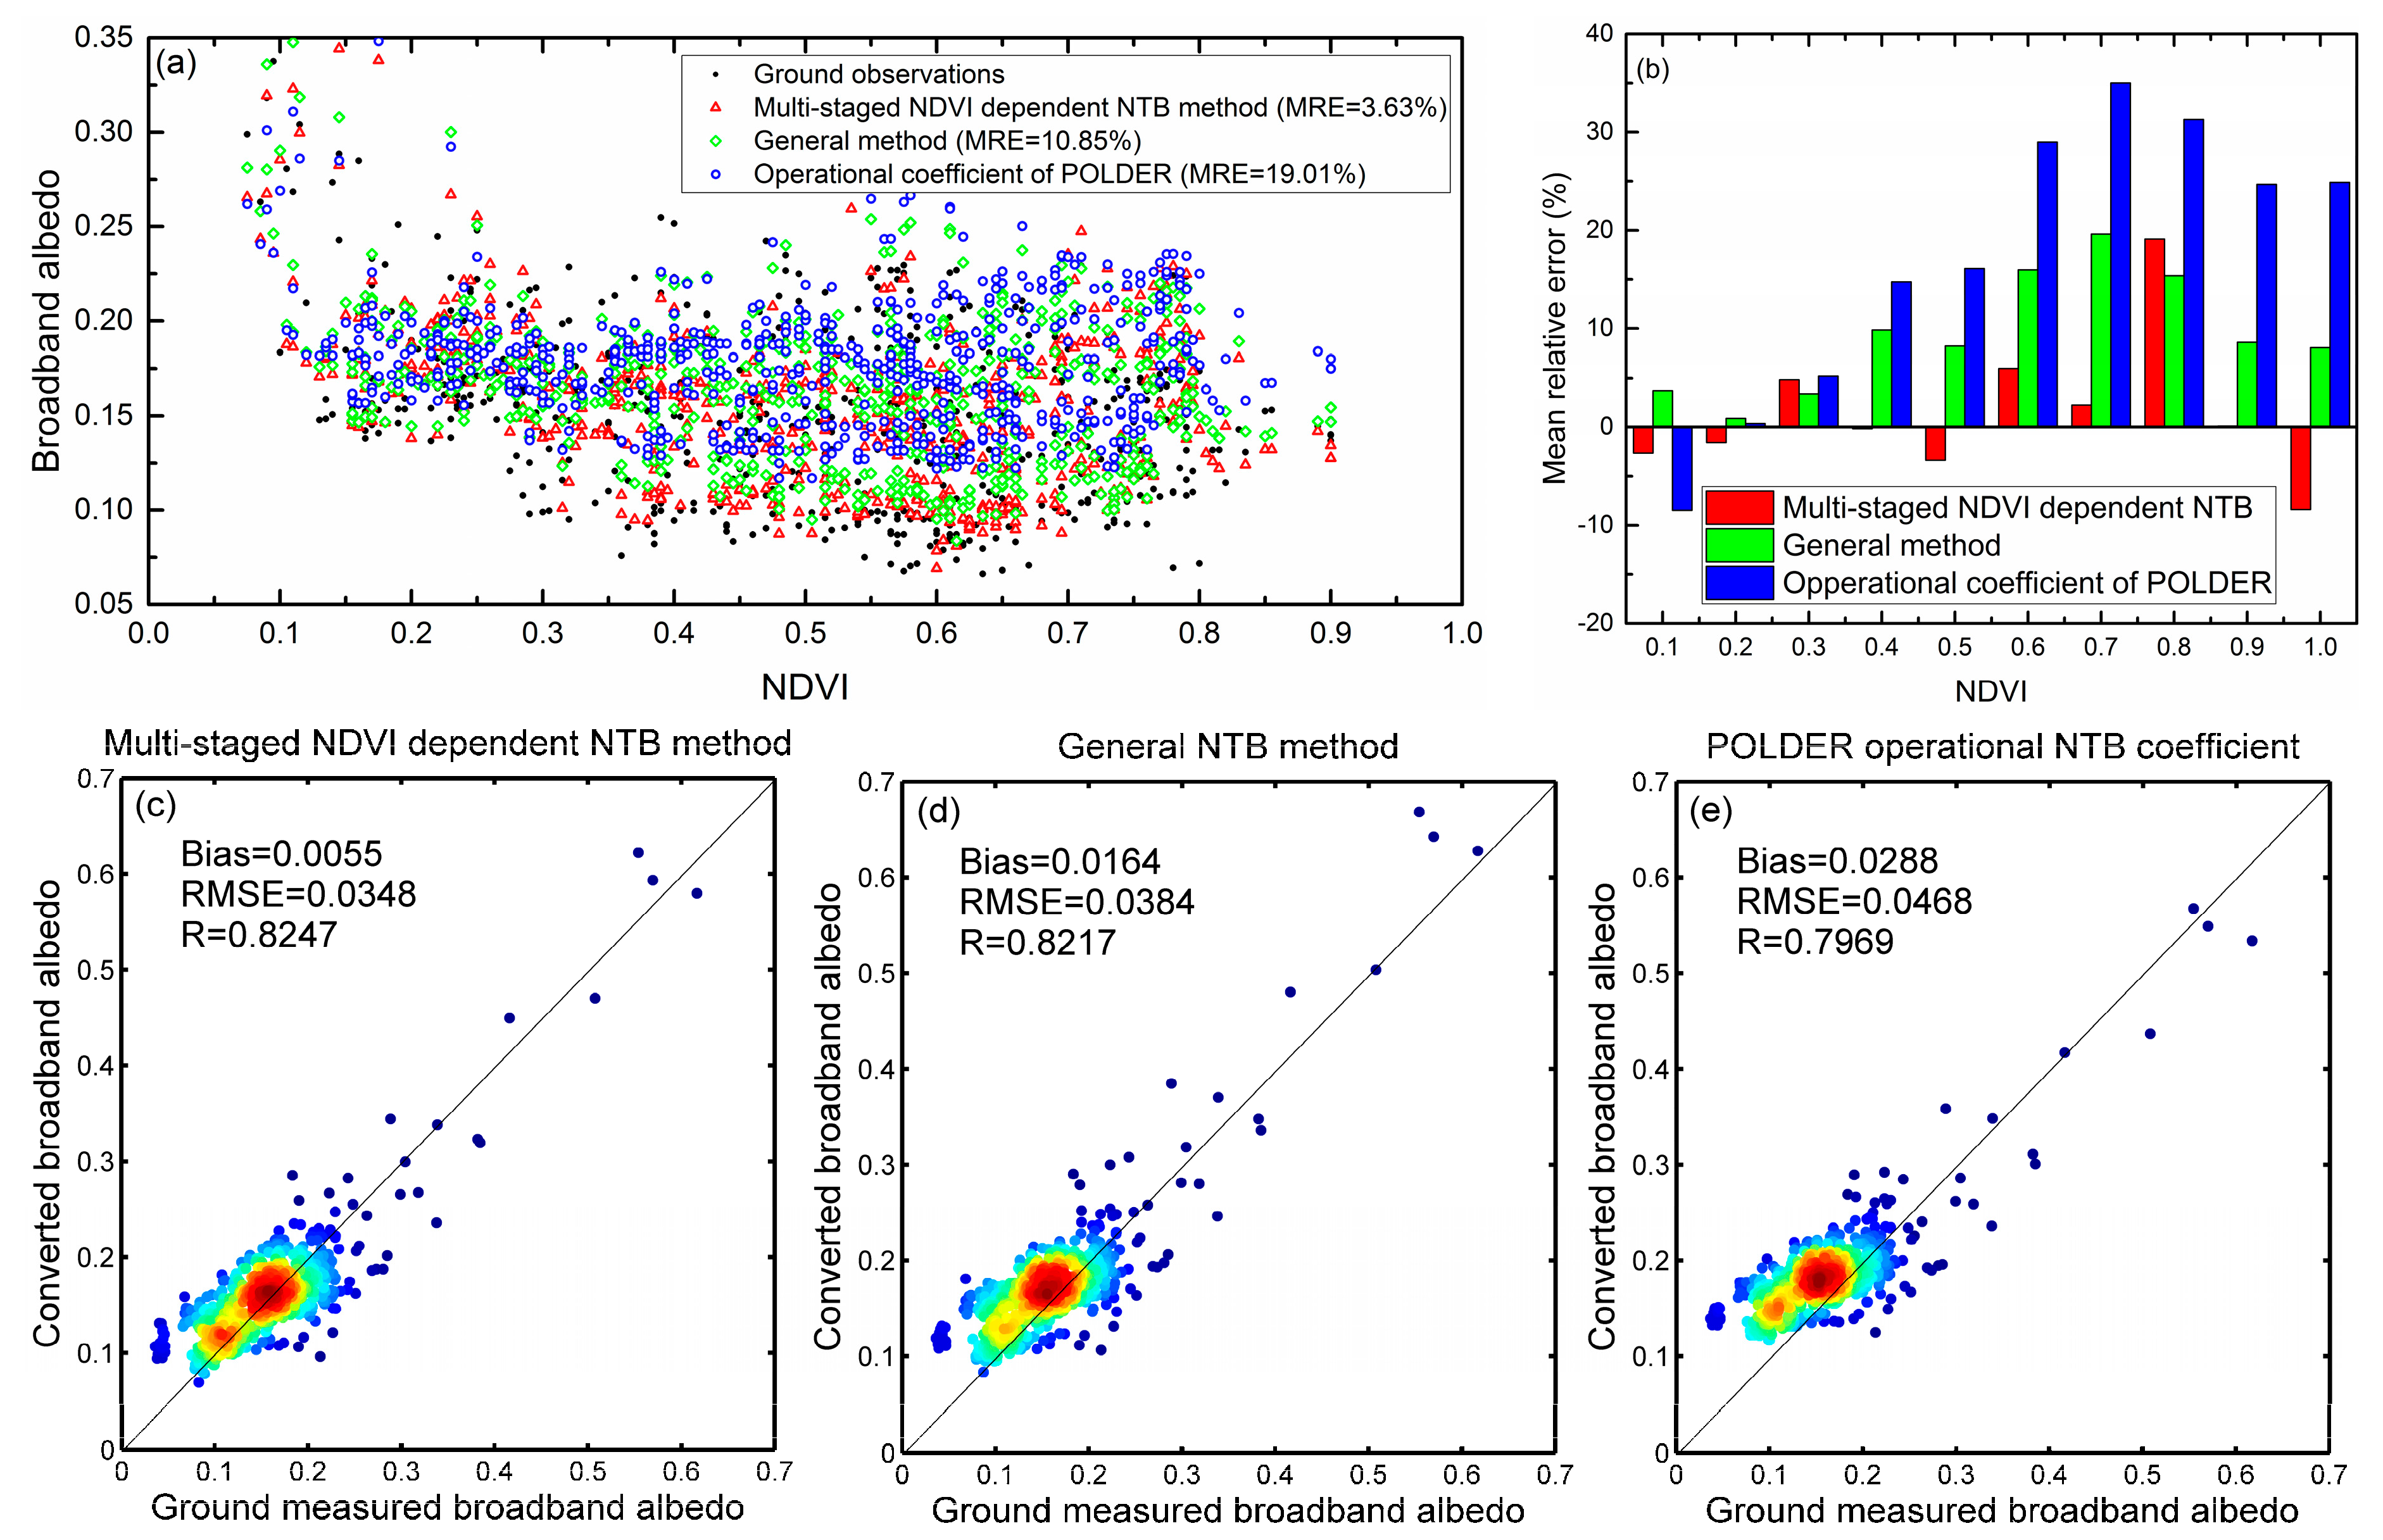
We have proposed the multi-staged NDVI dependent NTB coefficient for MODIS, POLDER and AVHRR to better address conversion performances on different surface types. The accuracy evaluation results indicated that, by using the multi-staged NDVI dependent NTB method, the conversion accuracies of the three sensors were improved in comparison with the general method and the operational coefficients of global albedo products, but the improvements are related with the placement and number of sensor waveband and the spatial resolution of global albedo product. For MODIS, the results of these two methods were not much different. On the one hand, as demonstrated in Section 4.2, the sensitivity of the NDVI to NTB conversion of MODIS is very low. On the other hand, the seven bands (wavelength spanning from 0.47 µm to 2.15 µm) and 500 m spatial resolution of MODIS are adequate to capture the surface reflectance variations of different ground scenes at the tower-based flux site observation scale. Therefore, one can confirm that the impact of NDVI-to-NTB conversion is low for sensors like MODIS and VIIRS whose waveband number is more than 7, and the universal NTB coefficients derived by general method are suggested to be adequate for these sensors. However, for POLDER and AVHRR, the improvement tends to be much more significant while their fitting accuracy of the general method appeared to decrease sharply. It is therefore indicated that five or two bands (wavelength ranging from 0.47 µm to 1 µm) are insufficient for ignoring the influence caused by the different surface reflectance characteristics in NTB conversion. The NDVI can impact the NTB conversion significantly (by 2% to 35% improvement of conversion accuracy) for the sensors like POLDER and AVHRR whose waveband number is less than 5. Thus, it is necessary to adopt the proposed multi-staged NDVI dependent NTB coefficient LUTs for POLDER and AVHRR. Furthermore, with the advance of satellite observation technologies, high resolution multispectral remote-sensing systems such as QuickBird, IKONOS, SPOT, ALOS, FORMOSAT, HJ and GF have become one of the main trends in the development of remote sensing. These sensors usually have only four wavebands. Therefore, the proposed multi-staged NDVI dependent NTB method has great potential in the application of these high resolution remote sensors.
It should be noted that this study selected NDVI to stratify the coefficient LUTs, which might be not sensitive to some surface types due to its saturation effect. However, this problem does not greatly affect the albedo’s NTB conversion because the variation of the surface spectral characteristics is small when the NDVI was greater than 0.7. Other indices, such as the LAI or reflectance combination of other wavebands, could also be used with this method, as long as they are easy to calculate and beneficial for identifying accurately the different surface types.
This paper was based on the land surface Lambertian assumption, the effect of the angular anisotropy of land surface reflectance were not addressed in detail. This is mainly because the high quality surface spectral albedo or BRDF data of multiple land cover types are difficult to obtain, and the available spectral albedo data are insufficient to derive representative NTB coefficient with reliable accuracy. Therefore, our further research will focus on finding how the BRDF affects the NTB conversion, and with the accumulation of spectral albedo based on the in situ measurement as well as the radiation transfer modelling, the comprehensive and quantitative research of the NTB conversion will be performed in the future. The other assumption used in this paper was the vacuum atmosphere condition. Although the effect of the atmosphere condition on the NTB conversion was relatively slight in the total shortwave [18], it is also a research aspect in the future.

6. Conclusions

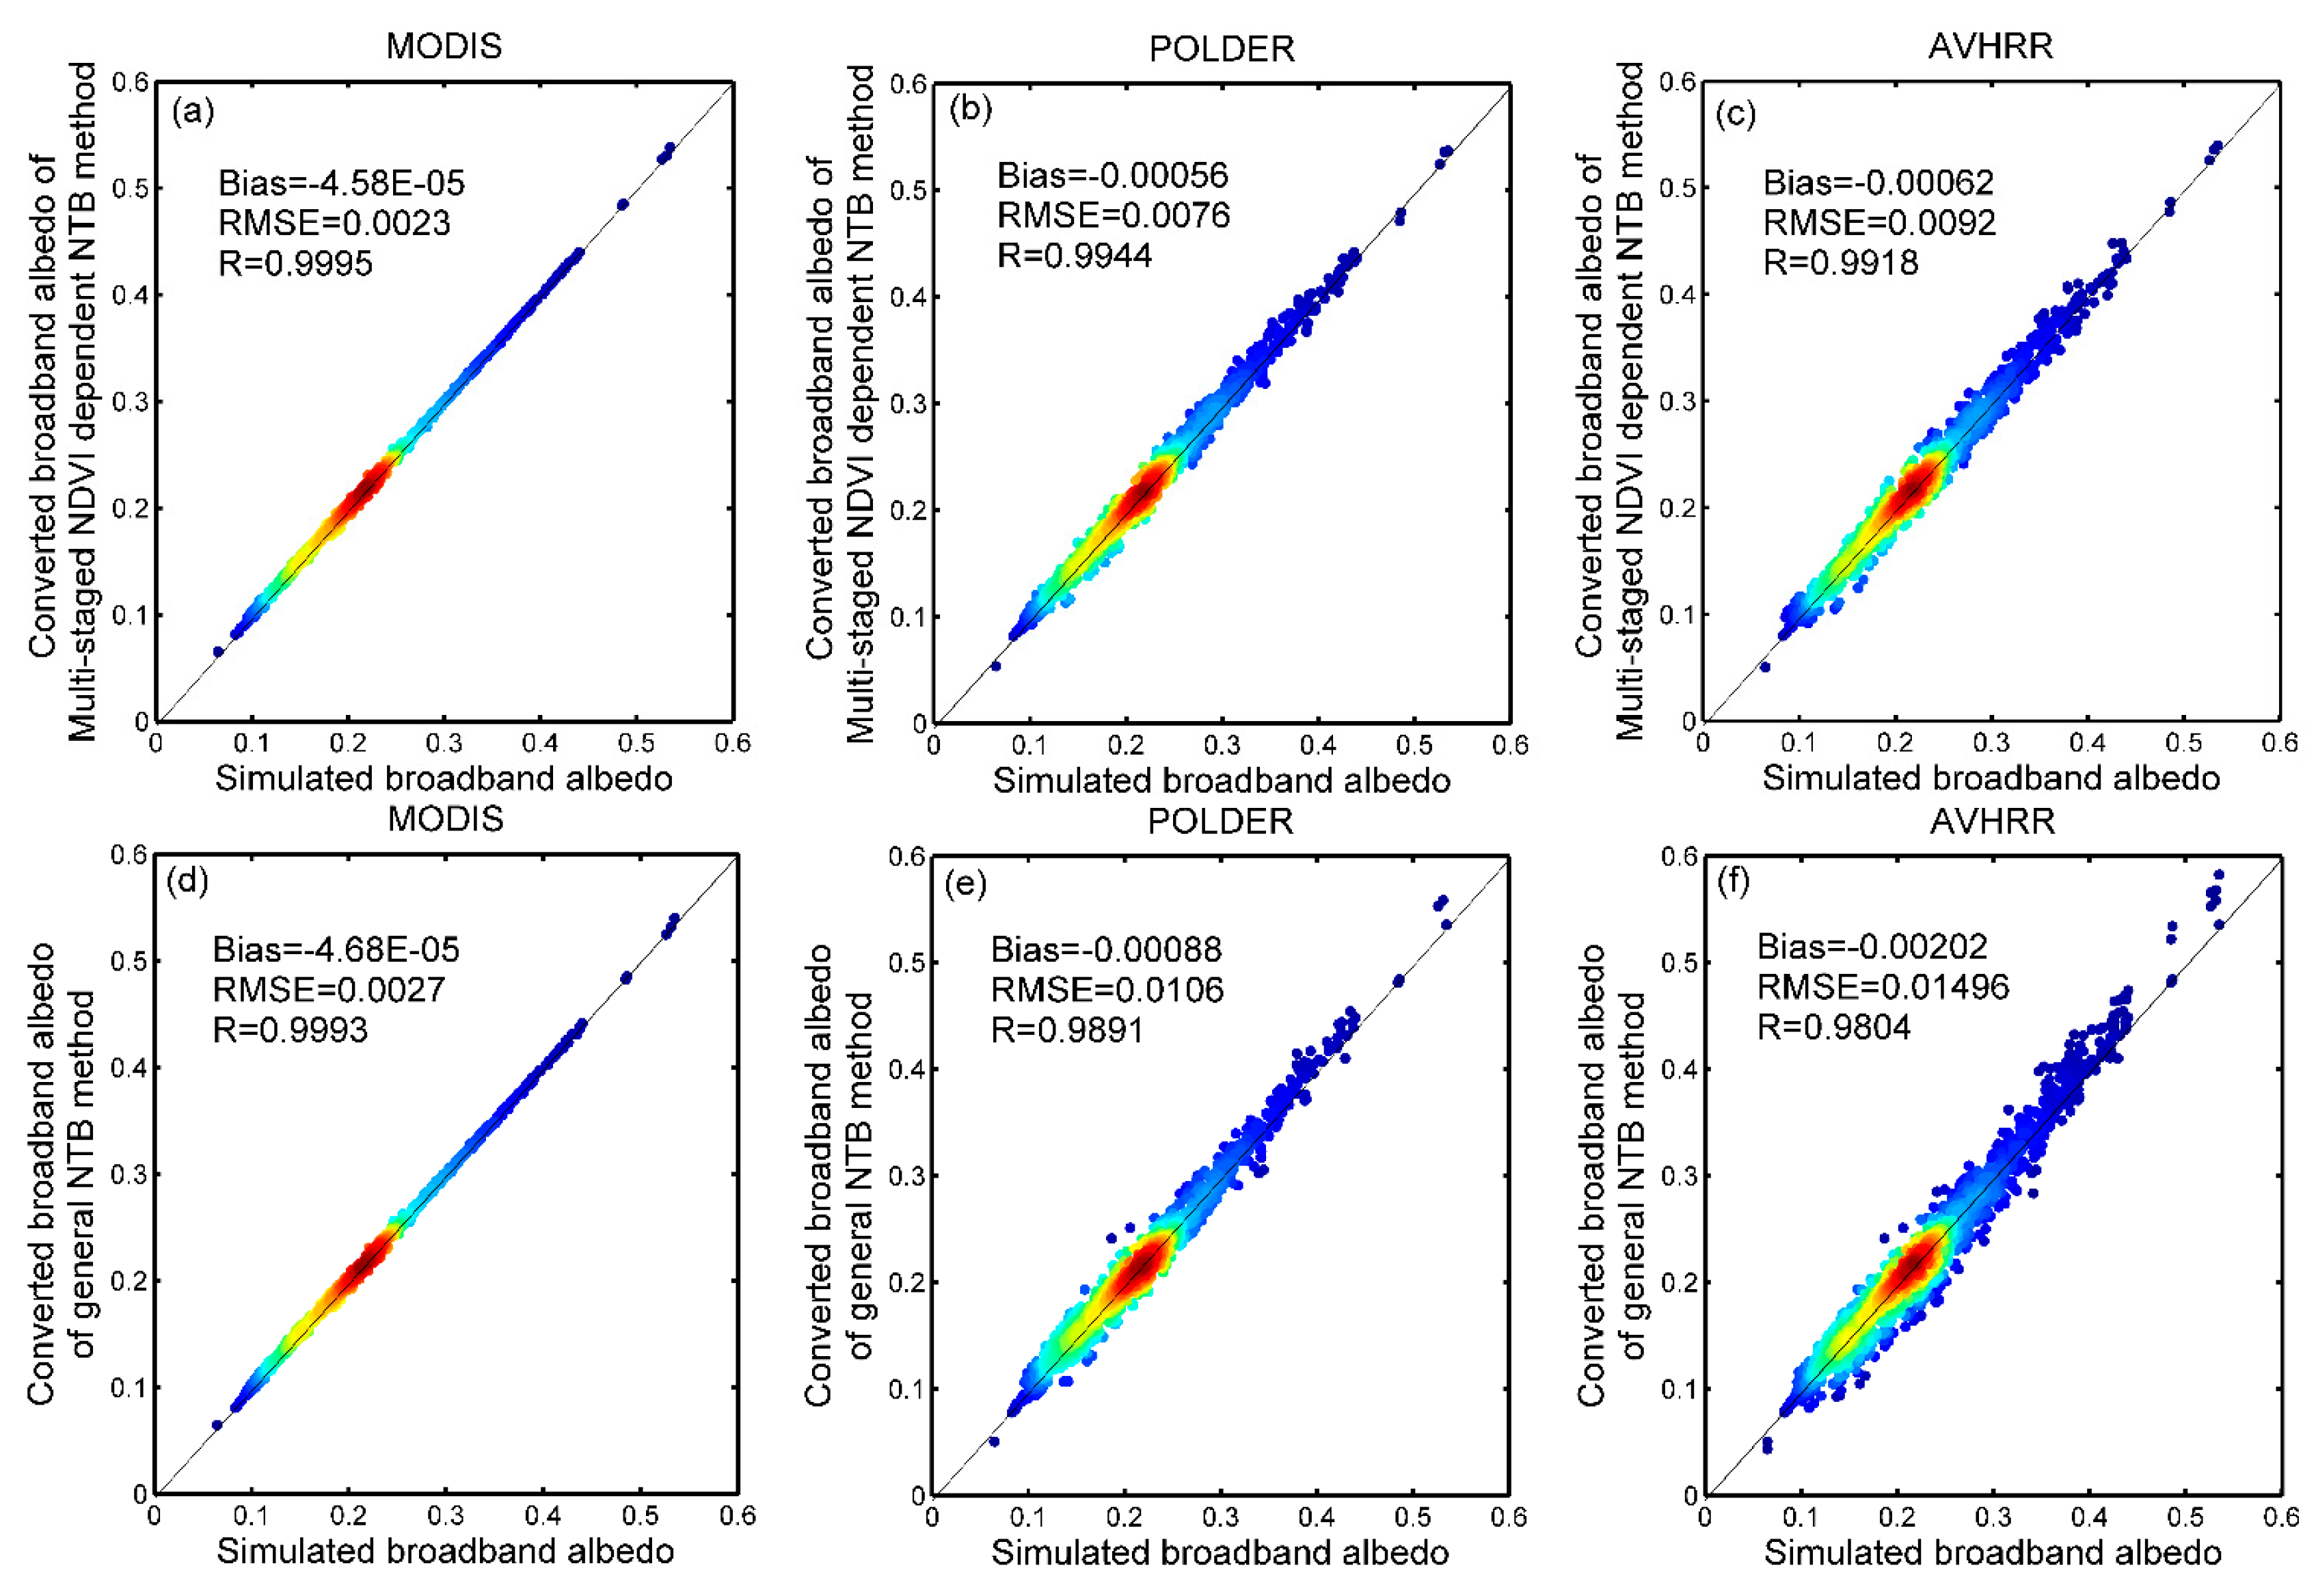
In this paper, using multiple linear regression of simulated narrowband and broadband albedos under various NDVI stratified surface types, multi-staged NDVI dependent NTB coefficient LUTs were developed for three sensors with different band numbers: MODIS, POLDER and AVHRR. The conversion accuracy of the multi-staged NDVI dependent NTB method was validated by evaluating the agreements between the converted surface broadband albedos using simulations and in situ measurements. This validation was also implemented for the conversion coefficients of general methods. Comparative analyses of the validation results of multi-staged NDVI dependent and general NTB methods revealed that the NDVI is sensitive to land-surface albedo NTB conversion, especially for sensors with fewer bands, such as POLDER and AVHRR. The conversion accuracies of these two sensors were effectively improved using the new method proposed in this paper that couples the NTB coefficients with the NDVI.
In the future, investigations should be conducted to extend the application of the multi-staged NDVI dependent NTB method to global mainstream remote-sensing sensors with four or five bands. Additionally, future studies should optimize the coefficient LUTs by taking into account the effects of the bidirectional reflectance characteristic using simultaneous in situ measurements of multi-angle reflectance spectra and broadband albedos. Finally, a comprehensive validation should be given for the albedo’s NTB coefficient.

Acknowledgments

This work was jointly supported by the Chinese Natural Science Foundation Project (No. 41671363), National Basic Research Program of China (No. 2013CB733401) and National Programs for Basic Science and Technology (No. 2014FY210800).

Author Contributions

Shi Peng was responsible for the data analysis and writing the manuscript. Jianguang Wen and Qing Xiao contributed to the main research ideas, data collection and manuscript organization. Qiang Liu contributed to the research ideas and data collection. Dongqing You, Baocheng Dou, and Yong Tang preprocessed the remote sensing data. All of the authors thoroughly reviewed and edited this paper.

Conflicts of Interest

The authors declare no conflict of interest.

References

  1. Henderson-Sellers, A.; Yang, Z.-L.; Dickinson, R.E. The project for intercomparison of land-surface parameterization schemes. Bull. Amer. Meteorol. Soc. 1993, 74, 1335–1349. [Google Scholar] [CrossRef]
  2. Wang, L.; MacKay, M.; Brown, R.; Bartlett, P.; Harvey, R.; Langlois, A. Application of satellite data for evaluating the cold climate performance of the Canadian Regional Climate model over Québec, Canada. J. Hydrometeorol. 2014, 15, 614–630. [Google Scholar] [CrossRef]
  3. Sedlar, J.; Tjernström, M.; Mauritsen, T.; Shupe, M.D.; Brooks, I.M.; Persson, P.O.G.; Birch, C.E.; Leck, C.; Sirevaag, A.; Nicolaus, M. A transitioning Arctic surface energy budget: the impacts of solar zenith angle, surface albedo and cloud radiative forcing. Clim. Dyn. 2011, 37, 1643–1660. [Google Scholar] [CrossRef] [Green Version]
  4. Baldinelli, G.; Bonafoni, S. Analysis of albedo influence on surface urban heat island by spaceborne detection and airborne thermography. In New Trends in Image Analysis and Processing--ICIAP 2015 Workshops; Springer International: Cham, Switzerland, 2015; pp. 95–102. [Google Scholar]
  5. Mattar, C.; Franch, B.; Sobrino, J.A.; Corbari, C.; Jiménez-Muñoz, J.C.; Olivera-Guerra, L.; Skokovic, D.; Sória, G.; Oltra-Carriò, R.; Julien, Y. Impacts of the broadband albedo on actual evapotranspiration estimated by S-SEBI model over an agricultural area. Remote Sens. Environ. 2014, 147, 23–42. [Google Scholar] [CrossRef]
  6. Schaepman-Strub, G.; Schaepman, M.; Painter, T.; Dangel, S.; Martonchik, J. Reflectance quantities in optical remote sensing—Definitions and case studies. Remote Sens. Environ. 2006, 103, 27–42. [Google Scholar] [CrossRef]
  7. Schaaf, C.B.; Gao, F.; Strahler, A.H.; Lucht, W.; Li, X.; Tsang, T.; Strugnell, N.C.; Zhang, X.; Jin, Y.; Muller, J.-P. First operational BRDF, albedo nadir reflectance products from MODIS. Remote Sens. Environ. 2002, 83, 135–148. [Google Scholar] [CrossRef]
  8. Leroy, M.; Lifermann, A. The POLDER instrument onboard ADEOS: Scientific expectations and first results. Adv. Space Res. 2000, 25, 947–952. [Google Scholar] [CrossRef]
  9. Csiszar, I.; Gutman, G. Mapping global land surface albedo from NOAA AVHRR. J. Geophys. Res. Atmos. 1999, 104, 6215–6228. [Google Scholar] [CrossRef]
  10. Strahler, A.H.; Lucht, W.; Schaaf, C.B.; Tsang, T.; Gao, F.; Li, X.; Muller, J.-P.; Lewis, P.; Barnsley, M.J. Modis BRDF/Albedo Product: Algorithm Theoretical Basis Document; Version 5.0; NASA EOS-MODIS: Greenbelt, MD, USA, 1999; pp. 5–37. [Google Scholar]
  11. Maignan, F.; Bréon, F.M.; Lacaze, R. Bidirectional reflectance of Earth targets: Evaluation of analytical models using a large set of spaceborne measurements with emphasis on the Hot Spot. Remote Sens. Environ. 2004, 90, 210–220. [Google Scholar] [CrossRef]
  12. Qu, Y.; Liu, Q.; Liang, S.; Wang, L.; Liu, N.; Liu, S. Direct-estimation algorithm for mapping daily land-surface broadband albedo from MODIS data. IEEE Trans. Geosci. Remote Sens. 2014, 52, 907–919. [Google Scholar] [CrossRef]
  13. Qu, Y.; Liang, S.; Liu, Q.; He, T.; Liu, S.; Li, X. Mapping surface broadband albedo from satellite observations: a review of literatures on algorithms and products. Remote Sens. 2015, 7, 990–1020. [Google Scholar] [CrossRef]
  14. Brest, C.L.; Goward, S.N. Deriving surface albedo measurements from narrow band satellite data. Int. J. Remote Sens. 1987, 8, 351–367. [Google Scholar] [CrossRef]
  15. Hucek, R.; Jacobowitz, H. Impact of scene dependence on AVHRR albedo models. J. Atmos. Ocean. Technol. 1995, 12, 697–711. [Google Scholar] [CrossRef]
  16. Valiente, J.; Nunez, M.; Lopez-Baeza, E.; Moreno, J. Narrow-band to broad-band conversion for Meteosat-visiible channel and broad-band albedo using both AVHRR-1 and-2 channels. Remote Sens. 1995, 16, 1147–1166. [Google Scholar] [CrossRef]
  17. Russell, M.J.; Nunez, M.; Chladil, M.A.; Valiente, J.A.; Lopez-Baeza, E. Conversion of nadir, narrowband reflectance in red and near-infrared channels to hemispherical surface albedo. Remote Sens. Environ. 1997, 61, 16–23. [Google Scholar] [CrossRef]
  18. Liang, S. Narrowband to broadband conversions of land surface albedo I: Algorithms. Remote Sens. Environ. 2001, 76, 213–238. [Google Scholar] [CrossRef]
  19. Liang, S.; Strahler, A.H.; Walthall, C. Retrieval of land surface albedo from satellite observations: A simulation study. J. Appl. Meteorol. 1999, 38, 712–725. [Google Scholar] [CrossRef]
  20. Buriez, J.C.; Parol, F.; Poussi, Z.; Viollier, M. An improved derivation of the top-of-atmosphere albedo from POLDER/ADEOS-2: 2. Broadband albedo. J. Geophys. Res. Atmos. 2007, 112, 216–229. [Google Scholar] [CrossRef]
  21. Gao, F.; Schaaf, C.; Jin, Y.-F.; Lucht, W.; Strahler, A. Deriving albedo from coupled MERIS and MODIS surface products. In Proceedings of the MERIS Users Workshop, ESA, Frascati, Italy, 10–14 November 2004; Available online: http://envisat.esa.int/workshops/meris03/participants/88/paper_52_gao.pdfURL (accessed on 13 June 2016).
  22. Van Leeuwen, W.J.; Roujean, J.-L. Land surface albedo from the synergistic use of polar (EPS) and geo-stationary (MSG) observing systems: An assessment of physical uncertainties. Remote Sens. Environ. 2002, 81, 273–289. [Google Scholar] [CrossRef]
  23. Liang, S.; Yu, Y.; Defelice, T. VIIRS narrowband to broadband land surface albedo conversion: Formula and validation. Int. J. Remote Sens. 2005, 26, 1019–1025. [Google Scholar] [CrossRef]
  24. Liang, S.; Shuey, C.J.; Russ, A.L.; Fang, H.; Chen, M.; Walthall, C.L.; Daughtry, C.S.; Hunt, R. Narrowband to broadband conversions of land surface albedo: II. Validation. Remote Sens. Environ. 2003, 84, 25–41. [Google Scholar] [CrossRef]
  25. Wydick, J.E.; Davis, P.A.; Gruber, A. Estimation of Broadband Planetary Albedo from Operational Narrowband Satellite Measurements; NOAA Technical Report NESDIS 27; U.S. Department of Commerce: Washington, DC, USA, 1987; p. 32. Available online: https://docs.lib.noaa.gov/rescue/TIROS/QC8795U47no27.pdf (accessed on 15 May 2016).
  26. Stroeve, J.; Box, J.E.; Gao, F.; Liang, S.; Nolin, A.; Schaaf, C. Accuracy assessment of the MODIS 16-day albedo product for snow: comparisons with Greenland in situ measurements. Remote Sens. Environ. 2005, 94, 46–60. [Google Scholar] [CrossRef]
  27. Liu, N.; Liu, Q.; Wang, L.; Liang, S.; Wen, J.; Qu, Y.; Liu, S. Mapping spatially-temporally continuous shortwave albedo for global land surface from MODIS data. Hydrol. Earth Syst. Sci. Discuss. 2012, 9, 1–22. [Google Scholar] [CrossRef]
  28. Vermote, E.; Justice, C.O.; Breon, F.M. Towards a generalized approach for correction of the BRDF effect in MODIS directional reflectances. IEEE Trans. Geosci. Remote Sens. 2009, 47, 898–908. [Google Scholar] [CrossRef]
  29. Franch, B.; Vermote, E.F.; Sobrino, J.A.; Julien, Y. Retrieval of surface albedo on a daily basis: Application to MODIS Data. IEEE Trans. Geosci. Remote Sens. 2014, 52, 7549–7558. [Google Scholar] [CrossRef]
  30. Claverie, M.; Vermote, E.; Franch, B.; He, T.; Hagolle, O.; Kadiri, M.; Masek, J. Evaluation of medium spatial resolution BRDF-adjustment techniques using multi-angular SPOT4 (Take5) acquisitions. Remote Sens. 2015, 7, 12057–12075. [Google Scholar] [CrossRef]
  31. Rouse, J., Jr.; Haas, R.; Schell, J.; Deering, D. Monitoring vegetation systems in the Great Plains with ERTS. NASA Spec. Publ. 1974, 351, 309. [Google Scholar]
  32. Song, J.; Gao, W. An improved method to derive surface albedo from narrowband AVHRR satellite data: narrowband to broadband conversion. J. Appl. Meteorol. 1999, 38, 239–249. [Google Scholar] [CrossRef]
  33. Garrity, D.; Bindraban, P. A Globally Distributed Soil Spectral Library Visible near Infrared Diffuse Reflectance Spectra; ICRAF (World Agroforestry Centre)/ISRIC (World Soil Information) Spectral Library: Nairobi, Kenya, 2004; Available online: http://www.worldagroforestry.org/sites/default/files/Description_ICRAF-ISRIC%20Soil%20VNIR%20Spectral%20Library.pdf (accessed on 20 March 2016).
  34. Zhang, Y.; Xiao, Q.; Wen, J.; You, D.; Dou, B.; Tang, Y.; Peng, S. Review on spectral libraries progress and application. Chin. J. Remote Sens. 2017. (In Chinese) [Google Scholar] [CrossRef]
  35. Oak Ridge National Laboratory Distributed Active Archive Center (ORNL DAAC). FLUXNET; ORNL DAAC: Oak Ridge, TN, USA, 2015. Available online: http://fluxnet.ornl.gov (accessed on 5 May 2015).
  36. Román, M.O.; Schaaf, C.B.; Woodcock, C.E.; Strahler, A.H.; Yang, X.; Braswell, R.H.; Curtis, P.S.; Davis, K.J.; Dragoni, D.; Goulden, M.L. The MODIS (Collection V005) BRDF/albedo product: Assessment of spatial representativeness over forested landscapes. Remote Sens. Environ. 2009, 113, 2476–2498. [Google Scholar] [CrossRef]
  37. Cescatti, A.; Marcolla, B.; Vannan, S.K.S.; Pan, J.Y.; Román, M.O.; Yang, X.; Ciais, P.; Cook, R.B.; Law, B.E.; Matteucci, G. Intercomparison of MODIS albedo retrievals and in situ measurements across the global FLUXNET network. Remote Sens. Environ. 2012, 121, 323–334. [Google Scholar] [CrossRef]
  38. Remer, L.A.; Kaufman, Y.J.; Tanré, D.; Mattoo, S.; Chu, D.A.; Martins, J.V.; Li, R.R.; Ichoku, C.; Levy, R.C.; Kleidman, R.G. The MODIS aerosol algorithm, products, and validation. J. Atmos. Sci. 2005, 62, 947–973. [Google Scholar] [CrossRef]
  39. Adams, J.; Gobron, N.; Mio, C. A study of land surface albedo conversion formulas using three-dimensional canopy radiative transfer modeling. IEEE Geosci. Remote Sens. Lett. 2016, 13, 1039–1043. [Google Scholar] [CrossRef]
Figure 1. Spectral response functions of MODIS, POLDER and AVHRR: (a) in visible and shortwave near infrared; and (b) in shortwave infrared.
Remotesensing 09 00093 g001
Figure 2. Examples of the reflectance spectra used in this study: (a) vegetation spectra; and (b) soil spectra.
Remotesensing 09 00093 g002
Figure 3. (a) The linear relationship between red and NIR narrowband albedos; (b) the linear relationship between red narrowband albedo and shortwave broadband albedo; (c) the linear relationship of NIR narrowband albedo and shortwave broadband albedo; (d) the fitting error bar of unique fitting planes of NDVI classes of 0.1, 0.3 and 0.9; and (e) the fitting error bar of universal fitting plane.
Remotesensing 09 00093 g003
Figure 4. Sensitivity analyses of the NDVI-to-NTB conversion for MODIS, POLDER and AVHRR: (ac) fitting errors of NTB coefficients of 10 NDVI classes in 10 NDVI-dependent ground scenes.
Remotesensing 09 00093 g004
Figure 5. Comparison between overall simulation conversion results of the multi-staged NDVI dependent NTB method and the general method: (ac) the results of MODIS, POLDER and AVHRR, respectively, using the multi-staged NDVI dependent NTB method; and (df) the results of MODIS, POLDER and AVHRR, respectively, using the general method.
Remotesensing 09 00093 g005
Figure 6. Comparison between the distribution of mean relative error on the NDVI of the general method and that of the multi-staged NDVI dependent NTB method for MODIS, POLDER and AVHRR.
Remotesensing 09 00093 g006
Figure 7. (a) Comparison of the conversion results of MODIS using the multi-staged NDVI dependent NTB method, the general method and its operational coefficient with the in situ measurements; (b) comparison of the distributions of MRE on the NDVI of these three methods for MODIS; and (ce) scatter plots of the conversion results of the multi-staged NDVI dependent NTB method, general NTB method and MODIS operational NTB coefficient, respectively.
Remotesensing 09 00093 g007
Figure 8. (a) Comparison of the conversion results of POLDER using the multi-staged NDVI dependent NTB method, the general method and its operational coefficient with the in situ measurements; (b) comparison of the distributions of MRE on the NDVI of these three methods for POLDER; and (ce) scatter plots of the conversion results of the multi-staged NDVI dependent NTB method, general NTB method and POLDER operational NTB coefficient, respectively.
Remotesensing 09 00093 g008
Table 1. Wavelength ranges Moderate Resolution Imaging Spectroradiometer (MODIS), Polarization and Directionality of Earth’s Reflectance (POLDER) and Advanced Very High Resolution Radiometer (AVHRR).
SensorWavelength Range (μm)
Band 1Band 2Band 3Band 4Band 5Band 6Band 7
MODIS0.62–0.670.84–0.870.46–0.480.54–0.561.23–1.251.63–1.652.11–2.15
POLDER0.47–0.510.54–0.590.64–0.700.72–0.800.82–0.90--
AVHRR-140.57–0.710.72–1.01-----
Table 2. Tower-based albedos acquired from the net-wide FLUXNET database.
Site IDCountryEcosystem TypeLatitudeLongitudeTime Period
AU TUMAustraliaEBF−35.66148.152009
AU WACAustraliaEBF−37.43145.192006
CA SF3CanadaENF54.09−106.012006
DE GEBGermanyCRO51.1010.912006
DE HAIGermanyDBF51.0810.452006
DE KLIGermanyCRO50.8913.522006
DE THAGermanyENF50.9613.572006
DE WETGermanyENF50.4511.462006
NL CA1NetherlandsGRA51.974.932006
NL LOONetherlandsENF52.175.742006
US ARMUSACRO36.61−97.492010
US AUDUSAGRA31.59−110.512010
US BKGUSAGRA44.35−96.842009
US BO1USACRO40.01−88.292006
US FMFUSAENF35.14−111.732010
US FPEUSAGRA48.31−105.102006
US FUFUSAENF35.09−111.762010
US IB1USACRO41.86−88.222009
US IB2USAGRA41.84−88.242009
US IVOUSAOSH68.49−155.752006
US MMSUSADBF39.32−86.412010
US MOZUSADBF38.74−92.202010
US NE1USACRO41.17−96.482009
US NE3USACRO41.18−96.442009
US SRMUSAWSA31.82−110.872010
US WCRUSADBF45.81−90.082006
Table 3. Coefficient look up table (LUT) for converting MODIS’ surface-inherent narrowband albedos to broadband albedos.
NDVICBand 1CBand 2CBand 3CBand 4CBand 5CBand 6CBand 7
[0, 0.1]0.22360.19390.22630.03770.16670.00250.0862
[0.1, 0.2]0.19930.21770.23650.03050.16070.00360.0884
[0.2, 0.3]0.17610.23690.23950.03580.14670.01480.0853
[0.3, 0.4]0.13140.22900.20600.12480.11070.08700.0498
[0.4, 0.5]0.15680.24110.09600.14210.10380.09970.0358
[0.5, 0.6]0.18010.22150.12710.14800.13490.06540.0301
[0.6, 0.7]0.18470.23310.24400.03880.15290.02530.0564
[0.7, 0.8]0.41570.18890.1705−0.00790.2184−0.03920.0501
[0.8, 0.9]0.00100.16440.16750.19640.2938−0.10490.0545
[0.9, 1]−0.39880.18660.64570.40860.14950.0898−0.0517
Table 4. Coefficient LUT for converting POLDER’s surface-inherent narrowband albedos to broadband albedos.
NDVICBand 1CBnad 2CBand 3CBand 4CBand 5
[0, 0.1]0.2704−0.0205−0.26810.46630.4529
[0.1, 0.2]0.0854−0.08020.3263−0.64021.1241
[0.2, 0.3]−0.34700.85520.0700−1.38901.6378
[0.3, 0.4]−0.38020.14870.62810.00940.3673
[0.4, 0.5]−0.2308−0.11670.74700.4362−0.0095
[0.5, 0.6]−0.21650.07720.65620.12050.2430
[0.6, 0.7]−0.62000.05660.86660.31030.0949
[0.7, 0.8]0.75510.05450.1528−0.34270.6456
[0.8, 0.9]−0.14100.15330.56490.00590.3451
[0.9, 1]−0.42920.15991.37170.3709−0.0225
Table 5. Coefficient LUT for converting AVHRR’s surface-inherent narrowband albedos to broadband albedos.
NDVICBand 1CBnad2
[0, 0.1]−0.10450.8657
[0.1, 0.2]−0.02630.7888
[0.2, 0.3]−0.03890.8242
[0.3, 0.4]0.62160.3387
[0.4, 0.5]0.57750.3699
[0.5, 0.6]0.38270.4208
[0.6, 0.7]0.71270.3395
[0.7, 0.8]0.48550.3812
[0.8, 0.9]0.71310.3597
[0.9, 1]0.54430.3577
Table 6. Coefficients computed using the general method of converting surface-inherent narrowband albedos to broadband albedos.
SensorCBand 1CBand 2CBand 3CBand 4CBand 5CBand 6CBand 7
MODIS0.18610.19330.20740.07220.2254−0.05580.1036
POLDER0.3535−0.23690.5212−0.39600.7396--
AVHRR0.52250.3801-----
Table 7. Fitting residuals from the NTB coefficient look-up tables for MODIS, POLDER and AVHRR.
SensorMinMedianMaxRRMSE
MODIS−0.0106−4.46 × 10−50.01010.99930.0015
POLDER−0.03380.00030.02970.99750.0055
AVHRR−0.03940.00030.03870.97070.0068
Table 8. Fitting residuals from the coefficients computed using the general method for MODIS, POLDER and AVHRR.
SensorMinMedianMaxRRMSE
MODIS−0.0196−1.20 × 10−40.01110.99870.0018
POLDER−0.05830.00100.04630.97890.0078
AVHRR−0.0589−0.00030.07480.95670.0100

