
Exploiting Multi-View SAR Images for Robust Target Recognition

Science and Technology on Automatic Target Recognition Laboratory, National University of Defense Technology, Changsha 410073, China
*
Author to whom correspondence should be addressed.
Remote Sens. 2017, 9(11), 1150; https://doi.org/10.3390/rs9111150
Submission received: 19 September 2017
/
Revised: 25 October 2017
/
Accepted: 7 November 2017
/
Published: 9 November 2017
(This article belongs to the Section Remote Sensing Image Processing)
Abstract
:The exploitation of multi-view synthetic aperture radar (SAR) images can effectively improve the performance of target recognition. However, due to the various extended operating conditions (EOCs) in practical applications, some of the collected views may not be discriminative enough for target recognition. Therefore, each of the input views should be examined before being passed through to multi-view recognition. This paper proposes a novel structure for multi-view SAR target recognition. The multi-view images are first classified by sparse representation-based classification (SRC). Based on the output residuals, a reliability level is calculated to evaluate the effectiveness of a certain view for multi-view recognition. Meanwhile, the support samples for each view selected by SRC collaborate to construct an enhanced local dictionary. Then, the selected views are classified by joint sparse representation (JSR) based on the enhanced local dictionary for target recognition. The proposed method can eliminate invalid views for target recognition while enhancing the representation capability of JSR. Therefore, the individual discriminability of each valid view as well as the inner correlation among all of the selected views can be exploited for robust target recognition. Experiments are conducted on the moving and stationary target acquisition recognition (MSTAR) dataset to demonstrate the validity of the proposed method.
1. Introduction
Automatic target recognition (ATR) from synthetic aperture radar (SAR) images has important meanings for its pervasive applications in both the military and civil fields [1]. All these years, researchers have tried to find or design proper feature extraction methods and classification schemes for SAR ATR. Principal component analysis (PCA) and linear discriminant analysis (LDA) [2] are usually used for feature extraction from SAR images. Other features, such as geometrical descriptors [3], attributed scattering centers [4,5], and monogenic spectrums [6], are also applied to SAR target recognition. As for the decision engines, various classifiers, including support vector machines (SVM) [7], sparse representation-based classification (SRC) [8,9], and convolutional neural networks (CNN) [10] are employed for target recognition and have achieved delectable results. Despite great effort, SAR target recognition under extended operating conditions (EOCs) [1] is still a difficult problem.
Most of the previous SAR ATR methods make use of single view SAR image. The single view image is compared with the training samples to find its nearest neighbor in the manifolds spanned by individual training classes. Due to the unique mechanism of SAR imaging, an SAR image is very sensitive to the view angle [11]. Hence, the usage of multi-view SAR images may help in the interpretation of SAR images. Actually, multi-view SAR exploitation has been successfully applied to SAR image registration [12]. As for SAR target recognition, it is predictable that the classification performance may vary with the view angle and the usage of multi-view images will probably improve the effectiveness and robustness of SAR ATR systems. As in the case of remote sensing data fusion [13], the benefits of using multi-view SAR images can be analyzed from two aspects. On the one hand, the images from different views can provide complementary descriptions for the target. On the other hand, the inner correlation among different views is also discriminative to target recognition. Therefore, the exploitation of multiple incoherent views of a target should provide a more robust classification performance than single view classification. Several ATR algorithms based on multi-view SAR images have been proposed, which can be generally divided into three categories. The first category uses parallel decision fusion for multi-view SAR images based on the assumption that the multiple views are independent. Brendel et al. [14] analyze the fundamental benefits of aspect diversity for SAR ATR based on the experimental results of a minimum-square-error (MSE) classifier. A Bayesian multi-view classifier [15] is proposed by Brown for target classification. The results demonstrate that use of multiple SAR images can significantly improve the ATR algorithm’s performance even with only two or three SAR views. Bhanu et al. [16] employ scatterer locations as the basis to describe the azimuthal variance with application to SAR target recognition. The experimental results demonstrated that the correlation of SAR images can be only maintained in a small azimuth interval. Model-based approaches [17] are developed by Ettinger and Snyder by fusing multiple images of a certain target at different view angles, namely decision-level and hypothesis-level fusion. Vespe et al. [18] propose a multi-perspective target classification method, which uses function neural networks to combine multiple views of a target collected at different locations. Huan et al. [19] propose a parallel decision fusion strategy for SAR target recognition using multi-aspect SAR images based on SVM. The second category uses a data fusion strategy. Methods of this category first fuse the multi-view images to generate a new input, which is assumed to contain the discriminability of individual views as well as the inner correlation of these views. Then, the fused data is employed for target recognition. Two data fusion methods for multi-view SAR images are proposed by Huan et al., i.e., the PCA method and the discrete wavelet transform (DWT) fusion method [19]. The third category uses joint decision fusion. Rather than classifying multi-view images respectively and then fusing the outputs, the joint decision strategy puts all the views in a unified decision framework by exploiting their inner correlation. Zhang et al. [20] apply joint sparse representation (JSR) to multi-view SAR ATR, which can exploit the inner correlations among different views. The superiority of multiple views over a single view is quantitatively demonstrated in their experiments. In comparison, the first category neglects the inner correlation among multi-view images. Although the data fusion methods consider both individuality and inner correlation, it is hard to evaluate the discriminability loss during the fusion process. The third category considers the inner correlation in the decision process, but the strategy may not work well when the multi-view images are not closely related.
In the above literatures, multi-view recognition has been demonstrated to be much more effective than single view recognition. However, some practical restrictions on multi-view recognition are neglected. Due to the EOCs in real scenarios, some of the collected views may be severely contaminated. Then, it is unwise to use these views during multi-view recognition. In this paper, a novel structure for multi-view recognition is proposed. The multiple views of a target are first classified by SRC. Based on the reconstruction residuals, a principle is designed to judge whether a certain view is discriminative enough for multi-view recognition. Then, JSR is employed to classify the selected views. However, when the input views are not closely related, the joint representation over the global dictionary is not optimal due to an incorrect correlation constraint. As a remedy, in this paper, the selected atoms of each of the input views by SRC are combined to construct an enhanced local dictionary. The selected atoms and their neighboring ones (those sharing approaching azimuths) are used to construct the enhanced local dictionary, which inherits the representation capability of the global dictionary for the selected views. Meanwhile, it constrains the atoms for representation, thus avoiding the incorrect atom selections occurring in the global dictionary, especially when the multiple views are not closely related. By performing JSR on the enhanced local dictionary, both the correlated views and the unrelated views can be represented properly. Finally, the target label will be decided according to the residuals of JSR based on the minimum residual principle.
In the following, we first introduce the practical restrictions on multi-view recognition in Section 2. Then, in Section 3, the proposed structure for multi-view recognition is presented. Extensive experiments are conducted on the moving and stationary target acquisition recognition (MSTAR) dataset in Section 4, and finally, conclusions are drawn in Section 5.
2. Practical Restrictions on Multi-View Target Recognition
With the development of space-borne and air-borne SAR systems, the multi-view SAR images of a target are becoming accessible. However, due to the EOCs in real scenarios, some views are not discriminative enough for target recognition. Then, it is preferable to discard these views in multi-view recognition. The following depicts some typical practical restrictions on multi-view recognition.
2.1. Target Variation
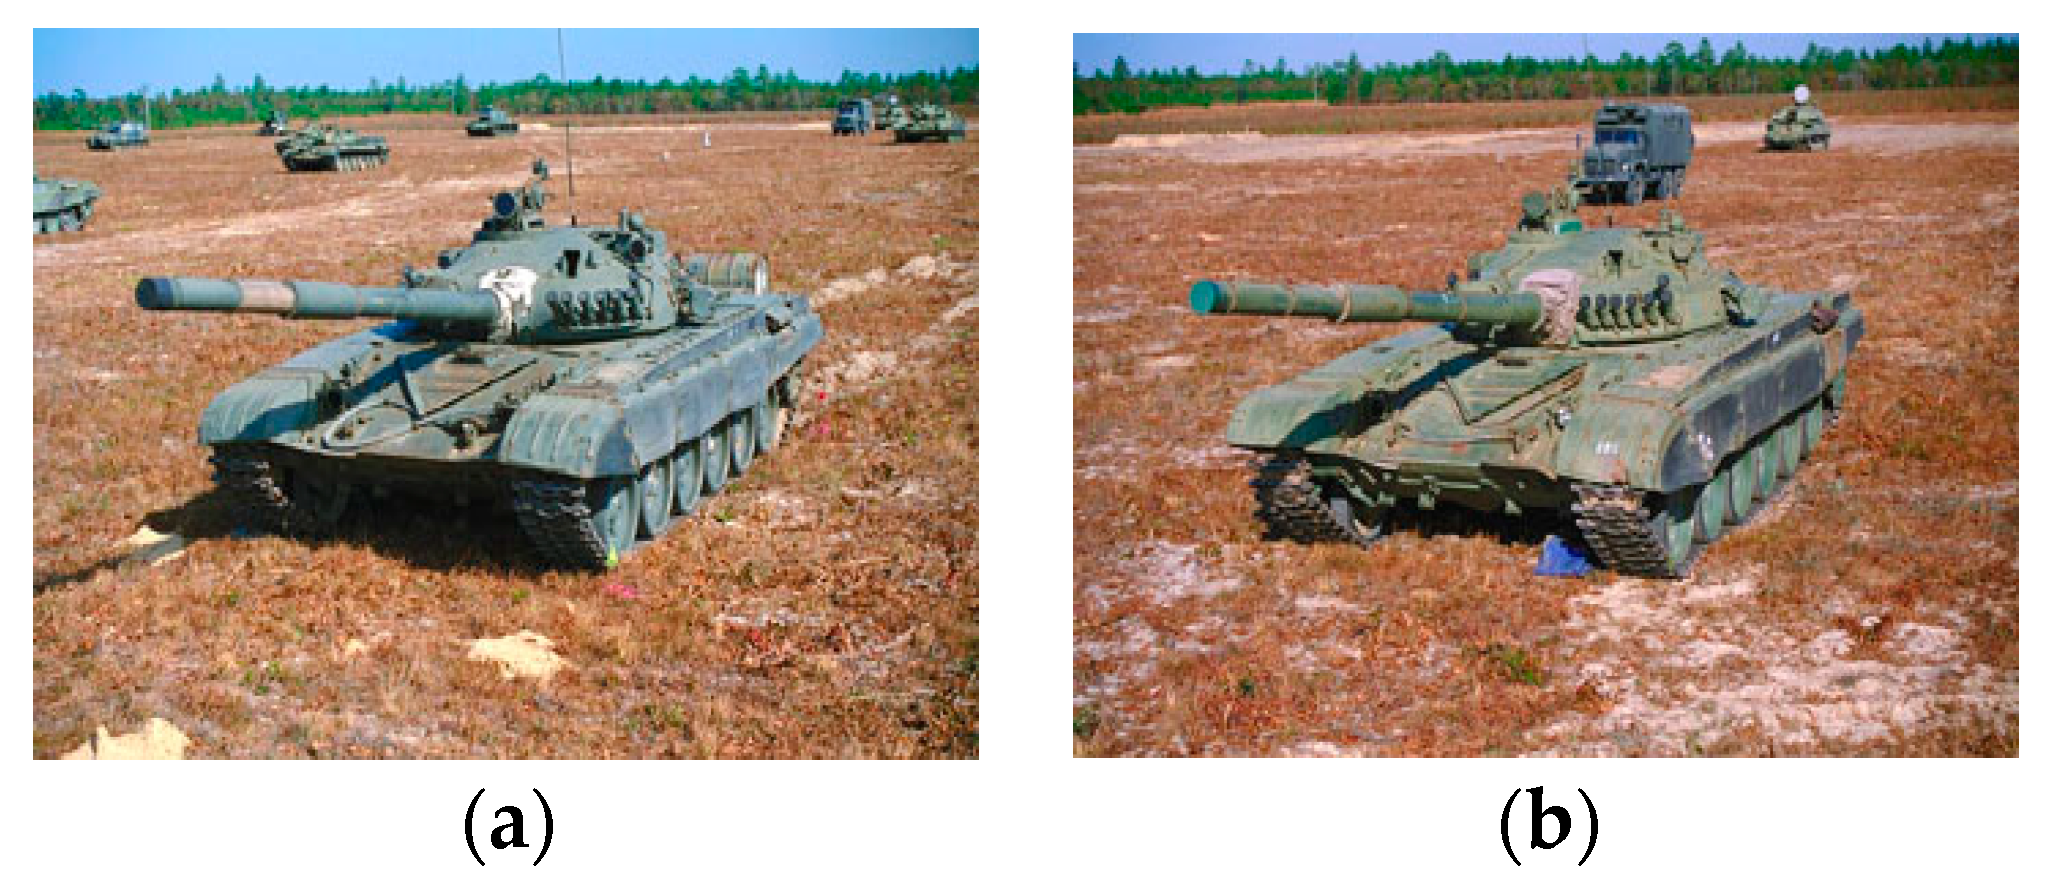
The target itself may have some variations due to configuration diversity or wreckage. Figure 1 shows two serial numbers of the T72 tank, i.e., A04 and A05. A04 is equipped with fuel drums while A05 has no fuel drums. When we want to classify A04 as a T72 with the training source of A05 samples, it is possible that the views which present the characteristics of fuel drums cause much discordance with the A05 samples. In this case, these views should be discarded in multi-view recognition. Generally speaking, for a target with local variations, the views which remarkably manifest the properties of the discordance may probably impair the multi-view recognition’s performance. Therefore, such views should be cautiously passed through to multi-view recognition.
2.2. Environment Variation
The target may stand on different backgrounds, such as meadows or cement roads. Furthermore, it may be occluded by trees or manmade buildings as shown in Figure 2. Figure 2a,b shows two T72 tanks occluded by trees and a manmade wall, respectively. Figure 2b,c presents two views of a T72 tank occluded by a manmade wall. As for target recognition, it is preferable that the view in Figure 2b should be used, as most of the target’s characteristics can be observed. For the view angle in Figure 2c, a large proportion of the target is occluded. Thus, the image at this view can provide very limited discriminability for target recognition.
2.3. Sensor Variation
Actually, the multi-view images of a certain target may come from different sensors. Figure 3 shows three typical situations during the collection of multi-view SAR images. In Figure 3a, multiple images are captured by the same airborne sensor at consecutive azimuths. The collected multiple views in Figure 3b are from different airborne sensors at quite different view angles. Figure 3c shows the multiple views acquired by both the airborne and satellite-based platforms. Consequently, the images may have quite different view angles. Furthermore, due to the sensor variety, they may also have different resolutions and signal-to-noise ratios (SNR). As the training samples are probably collected at several fixed resolutions and SNRs, the multi-view images with different resolutions or SNRs will provide disproportionate discriminability for target recognition. Then, the views with low discriminability should not be used for multi-view recognition.
Actually, there are many more EOCs in practical applications. Consequently, as we analyze above, images from different views provide unequal discriminability to target recognition under EOCs. Therefore, for robust target recognition, the validity of the input views for multi-view recognition should be examined beforehand.
3. Proposed Structure of Multi-View SAR Target Recognition
3.1. Sparse Representation-Based Classification (SRC)
With the development of compressive sensing (CS) theory, sparse signal processing over a redundant dictionary has drawn pervasive attention. By enforcing a sparsity constraint on the representation coefficients, the decision is made by evaluating which class of samples can recover the test sample with the minimum error.
Denote the dictionary constructed by training samples from classes as , where is a class-dictionary formed by individual classes, is the dimensionality of the atom, and is the total number of all the training samples: . Based on the assumption that a test sample from class lies in the same subspace with the training samples from the same class, SRC assumes that can be recovered from its sparse representation with respect to global dictionary as follows:
where is the sparse coefficient vector, and is the allowed error tolerance. The non-convex -norm objective in Equation (1) is an NP-hard problem. Typical approaches for solving the problem are either approximating the original problem with -norm based convex relaxation [9] or resorting to greedy schemes, such as orthogonal matching pursuit (OMP) [8]. After solving the optimal representation , SRC decides the identity of the test sample by evaluating which class of samples could result in the minimum reconstruction error.
where the operation extracts the coefficients corresponding to class and denotes the reconstruction error of each class.
3.2. Joint Sparse Representation (JSR) for Classification
Assume there are views of the same target, then the sparse representation problems can be jointly formulated as:
Denote , then Equation (3) can be rewritten as
In Equation (4), represents the Frobenius norm and denotes the number of non-zero elements in . However, the inner correlation among multiple views is not fully considered due to the fact that is decomposable over each column (view). To overcome this defect, it is assumed that the multiple views of the same target share a similar sparse pattern over the same dictionary while the values of the coefficients corresponding to the same atom may be different for each input view. This can be achieved by solving the following optimization problem with mixed-norm regularization as
where is the mixed-norm of matrix obtained by first applying the norm on each row of and then applying the norm on the resulting vector.
To solve the problem in Equation (5), the simultaneous orthogonal matching pursuit (SOMP) [21,22] method can be used. After solving the coefficient matrix , the target label is determined by the minimum reconstruction error, which is the same as SRC. JSR incorporates the inner correlation of multiple views in the joint decision framework. However, when the multiple views are not closely related due to a large azimuth difference, environmental variations, etc., the correlation constraint in JSR may result in incorrect atom selections. Then, the classification performance will degrade.
3.3. Structure for Multi-View Target Recognition
Due to the EOCs in real scenarios, some of the collected multiple views may provide little discriminability for target recognition. In order to build a robust multi-view recognition framework, each of the input views is first examined by SRC. Based on the residuals of individual classes, a reliability level is calculated, which indicates the effectiveness of a certain view for multi-view recognition. The reliability level is evaluated by the ratio of the minimum residual and the second minimum residual as Equation (6).
It is obvious that ranges from 0 to 1, while a lower indicates higher reliability. By presetting a threshold on , only the views with higher reliability than will be passed through to multi-view recognition. A lower means a stricter criterion for selecting a valid view. Then, the selected views are classified by JSR to exploit their possible inner correlation for target recognition. As indicated in the JSR model, when the multiple inputs are not closely related (for example they are acquired at quite different azimuths), the resulting coefficients by JSR may not be optimal. In order to overcome this situation, an enhanced local dictionary is built based on the selected atoms of the selected views by SRC. The selected atoms by each view are combined to form a local dictionary which only contains a few atoms. To further enhance the representation capability of the local dictionary, the samples in the original dictionary , which are closely related to these atoms, are added to the local dictionary. The detailed process for constructing the enhanced local dictionary is described in Algorithm 1. In our practical application, is set to be 5°, assuming that SAR images keep highly correlated in such an azimuth interval. On the one hand, the enhanced local dictionary inherits the representation capability of the global dictionary for the selected views. On the other hand, it can avoid the incorrect atom selection of JSR over the global dictionary to make more robust decisions.
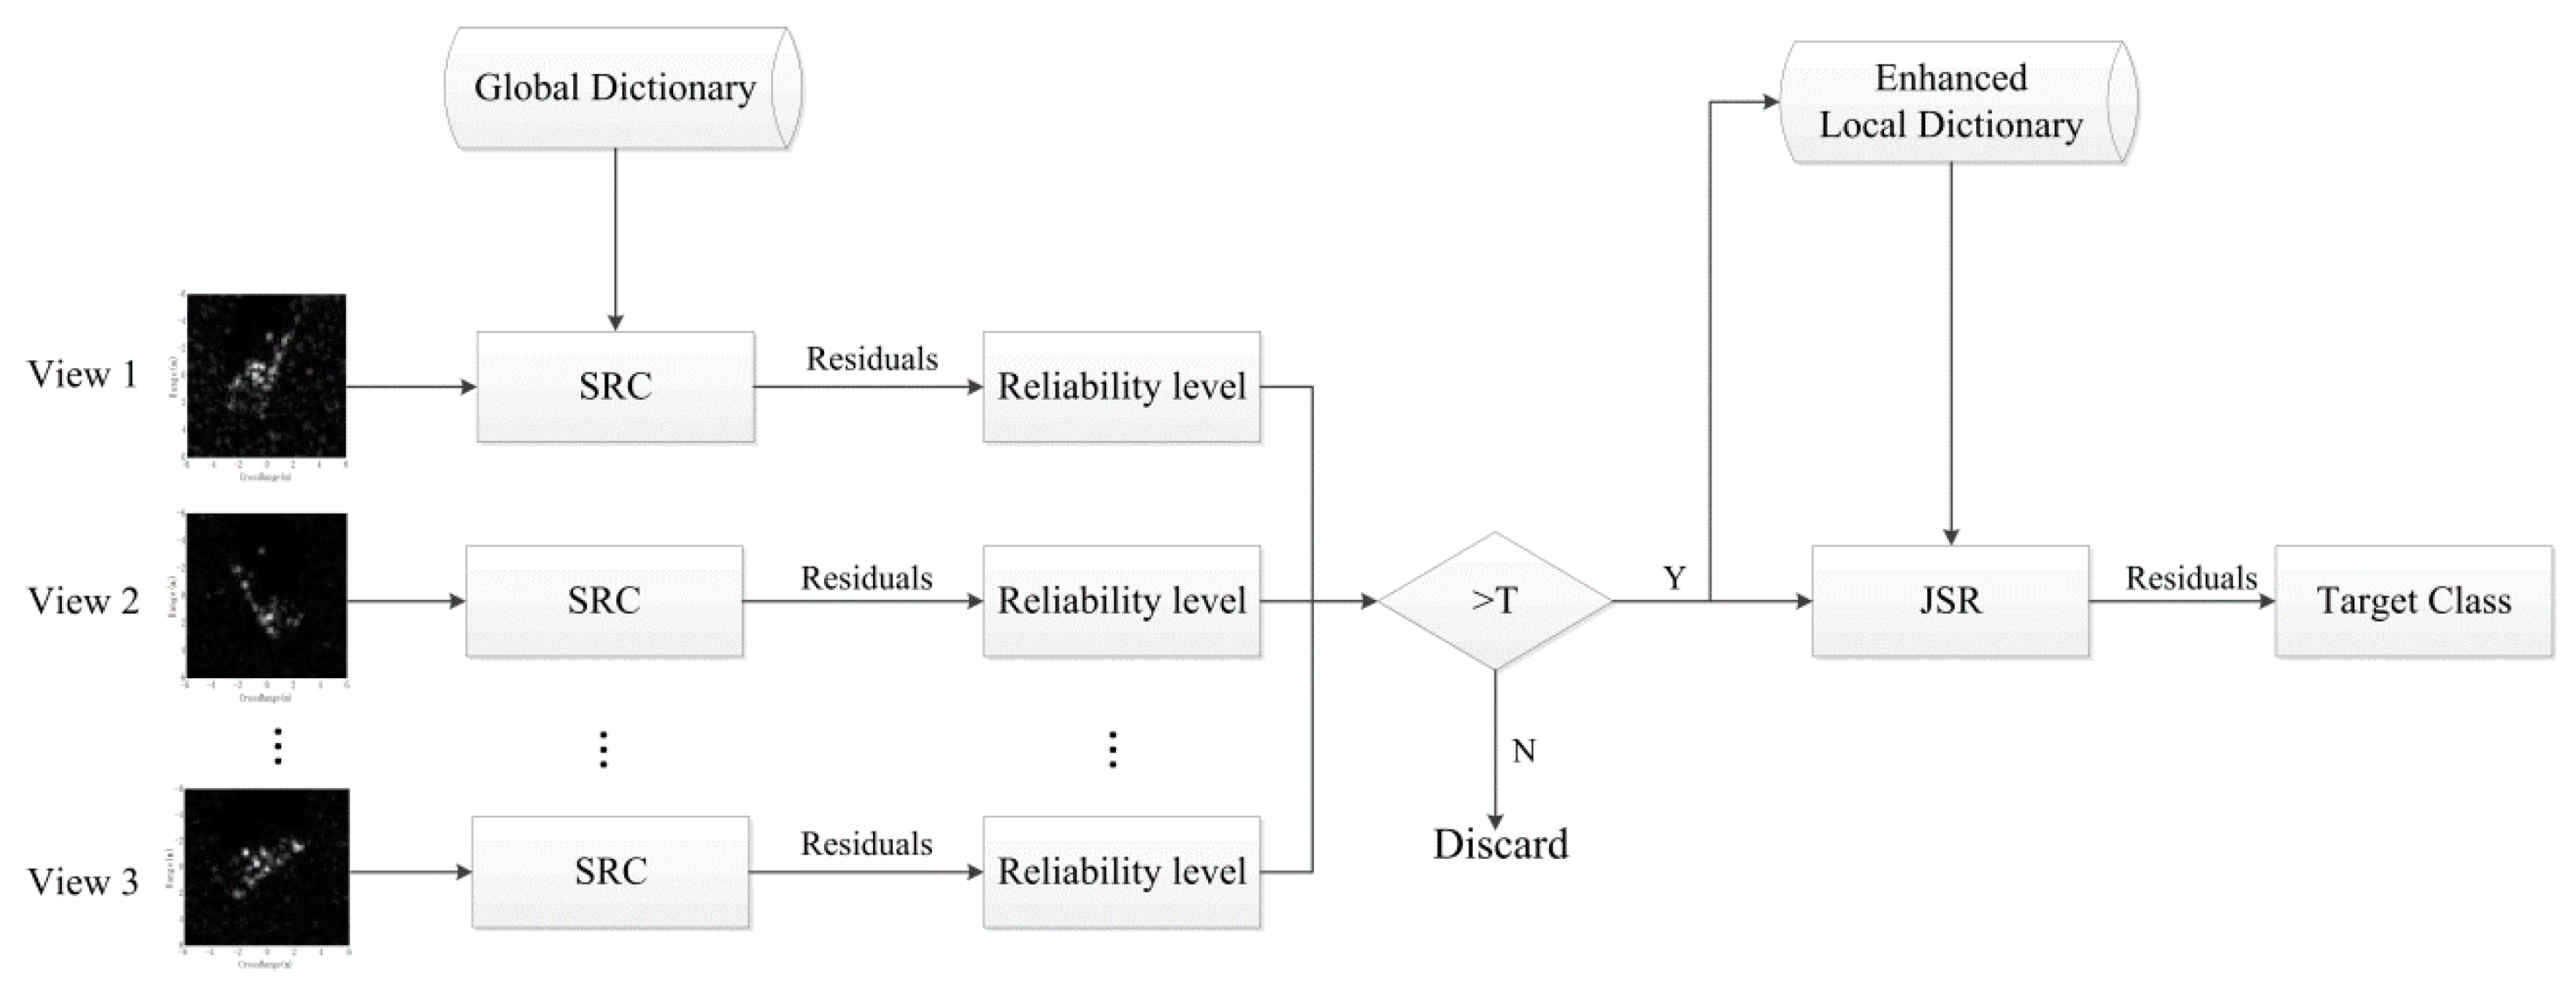
The framework of the proposed method is shown in Figure 4. The threshold judgment based on the reliability level can effectively eliminate those views with low discriminability. The enhanced local dictionary will promote the representation capability of JSR; thus, it can still work robustly when the multiple views are not closely related. Therefore, the proposed method can improve the performance of multi-view recognition, especially when the input views contain some corrupted samples due to EOCs. In the implementation of the proposed method, OMP and SOMP are employed in SRC and JSR, respectively, for their high efficiency.
| Algorithm 1. Construction of enhanced local dictionary |
| 1. Input: The selected atom of views of SAR images: . |
| 2. Calculate the union of to obtain a local dictionary . |
| 3. for = 1: length() |
| if (Azi() − Azi() < ) |
| end |
| end |
| 4. Output: The enhanced local dictionary . |
4. Experiment
4.1. MSTAR Dataset
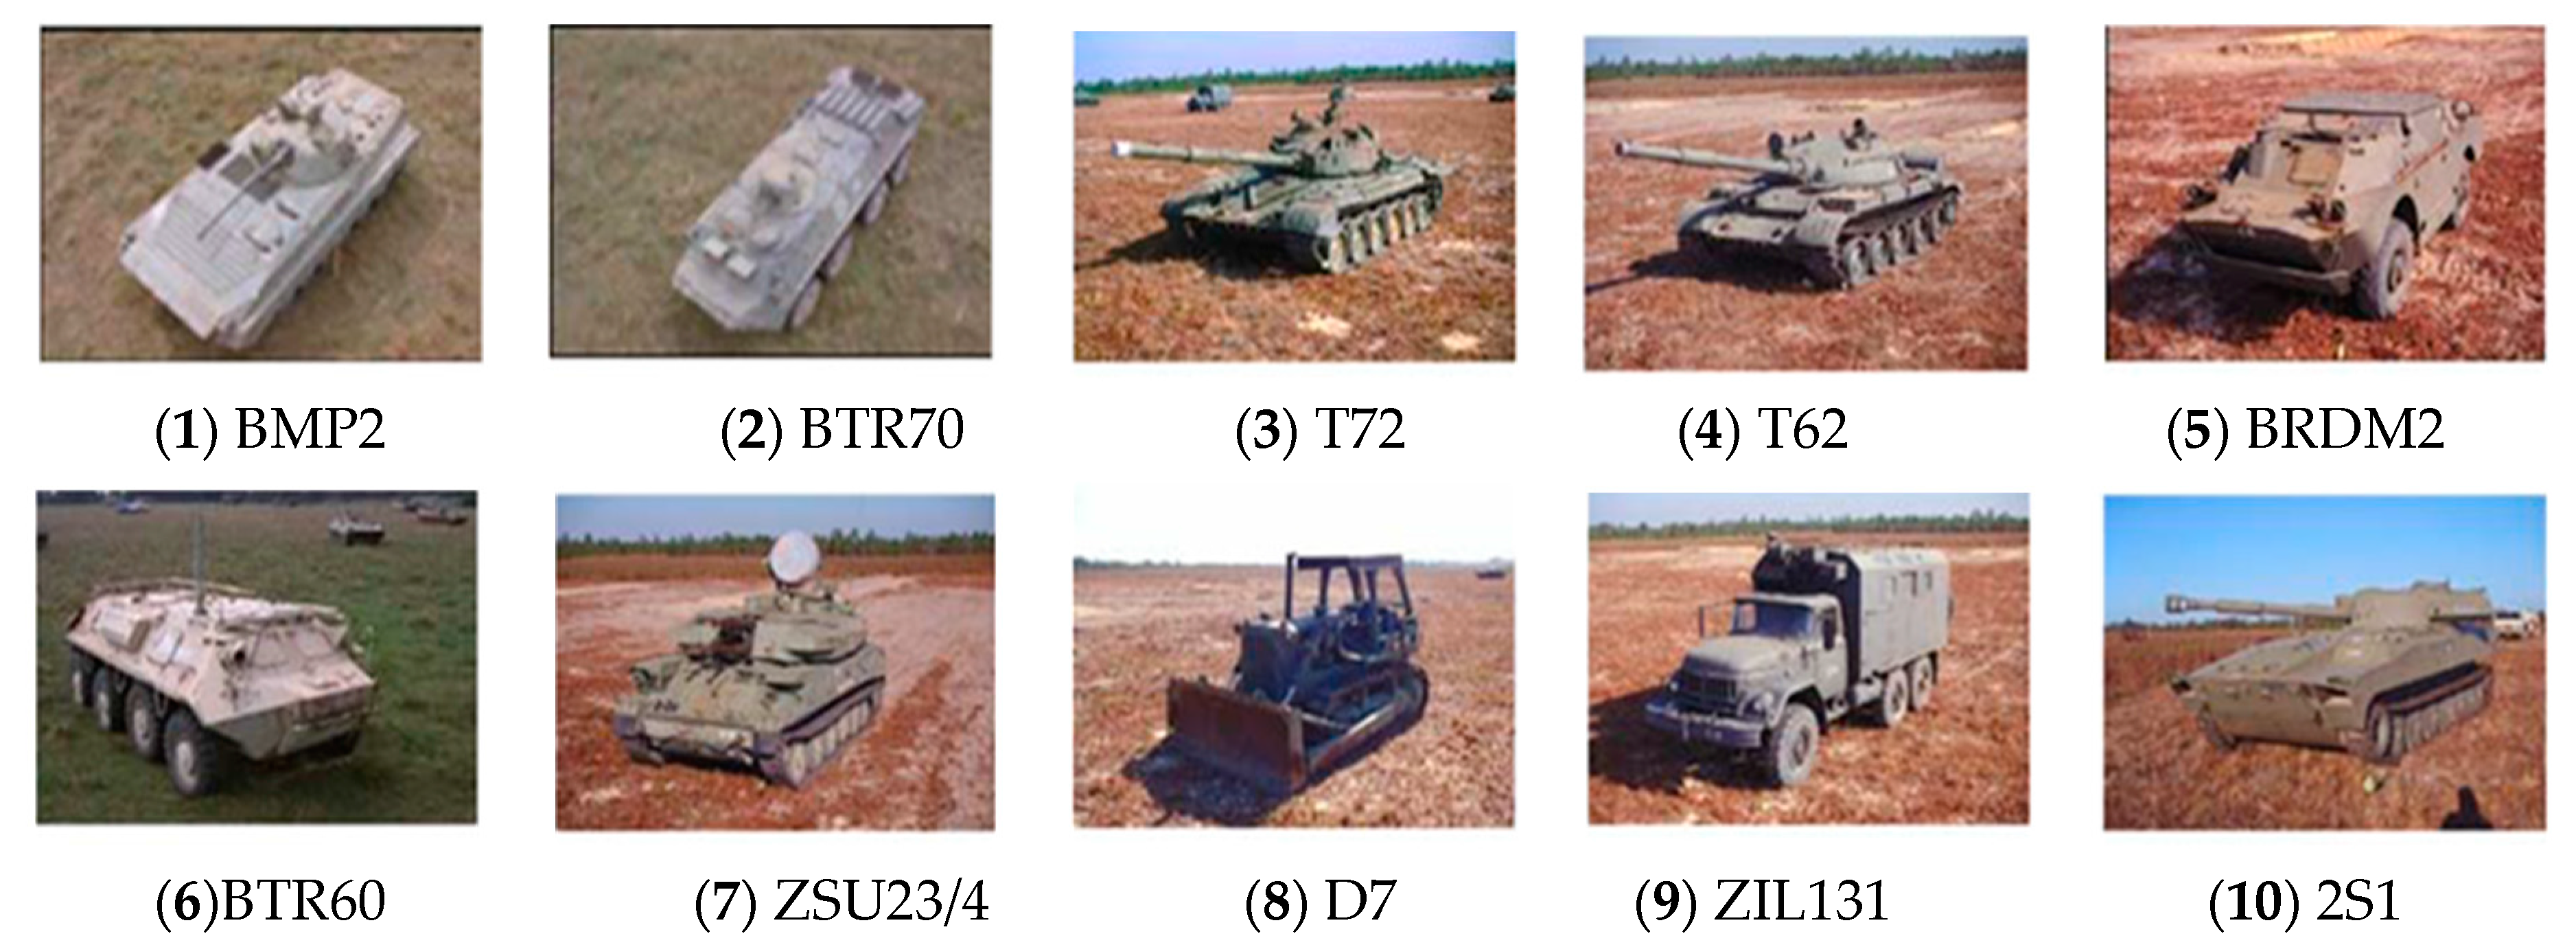
To test the proposed method, the MSTAR dataset is employed, which is the benchmark for SAR ATR. The SAR images are collected by X-band sensors with a 0.3 m × 0.3 m resolution. The dataset includes ten classes of military targets: BMP2, BTR70, T72, T62, BRDM2, BTR60, ZSU23/4, D7, ZIL131, and 2S1. The corresponding optical images of these targets are shown in Figure 5. SAR images at the depression angles of 15° and 17° are listed in Table 1, which cover full aspect angles from 0–360°.
In order to quantitatively evaluate the proposed method, several state-of-the-art algorithms are used as the references, including single view methods and multi-view methods. The detailed descriptions of these methods are presented in Table 2. SVM and SRC are employed for the classification of single view SAR images. The MSRC, DSRC, and joint sparse representation-based classification (JSRC) methods are used for multi-view recognition. For a fair comparison, all of these methods employ Gaussian random projection for feature extraction with the dimension of 1024. In the rest of this section, we first perform the proposed method under standard operating conditions (SOC), i.e., a 10-class recognition problem. Afterwards, the performance is evaluated under several extended operating conditions (EOCs), namely, configuration variance, noise corruption, partial occlusion, and resolution variance. At last, we examine the proposed method under different thresholds of reliability level.
4.2. Recognition under SOC
4.2.1. Preliminary Performance Verification
We first test the proposed method under SOC. Images at a 17° depression angle are used for training and images at a 15° depression angle are tested. For BMP2 and T72 with three different serial numbers, only the standard ones (Sn_9563 for BMP2 and Sn_132 for T72) are used for training (see Table 1). For each test sample, we choose other samples at an azimuth interval of and then the samples are put together for multi-view recognition. The reliability level threshold is set at , , and , and the recognition results of the proposed method are displayed as the confusion matrix in Table 3. All of the 10 targets can be recognized with a percentage of correct classification (PCC) over 97% and an overall PCC of 98.94%.
The proposed method is compared with the reference methods in Table 4. It is clear that all the multi-view methods achieve a disproportionate improvement over the single view methods. Among the multi-view methods, the proposed method has the highest PCC. DSRC has the lowest PCC, probably due to the discriminability loss during the data fusion. MSRC achieves a slightly higher PCC than JSRC at the sacrifice of computation efficiency. The results demonstrate the significant superiority of the multi-view methods over the single view algorithms and the high effectiveness of the proposed method under SOC.
4.2.2. Performance at Different View Numbers
In this part, we evaluate the effects of view numbers on the proposed method. The azimuth interval is set as , and Table 5 summarizes the performance of all of the multi-view recognition methods at different view numbers.
Except for DSRC, the other multi-view methods gain improvement with the increase of the view number and they share approaching PCCs, while the proposed method achieves the highest one. It is reasonable that more views could provide more information for target recognition, thus improving the performance. As for DSRC, the fused result of too many samples by PCA may hardly find a best match in the dictionary. This is probably the reason for its performance degradation when the view number is more than 5.
4.2.3. Robustness to Azimuthal Variation
In previous works, the researchers assumed a fixed azimuth separation between the multi-view images. With the view number set as , the performance of the multi-view recognition algorithms at different fixed view steps are shown in Figure 6. The proposed method achieves the best performance, and DSRC has the lowest PCC at each view step. By comparing MSRC and JSRC, JSRC performs better when the view step is less than 15. This is mainly because the views with a smaller azimuth interval share a higher inner correlation. When the view step continues to increase, the performance of JSRC becomes worse than that of MSRC due to the weak correlation between different views. For DSRC, the fused results of multiple views with a large azimuth interval may hardly resemble the training samples of the same class. Therefore, its performance may even be inferior to that of single view methods at large view steps.
Actually, the collected views may probably have unstable azimuth separations. Therefore, a further experiment is carried out on the random selected views. For each test sample, we randomly selected two other samples from the same class. Then, the three samples are passed through to multi-view recognition. We repeated the test 10 times, and the average PCCs of the multi-view methods are presented in Table 6. The proposed method outperforms the others. Also, JRSC has a lower PCC than MSRC due to the unstable inner correlation among the views with random azimuths.
4.3. Recognition under EOCs
In the following, the proposed method is tested under several EOCs, i.e., configuration variance, noise corruption, partial occlusion, and resolution variance. According to the experimental results in Section 4.2, we set and as a tradeoff between the view number and recognition performance.
4.3.1. Configuration Variance
In real scenarios, a special target class may include several variants. Therefore, it is necessary to test the ATR methods under configuration variance as the training samples may not cover all the possible configurations. Table 7 describes the training and test sets for the experiment under configuration variation. The training set is composed of four targets, BMP2, BRDM2, BTR70, and T72, and the test set consists of only BMP2 and T72. For BMP2 and T72, the configurations available for testing are not contained in the training set. Table 8 presents the confusion matrix of the proposed method under configuration variance. Table 9 compares the proposed method with the reference methods. It is clear that the multi-view methods perform much better than the single view ones. With the highest PCC, the proposed method is the most robust under configuration variance.
4.3.2. Noise Corruption
The measured SAR images may be corrupted by noises from the background and radar system. Therefore, it is crucial that the ATR method can keep robust under noise corruption. Actually, there are many types of noises in SAR images. In this paper, additive complex Gaussian noise is employed as the representative, which is also used in several relevant researches [23,24]. Since it is impossible to perfectly eliminate all of the noises in the original SAR images, the original MSTAR images are assumed to be noise free and different amounts of Gaussian noises are added according to the SNR level defined as Equation (7).
where is the complex frequency data of MSTAR images, and is the variance of Gaussian noise.
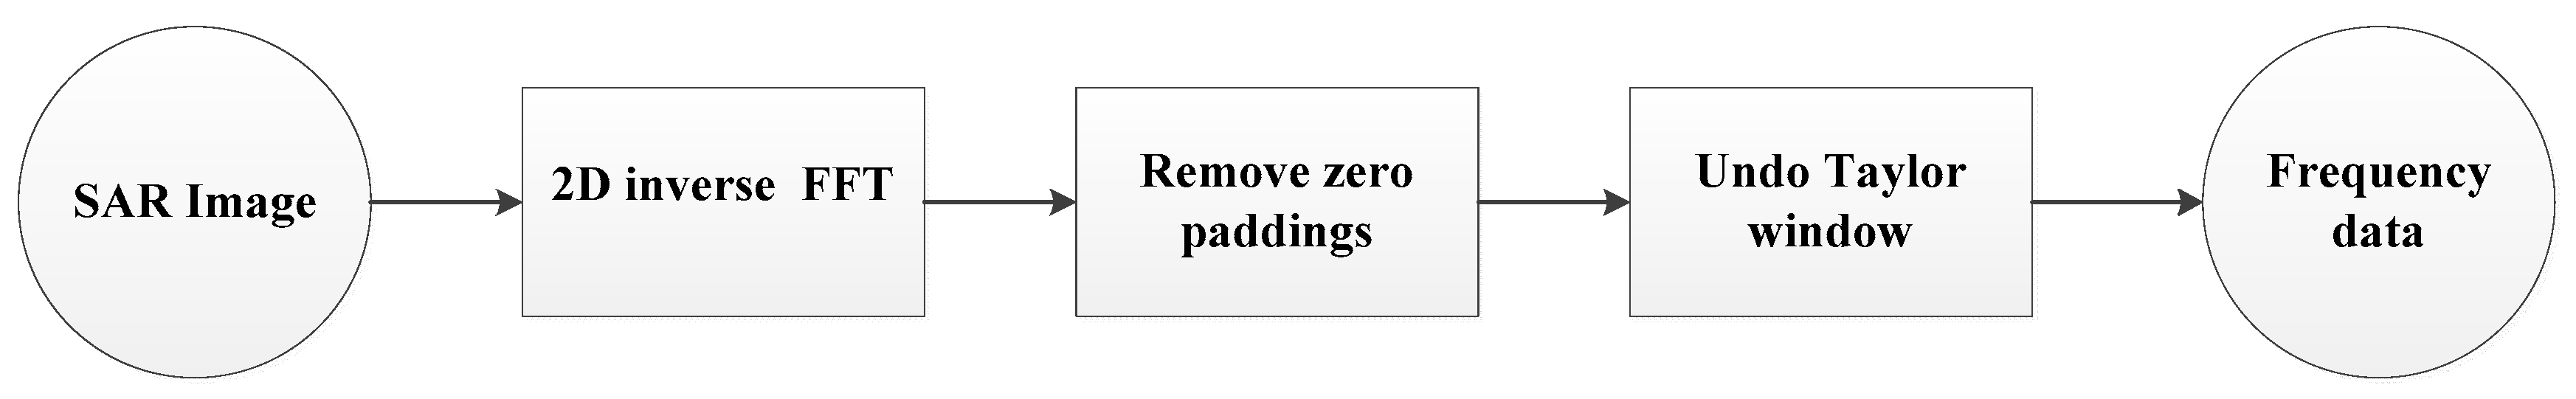
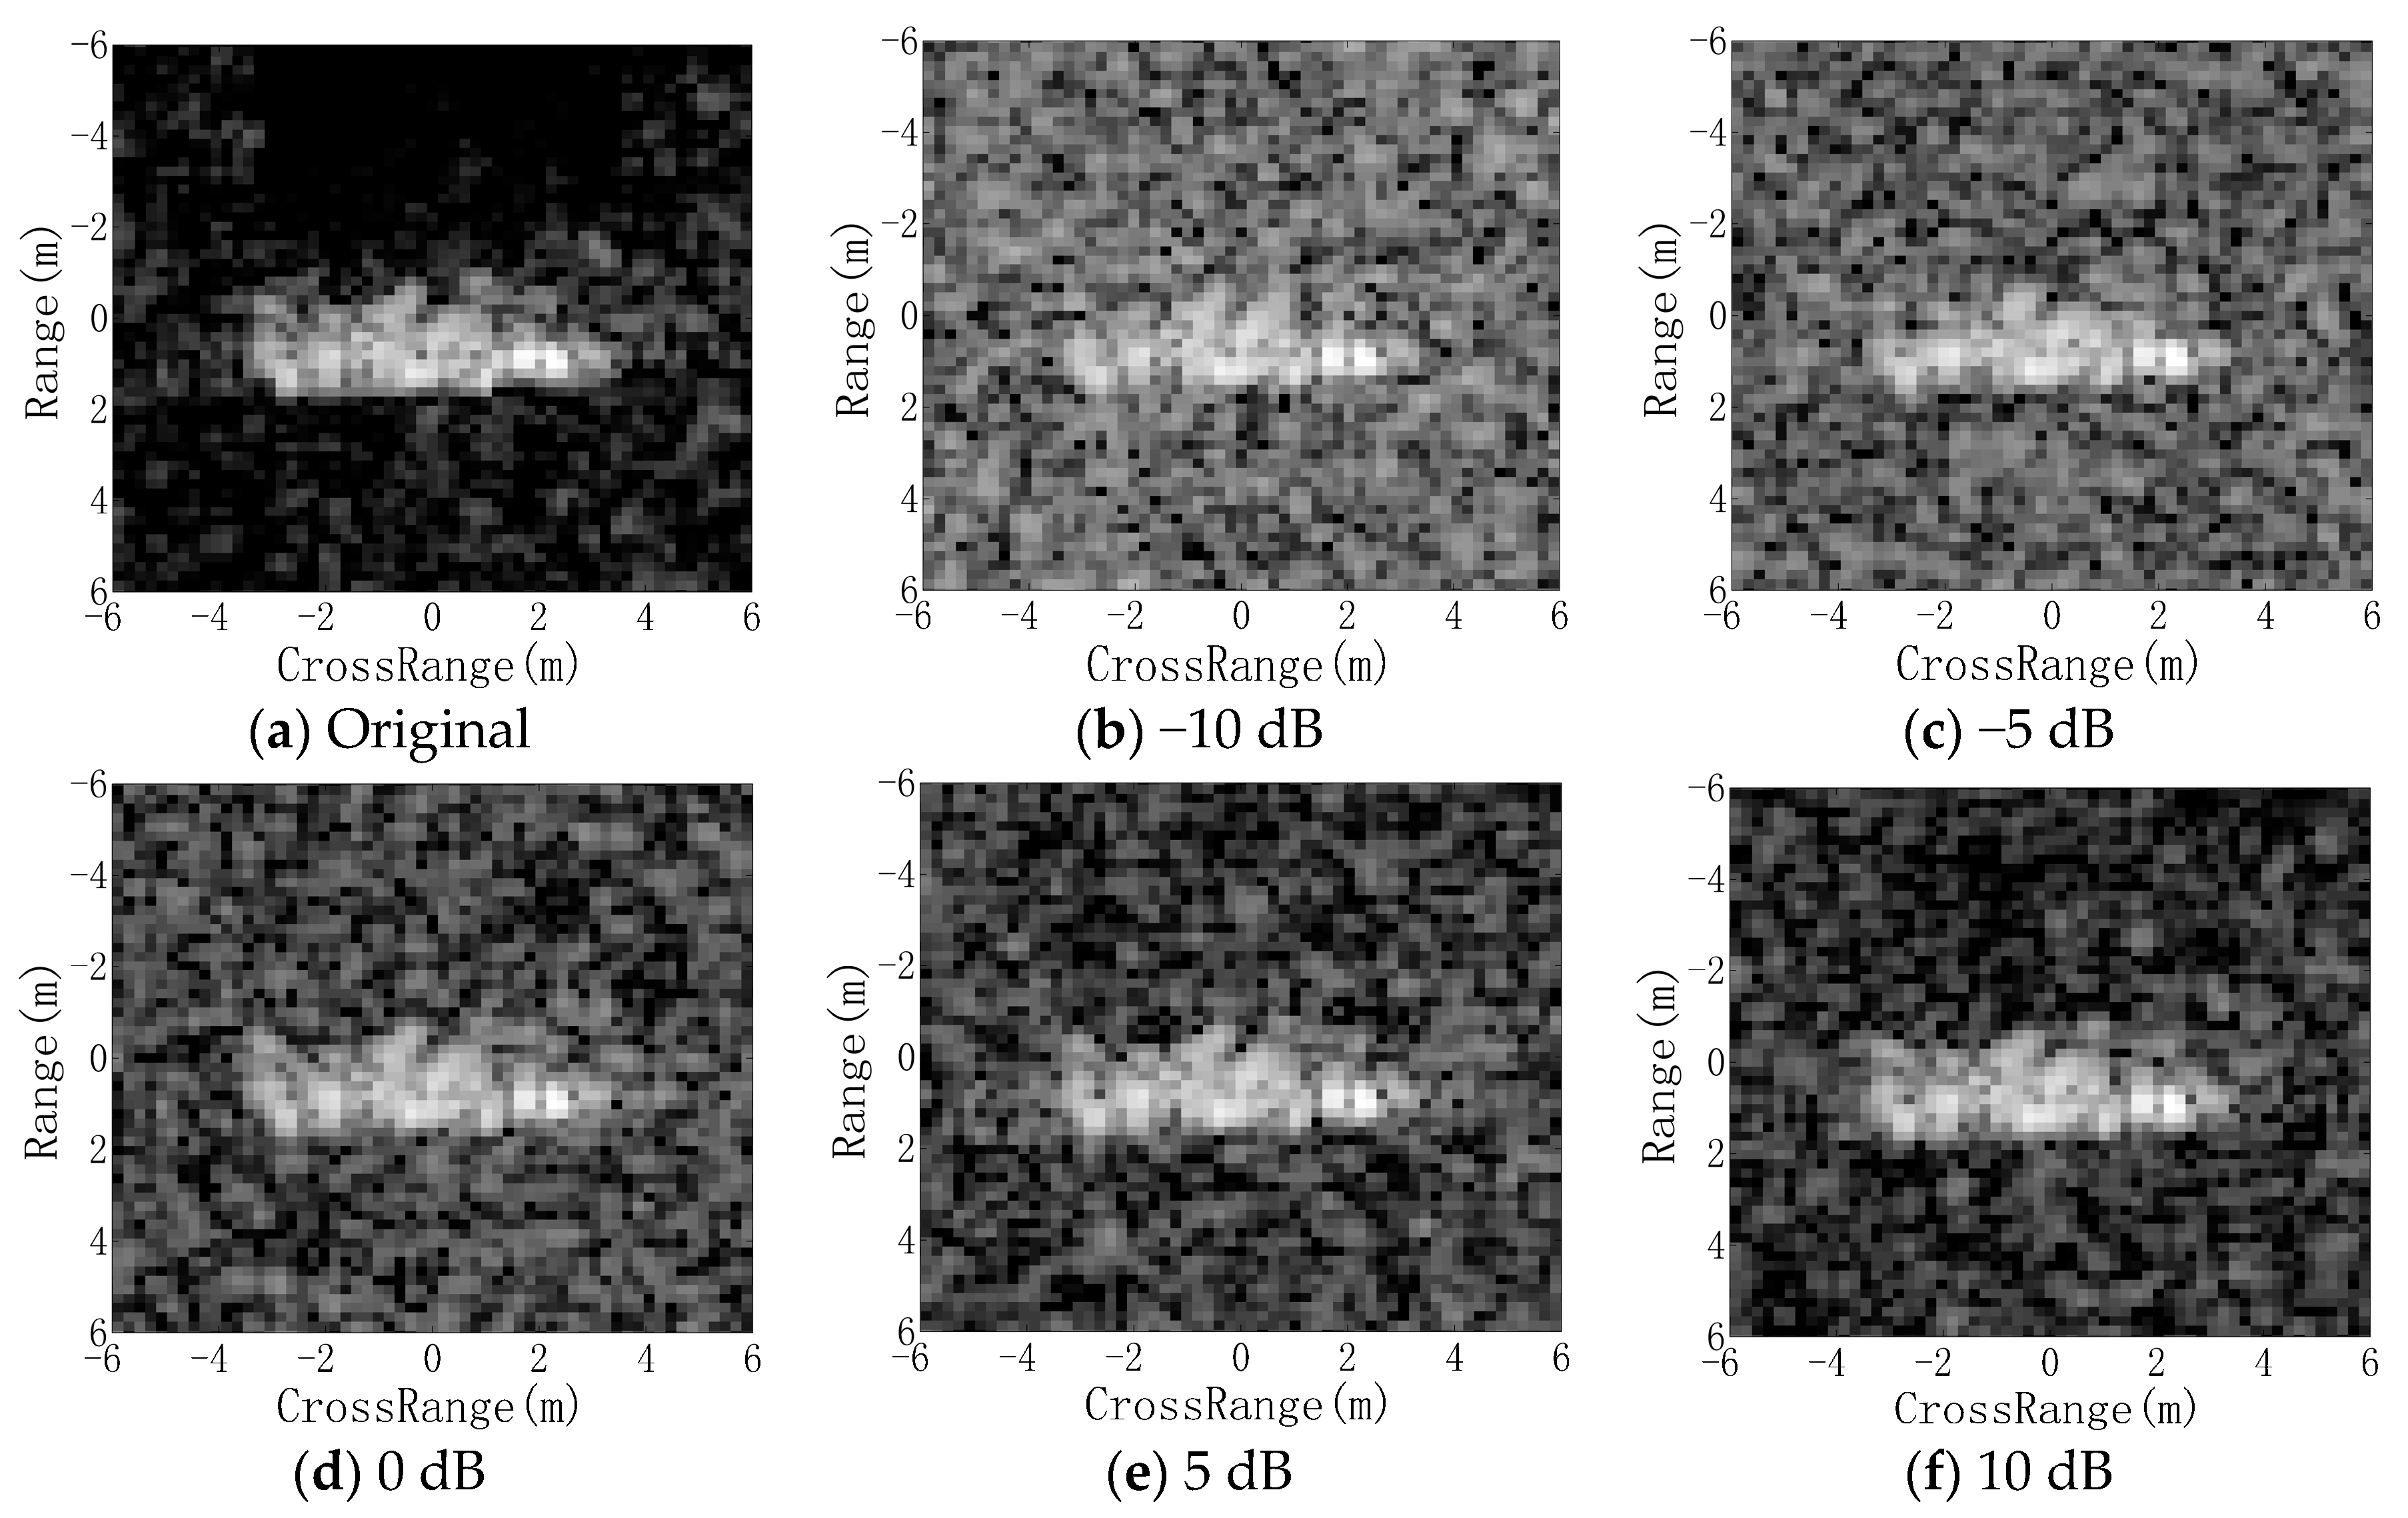
Figure 7 illustrates the procedure of transforming the original MSTAR images to the frequency domain. By transforming the original image using a two-dimensional (2D) inverse fast Fourier transform (FFT) and removing the zero padding and window during the imaging process, the frequency data is separated as a matrix. Then, the Gaussian noises are added to the frequency data according to the preset SNRs and the noise-corrupted images are obtained by transforming the noised frequency data back to the image domain. Figure 8 gives some examples of the noise-corrupted images of a BMP2 image (chip number “HB03341.000”) at different SNRs.
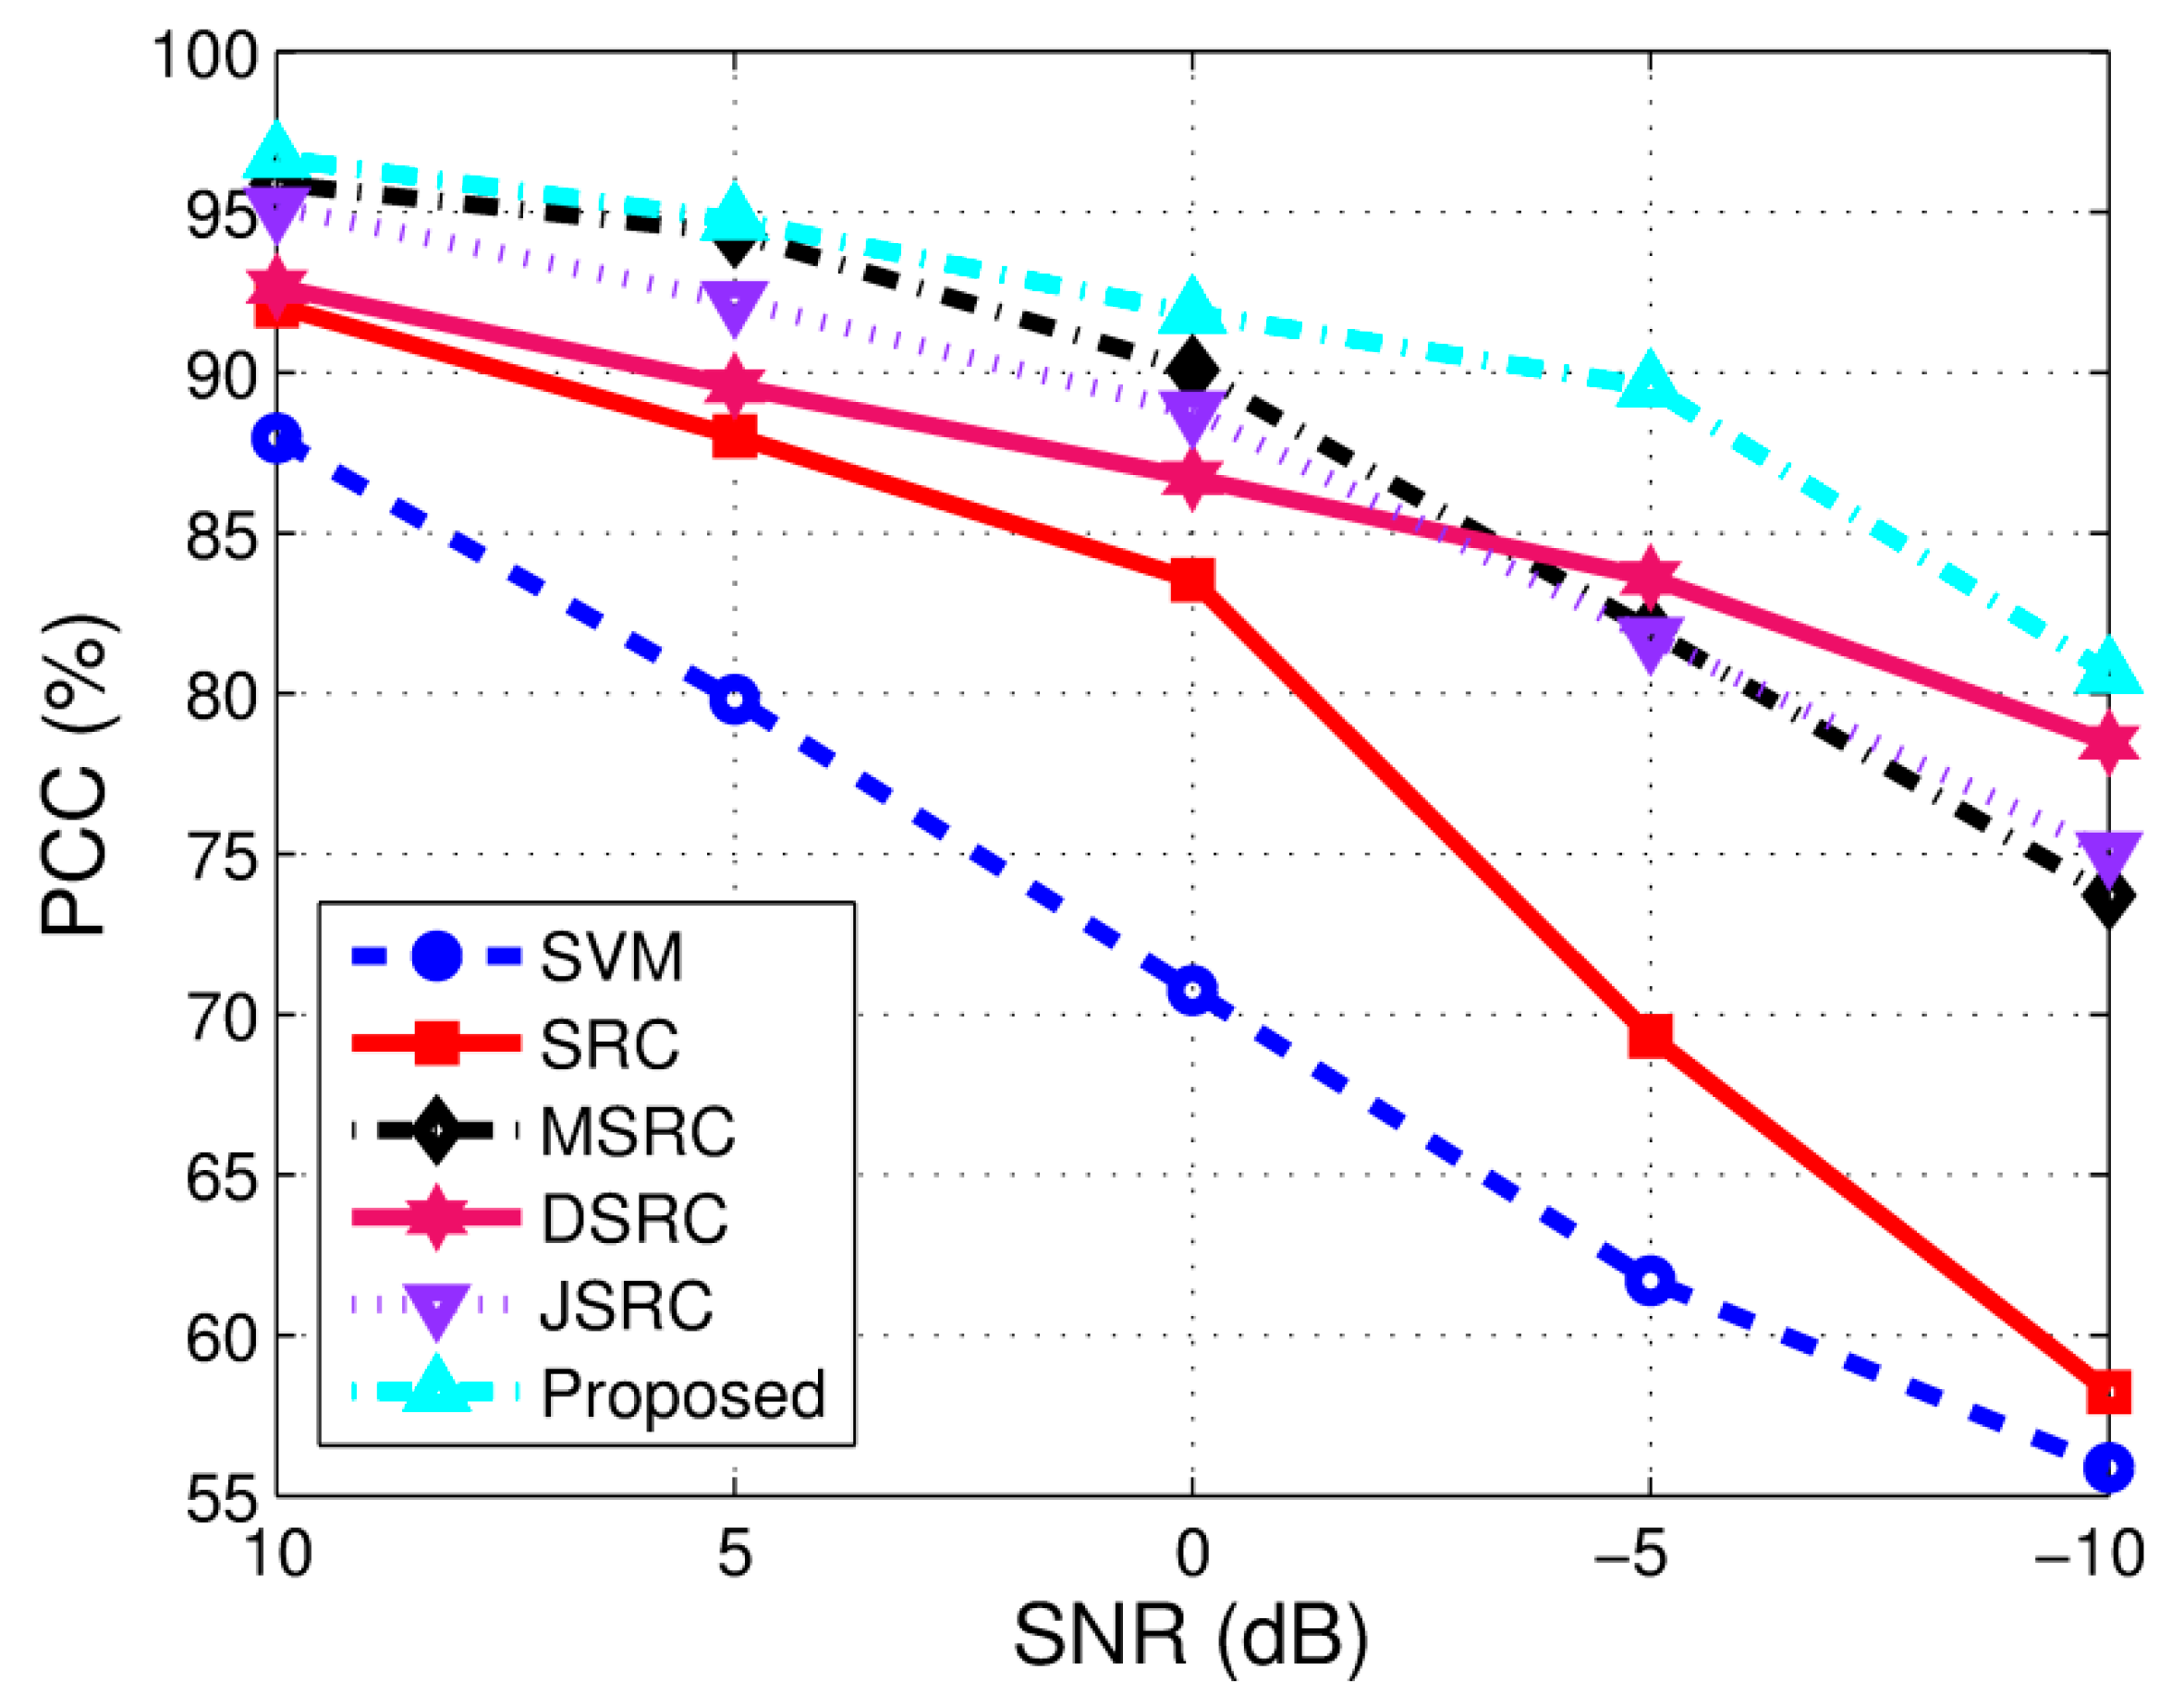
The details of the implementation of this experiment are as follows. For the multi-view methods, two of the three views are corrupted by noise. For the single view methods, we randomly corrupt 2/3 of the test samples for a fair comparison. Figure 9 shows the performance of all the methods under different noise levels. It is clear that the multi-view methods achieve much better performance than the single view methods. It is also noticeable that DRSC performs better than MSRC and JSRC at SNRs lower than 0 dB. This is mainly because the PCA process in the data fusion eliminates some noises. With the highest PCC at each SNR, the proposed method is demonstrated to be the most effective and robust.
4.3.3. Partial Occlusion
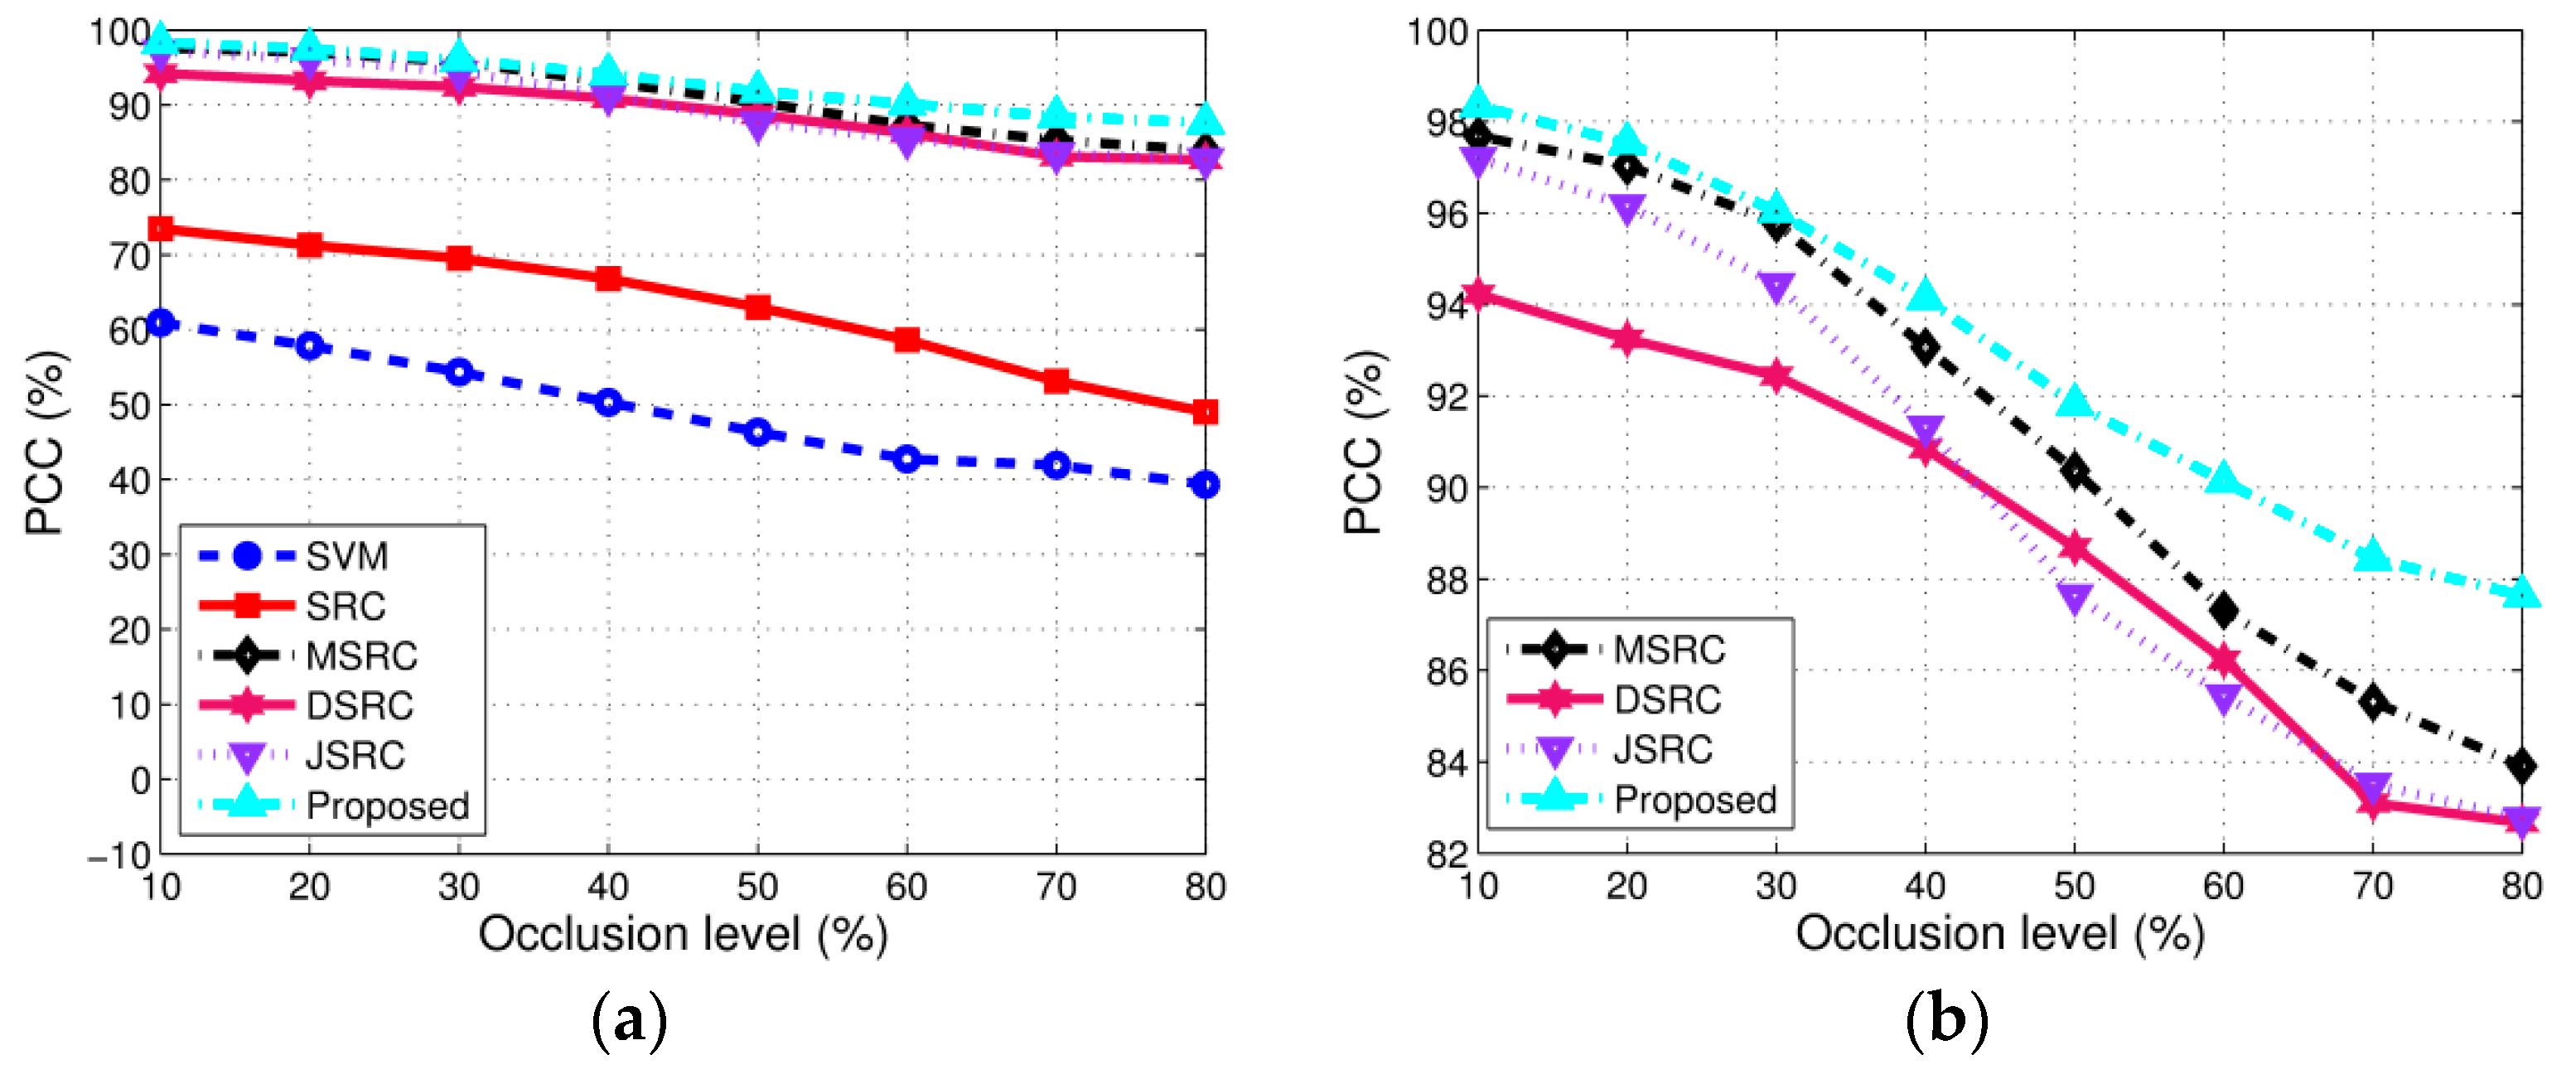
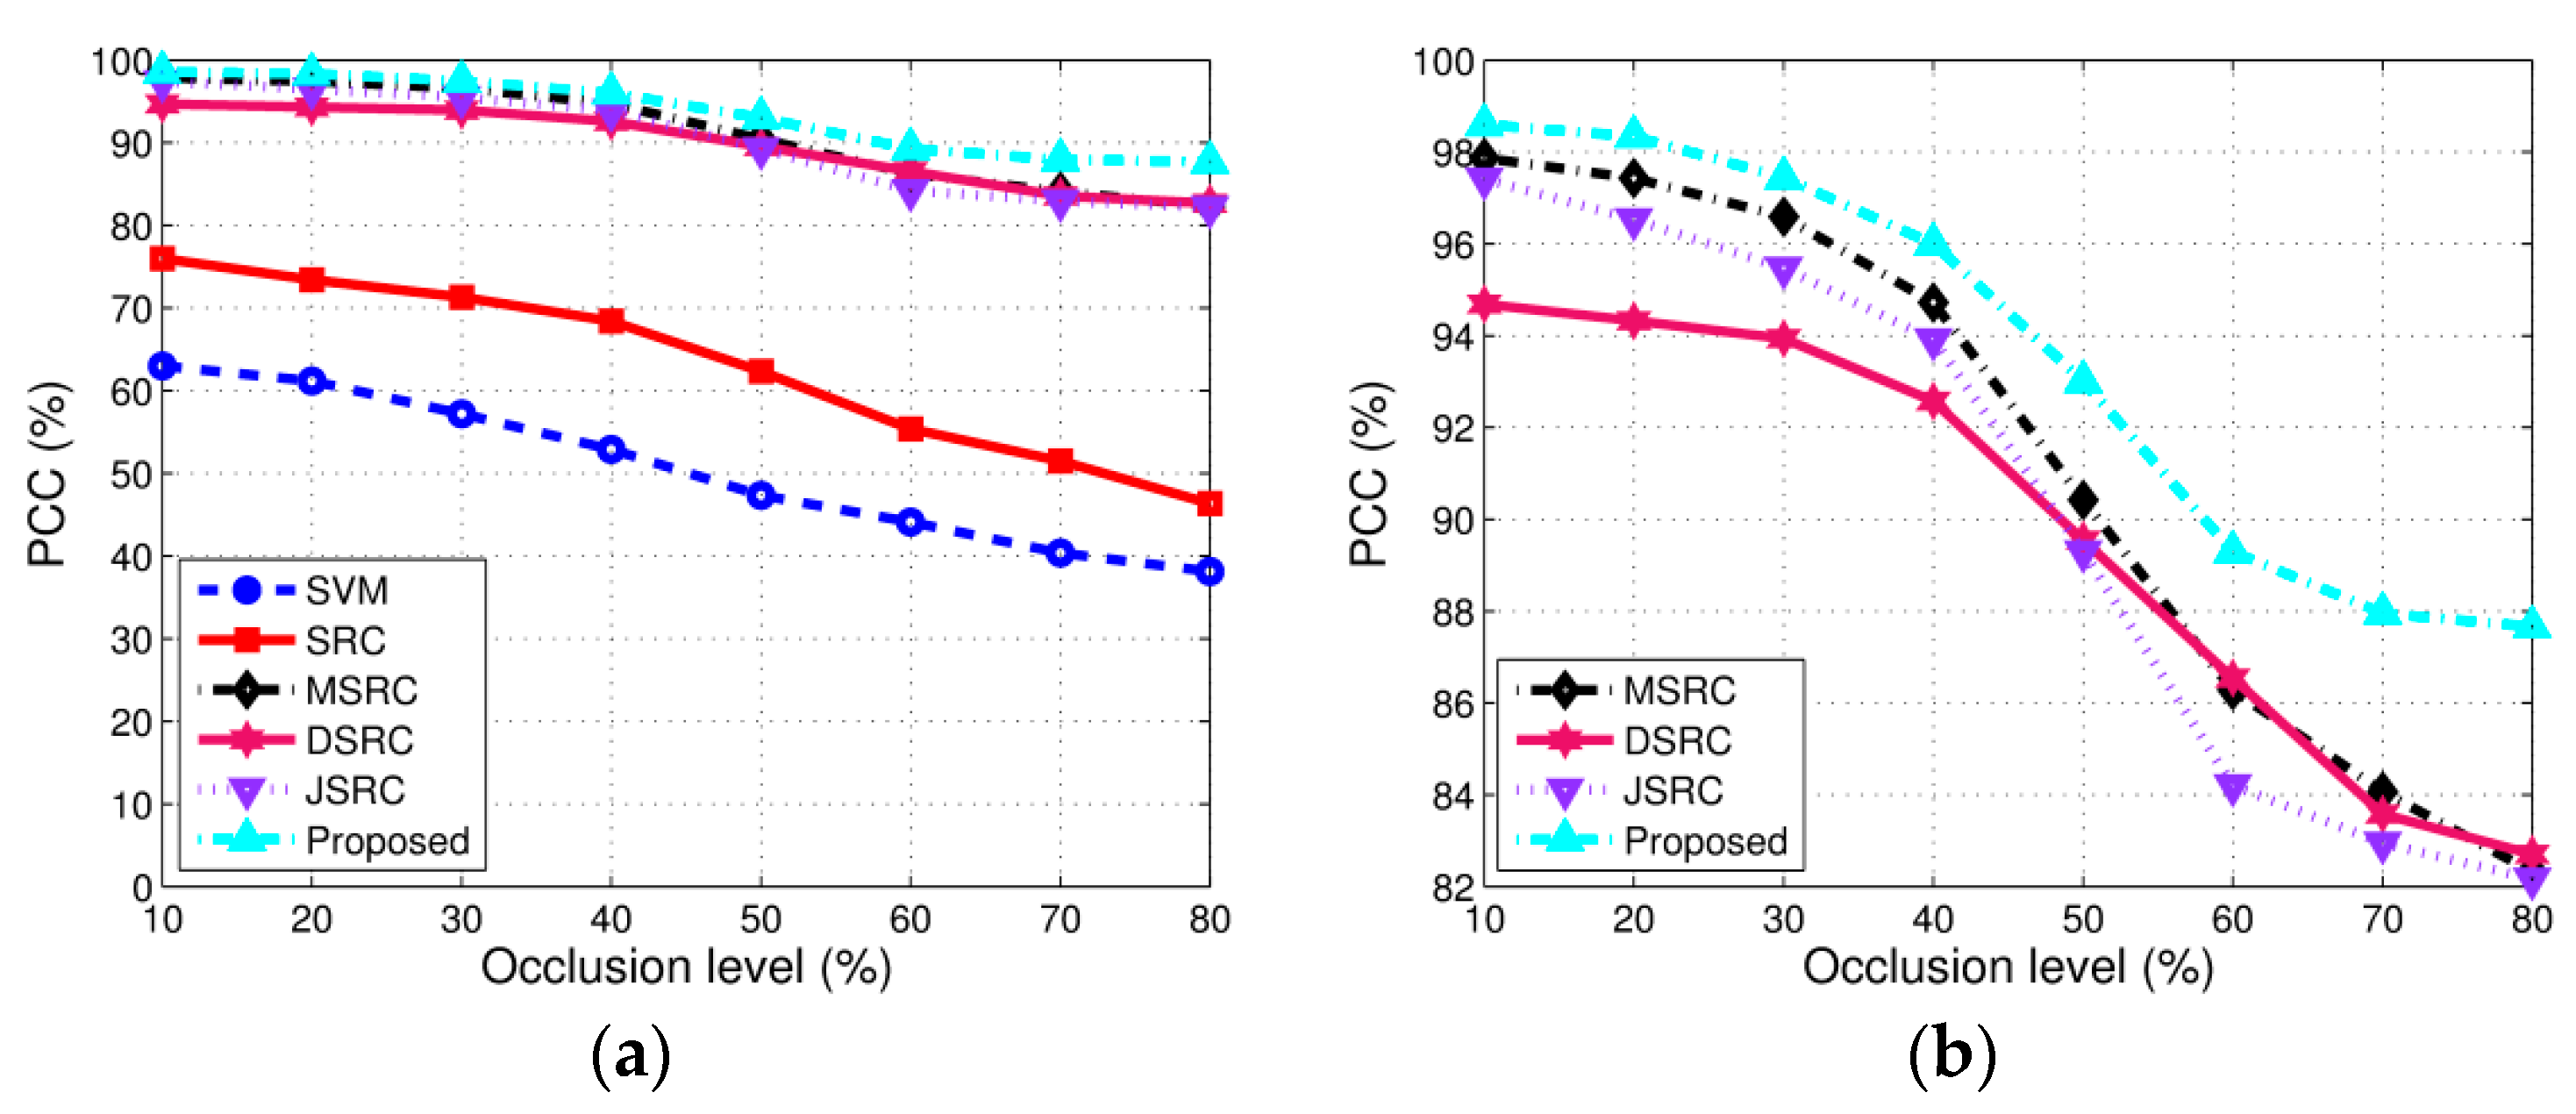
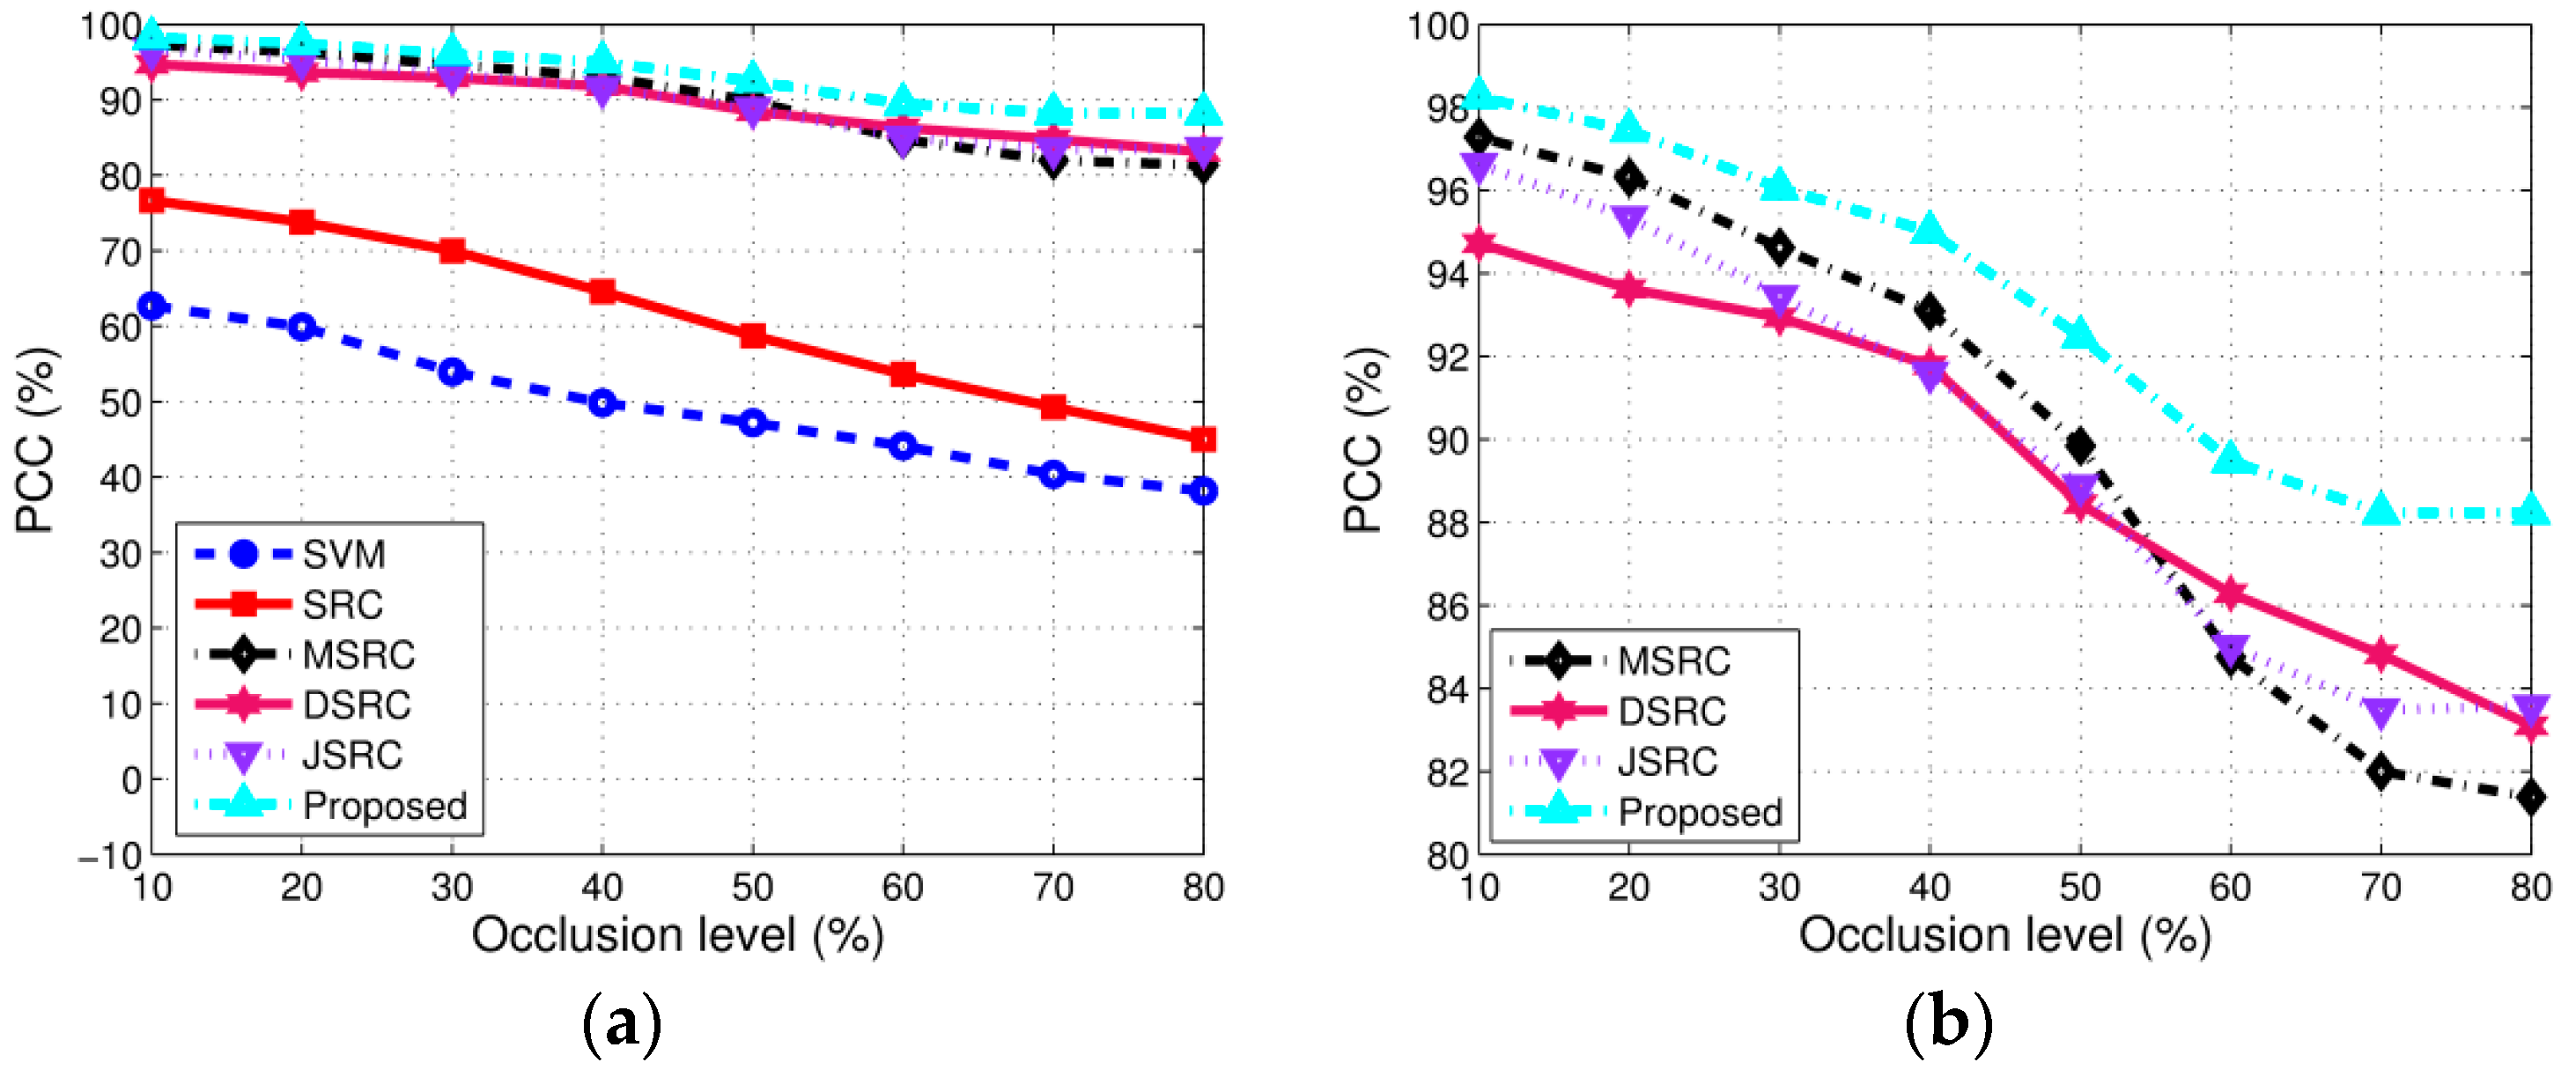
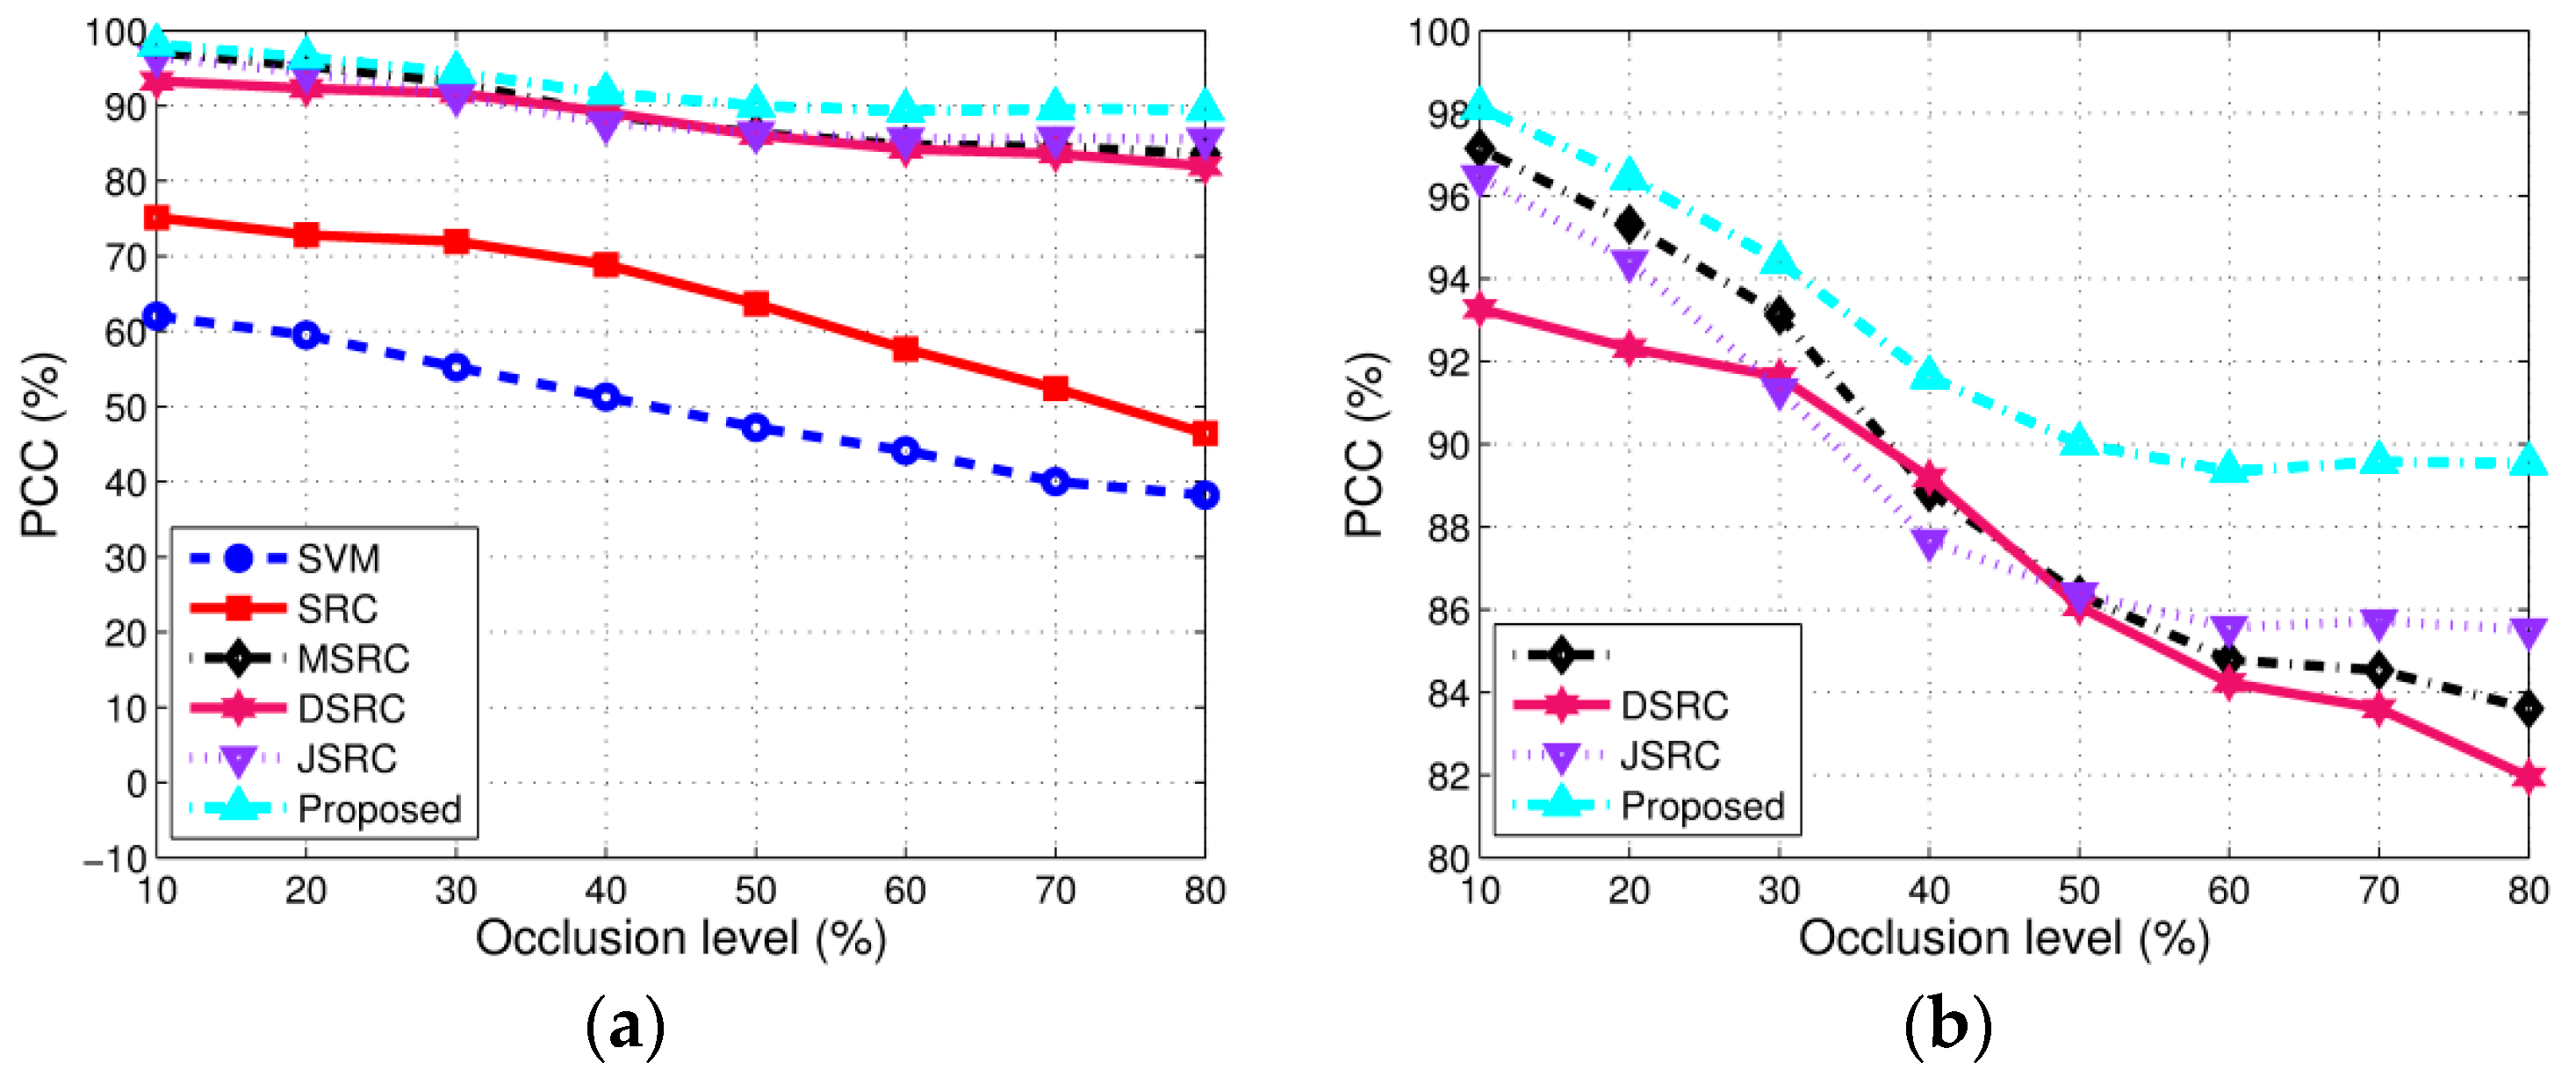
The target may be occluded by obstacles, so it is meaningful to test the ATR algorithms under partial occlusion. As there are no accepted empirical models of object occlusion in SAR imagery, we consider the occlusion to occur possibly from eight different directions as in Ref. [25]. To simulate the occluded target, the target region is first segmented using the algorithm in Ref. [26]. Then, different levels of partial occlusion are simulated by occluding different proportions of the target region from the eight directions. Figure 10 shows 20 percent occluded images from eight directions.
The experimental implementation in this part is similar to the former one except that the noise corruption is replaced by partial occlusion. Figure 11, Figure 12, Figure 13 and Figure 14 show the results of different methods at directions 1, 3, 5, and 7 (due to the symmetry, the other directions are not presented). In each figure, subfigure (a) compares the performance of all of the methods and subfigure (b) presents a detailed comparison of the multi-view methods. Clearly, the multi-view methods gain significant improvement over the single view methods and the proposed method achieves the best performance under partial occlusion. Specifically, with the degradation of partial occlusion, the superiority of the proposed method becomes more and more significant. When the SAR image is severely occluded, it actually loses the discriminability required for target recognition; thus, it is preferable to discard it in multi-view recognition. It also can be observed from the results under noise corruption and partial occlusion that SRC achieves better performance than SVM, which is consistent with the conclusions in Ref. [9].
4.3.4. Resolution Variance
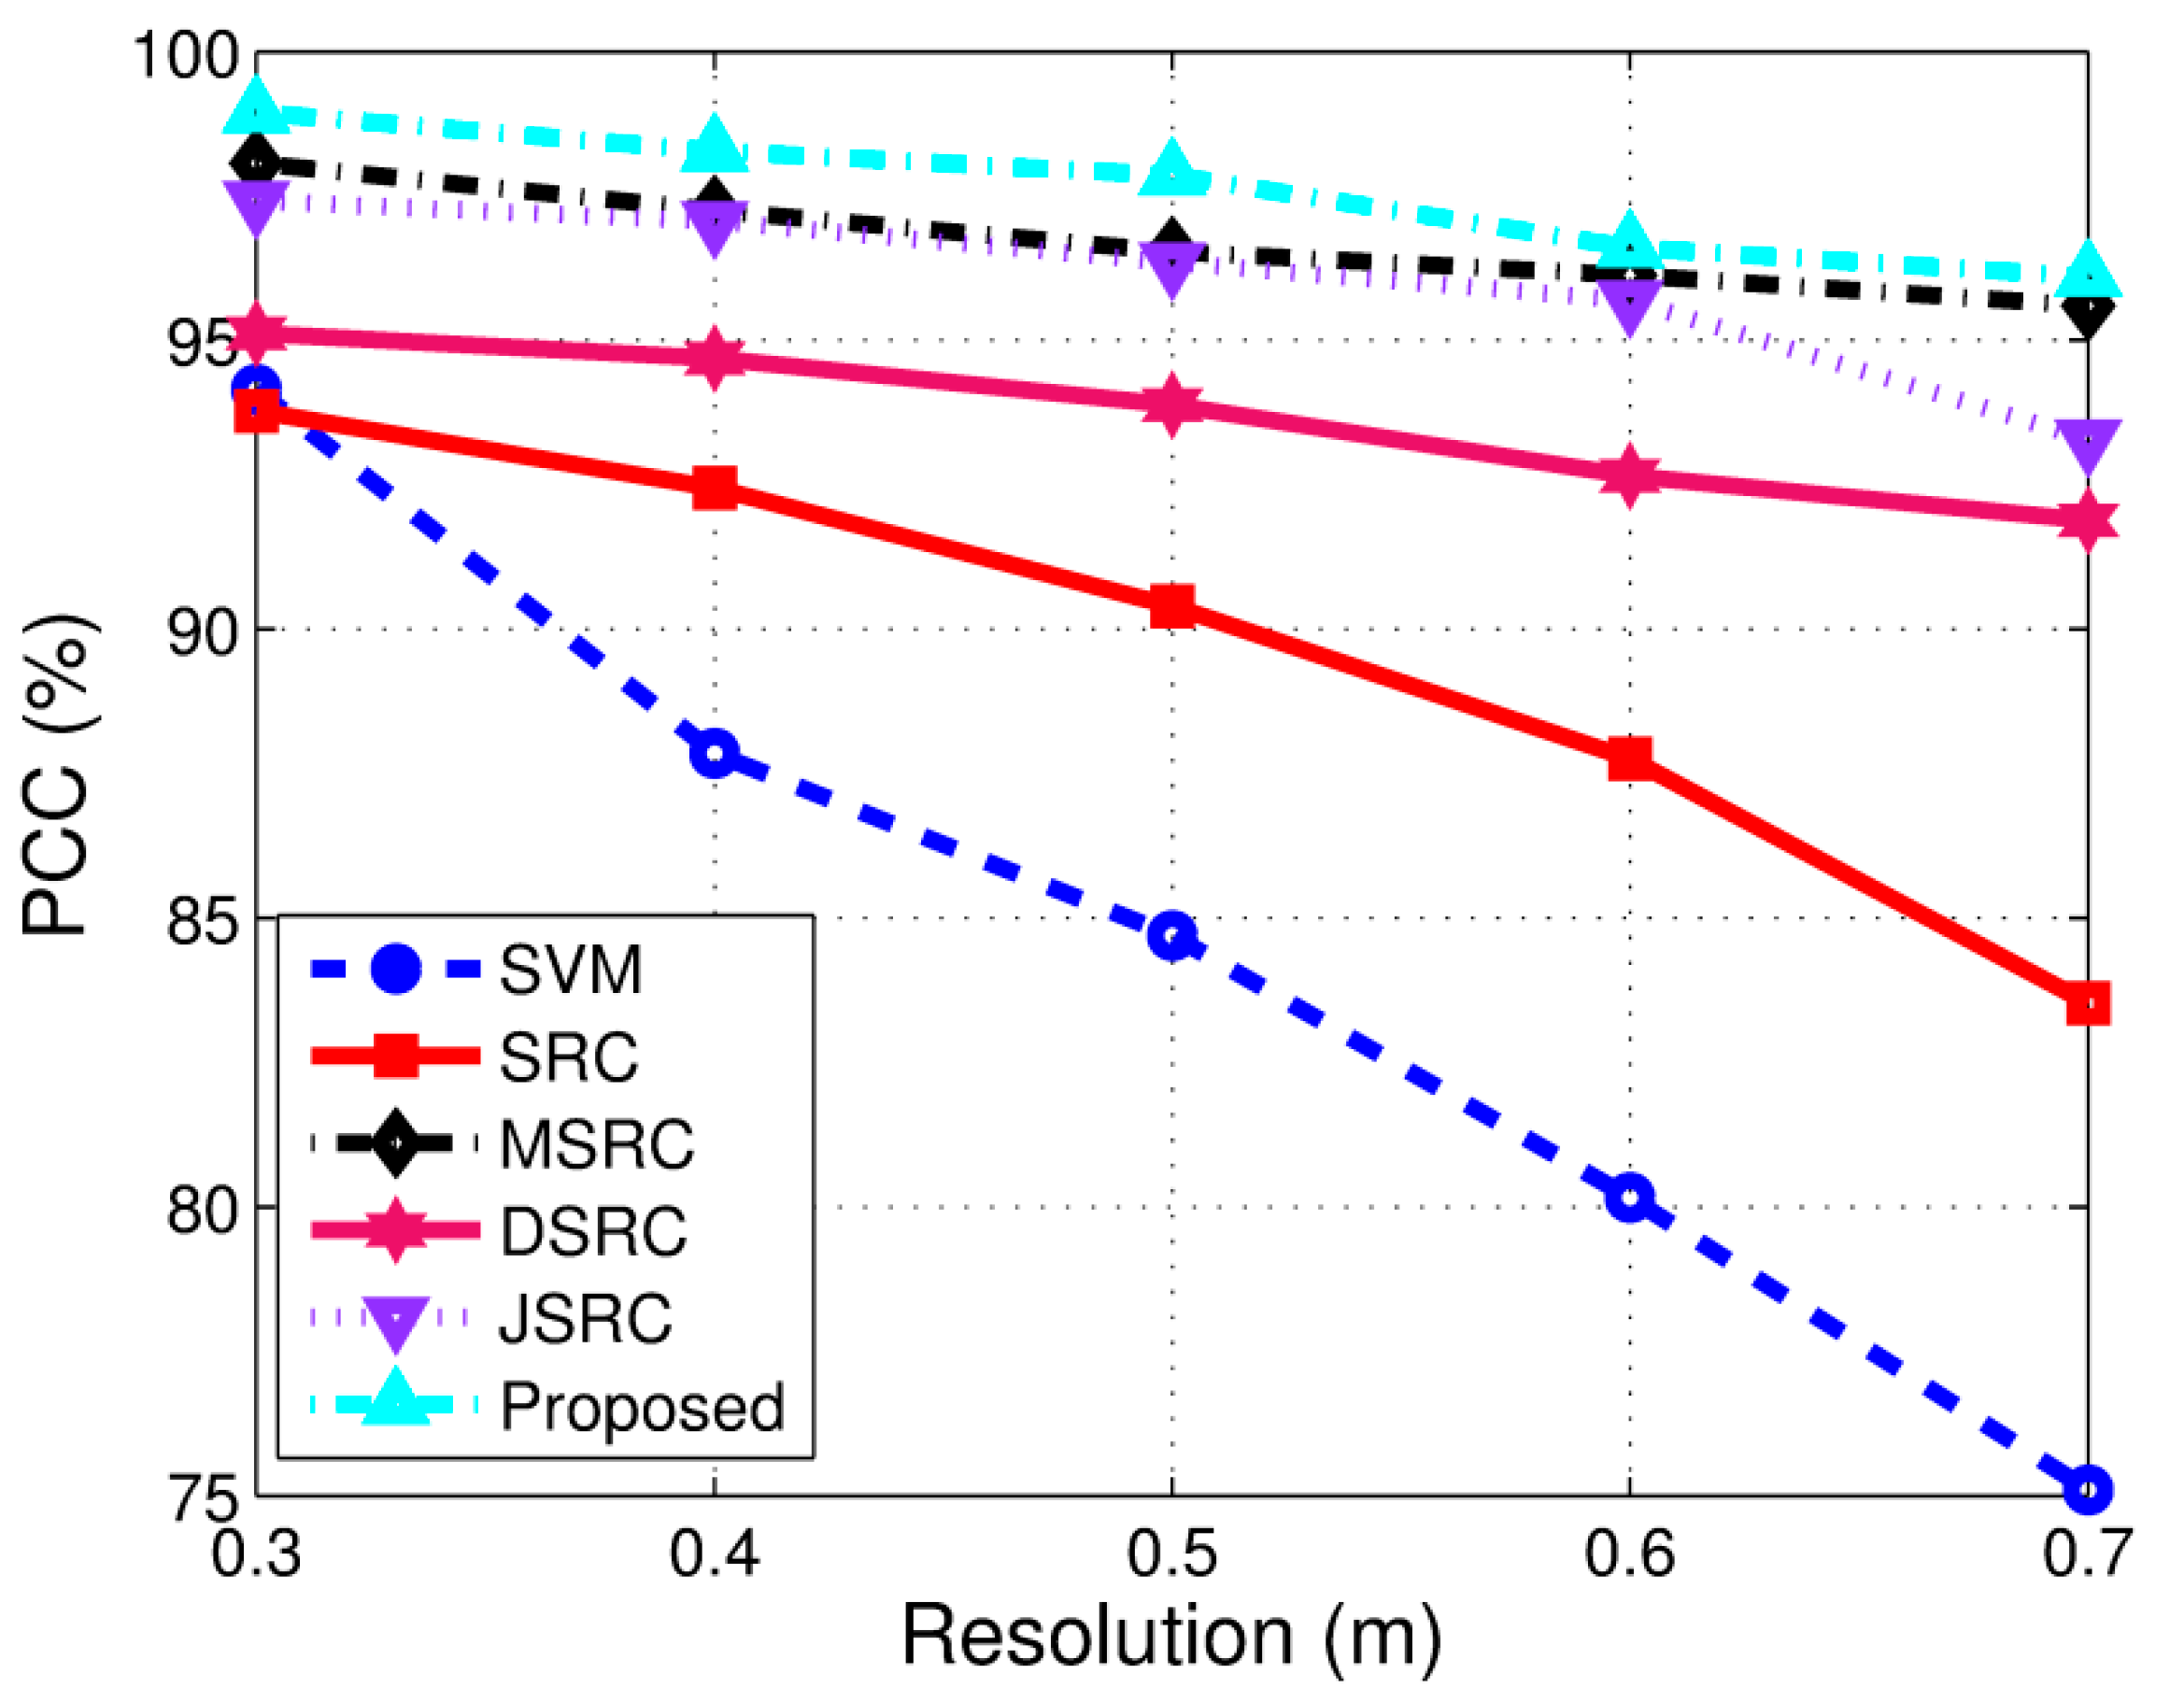
Due to the variation of SAR sensors, it is possible that multi-view SAR images may have some different resolutions. Figure 15 shows the SAR images of the same target at different resolutions from 0.3 m to 0.7 m.
With a similar experimental setup to the former two experiments, the results of different methods are plotted in Figure 16. Compared with EOCs such as noise corruption and partial occlusion, the resolution variance causes less degradation to the ATR method’s performance. It is also noticeable that SRC has a much greater PCC than SVM. With the highest PCC, the proposed method enjoys the best effectiveness and robustness among all the methods.
4.4. Recognition under Different Thresholds
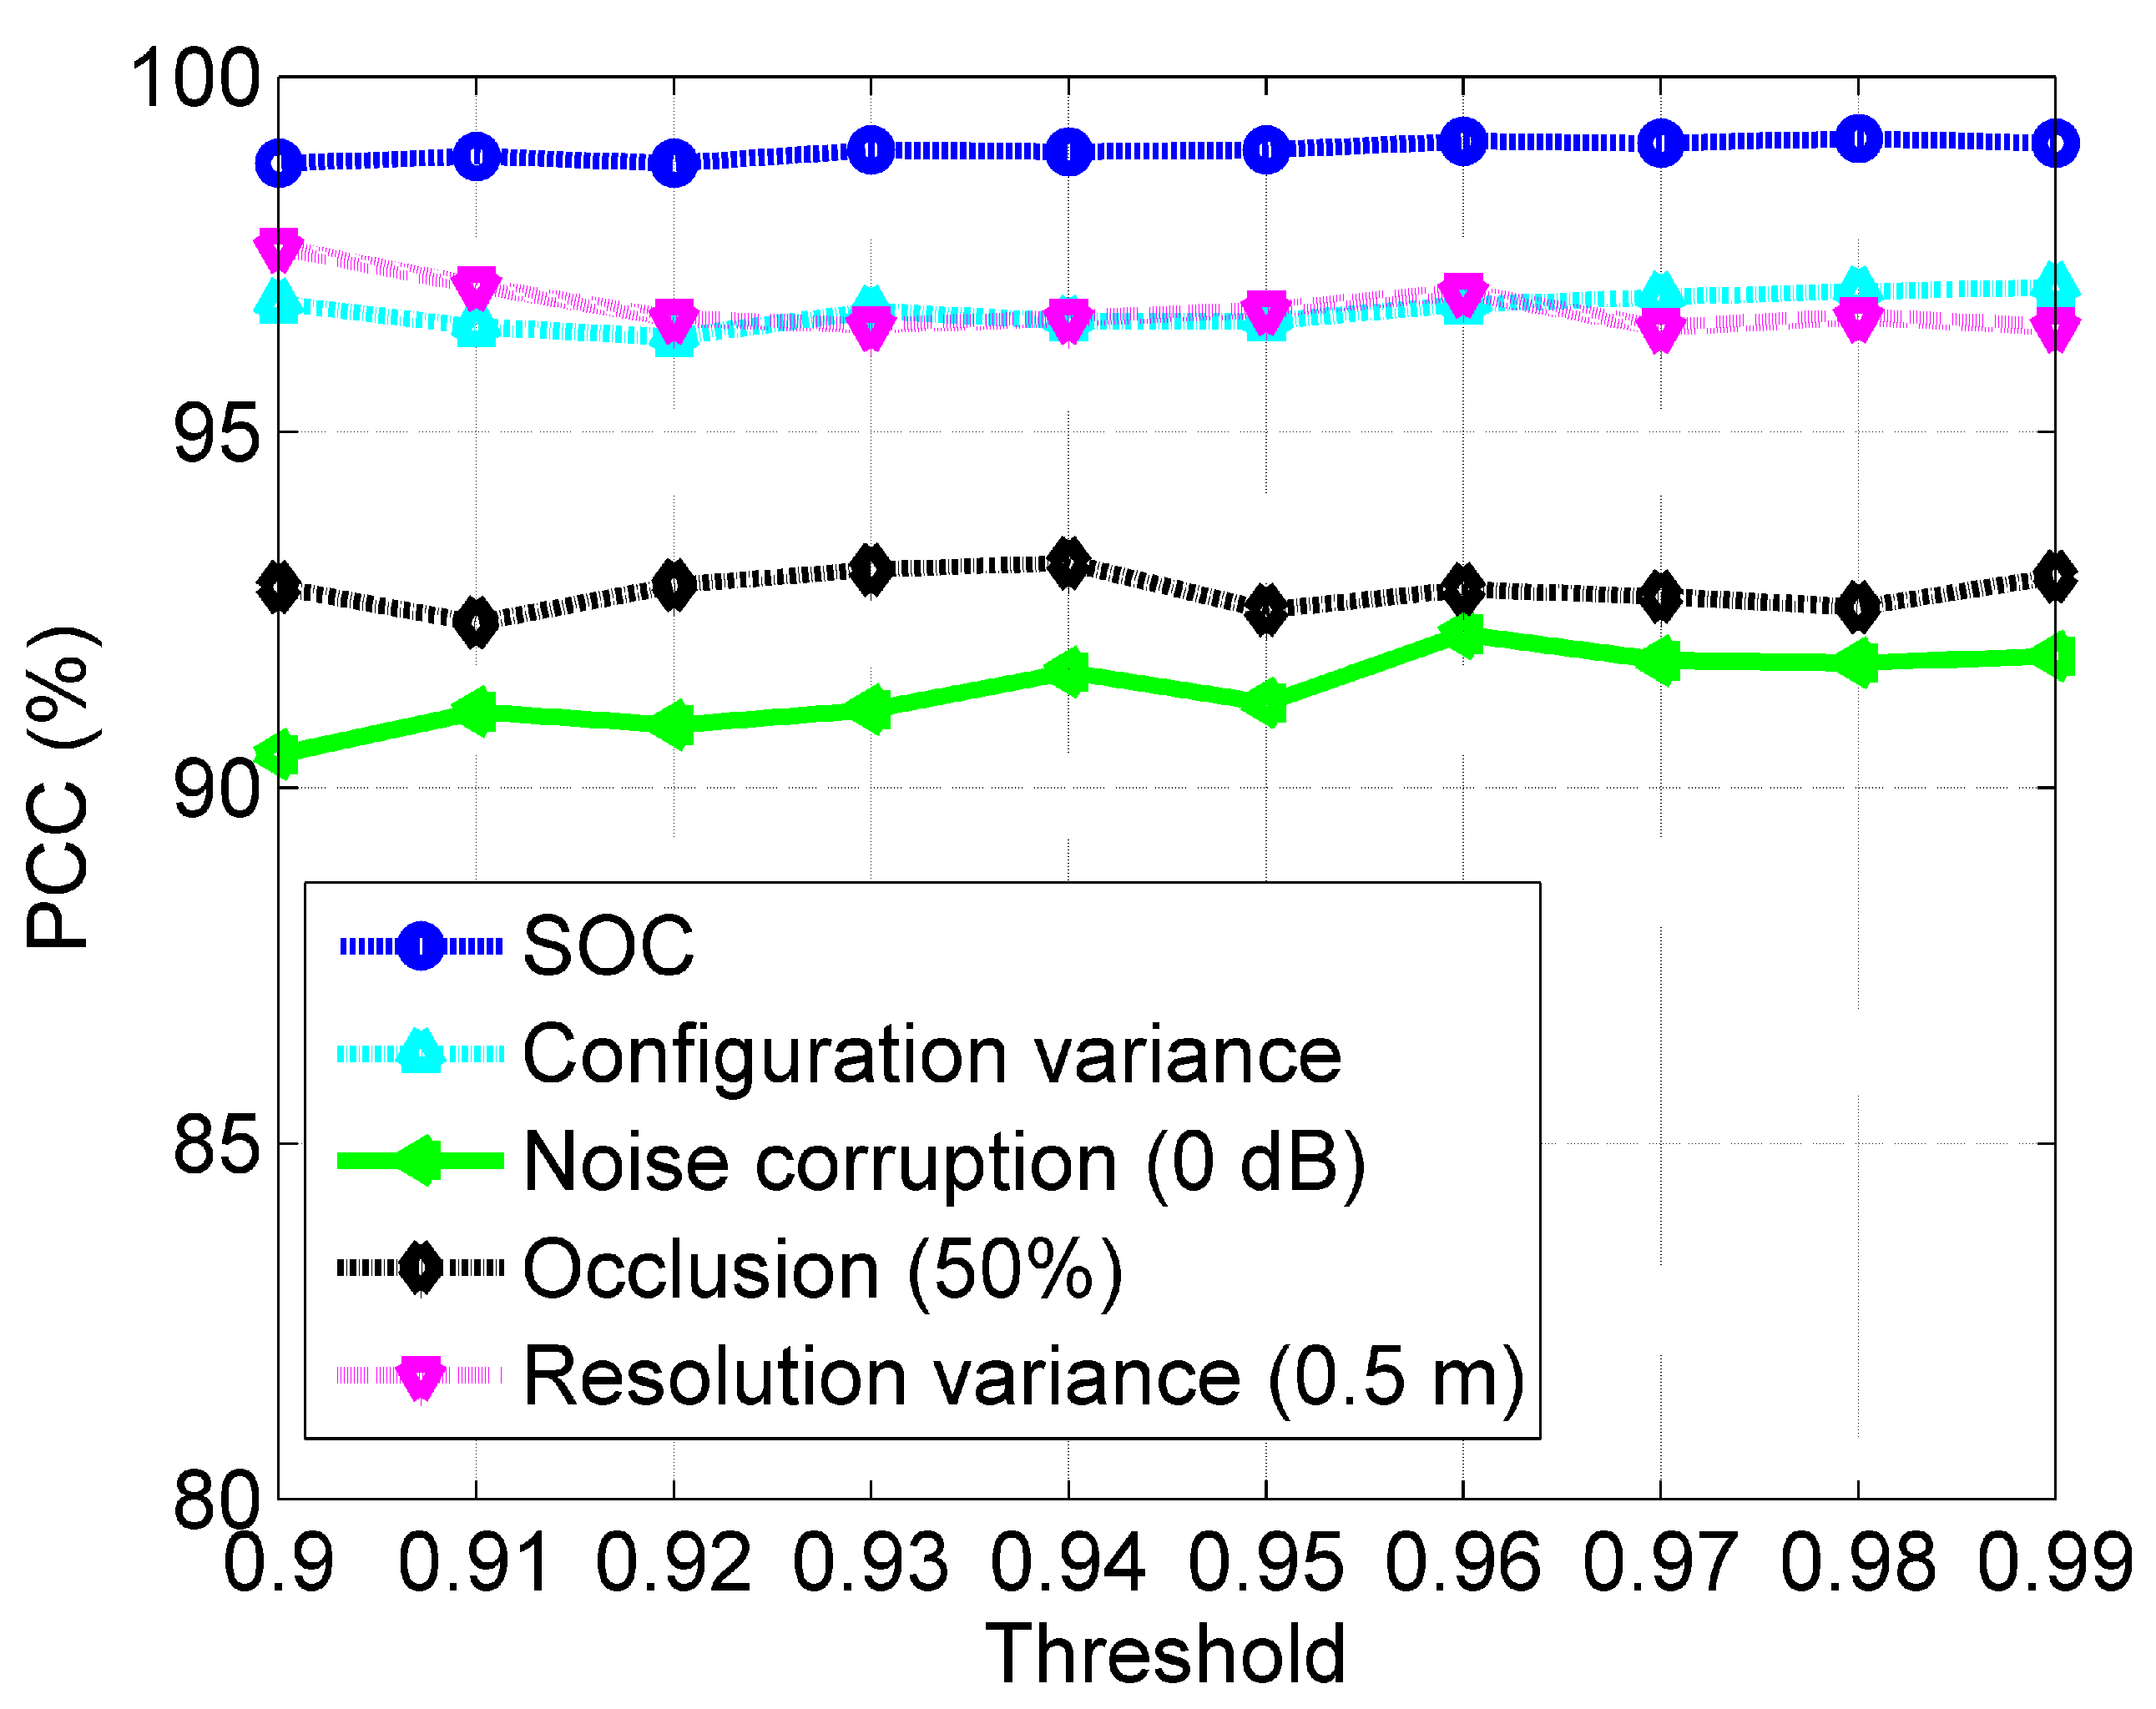
One of the key parameters in the proposed method is the reliability level threshold. Actually, it is a nuisance problem that is used to determine the threshold. In order to provide some insights into the threshold’s determination, we test the proposed method at different thresholds. As shown in Figure 17, the performance under SOC improves with the increase of the threshold. Actually, most of the samples under SOC are discriminative for target recognition. Therefore, it is preferable that all the views are used for recognition. For EOC recognition, the highest PCCs are achieved at different thresholds for different EOCs. Specially, for the MSTAR dataset, a proper threshold is 0.96 for performance under all conditions, which is relatively high.
5. Conclusions
This paper proposes an SAR target recognition method by exploiting the information contained in multi-view SAR images. Each of the input multi-view SAR images is first examined by SRC to evaluate its validity for multi-view recognition. Then, the selected views are jointly recognized using JSR. To improve the adaptability of JSR, an enhanced local dictionary is constructed based on the selected atoms by SRC. Extensive experiments are conducted on the MSTAR dataset under SOC and various EOCs, and a comparison is made with several state-of-the-art methods including SVM, SRC, MSRC, DSRC, and JSRC. Based on the experimental results, conclusions can be drawn as follows: (1) the multi-view methods can significantly improve the ATR method’s performance compared with single view methods; (2) the proposed method can better exploit multi-view SAR images to improve the ATR method’s performance under SOC; and (3) the proposed method can significantly enhance the robustness of an ATR system to various EOCs.
Acknowledgments
This work was supported by the Program for New Century Excellent Talents in University of China under Grant No. NCET-11-0866.
Author Contributions
Baiyuan Ding proposed the general idea of the method and performed the experiments. Gongjian Wen reviewed the idea and provided many suggestive advices. This manuscript was written by Baiyuan Ding.
Conflicts of Interest
The authors declare no conflict of interest.
References
- El-Darymli, K.; Gill, E.W.; McGuire, P.; Power, D.; Moloney, C. Automatic Target Recognition in Synthetic Aperture Radar Imagery: A State-of-the-Art Review. IEEE Access 2016, 4, 6014–6058. [Google Scholar] [CrossRef]
- Mishra, A.K. Validation of PCA and LDA for SAR ATR. In Proceedings of the 2008 IEEE Region 10 Conference, Hyderabad, India, 19–21 November; pp. 1–6.
- Ding, B.Y.; Wen, G.J.; Ma, C.H.; Yang, X.L. Decision fusion based on physically relevant features for SAR ATR. IET Radar Sonar Navig. 2017, 11, 682–690. [Google Scholar] [CrossRef]
- Ding, B.Y.; Wen, G.J.; Zhong, J.R.; Ma, C.H. A robust similarity measure for attributed scattering center sets with application to SAR ATR. Neurocomputing 2017, 219, 130–143. [Google Scholar] [CrossRef]
- Ding, B.Y.; Wen, G.J.; Huang, X.H.; Ma, C.H.; Yang, X.L. Target recognition in synthetic aperture radar images via matching of attributed scattering centers. IEEE J. Sel. Top. Appl. Earth Obs. Remote Sens. 2017, 10, 3334–3347. [Google Scholar] [CrossRef]
- Dong, G.G.; Kuang, G.Y.; Wang, N.; Zhao, L.J.; Lu, J. SAR target recognition via joint sparse representation of monogenic signal. IEEE J. Sel. Top. Appl. Earth Obs. Remote Sens. 2015, 8, 3316–3328. [Google Scholar] [CrossRef]
- Zhao, Q.; Principe, J.C. Support Vector Machines for Synthetic Radar Automatic Target Recognition. IEEE Trans. Aerosp. Electron. Syst. 2001, 37, 643–654. [Google Scholar] [CrossRef]
- Thiagarajan, J.; Ramamurthy, K.; Knee, P.P.; Spanias, A.; Berisha, V. Sparse representation for automatic target classification in SAR images. In Proceedings of the 2010 4th Communications, Control and Signal Processing (ISCCSP), Limassol, Cyprus, 3–5 March 2010. [Google Scholar]
- Wright, J.; Yang, A.; Ganesh, A.; Sastry, S.; Ma, Y. Robust face recognition via sparse representation. IEEE Trans. Pattern Anal. Mach. Intell. 2009, 31, 210–227. [Google Scholar] [CrossRef] [PubMed]
- Chen, S.Z.; Wang, H.P.; Xu, F.; Jin, Y.Q. Target classification using the deep convolutional networks for SAR images. IEEE Trans. Geosci. Remote Sens. 2016, 47, 1685–1697. [Google Scholar] [CrossRef]
- Ding, B.Y.; Wen, G.J.; Huang, X.H.; Ma, C.H.; Yang, X.L. Target recognition in SAR images by exploiting the azimuth sensitivity. Remote Sens. Lett. 2017, 8, 821–830. [Google Scholar] [CrossRef]
- Schmitt, M.; Maksymiuk, O.; Magnard, C.; Stilla, U. Radargrammetric registration of airborne multi-aspect SAR data of urban areas. ISPRS J. Photogramm. Remote Sens. 2013, 86, 11–20. [Google Scholar] [CrossRef]
- Schmitt, M.; Zhu, X.X. Data fusion and remote sensing: An ever-growing relationship. IEEE Geosci. Remote Sens. Mag. 2016, 4, 6–23. [Google Scholar] [CrossRef]
- Brendel, G.; Horowitz, L. Benefits of aspect diversity for SAR ATR: Fundamental and experimental results. In Proceedings of the SPIE, Orlando, FL, USA, 24 August 2000; pp. 567–578. [Google Scholar]
- Brown, M.Z. Analysis of multiple-view Bayesian classification for SAR ATR. In Proceedings of the SPIE, Orlando, FL, USA, 12 September 2003; pp. 265–274. [Google Scholar]
- Bhanu, B.; Jones, G. Exploiting azimuthal variance of scatterers for multiple look SAR recognition. In Proceedings of the SPIE, Riverside, CA, USA, 1 August 2003; pp. 290–298. [Google Scholar]
- Ettinger, G.; Snyder, W. Model-based fusion of multi-look SAR for ATR. In Proceedings of the SPIE, Orlando, FL, USA, 1 August 2002; pp. 277–289. [Google Scholar]
- Vespe, M.; Baker, C.J.; Griffiths, H.D. Aspect dependent drivers for multi-perspective target classification. In Proceedings of the IEEE Conference on Radar, Verona, NY, USA, 24–27 April 2006; pp. 256–260. [Google Scholar]
- Huan, R.H.; Pan, Y. Target recognition of multi-aspect SAR images with fusion strategies. Prog. Electromagn. Res. 2013, 134, 267–288. [Google Scholar] [CrossRef]
- Zhang, H.C.; Nasrabadi, N.M.; Zhang, Y.N.; Huang, T.S. Multi-view automatic target recognition using joint sparse representation. IEEE Trans. Aerosp. Electron. Syst. 2012, 48, 2481–2497. [Google Scholar] [CrossRef]
- Tropp, J.A.; Gilbert, A.C.; Strauss, M.J. Algorithms for simultaneous sparse approximation. EURASIP J. Adv. Appl. Signal Process. 2006, 589–602. [Google Scholar]
- Rakotomamonjy, A. Surveying and comparing simultaneous sparse approximation (or group lasso) algorithms. Signal Process. 2011, 91, 1505–1526. [Google Scholar] [CrossRef]
- Doo, S.; Smith, G.; Baker, C. Target Classification Performance as a Function of Measurement Uncertainty. In Proceedings of the 5th Asia-Pacific Conference on Synthetic Aperture Radar (APSAR), Singapore, 1–4 September 2015. [Google Scholar]
- Zhou, J.X.; Shi, Z.G.; Cheng, X.; Fu, Q. Automatic target recognition of SAR images based on global scattering center model. IEEE Trans. Geosci. Remote Sens. 2011, 10, 3713–3729. [Google Scholar]
- Jones, G.; Bhanu, B. Recognition of articulated and occluded objects. IEEE Trans. Pattern Anal. Mach. Intell. 1999, 21, 603–613. [Google Scholar] [CrossRef]
- Sun, Y.J.; Liu, Z.P.; Todorovic, S.; Li, J. Adaptive boosting for SAR automatic target recognition. IEEE Trans. Aerosp. Electron. Syst. 2007, 43, 112–125. [Google Scholar] [CrossRef]
Figure 1.
Two configurations of the T72 tank: (a) A04; and (b) A05.

Figure 2.
Examples of environment variation: (a) Target occluded by trees; (b) Target occluded by a wall; and (c) Target occluded by a wall from another view.
Figure 2.
Examples of environment variation: (a) Target occluded by trees; (b) Target occluded by a wall; and (c) Target occluded by a wall from another view.
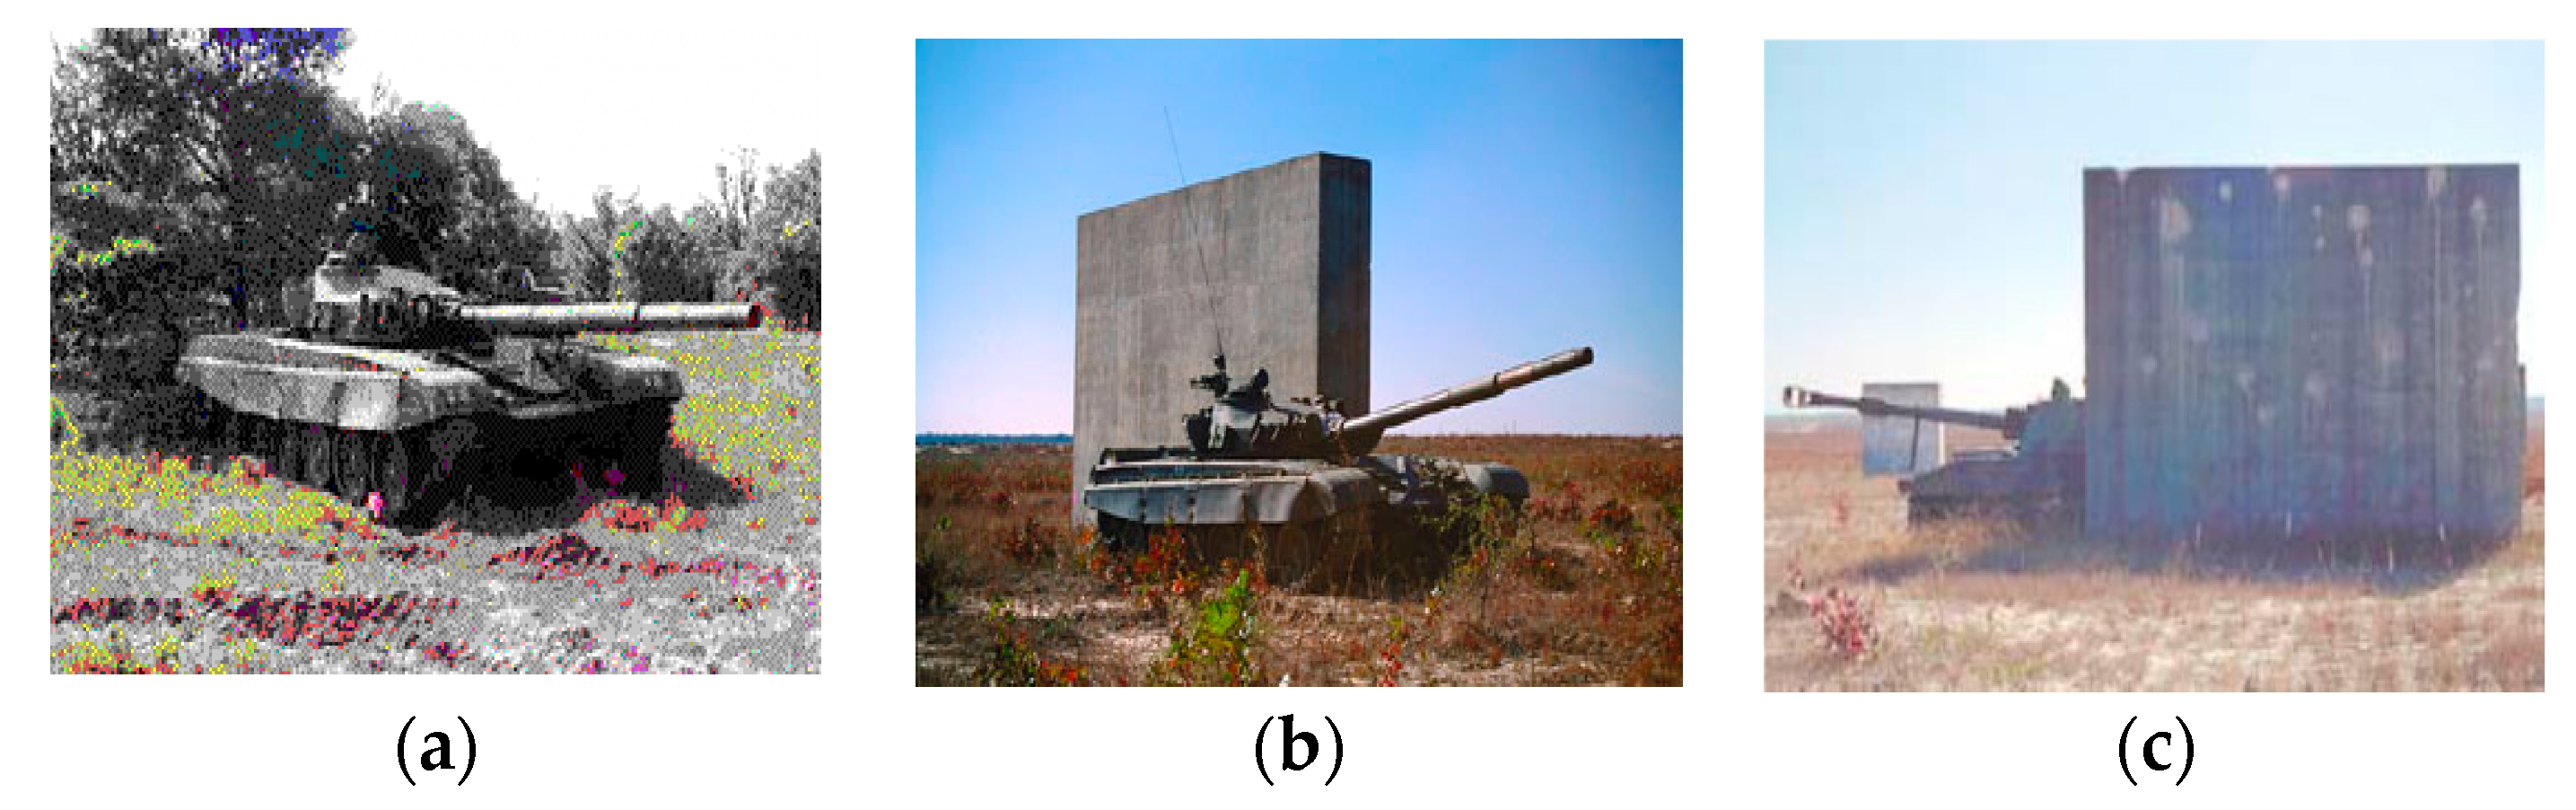
Figure 3.
Illustration of the collection of multi-view synthetic aperture radar (SAR) images: (a) Consecutive views by the sensor; (b) Views with different azimuths from different sensors; and (c) Views from air-borne and satellite-based sensors.
Figure 3.
Illustration of the collection of multi-view synthetic aperture radar (SAR) images: (a) Consecutive views by the sensor; (b) Views with different azimuths from different sensors; and (c) Views from air-borne and satellite-based sensors.
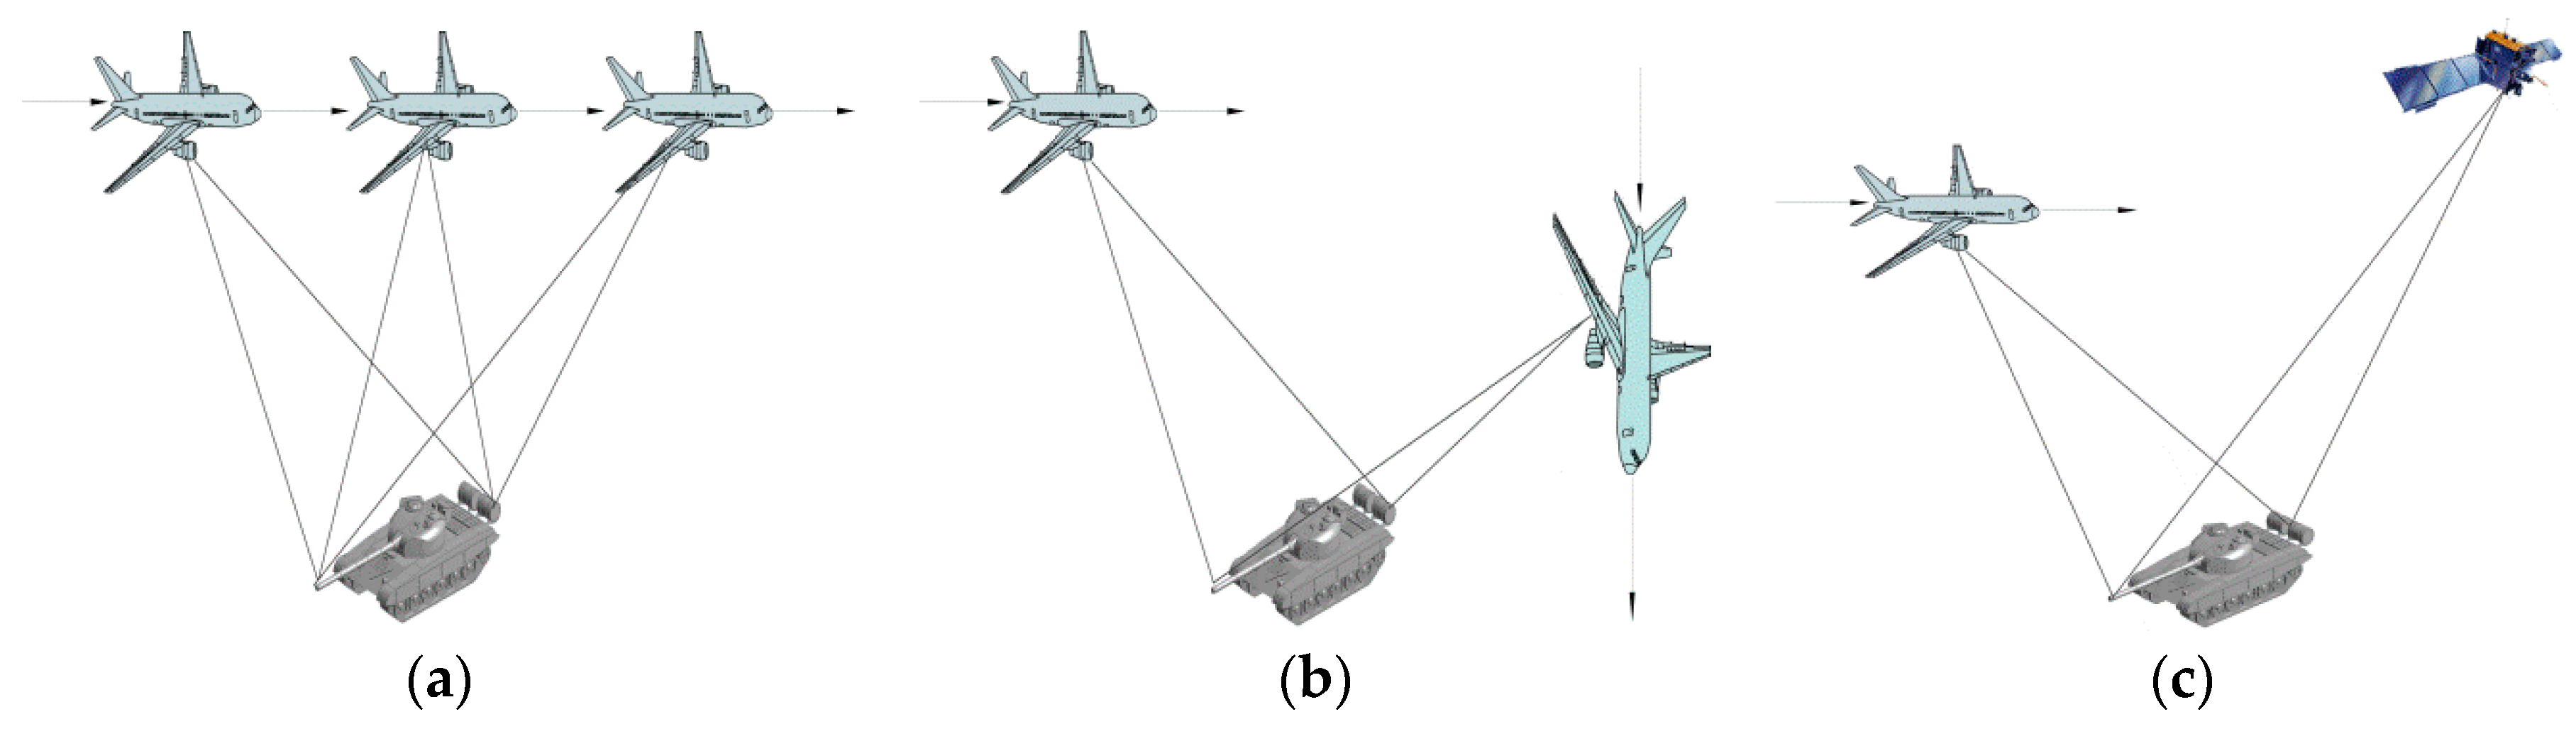
Figure 4.
The framework of the proposed method. SRC: sparse representation-based classification; JSR: joint sparse representation.
Figure 4.
The framework of the proposed method. SRC: sparse representation-based classification; JSR: joint sparse representation.

Figure 5.
Optical images of the ten military targets.

Figure 6.
The PCCs of multi-view methods at fixed view steps.
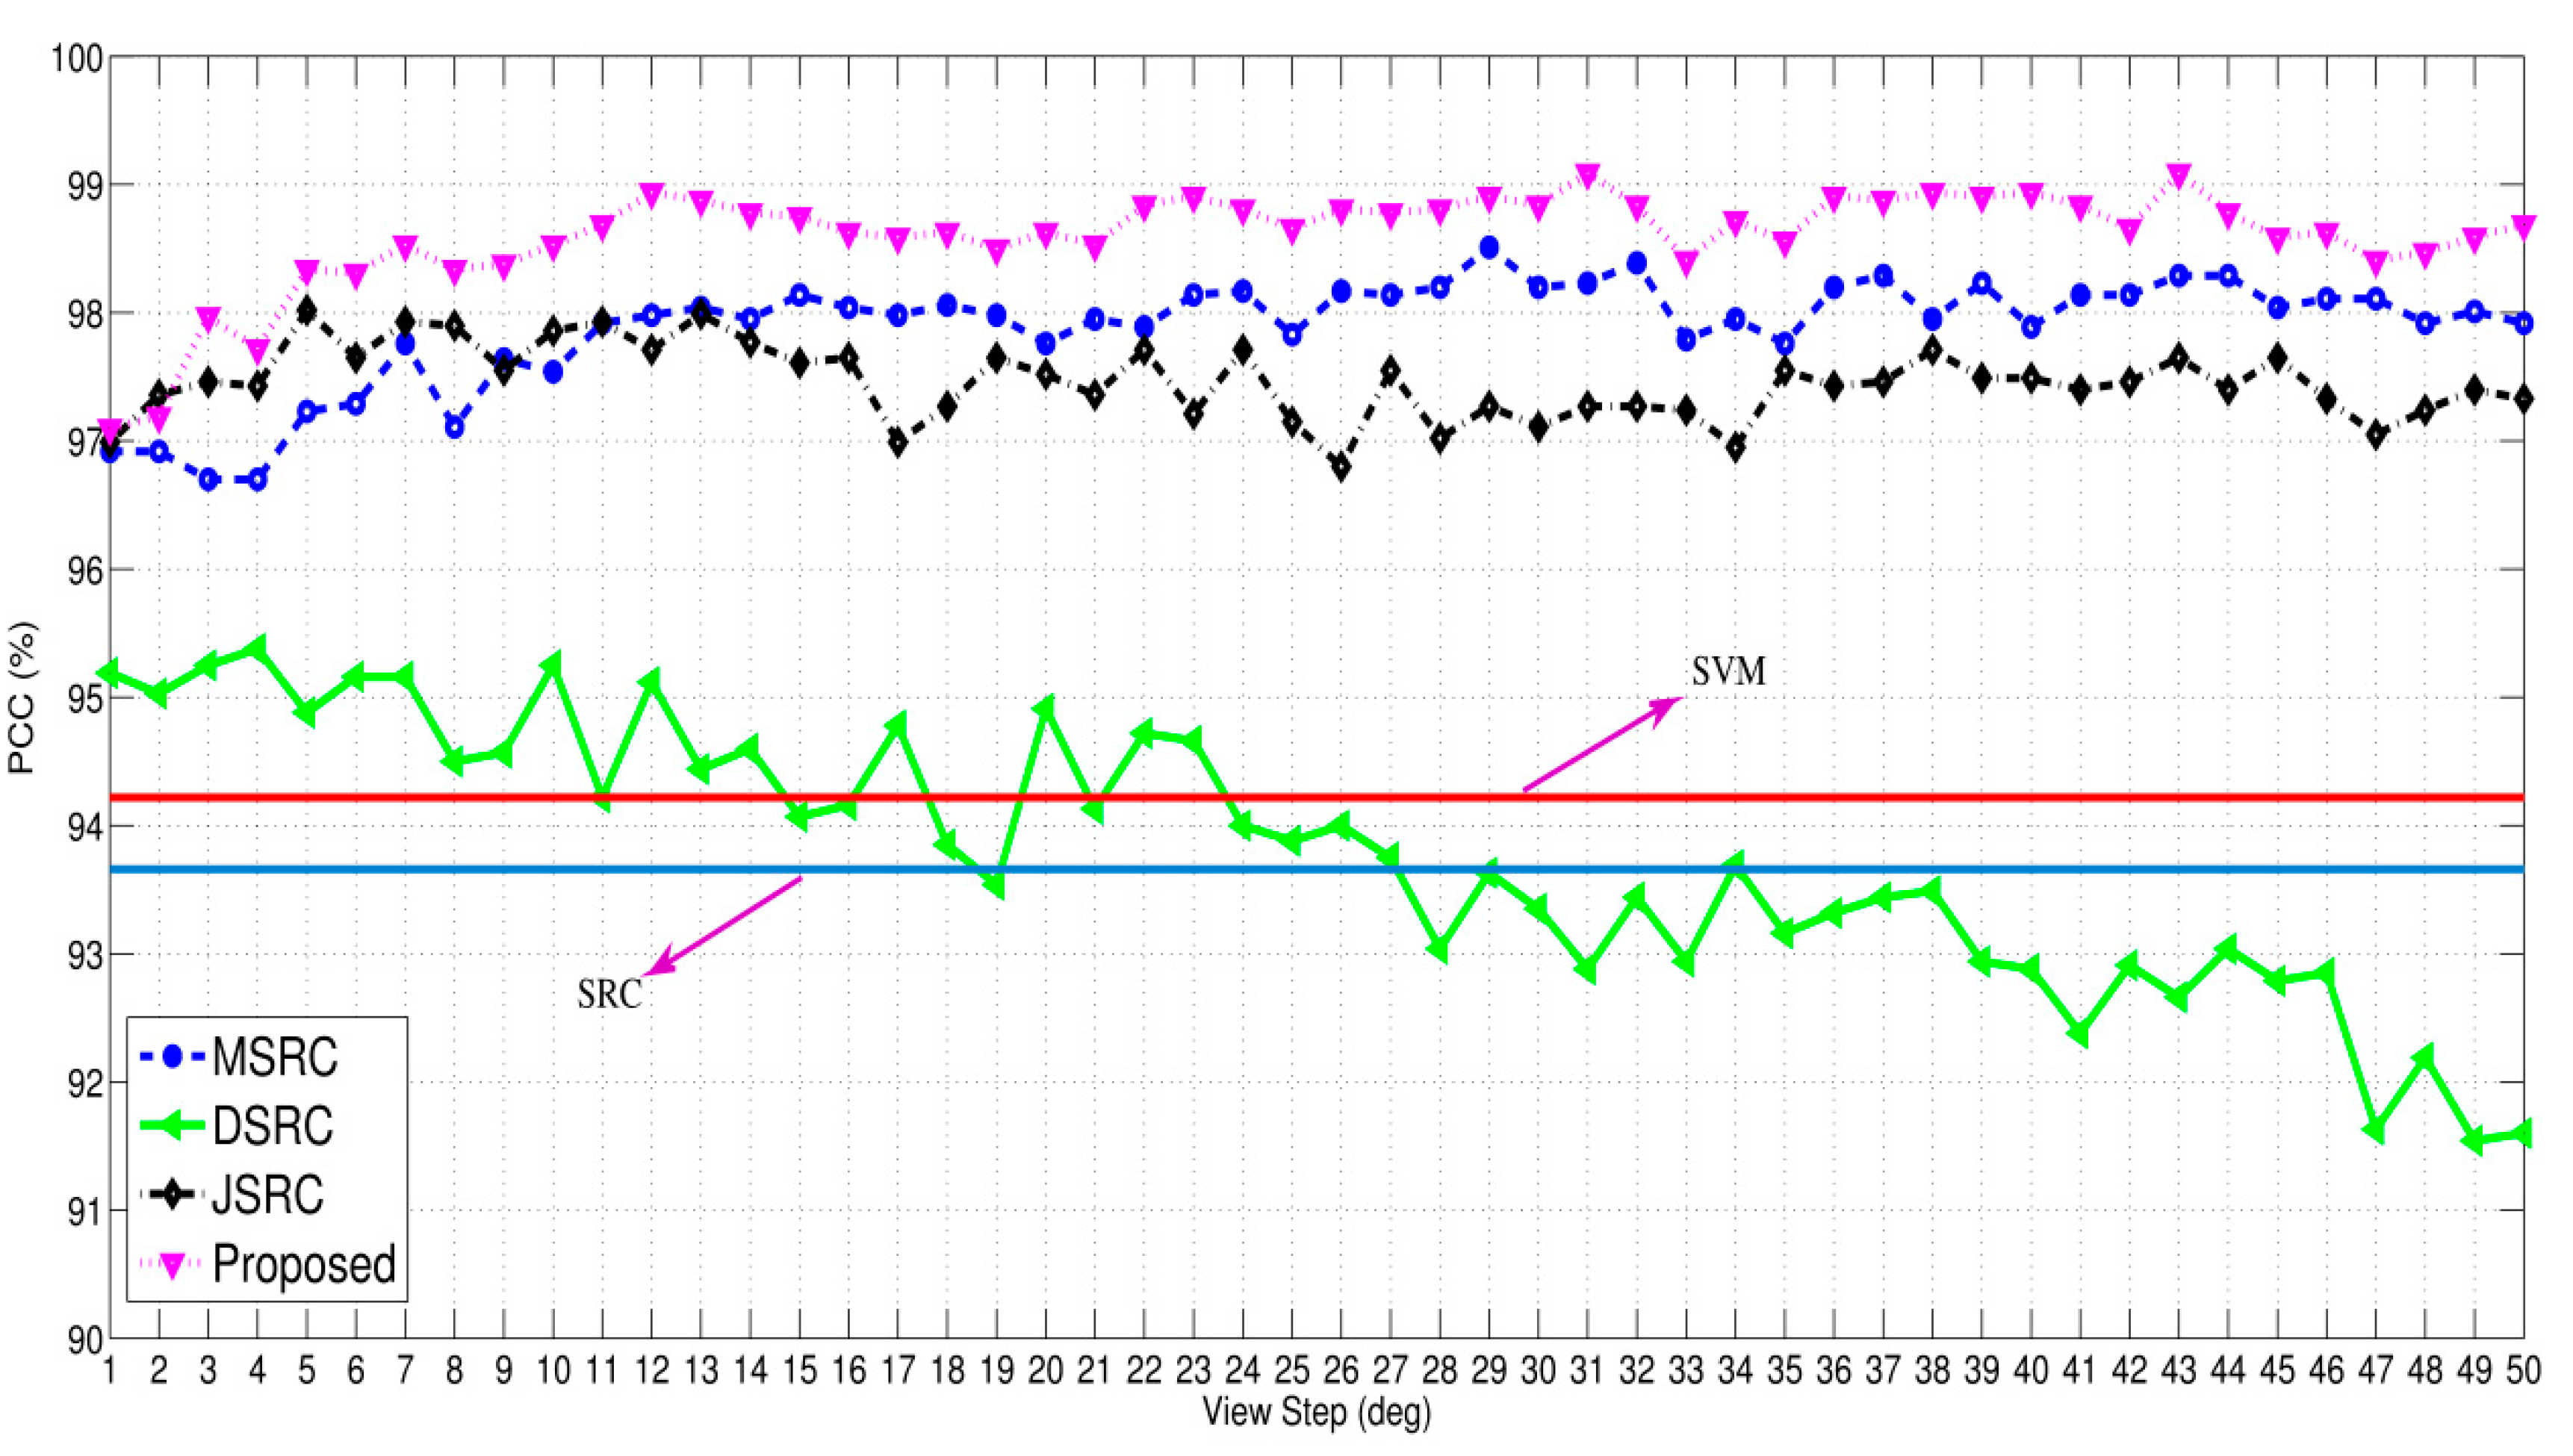
Figure 7.
Procedure of transforming SAR images to the frequency domain. 2D: two-dimensional; FFT: fast Fourier transform.
Figure 7.
Procedure of transforming SAR images to the frequency domain. 2D: two-dimensional; FFT: fast Fourier transform.

Figure 8.
Noise corrupted images at different signal-to-noise ratios (SNRs).

Figure 9.
The PCCs of different methods under different noise levels.

Figure 10.
Twenty percent (20%) occluded images from eight directions.
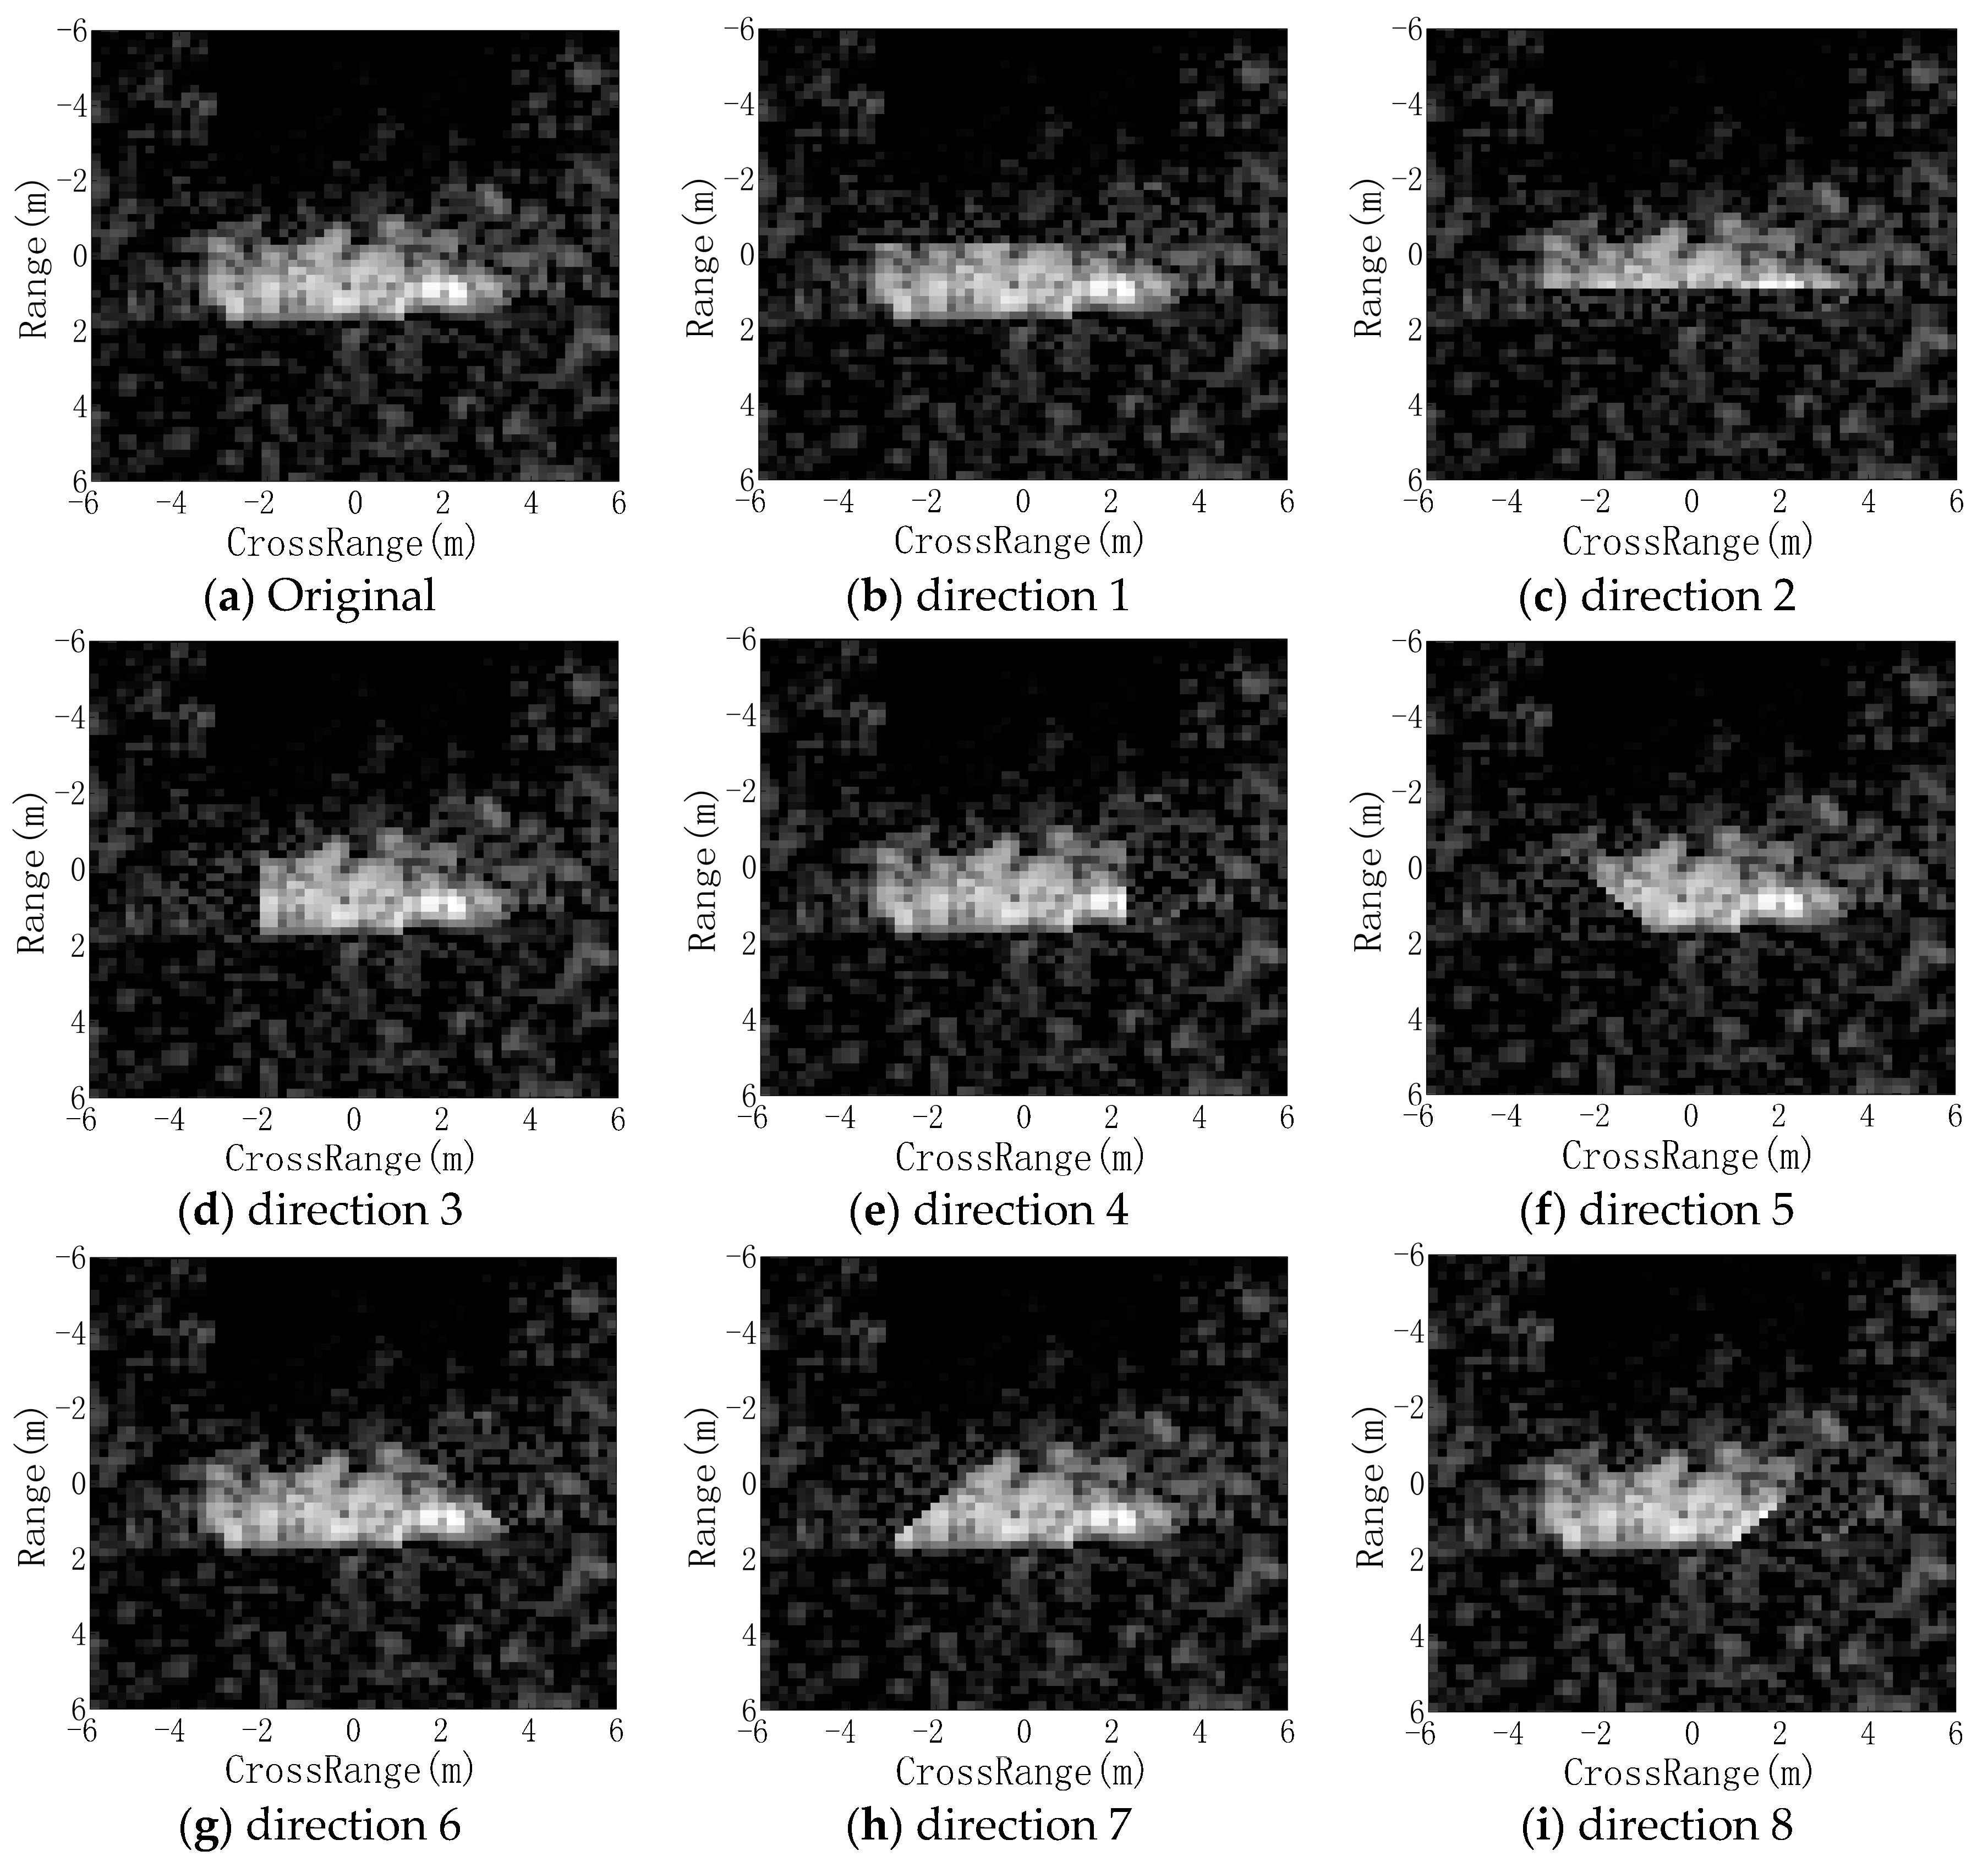
Figure 11.
Performance under partial occlusion from direction 1. (a) Single view methods; (b) Multi-view methods.
Figure 11.
Performance under partial occlusion from direction 1. (a) Single view methods; (b) Multi-view methods.

Figure 12.
Performance under partial occlusion from direction 3. (a) Single view methods; (b) Multi-view methods.
Figure 12.
Performance under partial occlusion from direction 3. (a) Single view methods; (b) Multi-view methods.

Figure 13.
Performance under partial occlusion from direction 5. (a) Single view methods; (b) Multi-view methods.
Figure 13.
Performance under partial occlusion from direction 5. (a) Single view methods; (b) Multi-view methods.

Figure 14.
Performance under partial occlusion from direction 7. (a) Single view methods; (b) Multi-view methods.
Figure 14.
Performance under partial occlusion from direction 7. (a) Single view methods; (b) Multi-view methods.

Figure 15.
Images at different resolutions.
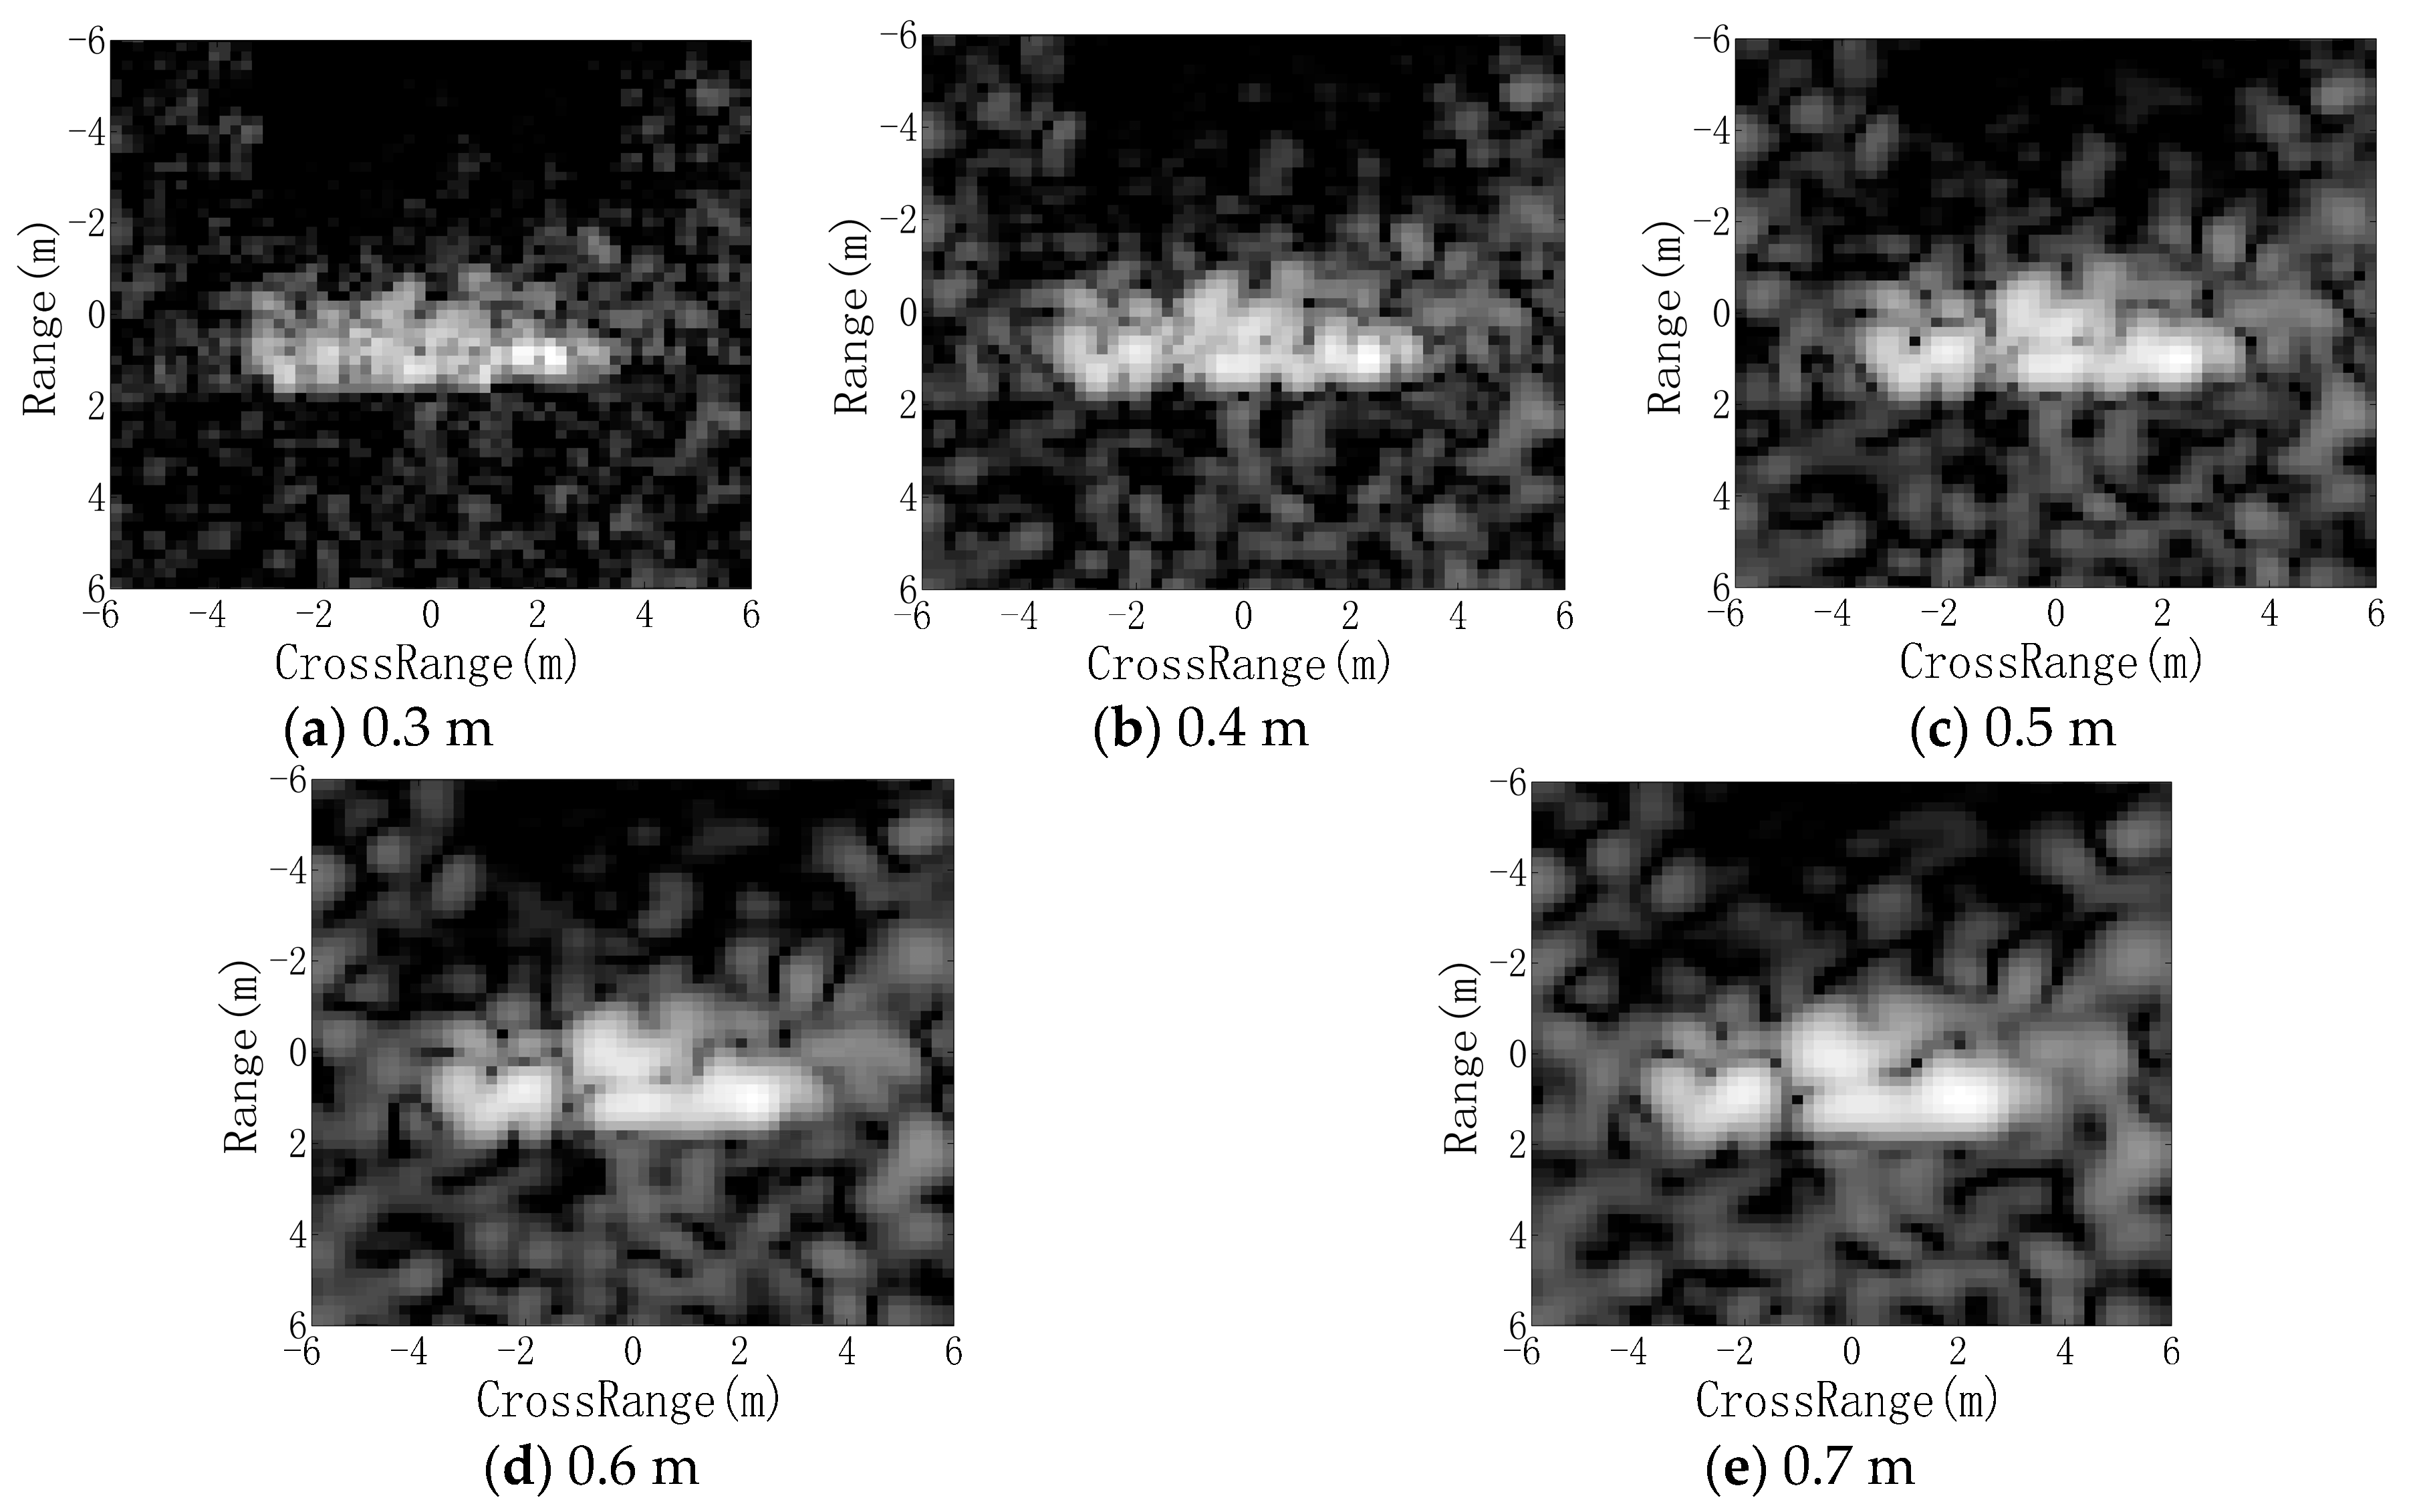
Figure 16.
PCCs of different methods under different resolutions.

Figure 17.
Performance of the proposed method at different thresholds.


Table 1.
Training and test sets in the experiments.
| Depr. | BMP2 | BTR70 | T72 | T62 | BDRM2 | BTR60 | ZSU23/4 | D7 | ZIL131 | 2S1 |
|---|---|---|---|---|---|---|---|---|---|---|
| 17° | 233(Sn_9563) | 233 | 232(Sn_132) | 299 | 298 | 256 | 299 | 299 | 299 | 299 |
| 232(Sn_9566) | 231(Sn_812) | |||||||||
| 233(Sn_c21) | 228(Sn_s7) | |||||||||
| 15° | 195(Sn_9563) | 196 | 196(Sn_132) | 273 | 274 | 195 | 274 | 274 | 274 | 274 |
| 196(Sn_9566) | 195(Sn_812) | |||||||||
| 196(Sn_c21) | 191(Sn_s7) |
Table 2.
The reference methods used in this paper.
| Abbre. | Description | Ref. | |
|---|---|---|---|
| Single View | SVM | Kernel support vector machine | [7] |
| SRC | Sparse representation-based classification | [8] | |
| Multi-view | PSRC | Parallel decision fusion for multi-view images based on SRC | [19] |
| DSRC | SRC for fused data of multi-view images by PCA | [19] | |
| JSRC | Joint sparse representation for multi-view images | [20] |
Table 3.
Confusion matrix of the proposed method under standard operating conditions (SOC).
| Class | BMP2 | BTR70 | T72 | T62 | BDRM2 | BTR60 | ZSU23/4 | D7 | ZIL131 | 2S1 | PCC (%) |
|---|---|---|---|---|---|---|---|---|---|---|---|
| BMP2 | 574 | 1 | 6 | 0 | 0 | 0 | 1 | 0 | 4 | 0 | 97.95 |
| BTR70 | 0 | 196 | 0 | 0 | 0 | 0 | 0 | 0 | 0 | 0 | 100 |
| T72 | 4 | 1 | 572 | 0 | 0 | 0 | 4 | 0 | 0 | 0 | 98.45 |
| T62 | 0 | 0 | 0 | 274 | 0 | 0 | 0 | 0 | 0 | 0 | 100 |
| BDRM2 | 0 | 0 | 0 | 0 | 272 | 1 | 1 | 0 | 0 | 0 | 99.27 |
| BTR60 | 0 | 1 | 0 | 2 | 0 | 192 | 0 | 0 | 0 | 0 | 98.97 |
| ZSU23/4 | 0 | 0 | 0 | 0 | 2 | 0 | 271 | 1 | 0 | 0 | 98.91 |
| D7 | 0 | 0 | 0 | 1 | 1 | 0 | 0 | 272 | 0 | 0 | 99.27 |
| ZIL131 | 0 | 1 | 0 | 0 | 0 | 0 | 1 | 0 | 272 | 0 | 99.27 |
| 2S1 | 0 | 0 | 0 | 0 | 0 | 0 | 0 | 0 | 0 | 274 | 100 |
| Average | 98.94 |
PCC: percentage of correct classification.
Table 4.
Comparison with reference methods.
| Method | SVM | SRC | MSRC | DSRC | JSRC | Proposed |
|---|---|---|---|---|---|---|
| PCC (%) | 94.22 | 93.66 | 98.07 | 95.12 | 97.71 | 98.94 |
Table 5.
PCCs of multi-view methods at different view numbers (%).
| View Number | 2 | 3 | 4 | 5 | 6 | 7 | 8 | 9 | 10 |
|---|---|---|---|---|---|---|---|---|---|
| MSRC | 95.69 | 96.72 | 97.10 | 97.60 | 98.03 | 98.41 | 98.72 | 98.97 | 99.03 |
| DSRC | 93.54 | 94.67 | 95.47 | 95.50 | 94.69 | 93.35 | 91.66 | 89.13 | 88.04 |
| JSRC | 95.78 | 96.69 | 97.00 | 97.41 | 97.75 | 97.88 | 98.06 | 98.09 | 98.63 |
| Proposed | 96.35 | 97.10 | 97.44 | 97.97 | 98.16 | 98.71 | 98.92 | 99.05 | 99.12 |
Table 6.
PCCs of multi-view methods under unstable azimuth separations.
| Method | MSRC | DSRC | JSRC | Proposed |
|---|---|---|---|---|
| PCC (%) | 97.85 | 94.56 | 97.25 | 98.37 |
Table 7.
Dataset for configuration variance test.
| BMP2 | BDRM2 | BTR70 | T72 | |
|---|---|---|---|---|
| Training set (17°) | 233(Sn_9563) | 298 | 233 | 232(Sn_132) |
| Test set (15°, 17°) | 428(Sn_9566) 429(Sn_c21) | 0 | 0 | 426(Sn_812) 573(Sn_A04) 573(Sn_A05) 573(Sn_A07) 567(Sn_A10) |
Table 8.
Confusion matrix of the proposed method under configuration variance.
| Class | Serial No. | BMP2 | BRDM2 | BTR-70 | T-72 | PCC (%) |
|---|---|---|---|---|---|---|
| BMP2 | Sn_9566 | 420 | 3 | 4 | 1 | 98.13 |
| Sn_c21 | 417 | 5 | 4 | 3 | 97.20 | |
| T72 | Sn_812 | 26 | 1 | 1 | 398 | 93.43 |
| Sn_A04 | 15 | 8 | 0 | 550 | 95.99 | |
| Sn_A05 | 12 | 2 | 2 | 557 | 97.21 | |
| Sn_A07 | 8 | 2 | 1 | 562 | 98.08 | |
| Sn_A10 | 12 | 5 | 0 | 550 | 97.00 | |
| Average | 96.78 |
Table 9.
PCCs of different methods under configuration variance.
| Method | Proposed | SVM | SRC | MSRC | DSRC | JSRC |
|---|---|---|---|---|---|---|
| PCC (%) | 96.78 | 86.12 | 84.65 | 96.11 | 91.16 | 93.86 |
© 2017 by the authors. Licensee MDPI, Basel, Switzerland. This article is an open access article distributed under the terms and conditions of the Creative Commons Attribution (CC BY) license (http://creativecommons.org/licenses/by/4.0/).
Share and Cite
MDPI and ACS Style
Ding, B.; Wen, G. Exploiting Multi-View SAR Images for Robust Target Recognition. Remote Sens. 2017, 9, 1150. https://doi.org/10.3390/rs9111150
AMA Style
Ding B, Wen G. Exploiting Multi-View SAR Images for Robust Target Recognition. Remote Sensing. 2017; 9(11):1150. https://doi.org/10.3390/rs9111150
Chicago/Turabian StyleDing, Baiyuan, and Gongjian Wen. 2017. "Exploiting Multi-View SAR Images for Robust Target Recognition" Remote Sensing 9, no. 11: 1150. https://doi.org/10.3390/rs9111150
Note that from the first issue of 2016, this journal uses article numbers instead of page numbers. See further details here.