Article

Evaluation of the SBAS InSAR Service of the European Space Agency’s Geohazard Exploitation Platform (GEP)

by
Jorge Pedro Galve
1,*,
José Vicente Pérez-Peña
1,2,
José Miguel Azañón
1,3,
Damien Closson
4,
Fabiana Caló
5,
Cristina Reyes-Carmona
1,
Antonio Jabaloy
1,
Patricia Ruano
1,3,
Rosa María Mateos
6,
Davide Notti
7,
Gerardo Herrera
6,
Marta Béjar-Pizarro
6,
Oriol Monserrat
8 and
Philippe Bally
9
1
Departamento de Geodinámica, Universidad de Granada, Avda. del Hospicio, s/n, 18010 Granada, Spain
2
Instituto Andaluz de Geofísica (IAG), Universidad de Granada, Calle Profesor Clavera, 12, 18071 Granada, Spain
3
Instituto Andaluz de Ciencias de la Tierra (IACT), CISC-UGR, Av. de las Palmeras, 4, 18100 Armilla, Spain
4
GIM n.v., Philipssite 5 Bus 27, 3001 Leuven, Belgium
5
Istituto per il rilevamento elettromagnetico dell’ambiente, Consiglio Nazionale delle Ricerche, Via Diocleziano, 328, 80124 Napoli, Italy
6
Geohazards InSAR laboratory and Modeling group (InSARlab), Geoscience research department, Geological Survey of Spain (IGME), Alenza 1, 28003 Madrid, Spain
7
National Research Council of Italy, Research Institute for Geo-Hydrological Protection (CNR-IRPI), Strada delle Cacce, 73, 10135 Torino, Italy
8
Centre Tecnològic y Telecomunicacions de Catalunya, Parc Mediterrani de la Tecnologia, Avinguda Carl Friedrich Gauss, 7, 08860 Castelldefels, Spain
9
European Space Agency, Science, Applications and Future Technologies Department, Directorate of Earth Observation Programmes, ESRIN, Via Galileo Galilei snc, I-00044 Frascati, Italy
*
Author to whom correspondence should be addressed.
Remote Sens. 2017, 9(12), 1291; https://doi.org/10.3390/rs9121291
Submission received: 27 September 2017 / Revised: 28 November 2017 / Accepted: 7 December 2017 / Published: 11 December 2017
(This article belongs to the Special Issue Radar Interferometry for Geohazards)

Abstract

:
The analysis of remote sensing data to assess geohazards is being improved by web-based platforms and collaborative projects, such as the Geohazard Exploitation Platform (GEP) of the European Space Agency (ESA). This paper presents the evaluation of a surface velocity map that is generated by this platform. The map was produced through an unsupervised Multi-temporal InSAR (MTI) analysis applying the Parallel-SBAS (P-SBAS) algorithm to 25 ENVISAT satellite images from the South of Spain that were acquired between 2003 and 2008. This analysis was carried out using a service implemented in the GEP called “SBAS InSAR”. Thanks to the map that was generated by the SBAS InSAR service, we identified processes not documented so far; provided new monitoring data in places affected by known ground instabilities; defined the area affected by these instabilities; and, studied a case where GEP could have been able to help in the forecast of a slope movement reactivation. This amply demonstrates the reliability and usefulness of the GEP, and shows how web-based platforms may enhance the capacity to identify, monitor, and assess hazards that are associated to geological processes.

Graphical Abstract

1. Introduction

Web-based platforms and collaborative projects are revolutionizing the way to analyze remote sensing data. Moreover, new Earth Observation (EO) missions provide accurate information in time and space, which constitute a significant amount of data waiting to be analyzed. To accomplish this task, web-based processing tools and user networks will take a leading role (see e.g., https://www.globalxplorer.org/; [1]). The European Space Agency’s Geohazard Exploitation Platform (GEP) (https://geohazards-tep.eo.esa.int/#!) is a web-based platform that allow users to perform analysis of satellite data via the Internet [2]. This platform hosts several services to identify, monitor, and assess hazards that are associated with active seismicity, vulcanism, subsidence, or landslides, among others. The SBAS InSAR service is one of these services that is specialized in producing velocity maps of the Earth surface by applying one specific advanced Differential SAR Interferometry (DInSAR) algorithm. DInSAR was originally applied to analyze the deformation related to earthquakes [3]. In the last decades it has proved to be a powerful tool to detect and monitor active processes such as rock dissolution- and human-induced subsidence [4,5,6,7,8], slow-moving slope instabilities [9,10], or volcano inflation and/or destabilization [11], among others. These slow movements not only can generate damages on buildings or infrastructures [6,12], but also may be precursors of volcanic eruptions [13] or other hazardous fast-moving phenomena such as ground sudden collapses [14,15] or landslides [16,17].
The power of DInSAR techniques has been mainly exploited only by specialized research teams or private companies. The cases studied using these techniques were limited to areas where a great number of SAR acquisitions were available, being mostly located in Europe, North America, and Eastern Asia. GEP and new satellite missions, such as Sentinel-1, open a new scenario where researchers and technicians from all around the World would have the possibility to assess hazards in their regions performing their own DInSAR analyses.
GEP at present-day is only a beta prototype that is being fine-tuned and its results must be validated by experienced research teams and be compared with independent data. In this paper, we present a detailed evaluation of the GEP results in the central sector of Andalusia (South Spain), where we accounted for previous InSAR results related to active landslides and subsidence due to groundwater pumping [18,19,20,21]. We compared previous DInSAR displacement rates with velocities that were obtained by the GEP platform to check them. Moreover, in order to assess the usefulness of this platform, we did not restrict our analysis to areas of previously known deformation, but validate some points where GEP results pointed to active deformation but no active processes have been described up to now. The present work explores the trustworthiness and usefulness of the ESA’s platform, by a research team independent to the developers of the SBAS InSAR service, complementing the work of Albano et al. [22] in Mexico City.

2. GEP, the G-POD Environment and the SBAS InSAR Service

The Geohazard Exploitation Platform (GEP) is an ESA’s web-based platform that is specially designed to exploit EO data for assessing geohazards. GEP serves as a user-friendly interface to run web tools implemented in the ESA’s Grid Processing On Demand (G-POD) environment (https://gpod.eo.esa.int/). One of these web tools is the SBAS InSAR service. This service implements the unsupervised P-SBAS algorithm [23,24] that follows the SBAS approach [25], which is a widely-used technique to carry out multi-temporal DInSAR analyses [26,27,28,29]. Inputs of the P-SBAS algorithm are a temporal data set of SAR images of the same region with the same acquisition geometry, the satellite position of all the acquisitions, and the Digital Elevation Model (DEM) of the analyzed area [23]. G-POD provides the access to SAR images that are stored in the ESA’s data archives, and processes them directly at the server side in the ESA’s computing facilities. The users do not need to download and process a large amount of data and to acquire and maintain expensive specific processing-software and hardware. De Luca et al. [23] show an overview of the G-POD environment and describe in detail the features and characteristics of the P-SBAS web tool and its implementation in the G-POD environment. Additional information about the platform and its services is available in the following website: http://terradue.github.io/doc-tep-geohazards/overview/index.html#.
At present-day, GEP is a beta prototype and its access is restricted to 60 users. They are so-called “Early Adopters” that act as testers of the platform. These users come from companies, academic and research institutions and the Administration. Most of them are from Europe but there are also users from Chile, Ecuador, Indonesia, Iran, Morocco, and United States of America (USA). Five of them are pilot users from the Committee on Earth Observation Satellites (CEOS), and the others were included in this ESA’s initiative through the approbation of a research project that was related to the testing and development of the platform.

3. Materials and Methods
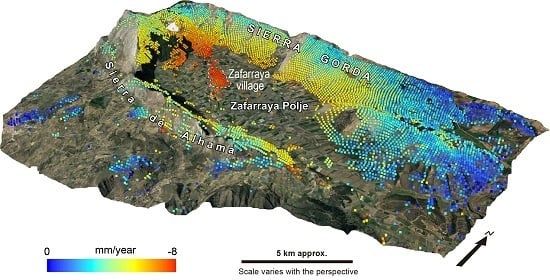
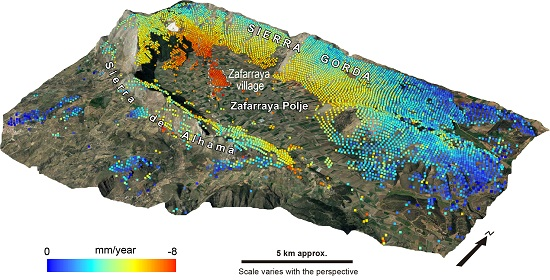
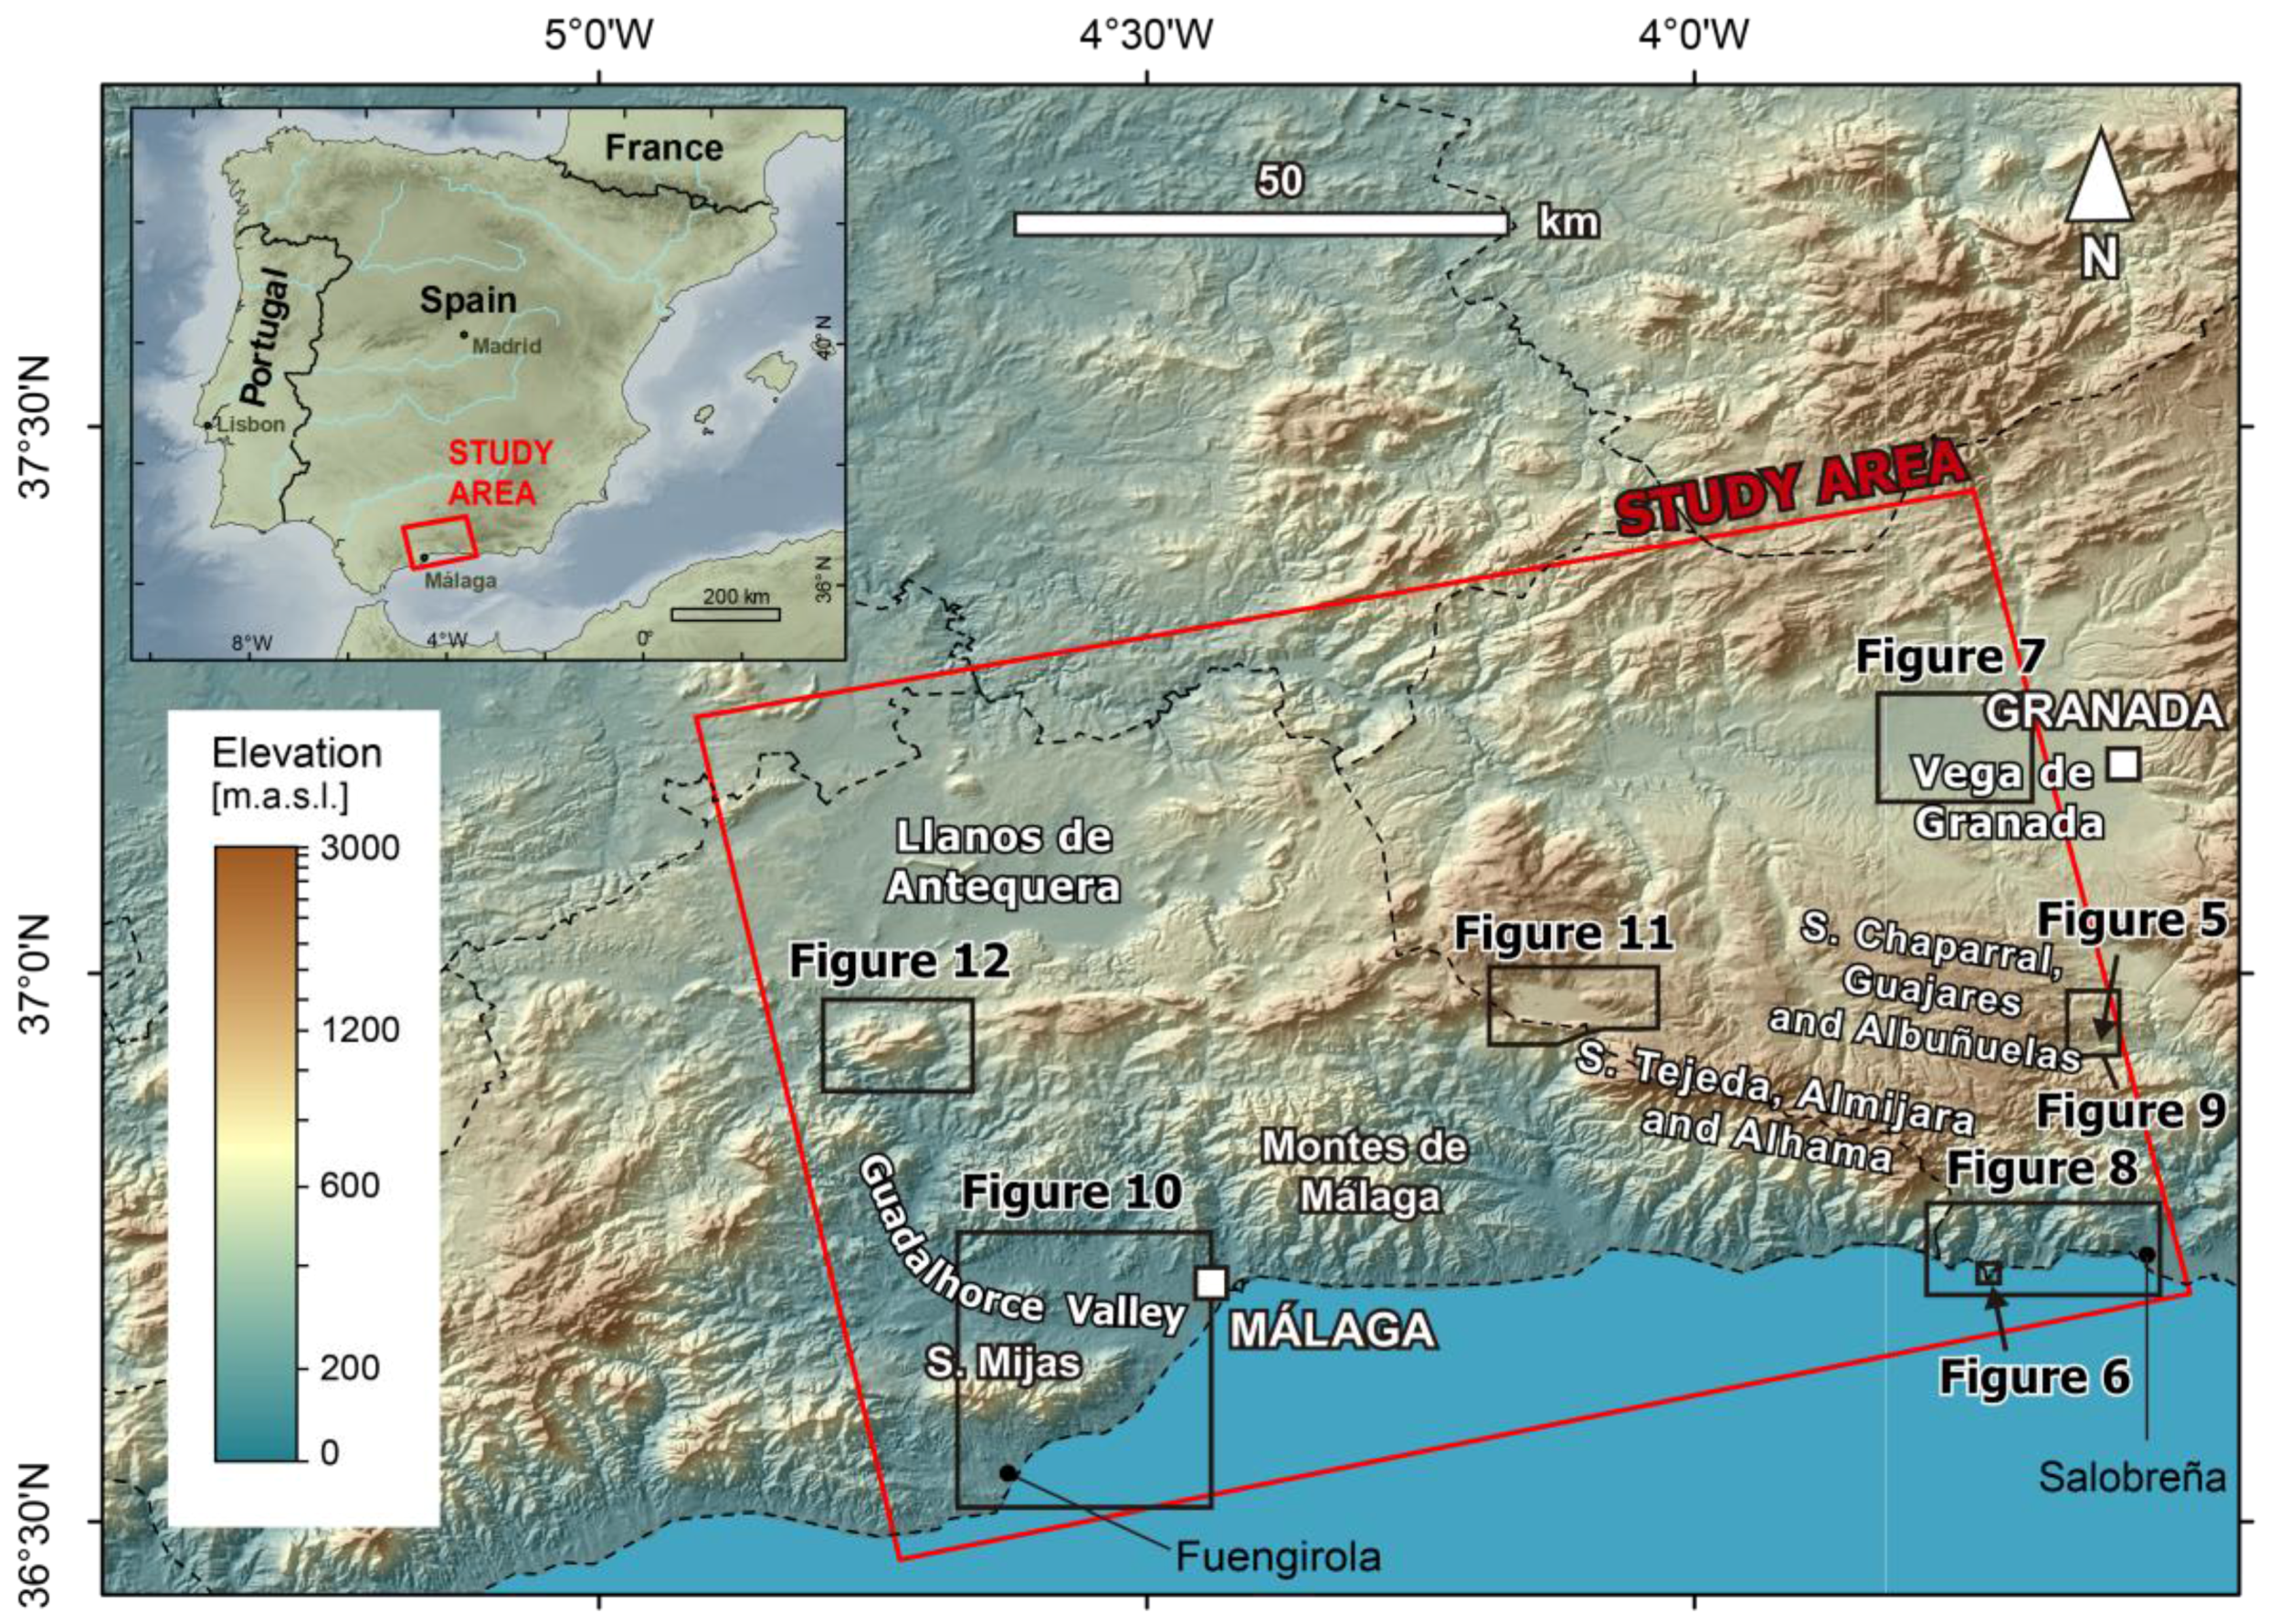
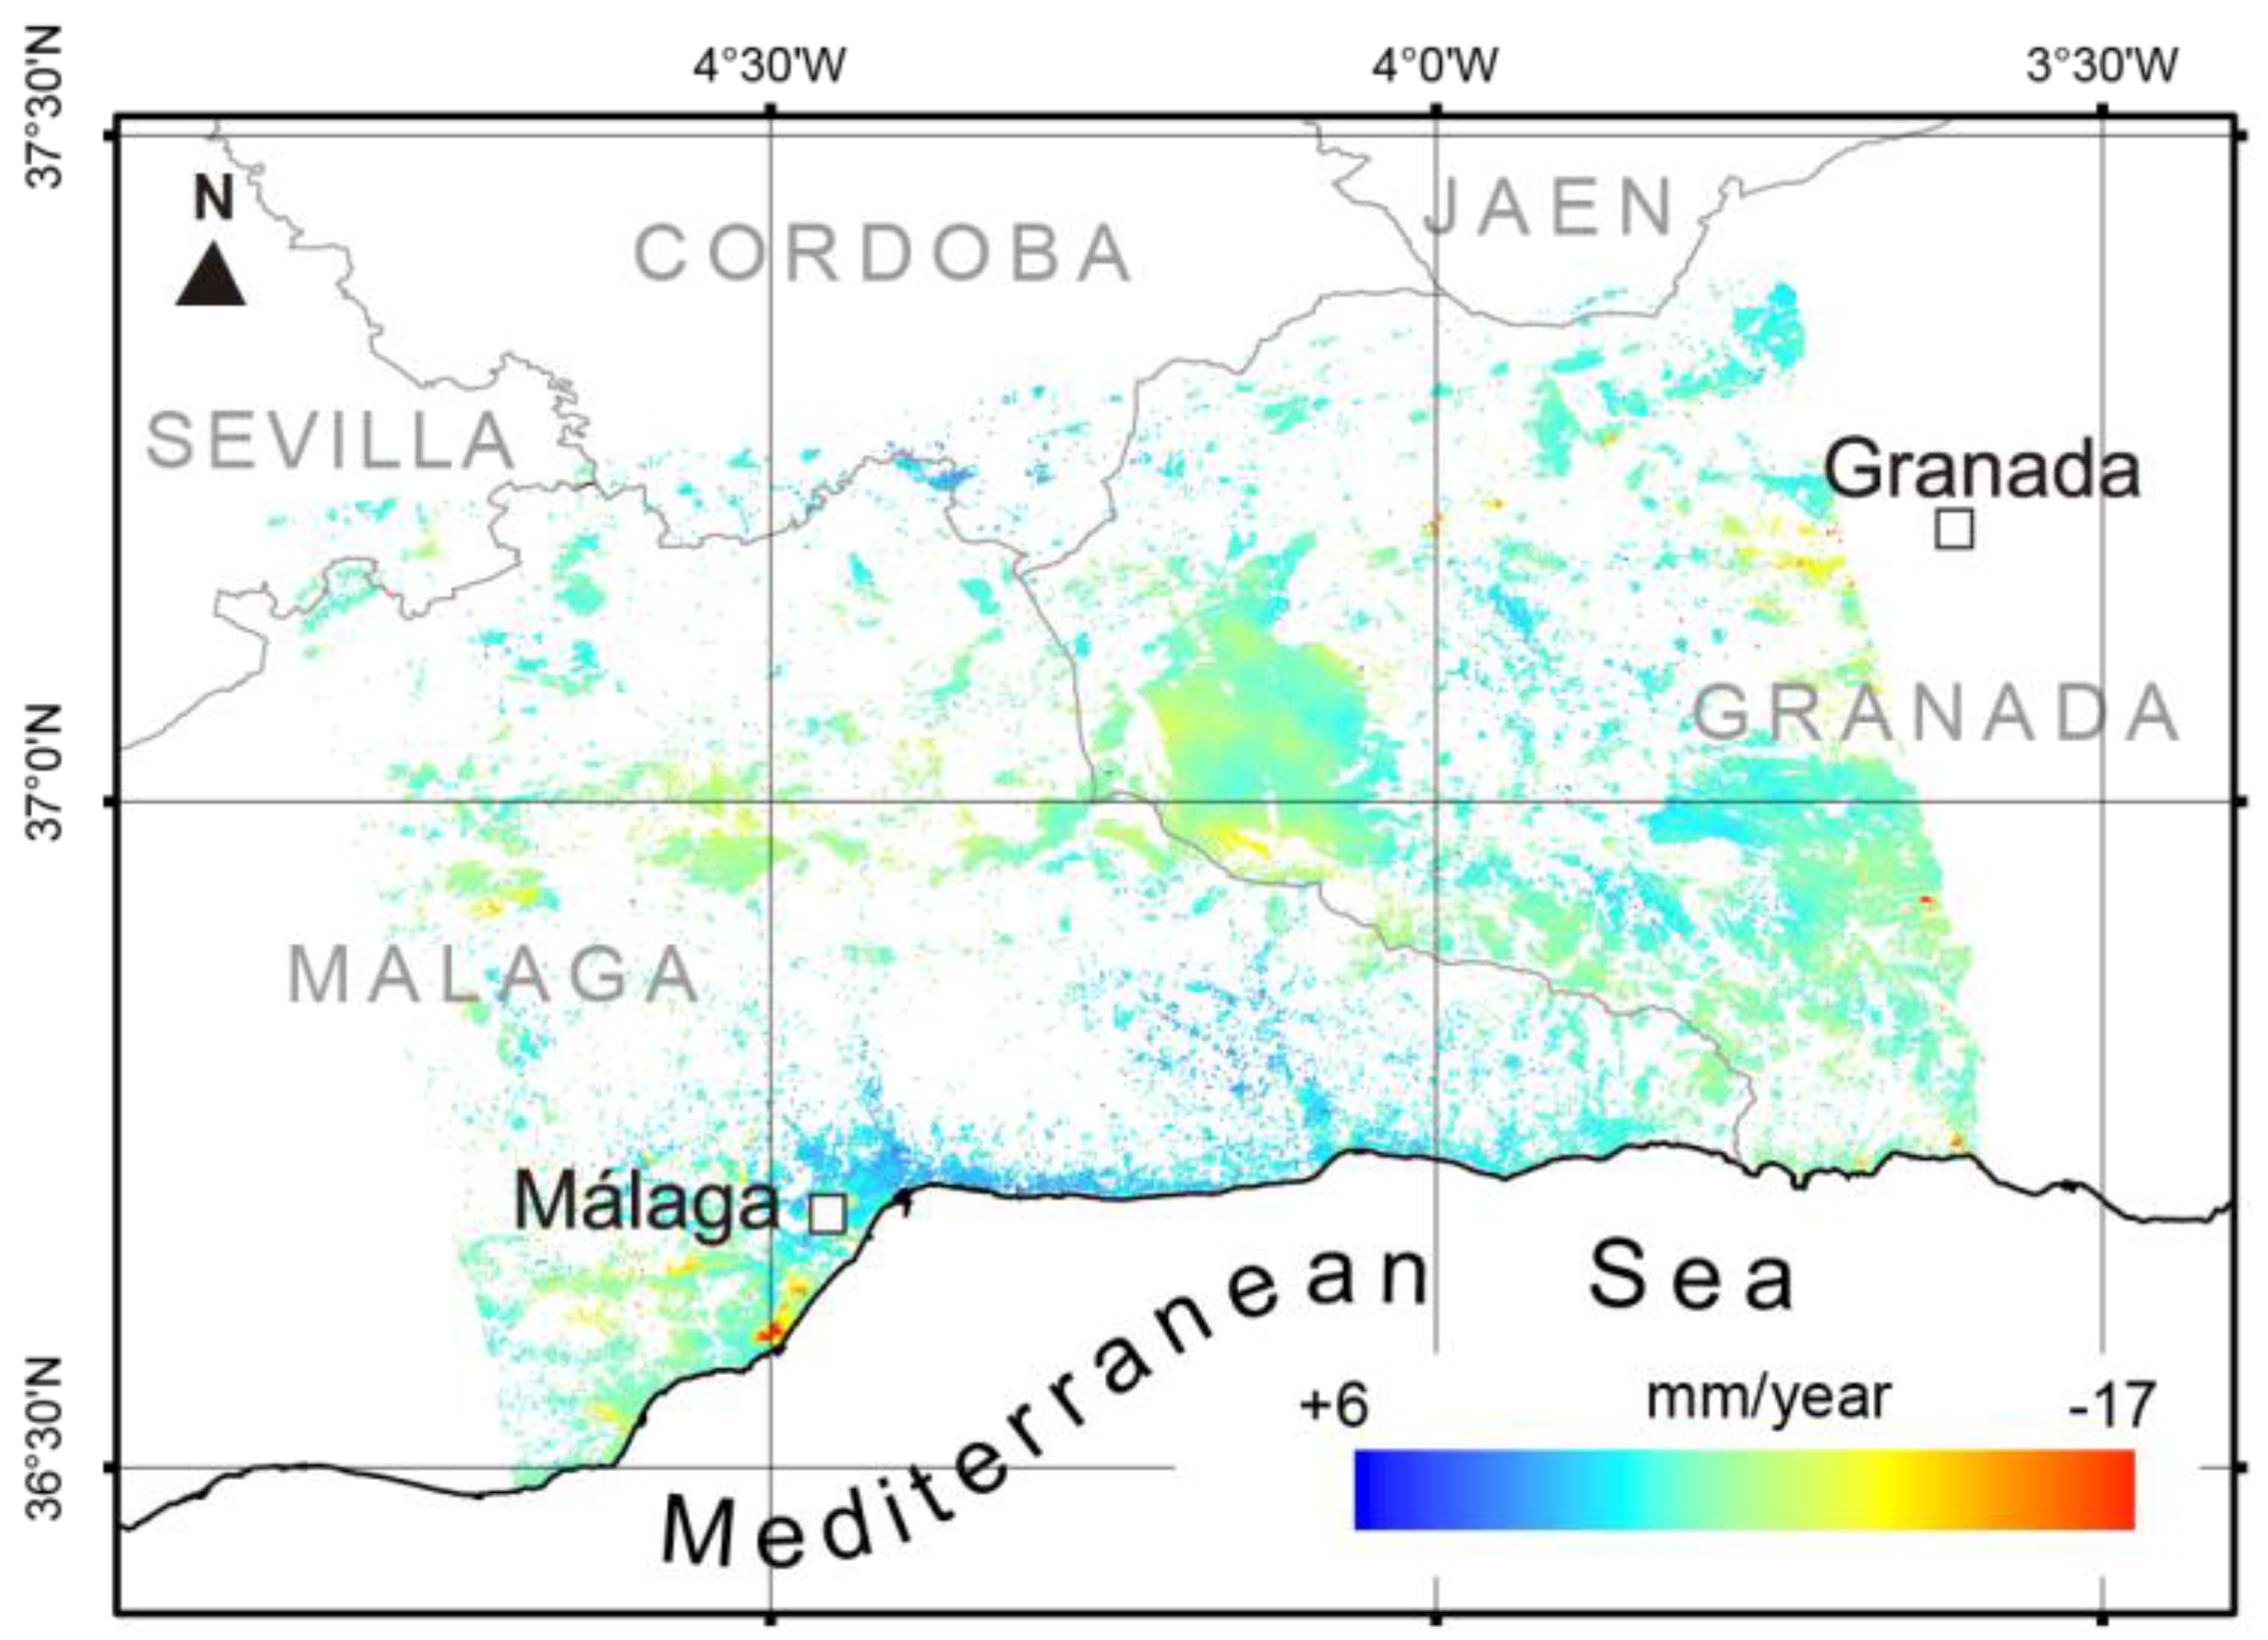
In order to check the reliability, potential, and usefulness of the SBAS InSAR service of the GEP, we selected a well-known area in the central part of Andalusia (South Spain), within the provinces of Granada and Málaga. With the aid of the GEP service we processed ENVISAT ASAR images of this area and compared the outputs with previous results. These previous results include InSAR data produced by our research team, as well as previously published information about active ground instabilities. Additionally, we carry out field explorations to collect evidence of the detected movements where no previous information about active phenomena existed.

3.1. Study Area

The study area gathers 9130 km2 inside a 100 × 100 km Envisat ascending frame of the central sector of Andalucia (Spain). The rectangle covers the coastal strip of the Malaga and Granada provinces, from Fuengirola to Salobreña, and also includes a mountain region that is formed by the Tejeda, Almijara, Alhama, Chaparral, Guájares, Albuñuelas, Mijas, and Los Montes de Malaga ranges, as well as the high plains of the Llanos de Antequera and the Vega de Granada (Figure 1).
The lithology of the main reliefs in the analyzed sector consists of materials from the Internal Zone of the Betic Cordillera. The eastern mountain ranges are composed of rocks from the Alpujarride Complex, which mainly comprises schists, quarzites, philites, and marbles. The hillslopes that are developed in these materials commonly show instability problems and the inventories in this area draw a high density of landslides associated with these rocks, specially within philites. The western ranges exhibit less abrupt landscapes that are composed of lutites, sandstones, limestones, and conglomerates from the Malaguide Complex. These lithologic formations are less prone to be affected by mass movements. The high plains of the study area are intra-mountainous basins that are filled by Neogene sediments, surrounded by low-relief Mesozoic materials from the External Zone of the Betics. A great variety of mass movements have been described in these high plains [30], as well as documented human-induced subsidence [19,21,31,32,33].
The variability in the climate conditions of this area causes a great heterogeneity in humidity and the vegetation coverage. Most of the study area shows a semi-arid climate with mean annual precipitation between 200 and 500 mm, and with a scarce vegetation cover. The highest reliefs (Tejeda, Almijara, and Alhama ranges) show a humid climate with mean annual precipitation up to 1000 mm. These areas are usually covered by Mediterranean forest and shrub but, because of the terrain characteristics, also bare rock crop out in the highest elevations. The aridity and the scarce vegetation cover make it an optimal place to apply InSAR techniques.

3.2. SAR Data and Processing Methods

With the aid of the GEP platform, we produced a surface velocity map by processing 25 archived ASAR images of the ENVISAT satellite acquired on ascending orbits from 21 March 2003 to 1 August 2008 (track 459, frame 731). The GEP’s SBAS InSAR service allowed for carrying out a Multi-temporal InSAR (MTI) analysis processing 70 interferograms through the Parallel-SBAS (P-SBAS) algorithm [25] implemented in the ESA GRID-based operational environment [23]. Table 1 shows the values that were used for the parameters involved in the analysis. Once the surface velocity map was obtained, unstable points were selected establishing an average line of sight (LOS) displacement-rate threshold of ±2 mm/year. This criterion has been applied in other similar analysis that used ENVISAT C-band data [6,7,34,35]. Supplementary information on SAR data sets and the produced surface velocity map is shown in Table 1.
The described analysis was performed through the web interface of GEP (Figure 2).
The website provides a user-friendly interface that allows for performing the complete DInSAR analysis through the following steps:
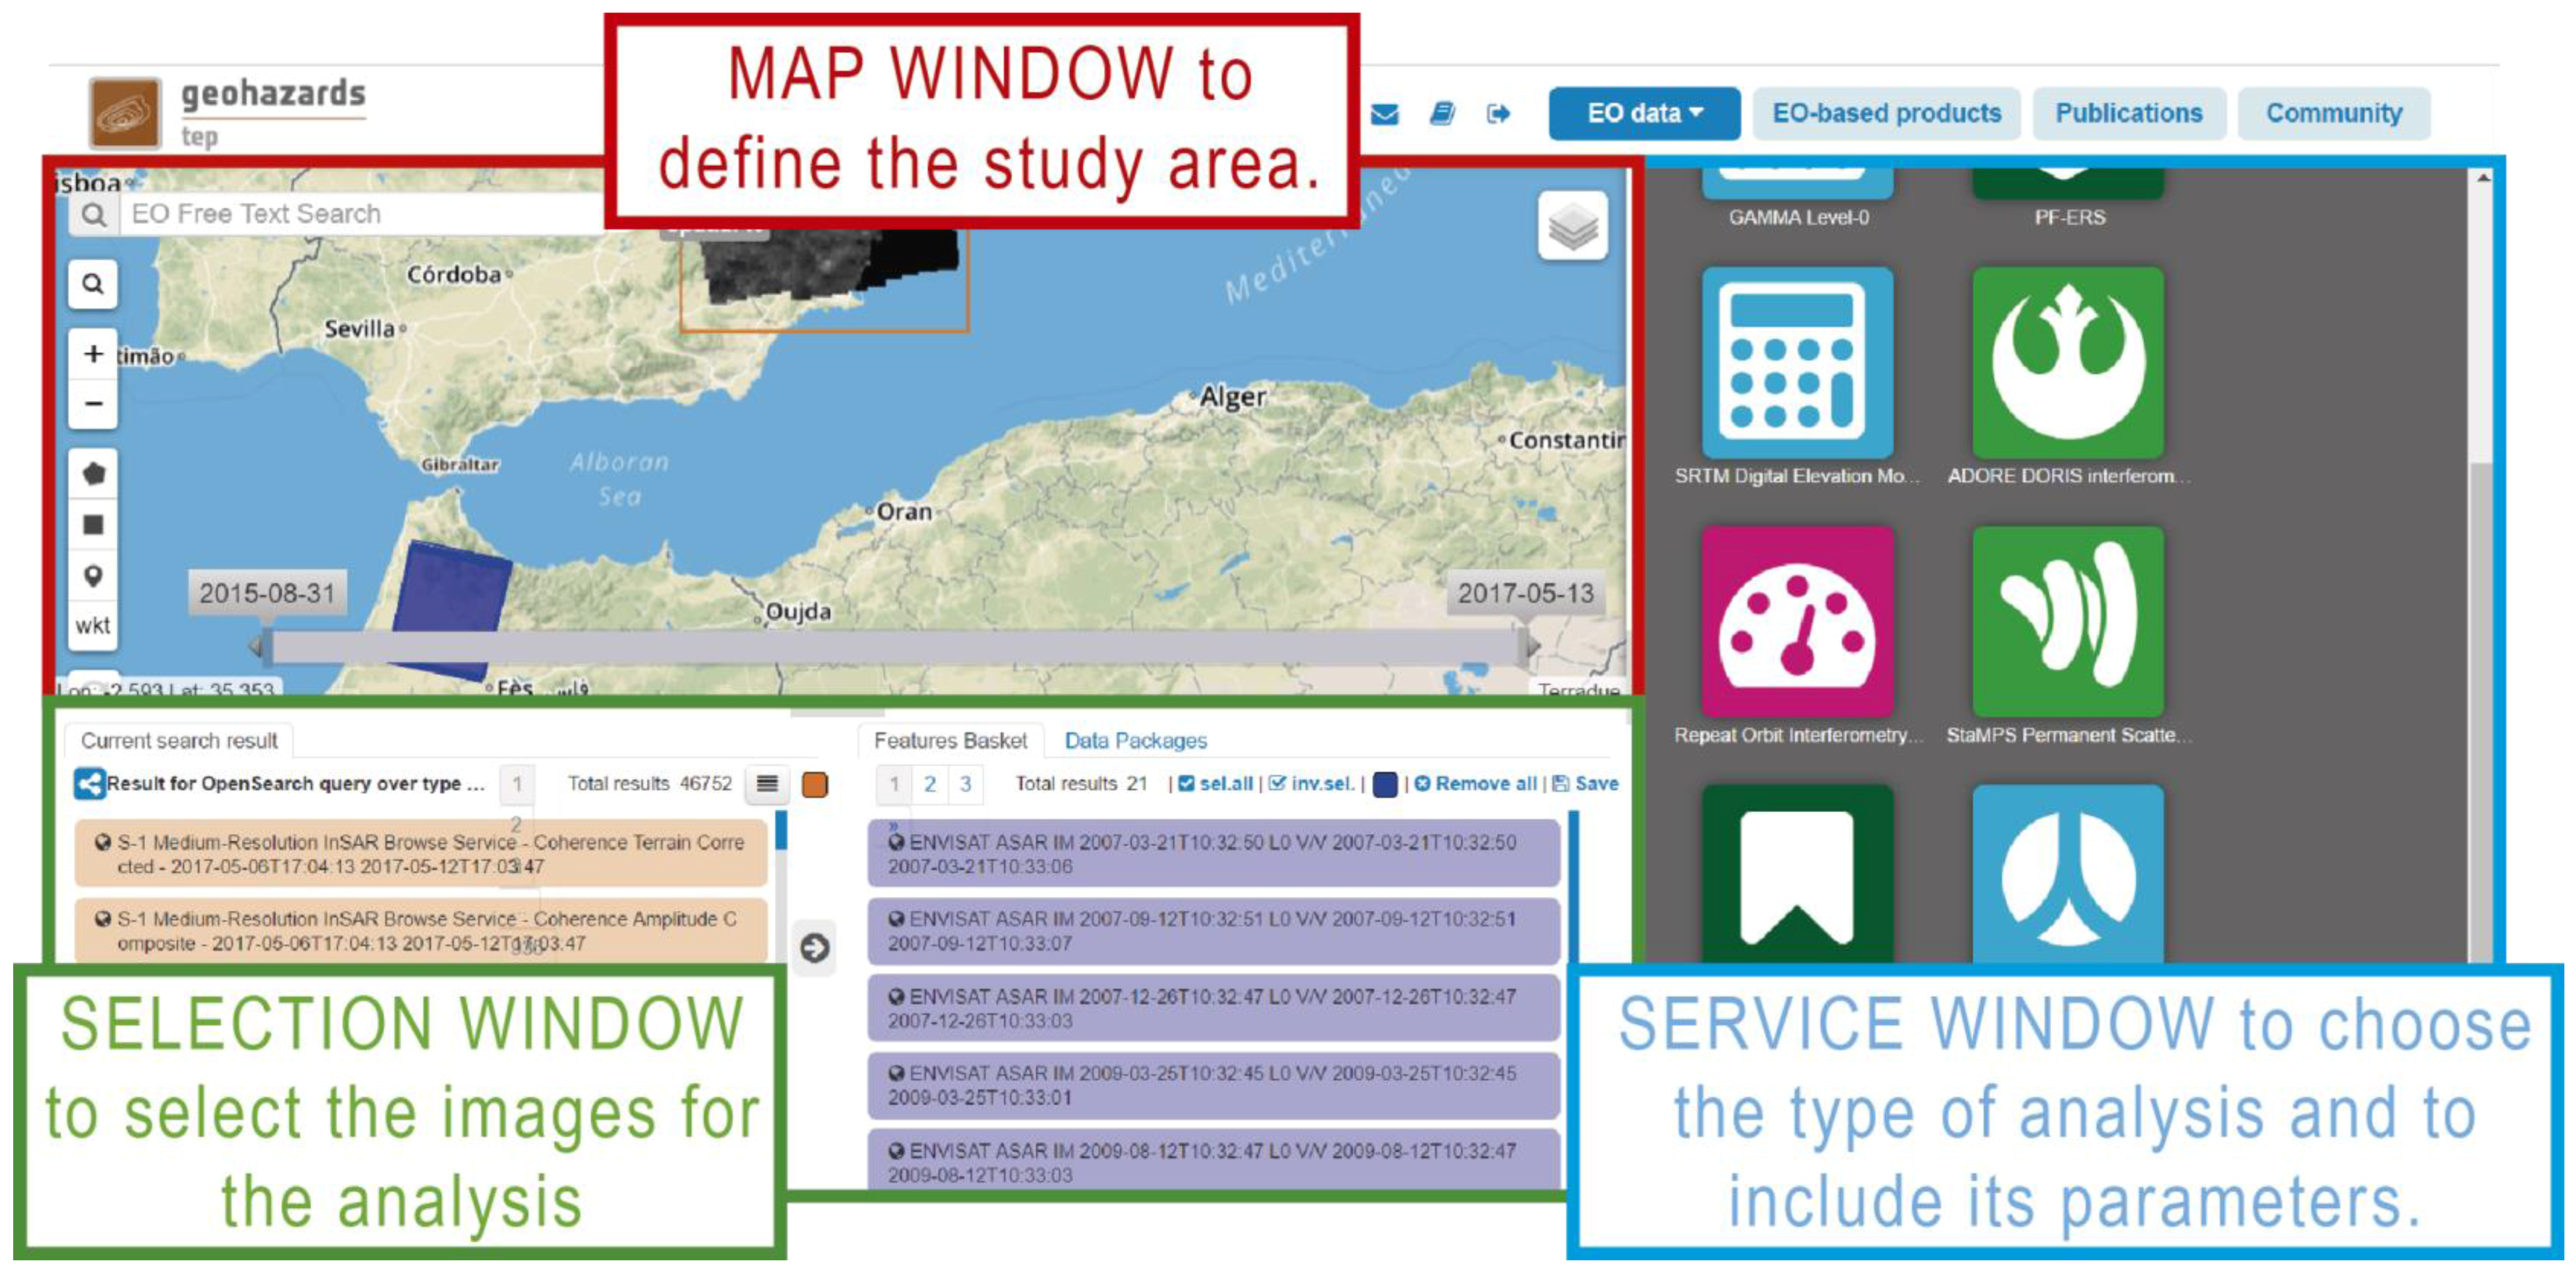
  • Selection of the SBAS Service in the Service window. After you select the service, the window displays a form to be completed with the parameters of the DInSAR analysis.
  • Selection the Area of Interest (AOI) in the Map window. By using the tools of the Map window you can draw a rectangle and the system shows you in the Selection window the available images coinciding with the chosen AOI.
  • Selection of the images to include in the analysis. You can drag the images from the Selection window to the Service window.
  • Completing the form. You can also select the reference point and include the extension of the analysis using the AOI in the Map window. The system also permits the modification of the input parameters implemented by default.
  • Running the analysis.
The system enabled the development of the entire SBAS-DInSAR processing procedure in an unsupervised way and taking advantage of the computing power of ESA’s systems. GEP provided the surface velocity map in less than 24 h. This map was provided in KMZ format to be visualized in Google Earth and GEP also deliver a TXT file with the coordinates, coherence, velocity, and displacement time series of all the measured points.

3.3. Interpretation of Unstable Points Detected

Although in GEP the SAR image processing needed less than a day, the interpretation of the movements that were detected in the surface velocity map took several weeks. In our case, we performed a general overview of the results by collecting existing data and studying in detail the points with no previous information.
First, we check the InSAR velocity map comparing the detected unstable points of several well-known areas with (1) our own InSAR displacement data obtained through permanent scattered techniques; and (2) InSAR results that were published in scientific literature. In the latter case, we compare the GEP map with the InSAR data provided for the Granada basin [19,21,31,32], Albuñuelas [31], the Malaga coast [33], and the urban resorts of Marina del Este and Carmenes del Mar in Almuñecar [18,20]. Second, once the GEP map was checked, we carried out a detailed study in the areas with not previous quantitative information about active deformation. We performed a geological and historical analysis in those areas by combining field surveys, modern and historical aerial photographs, digital elevation models, historical documents, and technical and press reports. The available data regarding active processes that we could find in the study area were quite heterogeneous. The information about active landslides was mainly collected from the landslide map of the Granada province [30], a publication about the “Alta Cadena” area (NE of the Malaga province) [36] and the database BDMOVES of the Spanish Geological Survey (IGME).

4. Results

The InSAR velocity map that was obtained through the SBAS InSAR service is presented in the Figure 3 and its characteristics are summarized in Table 1. The points with coherence level ≥0.7 cover the 10% of the total area. They are mainly concentrated in bare rock and urban areas. The main surficial processes detected in the study area were human-induced subsidence because of water withdrawal in some points of the Malaga and Granada coast and in the Granada basin. Slope mass movements are the second type of surficial processes that are identified in the analyzed region. InSAR data derived from GEP agree with several documented cases located along the coast and in some points within the mountain ranges to the South of the Granada province. Alongside with these documented ground instabilities, we also detected new ones and some other surface movements difficult to interpret that will be described in Section 4.3.2 (displacements detected in the Zafarraya polje and in the sierras of the Valle de Abdalajís).

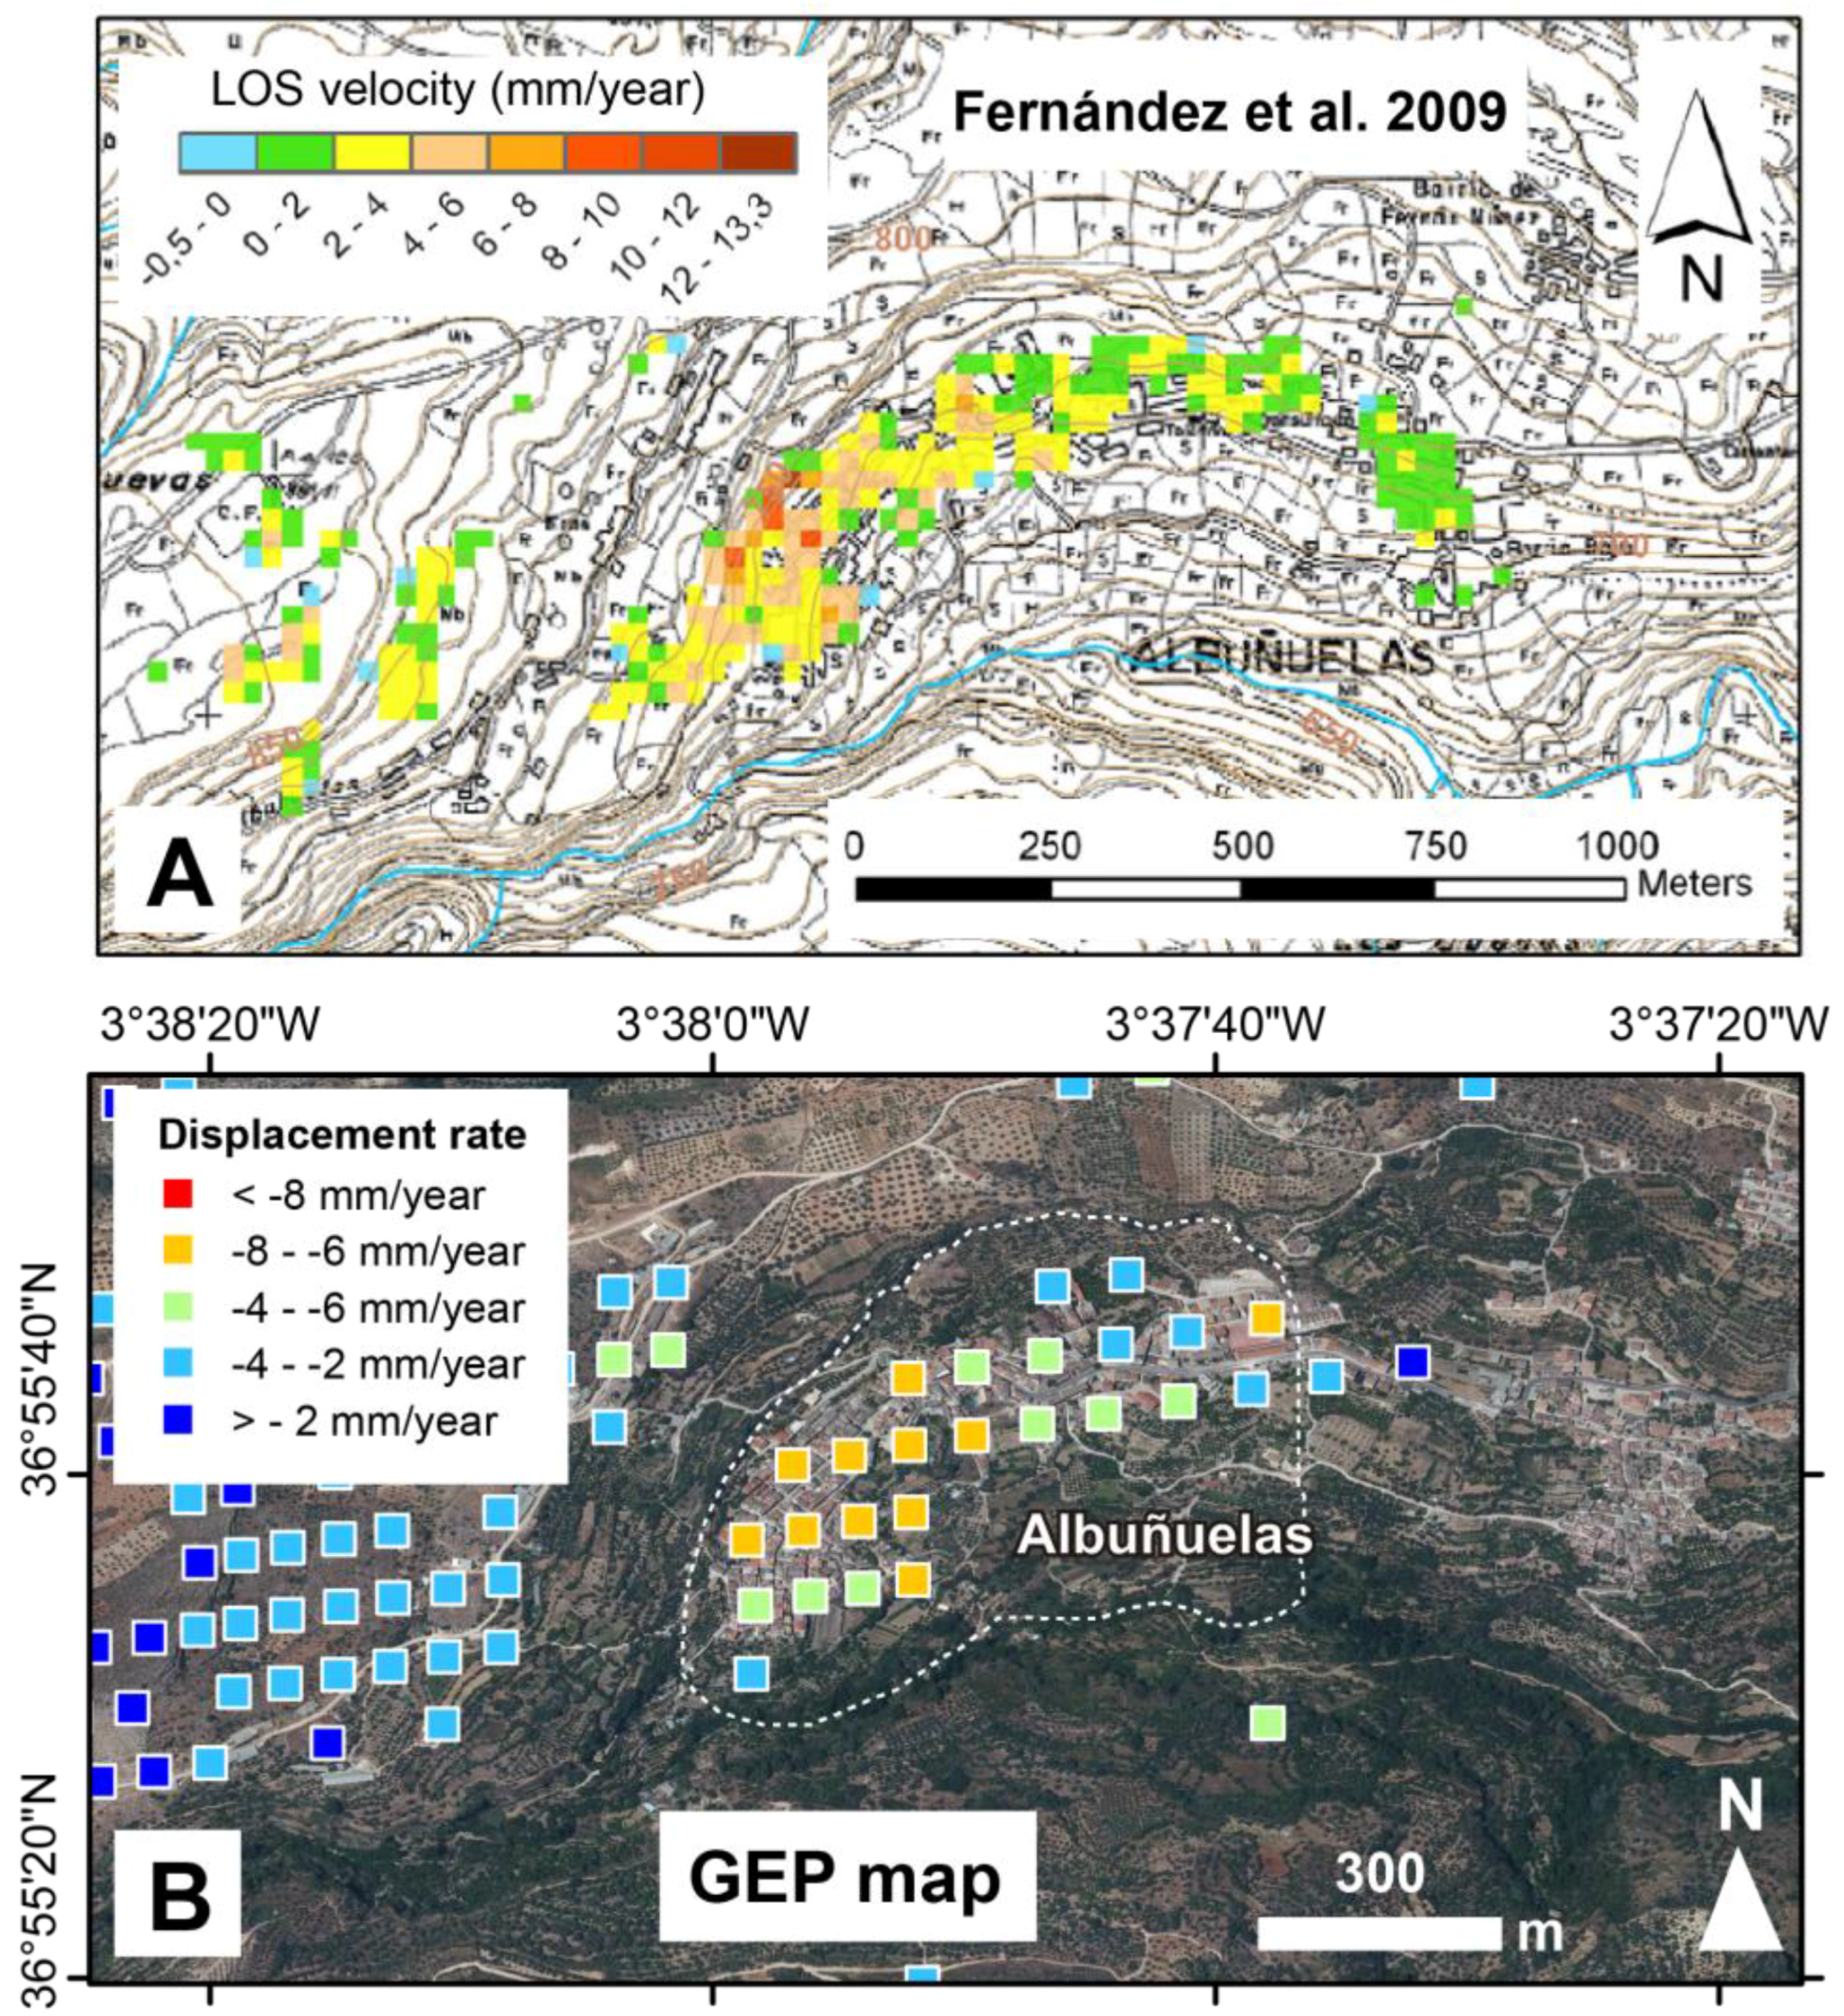
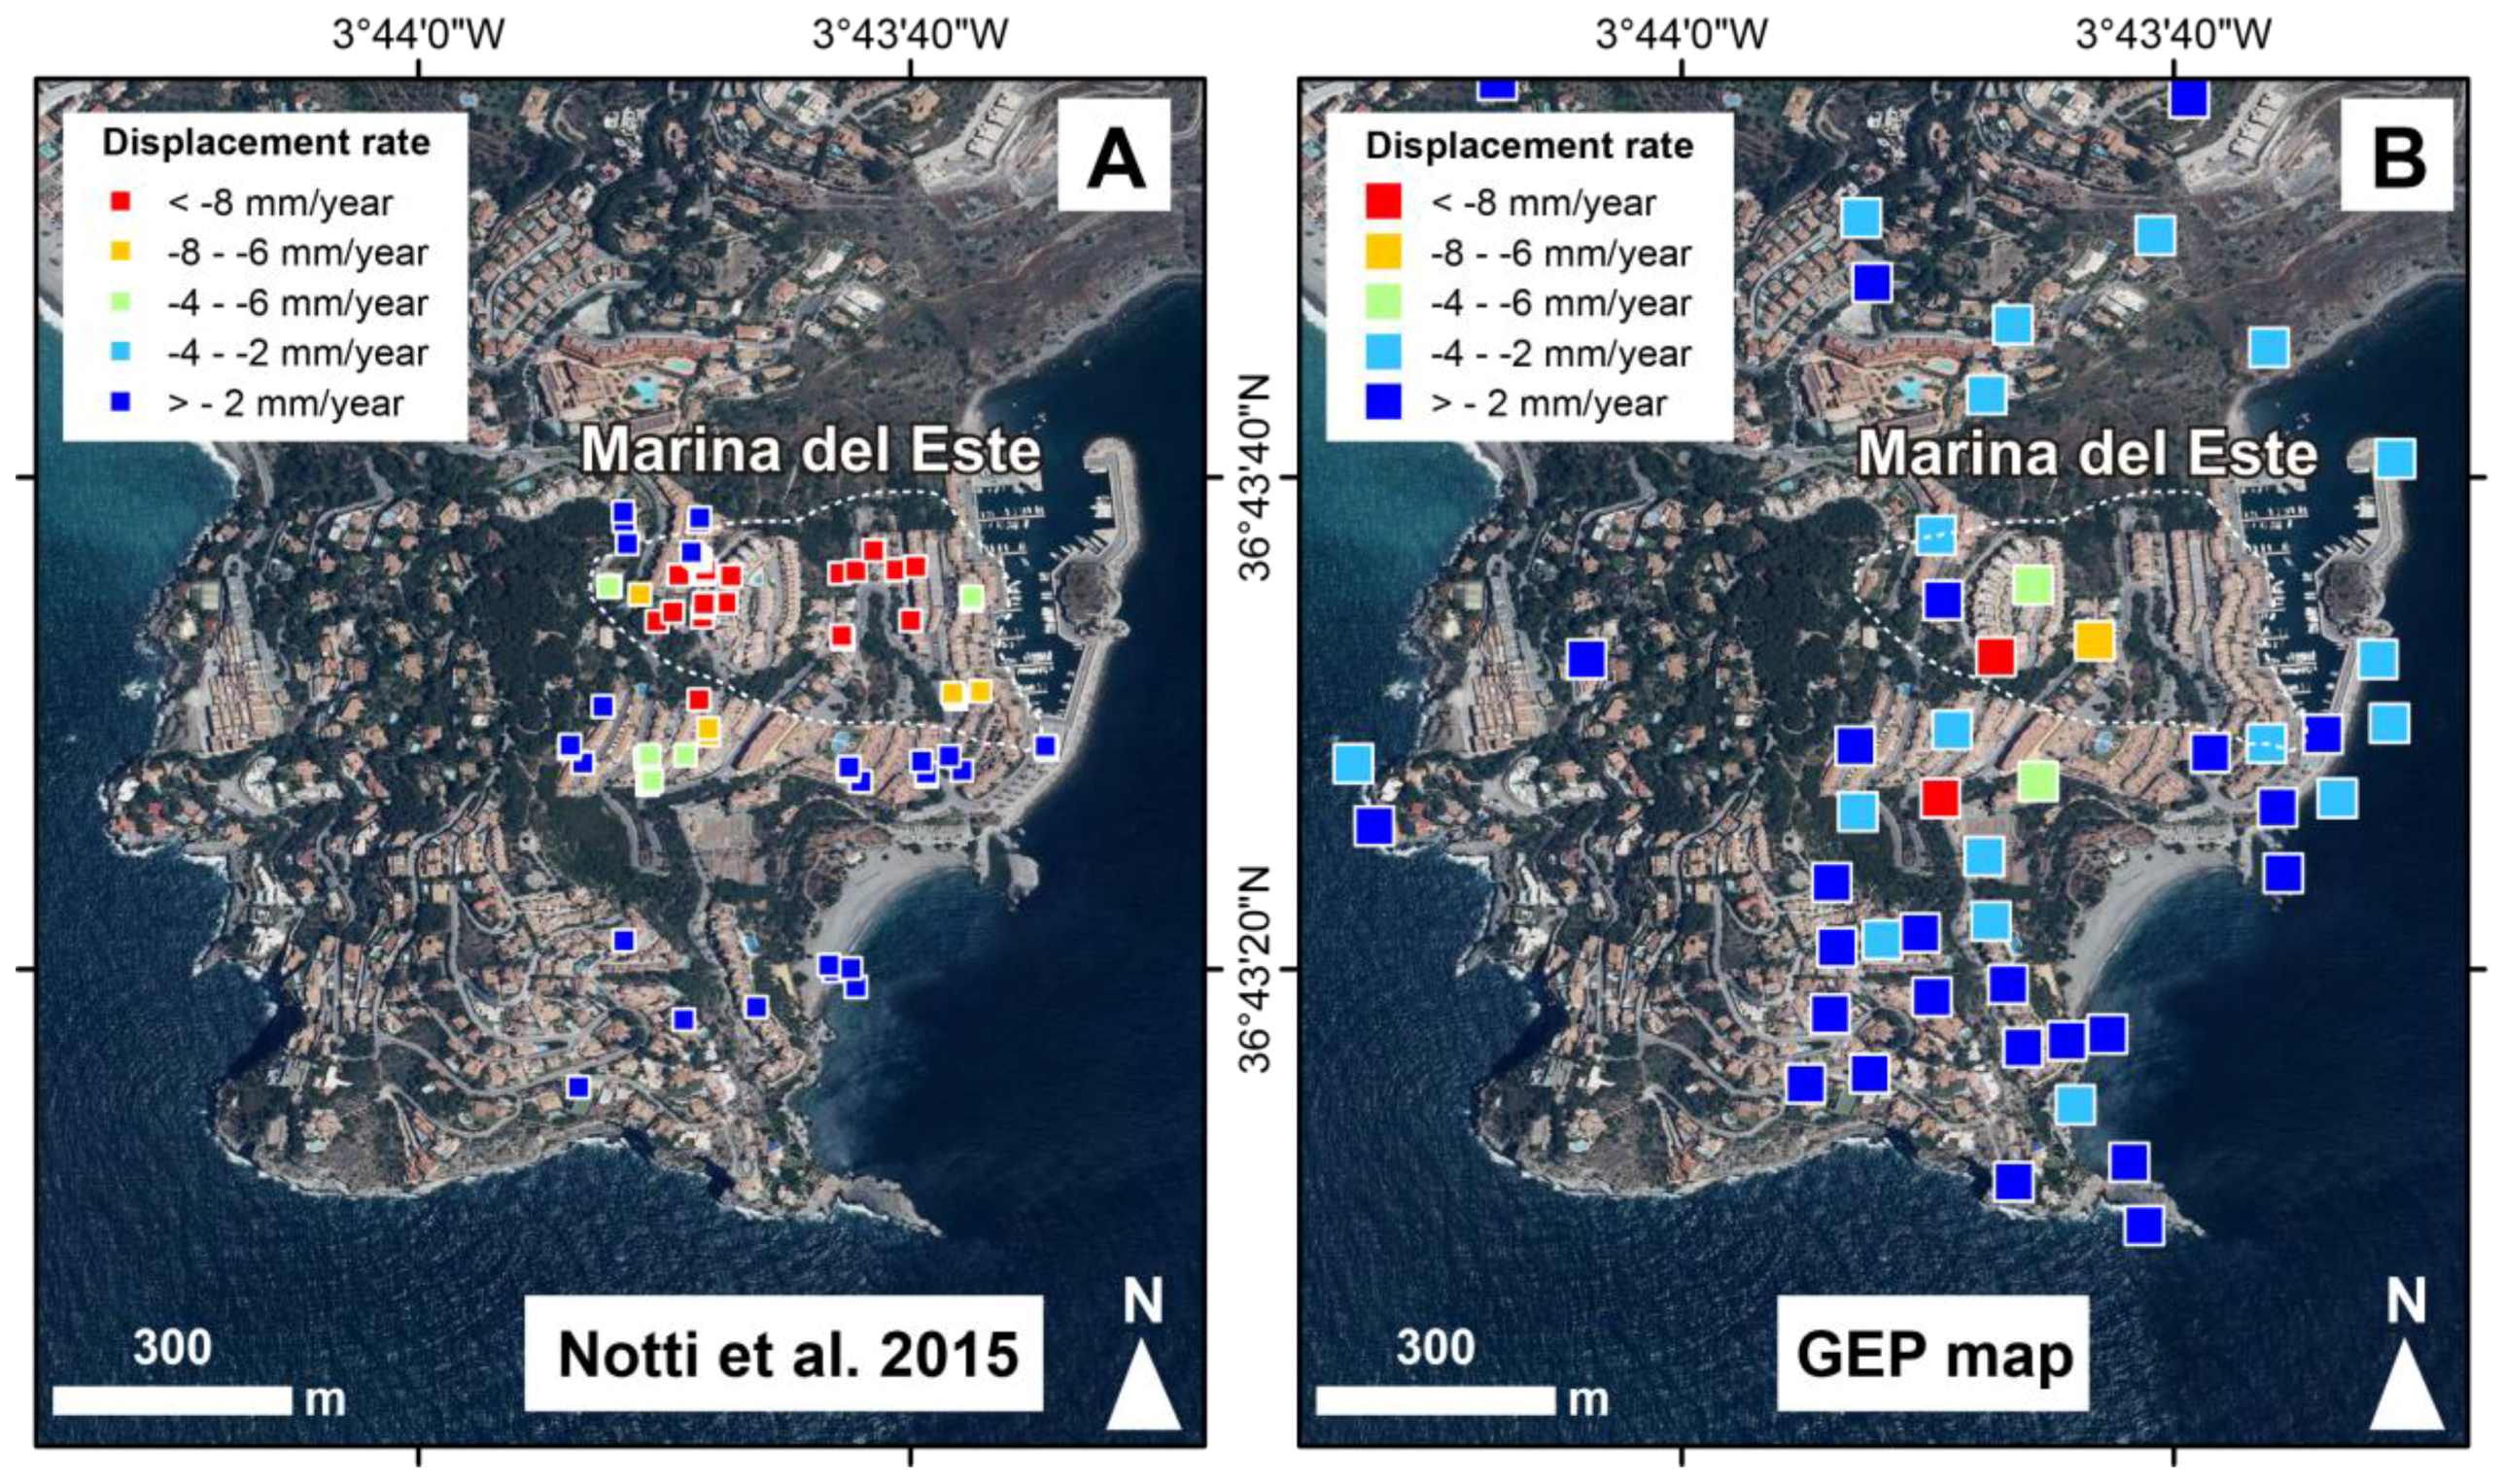
4.1. Comparison of GEP Results with Previous Data

The results derived by the SBAS InSAR service were initially compared with independent InSAR data available for the study area (Table 2). These data were derived using different approaches and techniques than those that were used in this project to generate InSAR velocity maps. In the following lines, we present several cases to show the correlation of the displacement rate values between the InSAR velocity map produced in GEP and previous InSAR derived data.

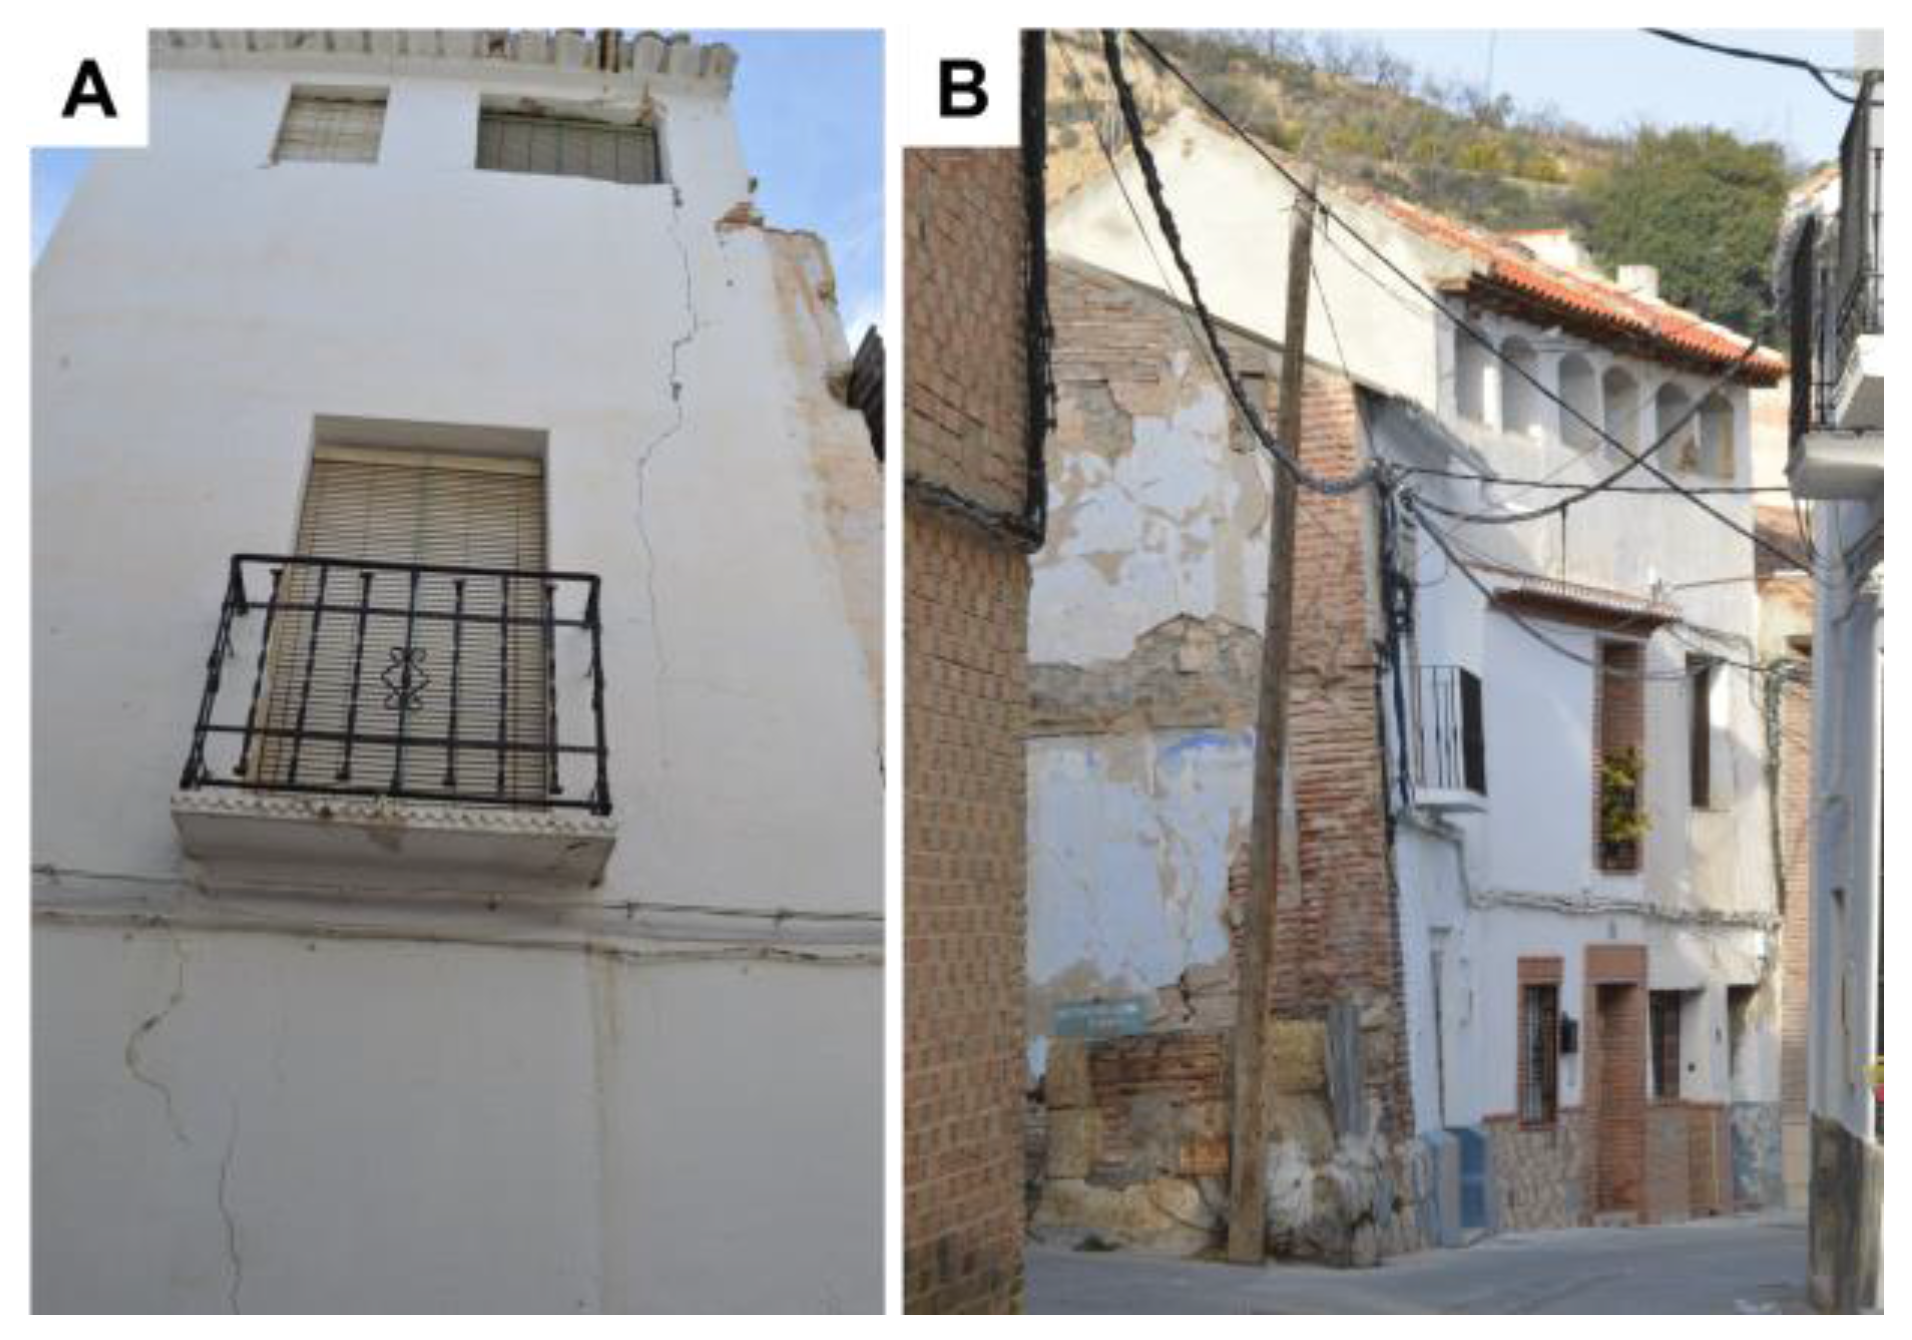
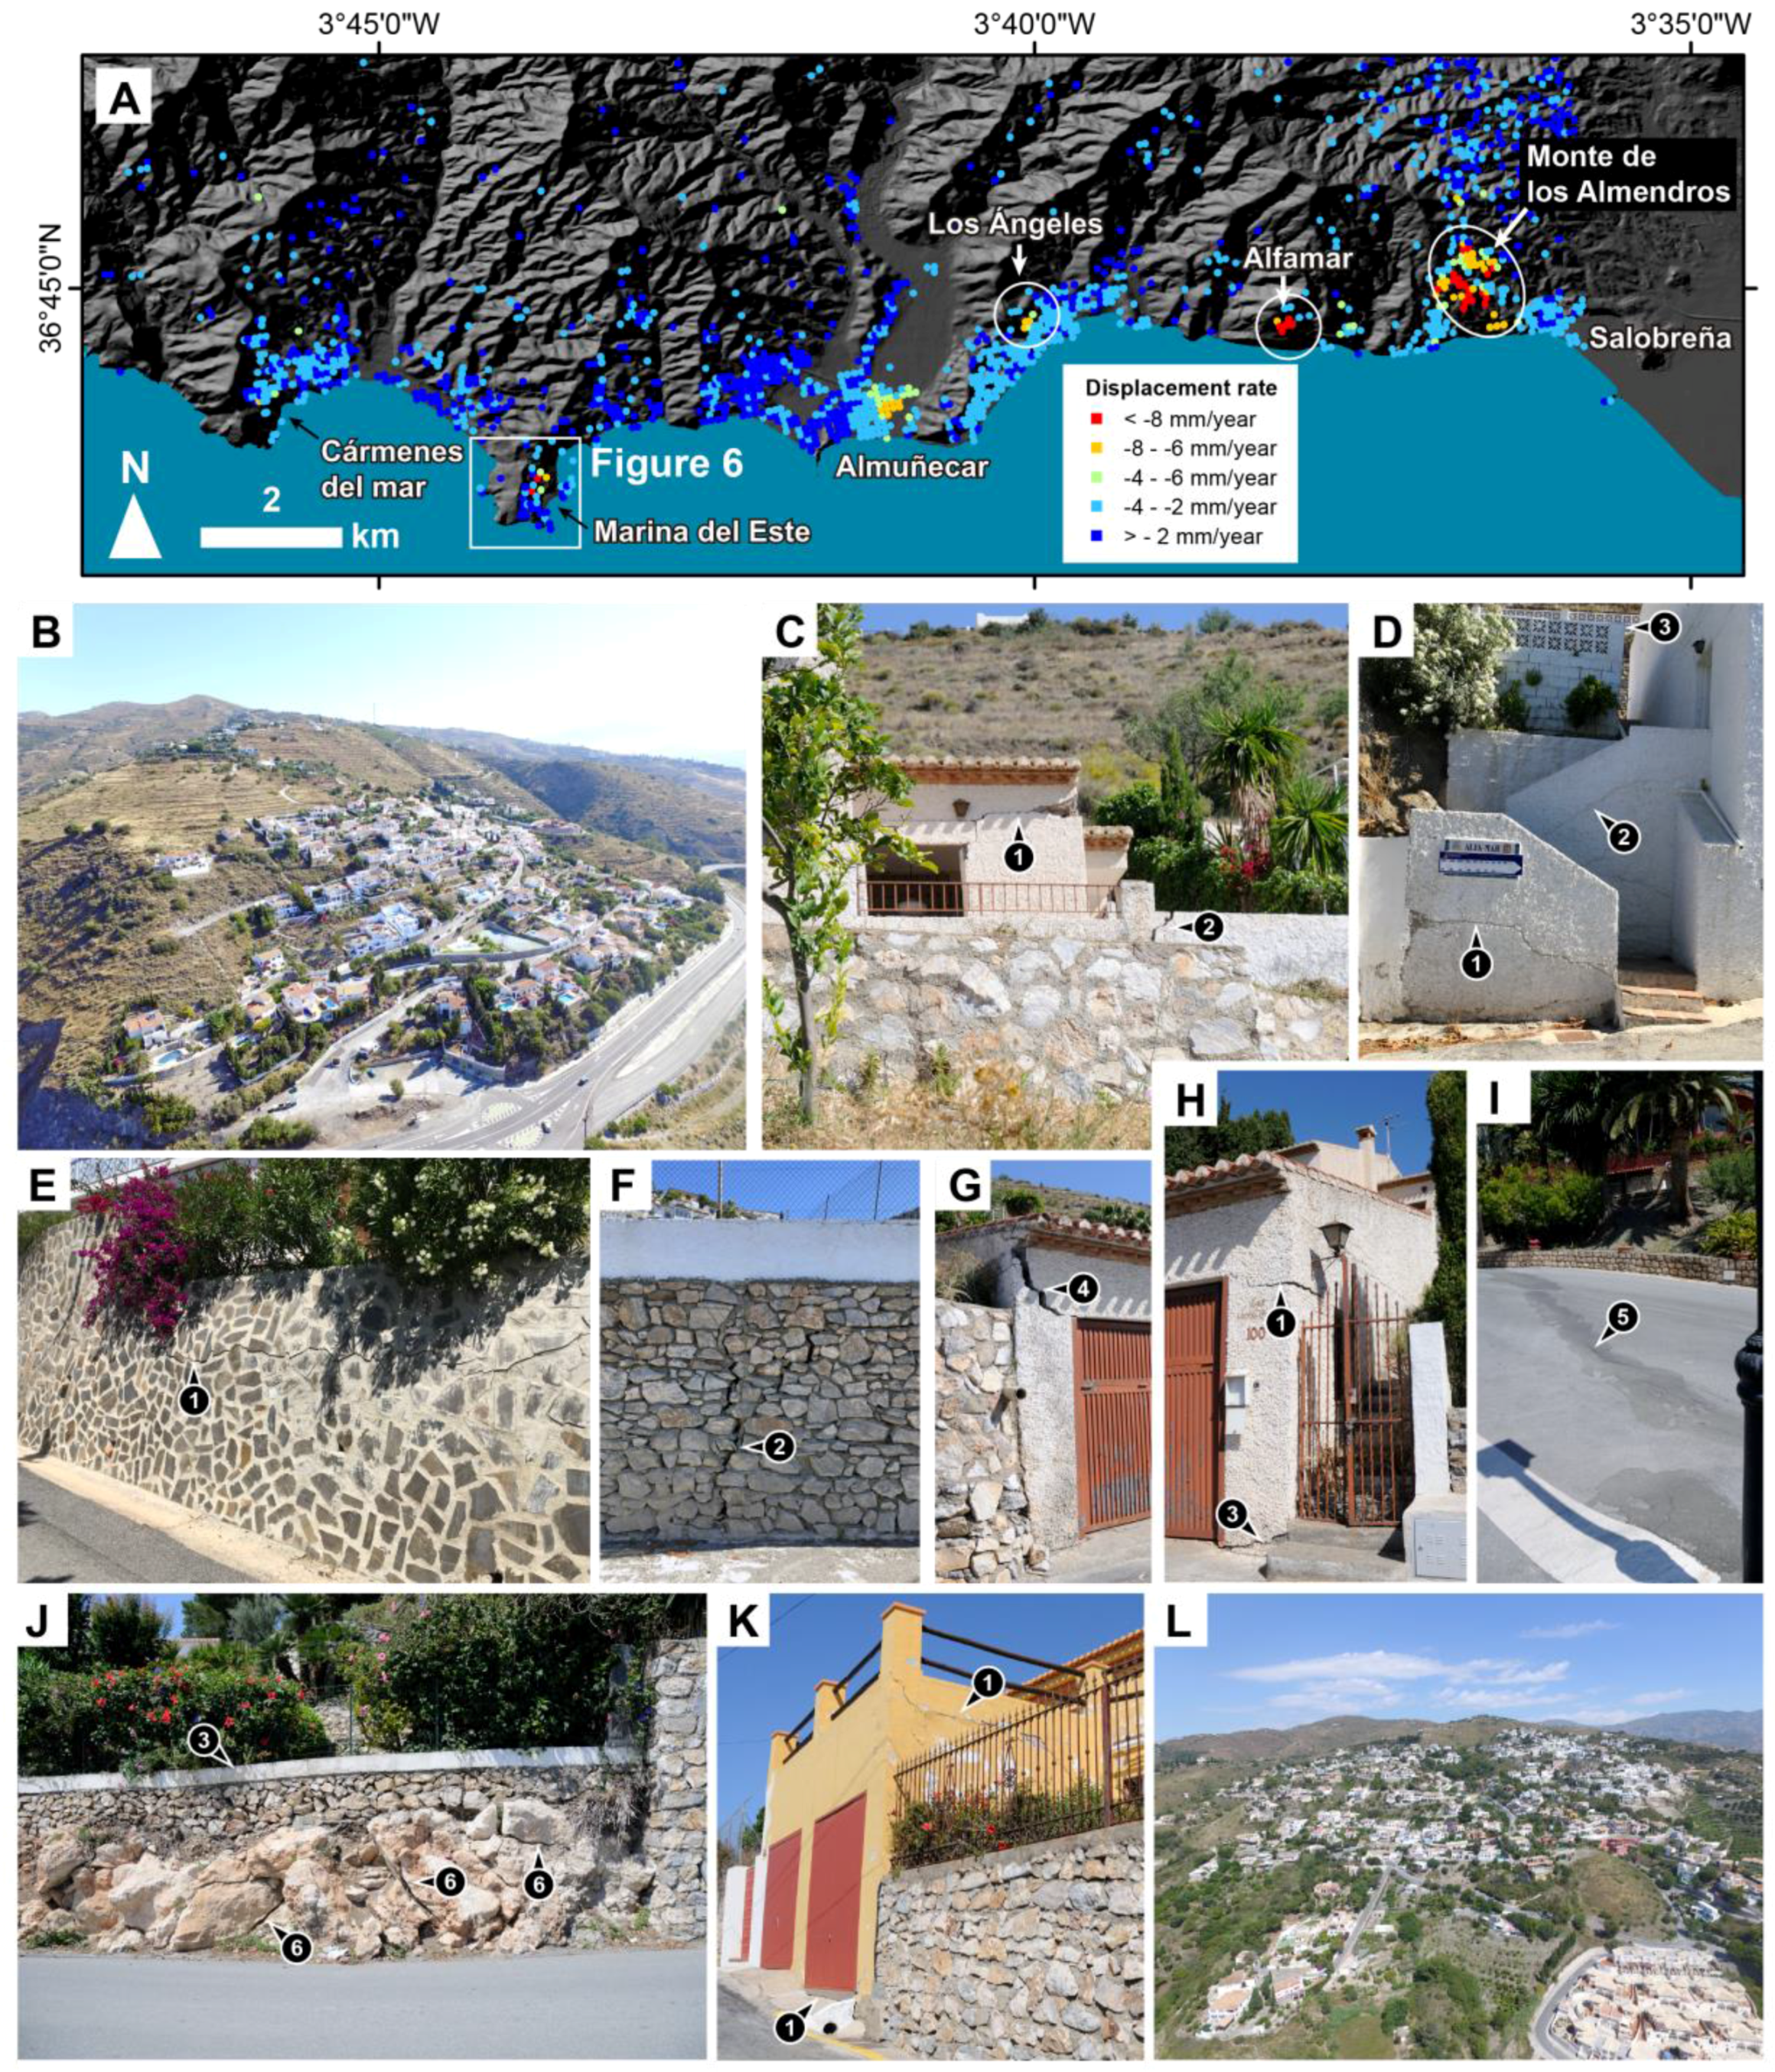
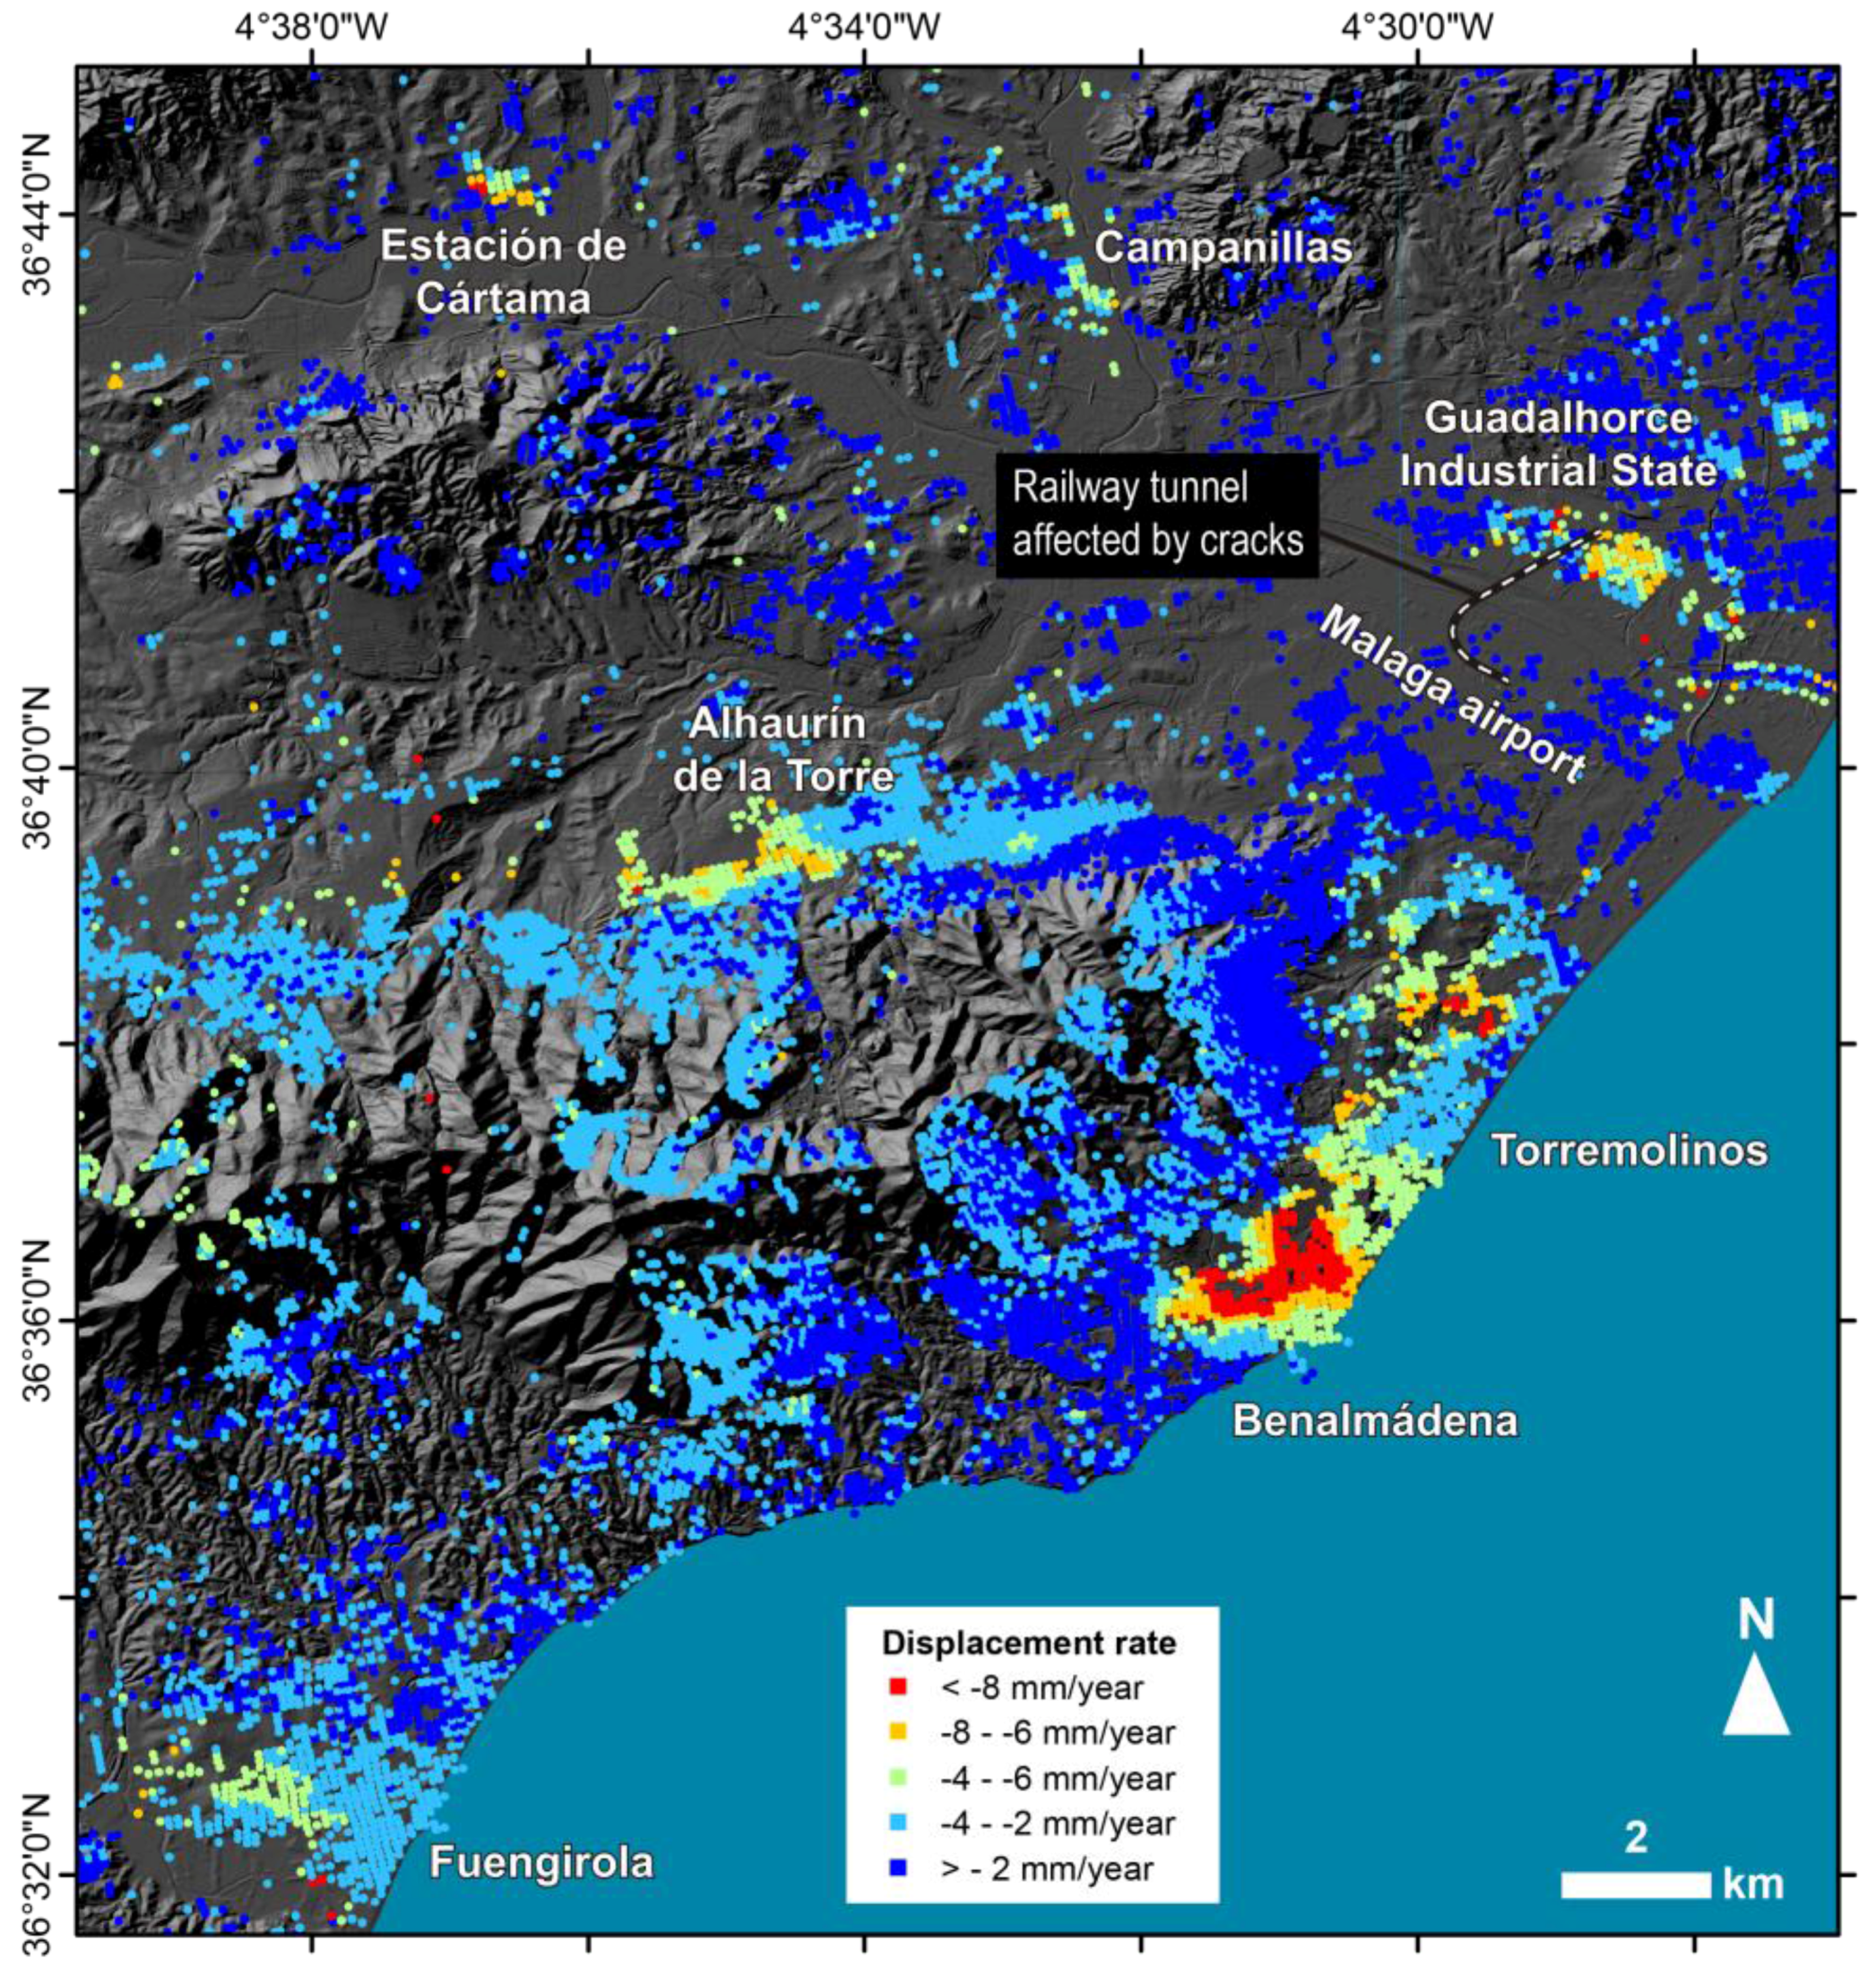
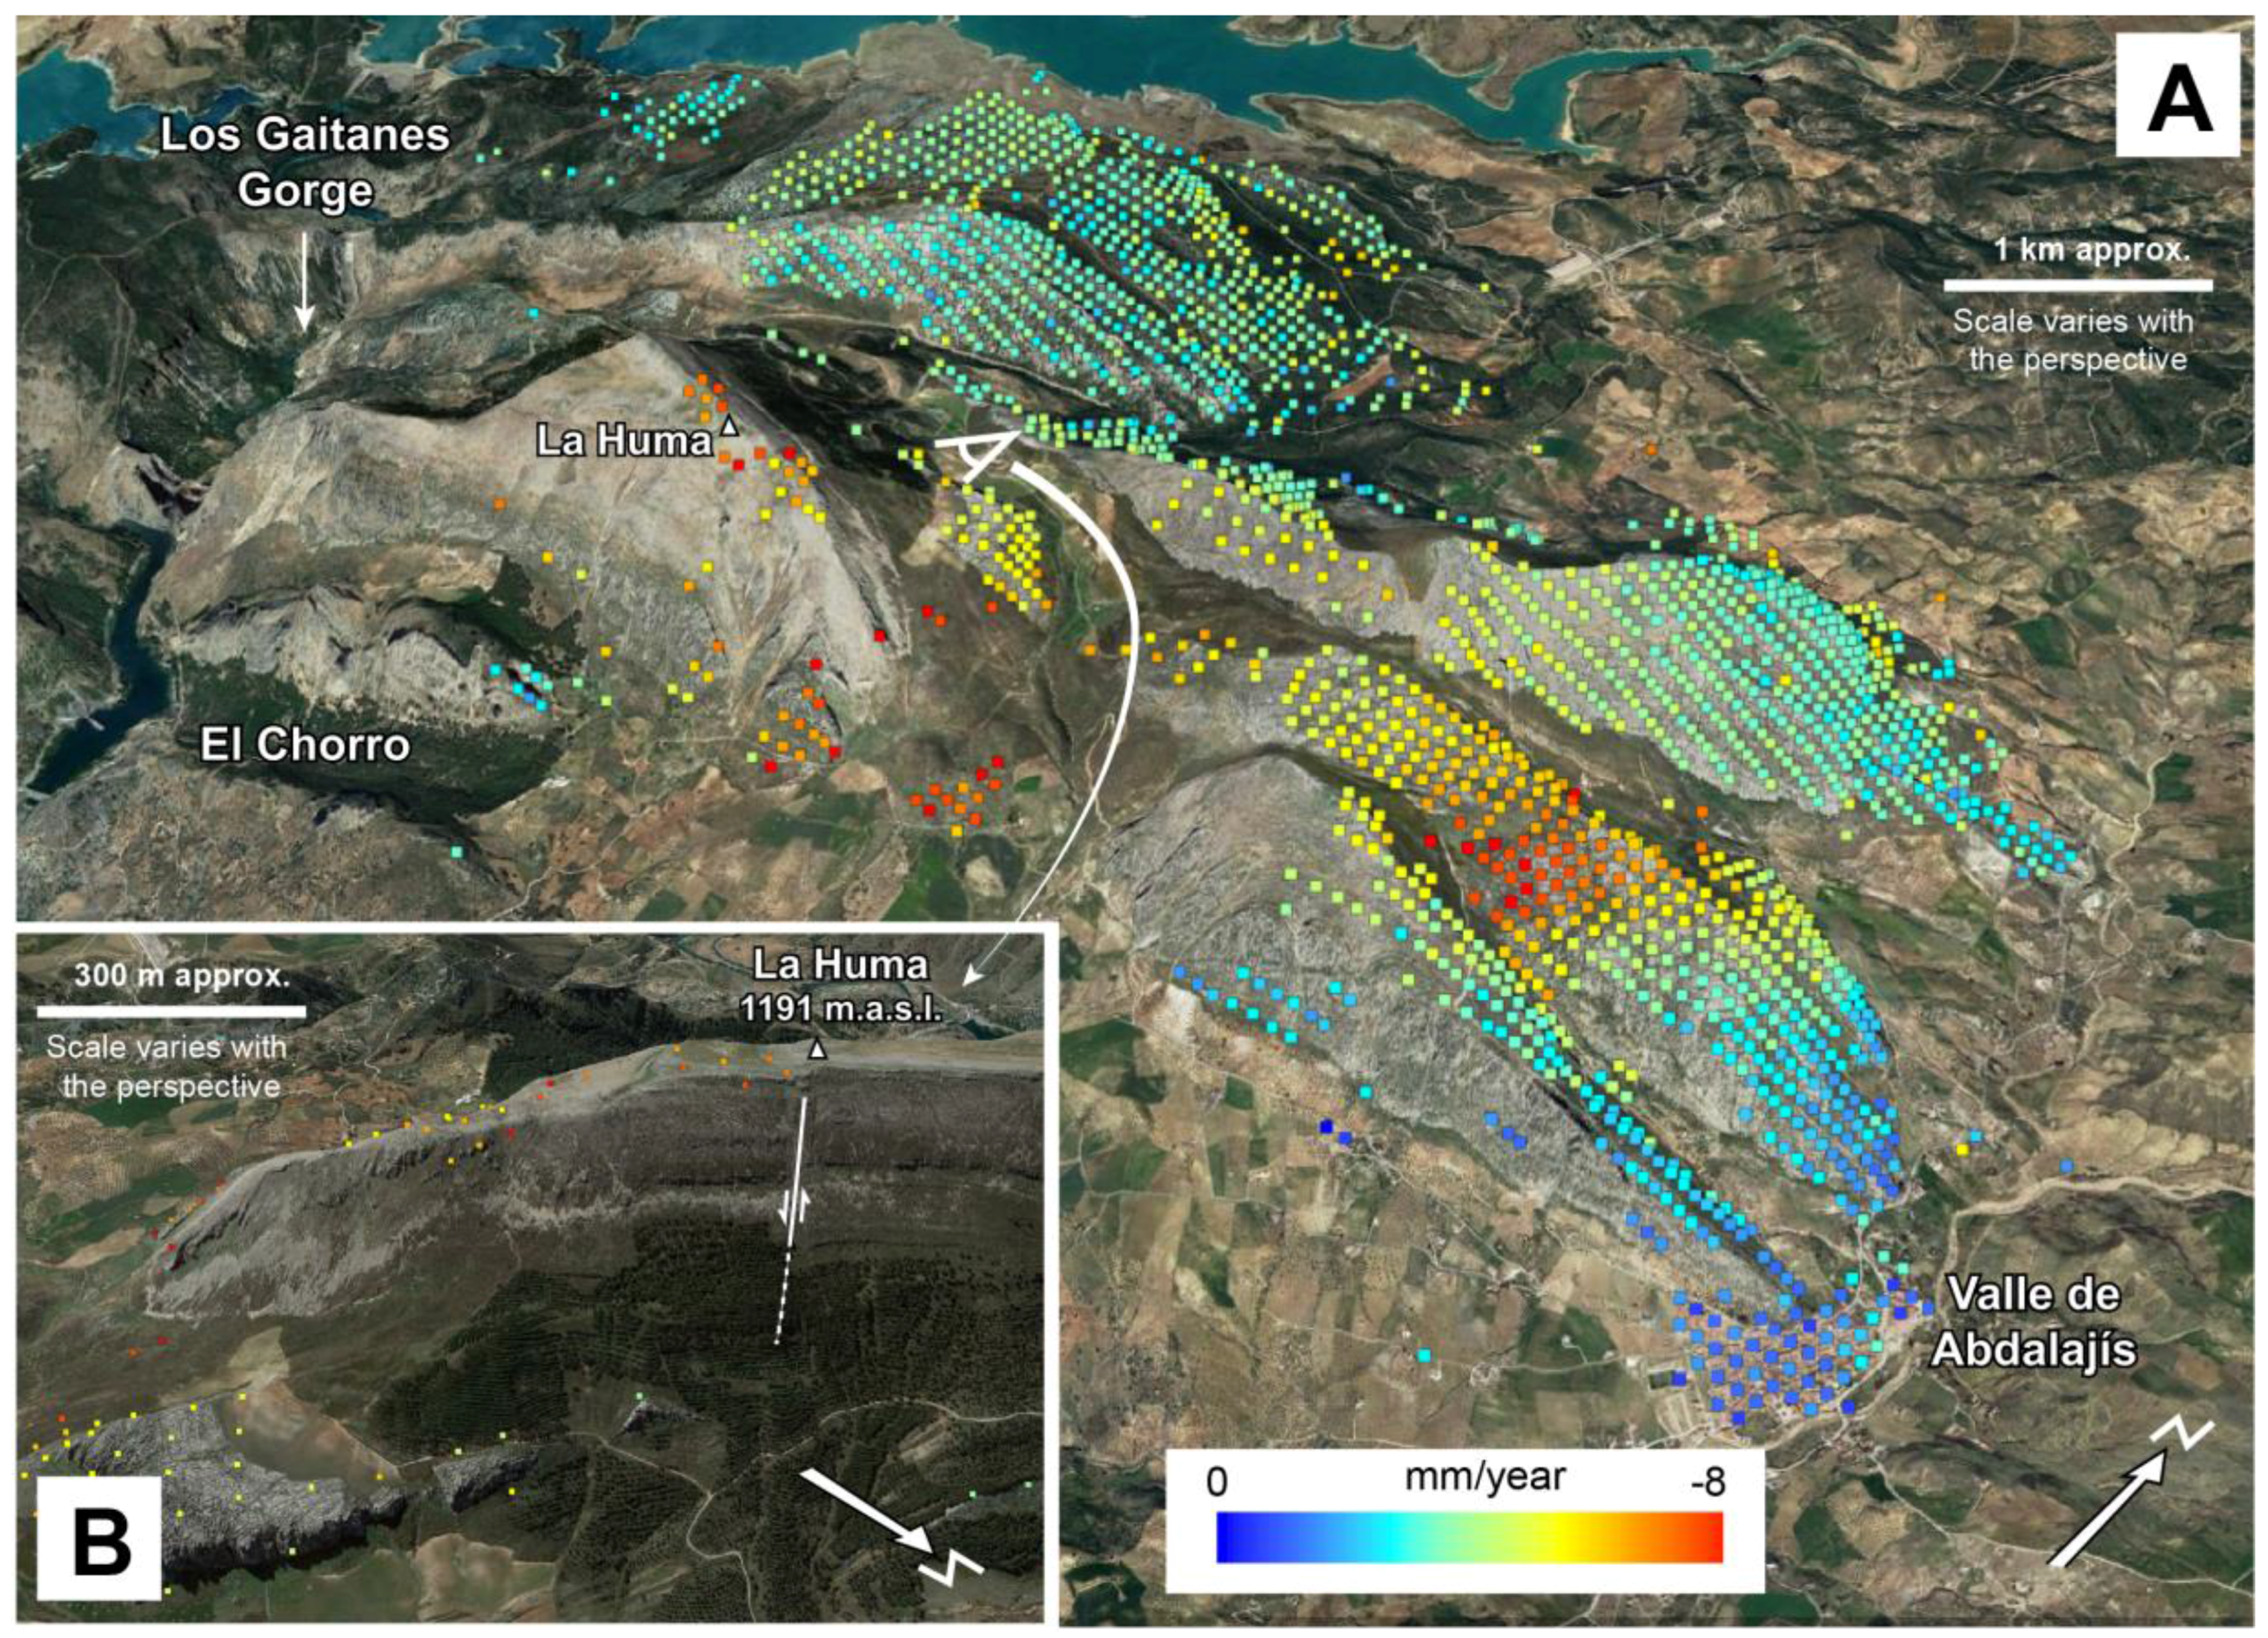
4.1.1. Movements Related to Slope Instabilities

There are two well-known cases of active landsliding in the eastern sector of the study area: the Albuñuelas and Marina del Este active landslides. The slow-moving landslide that affects the Albuñuelas village was one of the first landslides that was analyzed using InSAR methods in Spain [30]. The activity of this landslide is evident in the tilting of various buildings within the village (Figure 4). Fernández et al. [31] measured the movements in this place analyzing ERS1/2 images with the Small-Area PSI approach [37]. Their data fit well with the measurements given by GEP although the time span is different (Figure 5). This indicates that the observed displacements detected with images from 1993 to 2000 continue during the period between 2003 and 2008. The movements are currently active as the fresh cracks observed in the buildings and broken gypsum marks on fissures demonstrate (Figure 4A).
The Marina del Este landslide has been studied recently by Notti et al. [18] processing ENVISAT ASAR images through the PSI approach [38]. These authors provided accurate InSAR measurements in an active landslide that is generating moderate to severe damages in the buildings of a luxury urban resort on the Granada coast. The activity of this landslide can be also identified in the GEP’s InSAR velocity map (Figure 6).
With respect to the measured surface movements, the minimum LOS displacement rates of −13 and −17 mm/year were measured in previous studies in the Albuñuelas and Marina del Este landslides, respectively [18,31]. The GEP map provides values indicating displacements, such as those above indicated; minimum LOS displacement rates of −8 mm/year in Albuñuelas and −9 mm/year in Marina del Este. In these two cases, the difference between our measures and the previous ones are related to the spatial resolution of the data. The data of Fernández et al. [31] and Notti et al. [18] show more point density (points/km2) than the GEP output. In the case of Albuñuelas, the difference between measurements could be explained by the different time span of the analyzed images.

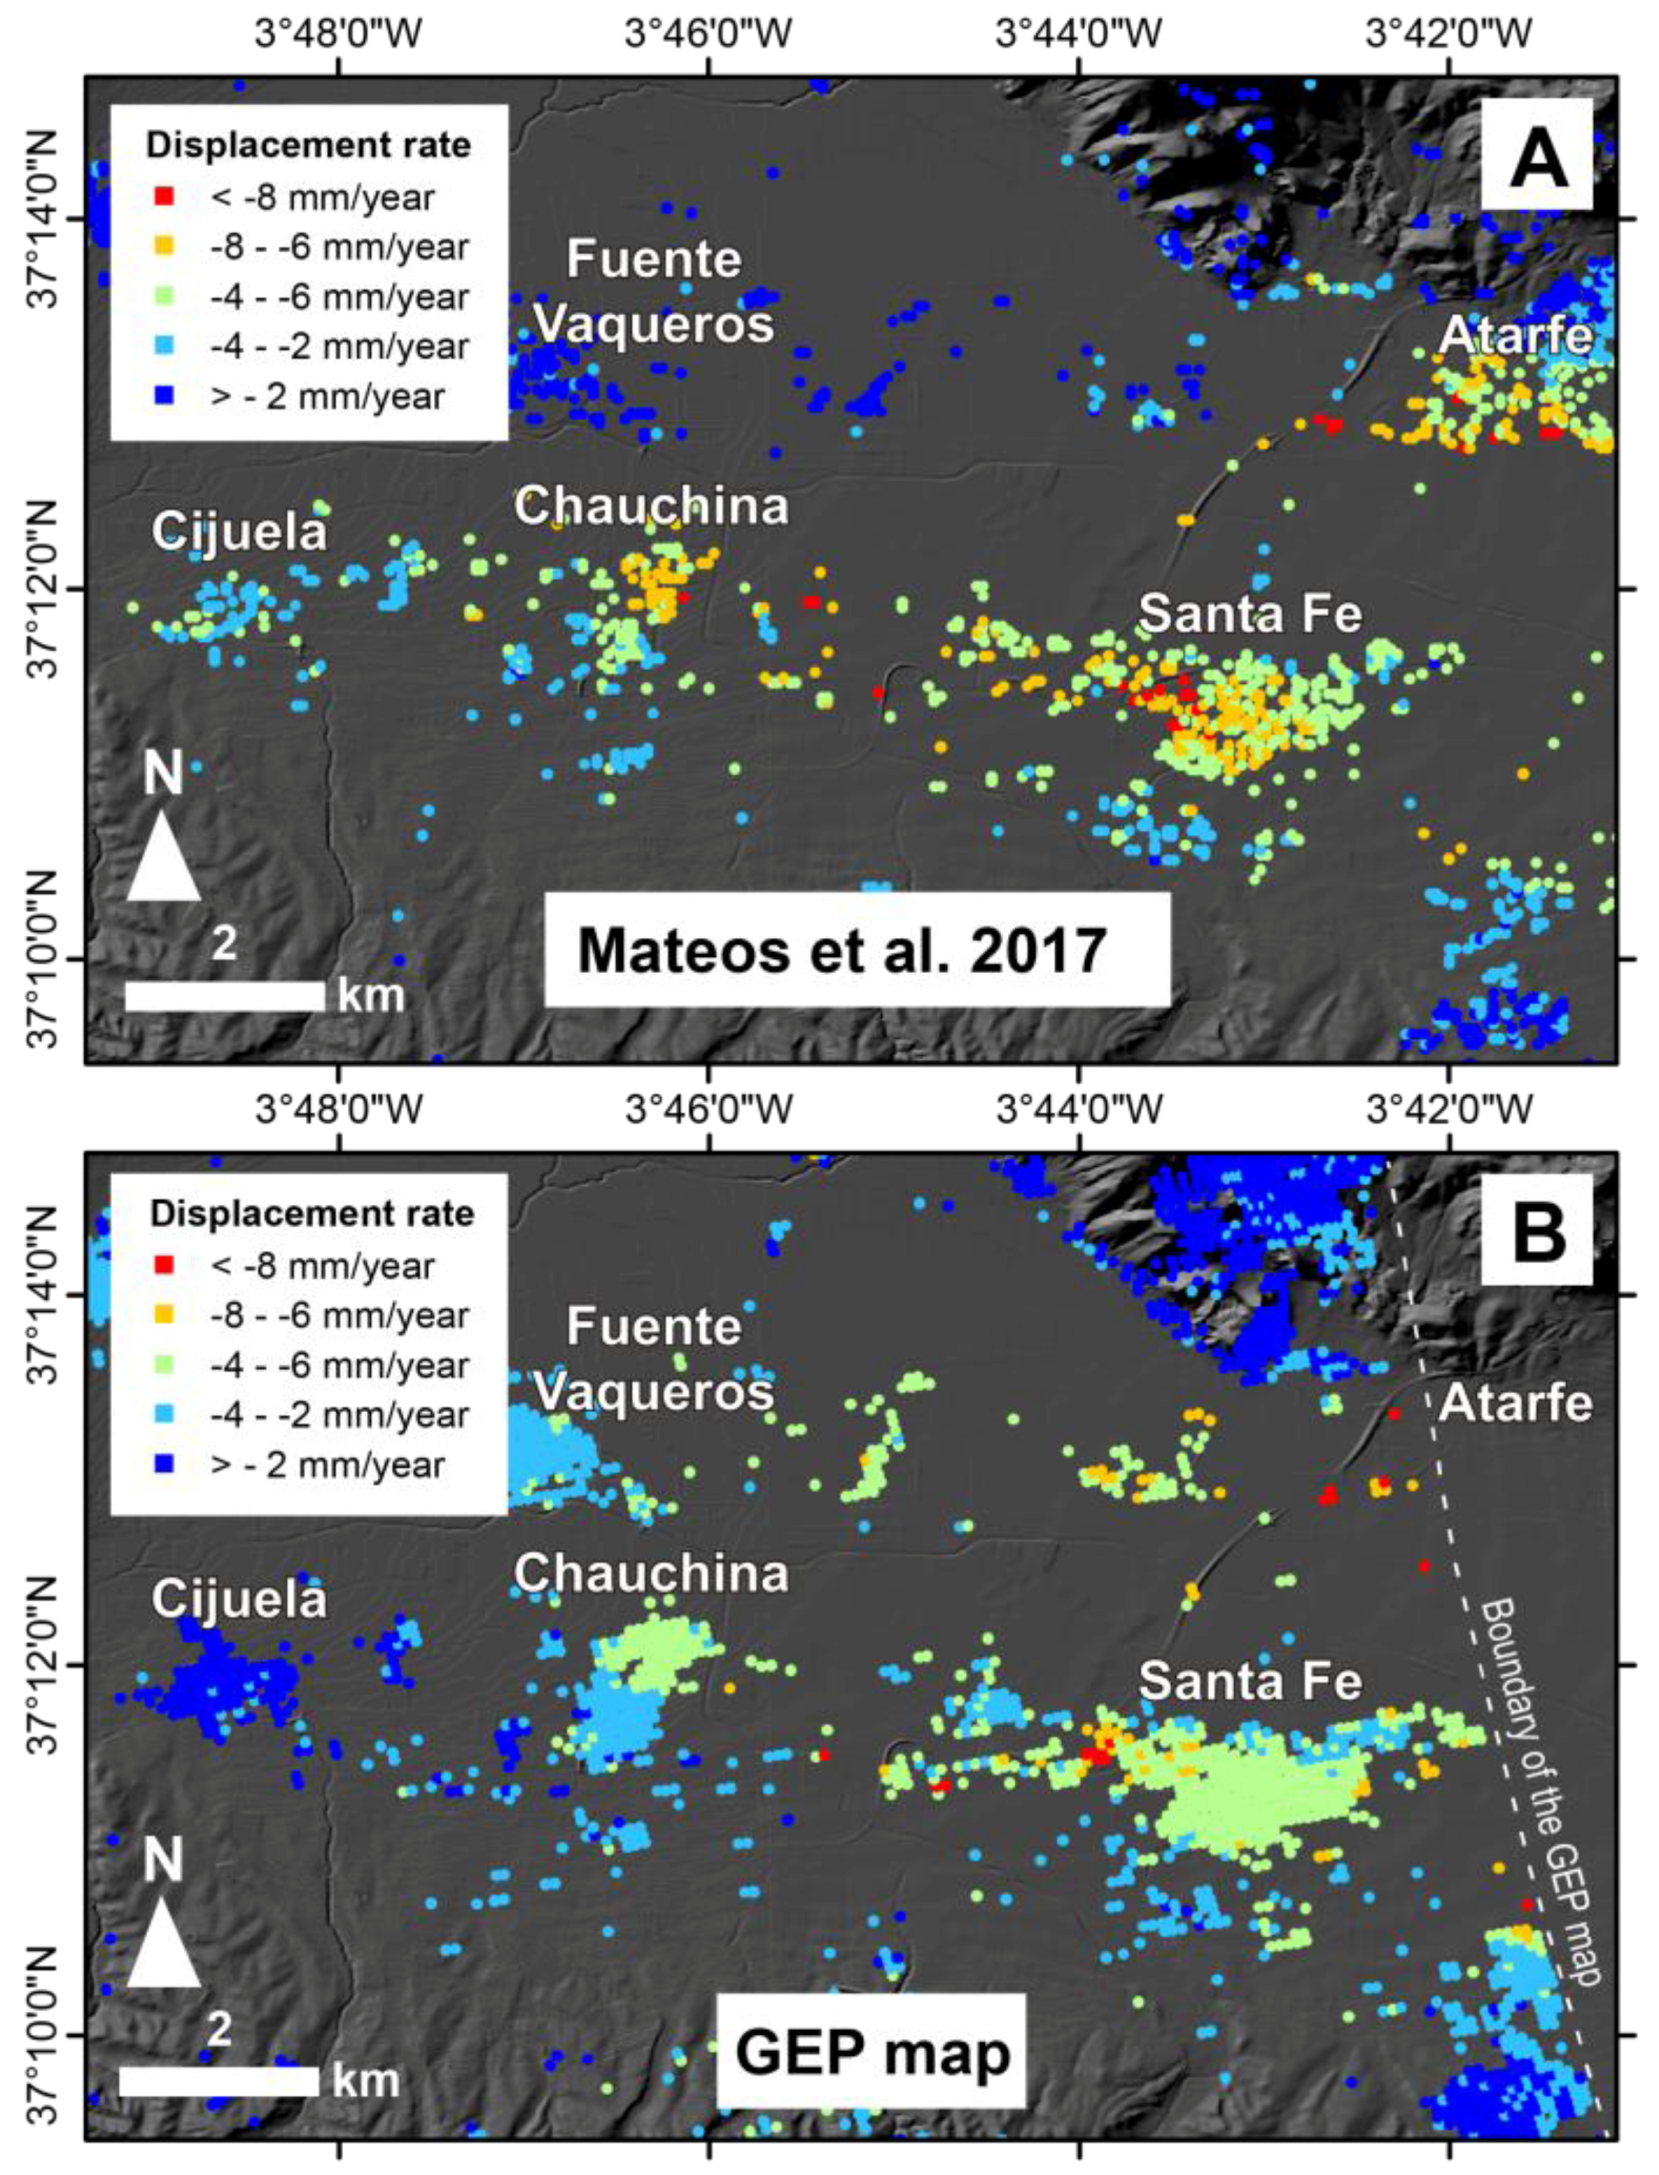
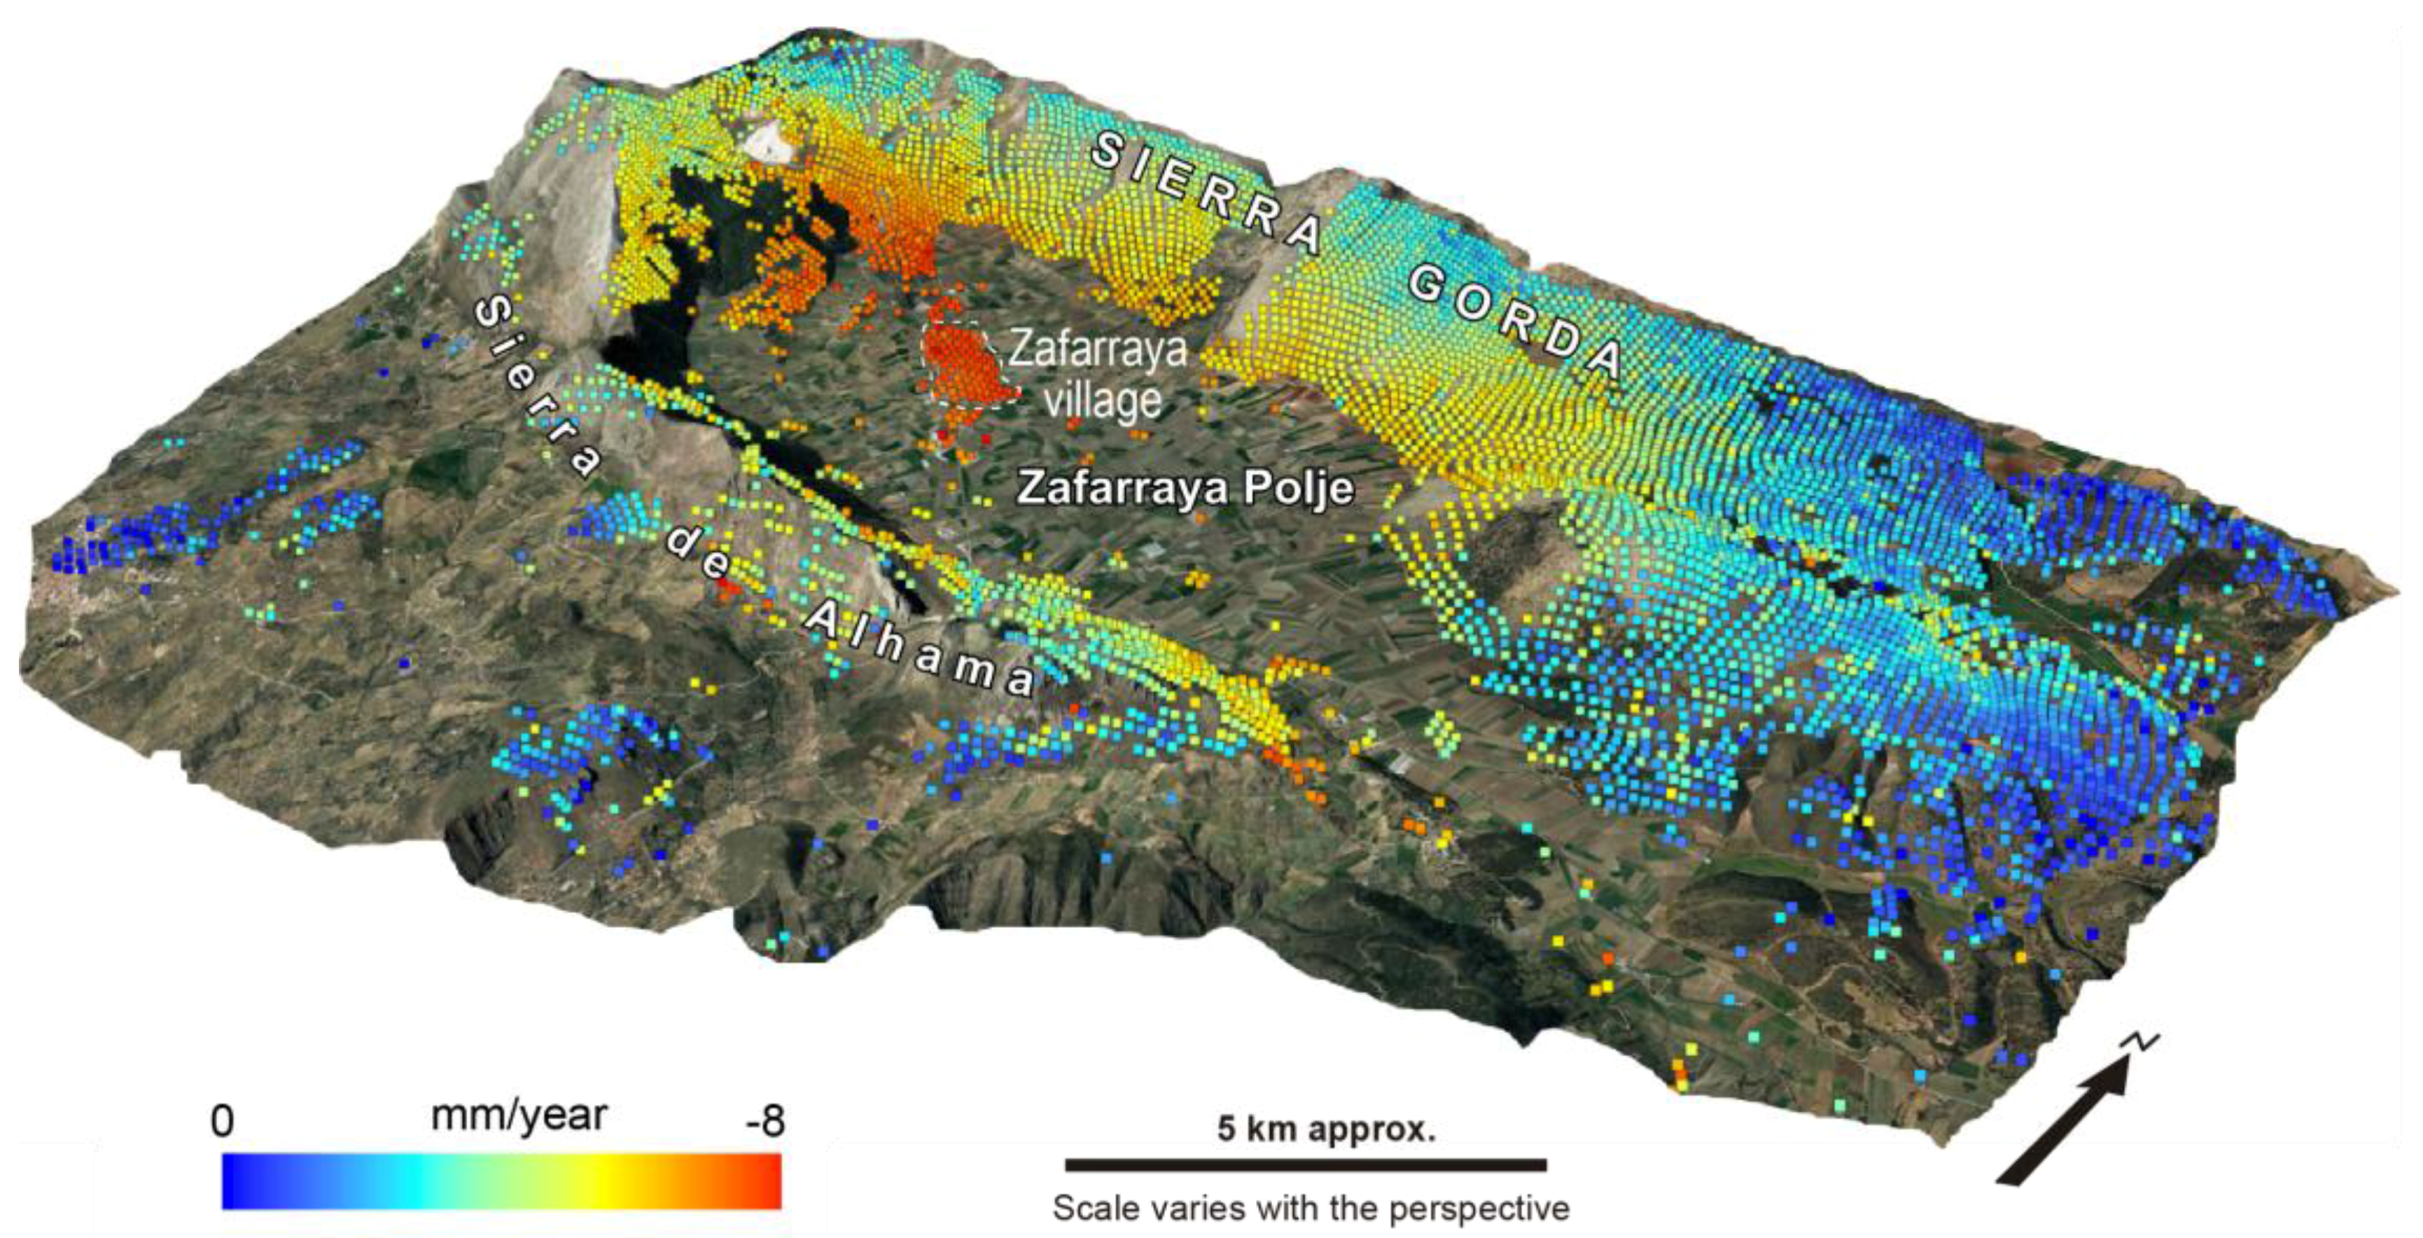
4.1.2. Movements Due to Groundwater Withdrawal

The South of Spain is dotted with many cases of aquifer overexploitation that produces surface subsidence as in the widely known cases of the Vega media of the Segura River and Guadalentin basin [39,40]. However, the situation due to groundwater withdrawal in the central Betics has received less attention until the publication of several InSAR analysis [19,21,31,32,33]. One example described in this publication was used to evaluate the GEP’s InSAR velocity map: the subsidence in the Vega de Granada aquifer [21].
The active subsidence described by Mateos et al. [21] is clearly shown by the GEP’s velocity map. The spatial pattern observed in the GEP map agrees with previous data obtained by applying the PSIG Cousins analysis [41] in the Vega de Granada (Figure 7). Regarding the measured displacement rates, GEP map points out the minimum LOS displacement rates of −13 mm/year in the Vega de Granada. These values are coherent with the minimum rates (−10 mm/year) estimated by Mateos et al. [21] analyzing the same ENVISAT ASAR images.

4.2. New Active Processes Detected with GEP

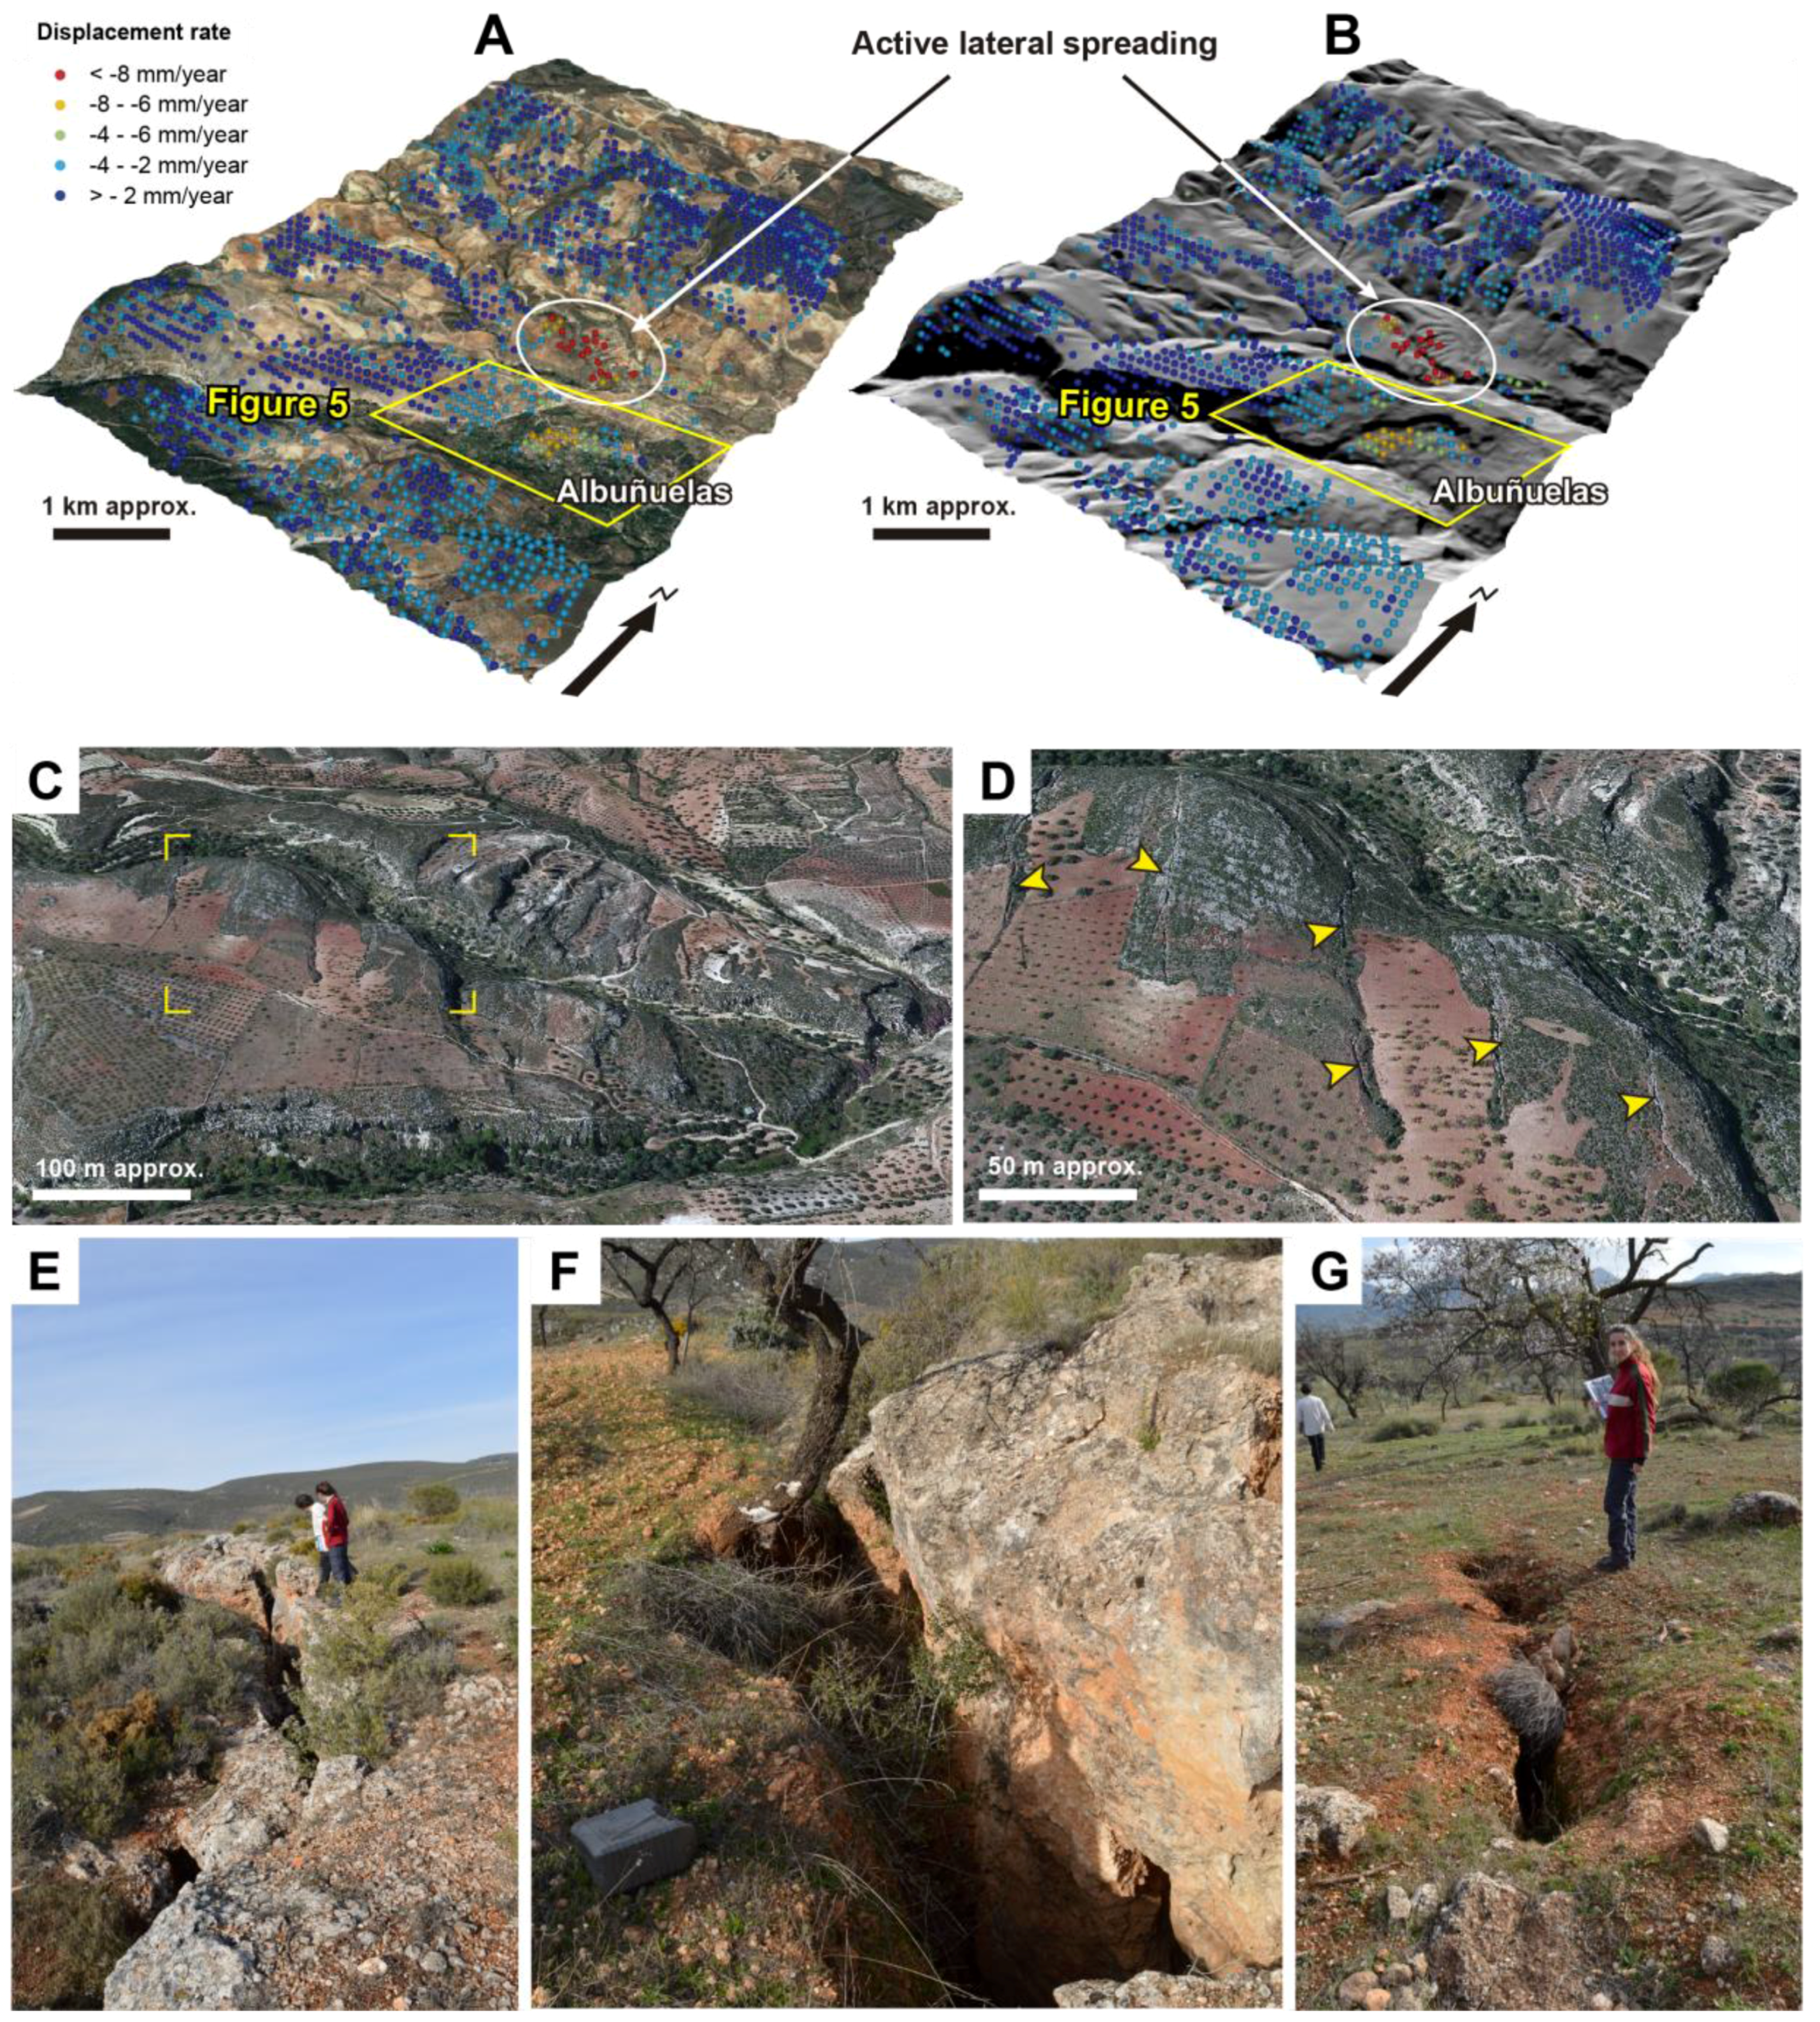
4.2.1. Deformation Related to Slope Instabilities

Aside from the example of Marina del Este, other urban resorts in the Granada coast have suffered ground stability problems. Information about these problems is scarce and it has been only reported in private reports and some local publications [42]. The InSAR velocity map that is provided by GEP indicates centimeter-level displacements in Los Angeles, Alfamar, and Montes de los Almendros resorts (Figure 8). We carried out a damage survey to check the impact of these displacements in the buildings of these resorts and we verified that the detected movements are producing minor to moderate damages. The Figure 8 shows the most representative damages that were observed in the field. The degree of damage is not directly correlated to the magnitude of the movement, but it concerns to the building age and maintenance. The most severely damaged buildings are the oldest ones because they had had to accommodate more deformation (Figure 8C,D,G,H). With regard to the newest urban developments, the evidence of deformation is clearer in those buildings that are poorly maintained (e.g., Figure 8K). Even in some well-maintained buildings, we were able to recognize cracks and fissures that were repaired and/or recently painted to improve the appearance of the buildings affected by deformation. In any case, the active movements in the slopes are evident by the ubiquitous damages in walls and driveways (Figure 8E,F,I,J), and also the open fractures that were observed in the bedrock (Figure 8J).
Additionally, the GEP’s InSAR velocity map helped to identify several active landslides that were not documented up to date. The best example is an active lateral spreading phenomenon that was discovered close to the Albuñuelas village. This mass movement covers ~1 km2 and mobilizes Tortonian calcarenite rock blocks that run on clays of the Limos Rojos de Albuñuelas Formation, creating a basin and range structure at hillside scale (Figure 9). Activity of the lateral spreading is evidenced in the field by open cracks with apertures of meter scale, pipes in the area covered by surficial deposits, and fresh fractures with vertical steps (Figure 9E–G). This mass movement produces a distinctive landscape that was not studied up to now. Only the information provided by GEP helped in the recognition of such impressive active landslide.

4.2.2. Deformation Due to Groundwater Withdrawal

There are many examples of recorded displacements along the Malaga coastal strip. With regard to InSAR studies, Ruiz et al. [33] were the first that identified subsidence in this area by processing ERS SAR images that cover the period from October 1992 to November 2000, using the Stanford Method for Persistent Scatterers—Multi-Temporal Interferometry (StaMPS-MTI) [43]. These authors report active subsidence in Benalmádena, Torremolinos and in the mouth of the Guadalhorce River. The same subsidence pattern is clearly identified in the GEP map, and, additionally, we detected other areas with displacements hitherto undocumented within the Guadalhorce valley (Figure 10). They can be probably related to groundwater withdrawal due to the urban development, as in the published case of Otura [19]. These places are located in the narrow coastal plains of the Malaga and Granada coast and inland in the Guadalhorce Valley. The extensive urbanization that is linked to tourism has created new water demands that produced groundwater overexploitation of the coastal and alluvial aquifers and the related subsidence due to aquitard consolidation. The possible subsidence areas located thanks to the GEP map are in the villages of Alhaurín de la Torre, Estación de Cártama, Campanillas, Fuengirola, and Almuñecar (Figure 8A and Figure 10).
Most of the movements that were detected in the study area were not reported nor in the scientific literature nor in technical or press reports. Neither people who live in these areas are aware of the surface deformation because this deformation probably produce unnoticeable settlements. There is only one case reported that may be related to the identified movements. The open cracks appeared in the railway tunnel between the Guadalhorce industrial state and the Malaga airport may be associated with the displacements detected just in the area crossed by the railway line (Figure 10).

4.3.2. Deformation of Unknown Nature

The GEP’s InSAR velocity map shows displacements in an area called the Zafarraya Polje (Figure 11), a karst depression that is formed by normal and lateral tectonic displacements [44]. The movements in this area were already detected by Ruiz-Armenteros et al. [45], but his interpretation is highly controversial. At first sight, it seems to be related to aquitard compaction due to dewatering of the sediments that infill the karst depression. However, the displacements are also detected where the carbonate bedrock crops out. This fact does not fit well with the hypothesis that is linked to the dewatering of the surficial deposits. Ruiz-Armenteros et al. [45] argued that the observed displacements might be consequence of the activity of the Zafarraya normal fault.
In the study area, there are other areas affected by displacements hitherto unknown. The place where the movements are the clearest but their explanation needs a specific analysis is the ranges of the Valle de Abdalajis. The surface velocity map shows two areas in the top of the hills that are affected by a surficial slight deformation. In this case, it cannot be invoked the effect of groundwater level fall because there are not intensive water pumping and the observed deformation is quite localized. It seems that we are dealing with a type of deep-seated gravitational slope deformation (DSGSD) that is not previously registered. This slope movement appears to involve large blocks of Jurasic limestone that move over the underlying Triassic materials (evaporites, marls, and dolomites) (Figure 12). Similar examples are described in the Betics, Iberian Chain, and Pyrenees [46,47,48].
The above explained two cases show how InSAR analysis usually provides information that is difficult to interpret because different processes can be responsible of the detected motion and the measured signal can contain, apart from ground deformation, contributions from different sources (e.g., atmosphere, DEM, orbits, [49]). For these reasons, further studies need to be carried out in order to unveil the nature of the observed displacements.

5. Discussion

The objective of our analysis was to test the GEP platform as a detector of areas that are affected by surface movements. We were not validating the SBAS technique; the reliability of any InSAR processing technique could not be simply validated via one or two case studies, and that technique has already been widely evaluated. In addition, the quality of InSAR-derived results can be affected by data availability (or acquisition gap), aps conditions, baseline status, ground features, and processing strategies. Thus, due to the existence of the discrepancies raised by a different processing philosophy, cross comparison with other processors might not well support an InSAR technique reliability assessment sensu stricto. With that in mind, the term “reliability” in our study must be understood as “the capacity of the SBAS InSAR service of the GEP platform to show areas in motion”. We are not discussing the quality of the measurements; we show that, where GEP indicates areas in motion, we have several lines of evidences (previous InSAR data, damage surveys, field observations, and published and unpublished information about active processes) that reveal the existence of those movements. Thus, we can say that the GEP currently represents a very useful tool that reduces time and effort to produce surface displacement maps for locating areas in motion.

5.1. Advantages and Limitations of Web-Based InSAR Processing Tools

The results that are presented in this paper support the reliability of the SBAS InSAR service. The outputs of this service have been checked with data from previous publications or are processed by our team, which is independent from the developer-team of the GEP platform. Results that are obtained by different teams never will be equal because the chosen reference points, applied algorithms, and parameters. In spite of these limitations, the movements shown in the velocity map provided by GEP, and especially the displacement patterns, are in a good agreement with previous InSAR measurements that are obtained through different approaches.
Despite the success that was achieved in the South of Spain, the SBAS InSAR service within the GEP platform has some limitations that must be considered. At present, GEP is a beta-prototype and has to improve some aspect of its interface and processing options. One of the major drawbacks of the GEP platform is the absence of an error-handling tool. Actually, the user does not know why a particular processing ended prematurely. Another important aspect is related to the selection of the reference point. If the point that is selected by the user is not coherent, the user does not know how the SBAS processing tool selects another reference point. Another less important limitation is related to the control of the coherence level. By default, this level is set to 0.7 and end-users are advised to do not modify it, as this could lead to unexpected results. This value of 0.7 ensures that accuracy and reliability of the measurements will be high. However, sometimes Earth scientists are prone to work with less accurate data, especially if they intend to delineate areas that are in motion, regardless of the local accuracy. Examples of this are the works of Galve et al. [6], Lu et al. [50], and Chaussard et al. [51], which analyzed karst subsidence, landslides, and active tectonics with coherence thresholds of 0.4, 0.6, 0.5, respectively. This is especially true if the main goal of the analysis is to carry out a preliminary exploration to select points that are to be visited later in the field. Therefore, it is needed to address these points better in the web-site and tutorials of GEP, for example advertising that lower coherence levels could be used in particular cases as the ones described or implementing a error-handling tool. The last relevant point to mention is related to the output formats of the SBAS InSAR service. Earth scientists normally handle spatial data by using GIS software, such as QGIS and ArcGIS®. At the noticeable exception of the PNG and KMZ files that are provided, it could be a good idea to implement the most-used vector GIS formats (Shapefile, GeoJSON, etc.) for the output files of the service. Moreover, the provided PNG images are scaled and some small areas that are affected by movements are not displayed. For this reason, it may be also useful to provide raster information at full resolution to identify areas in motion that are defined by only four or five measure points, as in the case of Marina del Este. Another option could be to manage the outputs directly in the Map window of GEP and to implement a time series tool to see the temporal displacements of a point or a group of points, in order to check immediately the effectiveness of the processing.
Notwithstanding, a system opened to a wide range of users needs to keep simple but also reliable to prevent malfunctioning and errors. SBAS InSAR service runs a simple unsupervised algorithm that only should be used as a preliminary analysis. Although the service allows for modifying the parameters of the analysis, the web-based platform acts as a black box for the end-users, making hard to check the influence of different parameter configurations. On the other hand, it must be taken into account that, thanks to the GEP, the SBAS InSAR service is able to generate, in only one day, displacement maps that cover several hundreds of km2. Thus, the service is an excellent tool to obtain preliminary displacement information of a wide region and then delimit areas of interest in which to develop more detailed studies.
The last observed limitation by our team is not specifically related to the SBAS InSAR service itself, but with the availability of SAR images. Currently, the SAR image catalog in the GEP platform is quite heterogeneous in time and space, offering only limited coverage in many regions of the World that are highly affected by geohazards. This is true in Spain, where the coverage is quite limited, despite being one of the EU countries with a higher exposition to geohazards. These limitations are now overcome with the recently implemented web-based services called “TRE ALTAMIRA Fastvel” and “SBAS-InSAR Sentinel-1 TOPS”, which perform multi-temporal analysis with Sentinel-1 images.

5.2. Implications for the Hazard Analysis Community

The use of web-platforms to perform complex numerical analysis remotely is quickly evolving in many scientific disciplines. Currently, projects as the GEP platform offer the possibility to use complex analysis to a wide range of users, who are focusing more on the interpretation of the results provided by a well-established algorithm (SBAS in our case). In the next decade, we are witnessing an explosion of data availability. Such a high volume of data will be impossible to analyze only by specialized users, i.e., technical users with the required processing knowledge. Therefore, platforms addressed to an analyst rather than processing-experts are valuable tools that can expand the analytical capacity of the systems.
This is one of the key-objectives of the GEP platform: to allow non-specialized users on satellite image-processing to extract useful knowledge from remote sensing data. The SBAS InSAR service produces InSAR velocity maps that allow for analyzing movements and deformations in the Earth surface. Thus far, these analyses were only performed by specialized research teams or companies by using specific complex software and powerful hardware. The results came after a few months and the commercial cost was high (from several thousands to tens of thousands of Euros). Now, the GEP platform offers the possibility to perform a DInSAR multi-temporal analysis of a region in four easy steps: (1) Targeting of the Area of Interest and a reference point; (2) SAR image selection from the GEP catalog; (3) parameters adjustment; and, (4) submission of the job to be run in the ESA’s servers. In less than 24 h, the platform provides a InSAR displacement rate map with information about coherence, velocity, and displacement time series. This means that, with GEP, geoscientists that are interested in the understanding of Earth surface movements do not need to learn how to process SAR images or count on expensive software and powerful hardware.
The current study shows that the ESA’s GEP platform is a powerful tool to identify and monitor ground instabilities at regional scale. Several places that are affected by subsidence and landslides not documented so far were identified, thus allowing to plan specific field campaigns for gathering additional information about the detected movements. The use of the SAR velocity maps accompanied by field data can facilitate the creation of geohazard inventories, especially those related to man-induced subsidence or slope instabilities. In the case of landslides, by including the naturally unstable slopes into the land planning decision making process, the construction could be limited or even prohibited. For example, if GEP had been operative some decades ago, the great economic losses that are generated by the landslides of Marina del Este and Los Carmenes del Mar [18,20] could have been avoided. Thus, it is expected that the use of GEP may be crucial for the future urban planning in other hilly and mountain regions of the World.
The detection of human-induced subsidence can spot hidden problems of groundwater mismanagement in poorly monitored areas. Most of the cases that were identified in the Malaga surroundings have not been reported and analyzed so far. There is not available information about the settlements in the detected areas, and, if the observed deformation continues, it could produce damages to buildings and infrastructures, such as those observed in the railway tunnel of Guadalhorce. On the other hand, the identified surficial movements may indicate the overexploitation of the local aquifers and this situation should be managed to avoid future shortage problems in a strategic touristic spot.
Summarizing, GEP opens a new period for the hazard identification and monitoring. Soon, it is expected that the ESA’s platform can provide information about activity of landslides, subsidence, and other phenomena that may damage buildings and infrastructures. Although currently the repository of images of GEP is limited and does not cover the entire surface of the Earth, the performance of the platform will be progressively enhanced with the addition of images from the Sentinel-1 satellite. Sentinel-1 has higher spatial resolution, lesser revisiting times, and larger geographical coverage than previous ENVISAT and ERS1/2 ones. This would provide an enormous quantity of information, which will require the involvement, and collaboration of a great number of experts all over the World to interpret the processed data. From the geohazard point of view, the information that is currently registering by Sentinel-1, together with the archived data from old SAR missions, will be the source to produce InSAR velocity maps using GEP. At this point, however, we would like to make a critical comment. The results of GEP are very sensitive information in the policy and legal setting for natural hazards management. For this reason, although the GEP platform is being mainly designed for non-InSAR experts, the use of the platform should be restricted to professionals or researchers that are specialized in the interpretation of the movements detected in InSAR velocity maps. We consider that the treatment and handling of this information will be crucial to avoid losses without creating controversy or alarm in the society, and this only can be performed by well-trained users and a network of experts who can deal with the uncertainty of the technique and the causes of the detected movements.

6. Conclusions

The SBAS InSAR service of the ESA’s Geohazard Exploitation Platform is a reliable tool to carry out advanced DInSAR analyses. The service provides, in less than 24 h, a surface velocity map of a region covering several hundreds of km2. These maps can be generated by users that are not specialized in SAR image-processing, but in analyzing and assessing geohazards. This opens a new scenario in the hazard analysis community by enhancing the capacity to identify, monitor, and assess hazards that are associated to geological processes. The recently launched SAR missions, such as the Sentinel-1 satellite, will provide a large amount of data to be analyzed through GEP. The potential of making new discoveries about active surficial processes, their movement rate, and the hazard associated with them has increased significantly with the new available satellite data and the tools implemented in the GEP platform. The platform will help (1) to identify phenomena not yet documented; (2) to monitor known deformations; (3) to delineate precisely the areas affected by the processes that modify the Earth surface; and, (4) to forecast future acceleration of the movements or catastrophic ground failures. This paper has presented examples detected using an InSAR velocity map produced by GEP that illustrate all of these cases. We (1) identified a lateral spreading not recorded in any landslide inventory or publication; (2) collected time-series in places affected by landslides and subsidence already documented; (3) delimited areas affected by subsidence due to water extraction with a reasonable precision; and, (4) detected the deformation in the Marina del Este landslide before its reactivation in 2010.

Acknowledgments

This study was carried out in the framework of the GEP initiative through the project approved by ESA for the analysis of the activity of large slope deformations in the Betic Cordillera (PI: Jorge P. Galve). We thank the team that is developing the Geohazard Exploitation Platform (GEP), specially Hervé Caumont (Terradue Srl) who was followed our work. We also thank the editors and four anonymous reviewers for helpful comments that improved the manuscript. Spanish “Juan de la Cierva” grants support part of the work of Jorge P. Galve. The expenses related to the hired researcher contract of Jorge P. Galve and the field surveying were funded by the project CGL2015-67130-C2-1-R (FEDER and Spanish Ministry of Economy and Competitiveness). Any use of trade, product, industry, or firm names is for descriptive purposes only and does not imply endorsement by the authors.

Author Contributions

Jorge P. Galve is the main responsible of the study. He generated the surface velocity map through the GEP, analyzed the InSAR data, coordinated and carried out the field survey and was the main writer of the manuscript. J. Vicente Pérez-Peña and José Miguel Azañón significantly helped in the drafting and edition of the manuscript and contributed in the coordination of the project. J. Vicente Pérez-Peña, Cristina Reyes-Carmona and Antonio Jabaloy carried out with Jorge P. Galve the field survey. Damien Closson, Fabiana Caló, Davide Notti, Gerardo Herrera, Marta Bejar and Oriol Monserrat contributed to the technical aspects of InSAR data treatment, analysis and interpretation and provided previous InSAR data. Patricia Ruano and Rosa M. Mateos, searched information about the impact of the detected surface movements, verified the geological interpretations and revised the manuscript. Philippe Bally managed the relationship between the developer team of GEP and our research team; and provided up-to-date information about the development of the ESA’s platform. All authors contributed to the final edition of the manuscript.

Conflicts of Interest

The authors declare no conflict of interest.

References

  1. Lash, R. Aerial archaeologist. Nature 2016, 534, 427. [Google Scholar] [CrossRef]
  2. Manunta, M.; Bonano, M.; Buonanno, S.; Casu, F.; De Luca, C.; Fusco, A.; Lanari, R.; Manzo, M.; Ojha, C.; Pepe, A.; et al. Unsupervised parallel SBAS-DInSAR chain for massive and systematic Sentinel-1 data processing. In Proceedings of the 2016 IEEE International Geoscience and Remote Sensing Symposium (IGARSS), Beijing, China, 10–15 July 2016; pp. 3890–3893. [Google Scholar]
  3. Massonnet, D.; Rossi, M.; Carmona, C.; Adragna, F.; Peltzer, G.; Feigl, K.; Rabaute, T. The displacement field of the Landers earthquake mapped by radar interferometry. Nature 1993, 364, 138–142. [Google Scholar] [CrossRef]
  4. Tomás, R.; Romero, R.; Mulas, J.; Marturià, J.J.; Mallorquí, J.J.; Lopez-Sanchez, J.M.; Herrera, G.; Gutiérrez, F.; González, P.J.; Fernández, J.; et al. Radar interferometry techniques for the study of ground subsidence phenomena: A review of practical issues through cases in Spain. Environ. Earth Sci. 2014, 71, 163–181. [Google Scholar] [CrossRef] [Green Version]
  5. Przylucka, M.; Herrera, G.; Graniczny, M.; Colombo, D.; Béjar-Pizarro, M. Combination of conventional and advanced DInSAR to monitor very fast mining subsidence with TerraSAR-X data: Bytom City (Poland). Remote Sens. 2015, 7, 5300–5328. [Google Scholar] [CrossRef]
  6. Galve, J.P.; Castañeda, C.; Gutiírrez, F.; Herrera, G. Assessing sinkhole activity in the Ebro Valley mantled evaporite karst using advanced DInSAR. Geomorphology 2015, 229, 30–44. [Google Scholar] [CrossRef]
  7. Galve, J.P.; Castañeda, C.; Gutiírrez, F. Railway deformation detected by DInSAR over active sinkholes in the Ebro Valley evaporite karst, Spain. Nat. Hazards Earth Syst. Sci. 2015, 15, 2439–2448. [Google Scholar] [CrossRef]
  8. Caló, F.; Notti, D.; Galve, J.P.; Abdikan, S.; Görüm, T.; Pepe, A.; Şanli, F.B. DInSAR-based detection of land subsidence and correlation with groundwater depletion in konya plain, Turkey. Remote Sens. 2017, 9, 83. [Google Scholar] [CrossRef]
  9. Herrera, G.; Gutiérrez, F.; García-Davalillo, J.C.; Guerrero, J.; Notti, D.; Galve, J.P.; Fernández-Merodo, J.A.; Cooksley, G. Multi-sensor advanced DInSAR monitoring of very slow landslides: The Tena Valley case study (Central Spanish Pyrenees). Remote Sens. Environ. 2013, 128, 31–43. [Google Scholar] [CrossRef]
  10. Wasowski, J.; Bovenga, F. Investigating landslides and unstable slopes with satellite Multi Temporal Interferometry: Current issues and future perspectives. Eng. Geol. 2014, 174, 103–138. [Google Scholar] [CrossRef]
  11. Solaro, G.; Acocella, V.; Pepe, S.; Ruch, J.; Neri, M.; Sansosti, E. Anatomy of an unstable volcano from InSAR: Multiple processes affecting flank instability at Mt. Etna, 1994–2008. J. Geophys. Res. Solid Earth 2010, 115, B10405. [Google Scholar] [CrossRef]
  12. Closson, D.; Karaki, N.A. Dikes stability monitoring versus sinkholes and subsidence, dead sea region, jordan. In Land Applications of Radar Remote Sensing; Closson, D., Ed.; InTech: Rijeka, Croatia, 2014; pp. 281–307. [Google Scholar]
  13. Biggs, J.; Ebmeier, S.K.; Aspinall, W.P.; Lu, Z.; Pritchard, M.E.; Sparks, R.S.J.; Mather, T.A. Global link between deformation and volcanic eruption quantified by satellite imagery. Nat. Commun. 2014, 5, 3471. [Google Scholar] [CrossRef] [PubMed]
  14. Closson, D.; Karaki, N.A.; Hansen, H.; Derauw, D.; Barbier, C.; Ozer, A. Space-borne radar interferometric mapping of precursory deformations of a dyke collapse, Dead Sea area, Jordan. Int. J. Remote Sens. 2003, 24, 843–849. [Google Scholar] [CrossRef]
  15. Nof, R.N.; Baer, G.; Ziv, A.; Raz, E.; Atzori, S.; Salvi, S. Sinkhole precursors along the Dead Sea, Israel, revealed by SAR interferometry. Geology 2013, 41, 1019–1022. [Google Scholar] [CrossRef]
  16. Castañeda, C.; Gutiérrez, F.; Manunta, M.; Galve, J.P. DInSAR measurements of ground deformation by sinkholes, mining subsidence, and landslides, Ebro River, Spain. Earth Surf. Process. Landf. 2009, 34, 1562–1574. [Google Scholar] [CrossRef]
  17. Palmer, J. Creeping earth could hold secret to deadly landslides. Nature 2017, 548, 384–386. [Google Scholar] [CrossRef] [PubMed]
  18. Notti, D.; Galve, J.P.; Mateos, R.M.; Monserrat, O.; Lamas-Fernández, F.; Fernández-Chacón, F.; Roldán-García, F.J.; Pérez-Peña, J.V.; Crosetto, M.; Azañón, J.M. Human-induced coastal landslide reactivation. Monitoring by PSInSAR techniques and urban damage survey (SE Spain). Landslides 2015, 12, 1007–1014. [Google Scholar] [CrossRef]
  19. Notti, D.; Mateos, R.M.; Monserrat, O.; Devanthéry, N.; Peinado, T.; Roldán, F.J.; Fernández-Chacón, F.; Galve, J.P.; Lamas, F.; Azañón, J.M. Lithological control of land subsidence induced by groundwater withdrawal in new urban areas (Granada Basin, SE Spain). Multiband DInSAR monitoring. Hydrol. Process. 2016, 30, 2317–2331. [Google Scholar] [CrossRef]
  20. Mateos, R.M.; Azañón, J.M.; Roldán, F.J.; Notti, D.; Pérez-Peña, V.; Galve, J.P.; Pérez-García, J.L.; Colomo, C.M.; Gómez-López, J.M.; Montserrat, O.; et al. The combined use of PSInSAR and UAV photogrammetry techniques for the analysis of the kinematics of a coastal landslide affecting an urban area (SE Spain). Landslides 2017, 14, 743–754. [Google Scholar] [CrossRef]
  21. Mateos, R.M.; Ezquerro, P.; Luque-Espinar, J.A.; Béjar-Pizarro, M.; Notti, D.; Azañón, J.M.; Montserrat, O.; Herrera, G.; Fernández-Chacón, F.; Peinado, T.; et al. Multiband PSInSAR and long-period monitoring of land subsidence in a strategic detrital aquifer (Vega de Granada, SE Spain): An approach to support management decisions. J. Hydrol. 2017, 553, 71–87. [Google Scholar] [CrossRef]
  22. Albano, M.; Polcari, M.; Bignami, C.; Moro, M.; Saroli, M.; Stramondo, S. An innovative procedure for monitoring the change in soil seismic response by InSAR data: Application to the Mexico City subsidence. Int. J. Appl. Earth Obs. Geoinf. 2016, 53, 146–158. [Google Scholar] [CrossRef]
  23. Casu, F.; Elefante, S.; Imperatore, P.; Zinno, I.; Manunta, M.; De Luca, C.; Lanari, R. SBAS-DInSAR parallel processing for deformation time-series computation. IEEE J. Sel. Top. Appl. Earth Obs. Remote Sens. 2014, 7, 3285–3296. [Google Scholar] [CrossRef]
  24. De Luca, C.; Cuccu, R.; Elefante, S.; Zinno, I.; Manunta, M.; Casola, V.; Rivolta, G.; Lanari, R.; Casu, F. An on-demand web tool for the unsupervised retrieval of earth’s surface deformation from SAR data: The P-SBAS service within the ESA G-POD environment. Remote Sens. 2015, 7, 15630–15650. [Google Scholar] [CrossRef]
  25. Berardino, P.; Fornaro, G.; Lanari, R.; Sansosti, E.; Mora, O.; Lanari, R.; Mallorqui, J.J.; Berardino, P.; Sansosti, E. A new algorithm for surface deformation monitoring based on small baseline differential SAR interferograms. IEEE Trans. Geosci. Remote Sens. 2002, 40, 2375–2383. [Google Scholar] [CrossRef]
  26. Guzzetti, F.; Manunta, M.; Ardizzone, F.; Pepe, A.; Cardinali, M.; Zeni, G.; Reichenbach, P.; Lanari, R. Analysis of ground deformation detected using the SBAS-DInSAR technique in Umbria, Central Italy. Pure Appl. Geophys. 2009, 166, 1425–1459. [Google Scholar] [CrossRef]
  27. Lanari, R.; Berardino, P.; Bonano, M.; Casu, F.; Manconi, A.; Manunta, M.; Manzo, M.; Pepe, A.; Pepe, S.; Sansosti, E.; et al. Surface displacements associated with the L’Aquila 2009 Mw 6.3 earthquake (central Italy): New evidence from SBAS-DInSAR time series analysis. Geophys. Res. Lett. 2010, 37, 10–15. [Google Scholar] [CrossRef]
  28. Del Ventisette, C.; Ciampalini, A.; Manunta, M.; Caló, F.; Paglia, L.; Ardizzone, F.; Mondini, A.C.; Reichenbach, P.; Mateos, R.M.; Bianchini, S.; et al. Exploitation of large archives of ERS and ENVISAT C-band SAR data to characterize ground deformations. Remote Sens. 2013, 5, 3896–3917. [Google Scholar] [CrossRef]
  29. Fiaschi, S.; Closson, D.; Abou Karaki, N.; Pasquali, P.; Riccardi, P.; Floris, M. The complex karst dynamics of the Lisan Peninsula revealed by 25 years of DInSAR observations. Dead Sea, Jordan. ISPRS J. Photogramm. Remote Sens. 2017, 130, 358–369. [Google Scholar] [CrossRef]
  30. Chacón, J.; Irigaray, T.; Fernández, T. Los movimientos de ladera de la provincia de Granada. In Atlas de Riesgos Naturales en la Provincia de Granada; Ferrer, M., Ed.; Diputación de Granada-Instituto Geológico y Minero de España (IGME): Granada, Spain, 2007; pp. 45–82. [Google Scholar]
  31. Fernandez, P.; Irigaray, C.; Jimenez, J.; El Hamdouni, R.; Crosetto, M.; Monserrat, O.; Chacon, J. First delimitation of areas affected by ground deformations in the Guadalfeo River Valley and Granada metropolitan area (Spain) using the DInSAR technique. Eng. Geol. 2009, 105, 84–101. [Google Scholar] [CrossRef]
  32. Sousa, J.J.; Ruiz, A.M.; Hanssen, R.F.; Bastos, L.; Gil, A.J.; Galindo-Zaldívar, J.; Sanz de Galdeano, C. PS-InSAR processing methodologies in the detection of field surface deformation-Study of the Granada basin (Central Betic Cordilleras, southern Spain). J. Geodyn. 2010, 49, 181–189. [Google Scholar] [CrossRef]
  33. Ruiz, A.M.; Caro Cuenca, M.; Sousa, J.J.; Gil, A.J.; Hanssen, R.F.; Perski, Z.; Galindo-Zaldívar, J.; Sanz de Galdeano, C. Land subsidence monitoring in the southern Spanish coast using satellite radar interferometry. In Proceedings of the FRINGE 2011, Frascati, Italy, 19–23 September 2011; pp. 19–23. [Google Scholar]
  34. Meisina, C.; Zucca, F.; Notti, D.; Colombo, A.; Cucchi, A.; Savio, G.; Giannico, C.; Bianchi, M. Geological interpretation of PSInSAR Data at regional scale. Sensors 2008, 8, 7469–7492. [Google Scholar] [CrossRef] [PubMed]
  35. Bianchini, S.; Herrera, G.; Mateos, R.M.; Notti, D.; Garcia, I.; Mora, O.; Moretti, S. Landslide activity maps generation by means of persistent scatterer interferometry. Remote Sens. 2013, 5, 6198–6222. [Google Scholar] [CrossRef]
  36. Irigaray, C.; Chacón, J. Los movimentos de ladera en el sector de Colmenar (Málaga). Revista de la Sociedad Geológica de España 1991, 4, 203–214. [Google Scholar]
  37. Biescas, E.; Crosetto, M.; Agudo, M.; Monserrat, O.; Crippa, B. Two Radar Interferometric Approaches to Monitor Slow and Fast Land Deformation. J. Surv. Eng. 2007, 133, 66–71. [Google Scholar] [CrossRef]
  38. Crosetto, M.; Monserrat, O.; Cuevas, M.; Crippa, B. Spaceborne differential SAR interferometry: Data analysis tools for deformation measurement. Remote Sens. 2011, 3, 305–318. [Google Scholar] [CrossRef]
  39. Béjar-Pizarro, M.; Guardiola-Albert, C.; García-Cárdenas, R.P.; Herrera, G.; Barra, A.; Molina, A.L.; Tessitore, S.; Staller, A.; Ortega-Becerril, J.A.; García-García, R.P. Interpolation of GPS and geological data using InSAR deformation maps: Method and application to land subsidence in the alto guadalentín aquifer (SE Spain). Remote Sens. 2016, 8, 965. [Google Scholar] [CrossRef]
  40. Tessitore, S.; Fernández-Merodo, J.A.; Herrera, G.; Tomás, R.; Ramondini, M.; Sanabria, M.; Duro, J.; Mulas, J.; Calcaterra, D. Comparison of water-level, extensometric, DInSAR and simulation data for quantification of subsidence in Murcia City (SE Spain). Hydrogeol. J. 2016, 24, 727–747. [Google Scholar] [CrossRef]
  41. Devanthéry, N.; Crosetto, M.; Monserrat, O.; Cuevas-González, M.; Crippa, B. An approach to persistent scatterer interferometry. Remote Sens. 2014, 6, 6662–6679. [Google Scholar] [CrossRef]
  42. Chacón, J.; Hamdouni, R.E.L.; Irigaray, C.; Jiménez-perálvarez, J.; Fernández, P.; Fernández, T.; Alameda, P.; Antonio, J.; Moya, J. Movimientos de ladera en la Costa de Almuñécar y su entorno. Geogaceta 2016, 59, 87–90. [Google Scholar]
  43. Hooper, A.J. A multi-temporal InSAR method incorporating both persistent scatterer and small baseline approaches. Geophys. Res. Lett. 2008, 35, 1–5. [Google Scholar] [CrossRef]
  44. Sanz de Galdeano, C. The Zafarraya Polje (Betic Cordillera, Granada, Spain), a basin open by lateral displacement and bending. J. Geodyn. 2013, 64, 62–70. [Google Scholar] [CrossRef]
  45. Ruiz-Armenteros, A.M.; Delgado, J.M.; Sousa, J.J.; Hanssen, R.F.; Caro, M.; Gil, A.J.; Galindo-Zaldívar, J.; De Galdeano, C.S. Deformation monitoring in Zafarraya fault and Sierra Tejeda antiform (Betic cordillera, Spain) using satellite radar interferometry. In Proceedings of the FRINGE’15: Advances in the Science and Applications of SAR Interferometry and Sentinel-1 InSAR Workshop, Frascati, Italy, 23–27 March 2015; ESA Publication: Paris, France, 2015. [Google Scholar]
  46. Delgado, J.; Vicente, F.; García-Tortosa, F.; Alfaro, P.; Estévez, A.; Lopez-Sanchez, J.M.; Tomás, R.; Mallorquí, J.J. A deep seated compound rotational rock slide and rock spread in SE Spain: Structural control and DInSAR monitoring. Geomorphology 2011, 129, 252–262. [Google Scholar] [CrossRef]
  47. Gutierrez, F.; Linares, R.; Roque, C.; Zarroca, M.; Rosell, J.; Galve, J.P.; Carbonel, D. Investigating gravitational grabens related to lateral spreading and evaporite dissolution subsidence by means of detailed mapping, trenching, and electrical resistivity tomography (Spanish Pyrenees). Lithosphere 2012, 4, 331. [Google Scholar] [CrossRef]
  48. Carbonel, D.; Gutiérrez, F.; Linares, R.; Roqué, C.; Zarroca, M.; McCalpin, J.; Guerrero, J.; Rodríguez, V. Differentiating between gravitational and tectonic faults by means of geomorphological mapping, trenching and geophysical surveys. The case of the Zenzano Fault (Iberian Chain, N Spain). Geomorphology 2013, 189, 93–108. [Google Scholar] [CrossRef]
  49. Crosetto, M.; Monserrat, O.; Cuevas-González, M.; Devanthéry, N.; Crippa, B. Persistent Scatterer Interferometry: A review. ISPRS J. Photogramm. Remote Sens. 2016, 115, 78–89. [Google Scholar] [CrossRef]
  50. Lu, P.; Bai, S.; Casagli, N. Investigating spatial patterns of persistent scatterer interferometry point targets and landslide occurrences in the Arno River basin. Remote Sens. 2014, 6, 6817–6843. [Google Scholar] [CrossRef]
  51. Chaussard, E.; Bürgmann, R.; Fattahi, H.; Nadeau, R.M.; Taira, T.; Johnson, C.W.; Johanson, I. Potential for larger earthquakes in the East San Francisco Bay Area due to the direct connection between the Hayward and Calaveras Faults. Geophys. Res. Lett. 2015, 42, 2734–2741. [Google Scholar] [CrossRef]
Figure 1. Location of the study area, the main geographical features cited in the text and the areas referenced in the Section 4. The limits of the provinces are defined by dotted lines.
Remotesensing 09 01291 g001
Figure 2. Web interface of the Geohazard Exploitation Platform (GEP) (https://geohazards-tep.eo.esa.int/geobrowser/#!) where advanced DInSAR can be performed. The three windows of the main website portal and their functions are highlighted.
Remotesensing 09 01291 g002
Figure 3. Surface velocity map produced by SBAS InSAR service in the study area.
Remotesensing 09 01291 g003
Figure 4. Buildings of the Albuñuelas village affected by slight deformations (A) and tilting (B) due to the activity of a deep-seated landslide on which the village is located.
Remotesensing 09 01291 g004
Figure 5. Comparison between the displacement rates measured by Fernandez et al. [30] (A) and the GEP map (B) in the Albuñuelas village. The boundary of the active landslide is indicated by white dotted lines.
Remotesensing 09 01291 g005
Figure 6. Comparison between the displacement rates measured by Notti et al. [18] (A) and the GEP map (B) in the Marina del Este resort. The boundary of the active landslide is indicated by white dotted lines.
Remotesensing 09 01291 g006
Figure 7. Comparison between the displacement rates measured by Mateos et al. [21] (A) and the GEP map (B) in the Vega de Granada.
Remotesensing 09 01291 g007
Figure 8. (A) GEP map data of the coast of the Granada province between the Los Cármenes del Mar resort and Salobreña. The urban states with ground instability problems are pointed out; (B) Aerial view of the Alfamar resort; (CK) Types of damages observed in the Alfamar and Monte de los Almendros urban states. (1) Horizontal cracks on the top of buildings due to deflections of the slabs due to differential settlements; (2) Diagonal cracks and fissures due to foundation settlements; (3) Deformed walls; (4) Cracks due to deformation of the structure junctions; (5) Curved crack in the asphalt with a small step indicating differential settlement; (6) Open cracks in the bedrock; and, (L) Aerial view of the Monte de los Almendros resort.
Remotesensing 09 01291 g008
Figure 9. (A,B) Three-dimensional (3D) models of the surroundings of Albuñuelas with the surface velocity provided by GEP; (C) Oblique northward aerial view of the horst and graben landscape produced by the active lateral spreading phenomenon (from Google Earth, www.google.com/earth); The yellow marks delimit the area represented in (D), (D) Oblique northward aerial view of the southern sector of the lateral spreading where the open cracks can be distinguish (from Google Earth, www.google.com/earth); (EG) Field photographs of the cracks with vertical steps of about 1.5 m (E,F) and an example of the piping phenomena identified in the area covered by surficial deposits (G).
Remotesensing 09 01291 g009
Figure 10. GEP map data of the West of Malaga. The areas with displacements included in the text are located. Note the clear movements detected between the Benalmádena and Torremolinos municipalities not analyzed neither mentioned in press reports so far.
Remotesensing 09 01291 g010
Figure 11. Displacement rate data provided by GEP overlaying a 3D model of the Zafarraya Polje (from Google Earth, www.google.com/earth). Note that the red tones observed in the central sector of the polje are located in the Zafarraya village built on an outcrop of the bedrock.
Remotesensing 09 01291 g011
Figure 12. (A) Displacement rate data provided by GEP overlaying an oblique northwestward aerial view of the sierras of the Valle de Abdalajís (from Google Earth, www.google.com/earth); (B) Southwestward aerial view of the La Huma mountain where can be recognized a clear fault. The limestone rock blocks may slide or sink taking advantage of this structure and those associated to it.
Remotesensing 09 01291 g012
Table 1. Main characteristics of the SAR datasets, processing and surface velocity map.
SAR Acquisition
Band/PolarisationC/VV
Wavelength (cm)5.6
Incidence angle23
Revisiting period (days)35
Orbital track/Frame459/731
Acquisition geometryAscending
Pixel size (m) radar geometry4 × 10
SAR processing
Number of SAR images25
Temporal spanMarch 2003/August 2008 (5.3 years)
Number of interferograms70
Bounding box (Lat, Long, proj.WGS84)36.49, −4.636/36.851, −3.557
Reference point coord (Lat, Long; proj.WGS84)36.78, −4.1
Processing modeMulti-Temporal DInSAR Analysis
Max Perpendicular Baseline (m)400
Max Temporal Baseline (days)1500
Ground Pixel Dimension (m)80
Max Allowed Delta-Doppler (Hz)1000
Max Allowed Doppler Centroid (Hz)2000
Goldstein Weight0.5
Coherence threshold0.7
APS Smoothing Time Window (days)200
Surface velocity map
Area (km2)9130
No. of measurement points155,474
Density of measurement points (points/km2)17
LOS displacement rate (mm/year)
  Mean−2
  Maximum+6
  Minimum−17
  Standard deviation1
Cumulative LOS displacement (mm)
  Mean-4
  Maximum+50
  Minimum−92
  Standard deviation7
Table 2. Characteristics of the InSAR analysis used to check the GEP results.
SiteSateliteTemporal SpanTechniqueReference
AlbuñuelasERS1/2June/1993–December/2000Small-Area PSI approachFernández et al., 2009
Marina del EsteENVISATMay/2003–December/2009Small-Area PSI approachNotti et al., 2015
Vega de GranadaENVISATMay/2003–December/2009PSIG Cousins analysisMateos et al., 2017

