Article

Potential and Limitation of SPOT-5 Ortho-Image Correlation to Investigate the Cinematics of Landslides: The Example of “Mare à Poule d’Eau” (Réunion, France)

by
Rejanne Le Bivic
1,
Pascal Allemand
2,*,
Amélie Quiquerez
3 and
Christophe Delacourt
1
1
Laboratoire Géosciences Océan, UMR 6538, Université de Bretagne Occidentale, CNRS, 29280 Plouzané, France
2
LGL-TPE Laboratoire de Géologie de Lyon—Terre, Planètes, Environnement, UMR 5276, Université de Lyon, Université Lyon 1, ENS Lyon, CNRS, Villeurbanne 69622, France
3
Laboratoire Archéologie Terre Histoire Sociétés, UMR 6298, Université de Bourgogne Franche-Comté, CNRS, Dijon 21000, France
*
Author to whom correspondence should be addressed.
Remote Sens. 2017, 9(2), 106; https://doi.org/10.3390/rs9020106
Submission received: 6 November 2016 / Revised: 19 January 2017 / Accepted: 20 January 2017 / Published: 26 January 2017
(This article belongs to the Special Issue Remote Sensing of Landslides)

Abstract

:
Over the last 10 years, the accessibility of high spatial resolution remote sensing images has strongly increased. These images are available in ortho-rectified format which do not necessitate any further geometrical processing to be analyzed. In parallel, image correlation software has become more efficient and friendly. In this paper, image correlation methods are tested to evaluate their potential and limitations to measure the surface displacements in a complex case of a landslide located in a tropical environment. This studied landslide, called “Mare à Poule d’Eau”, is located in the Salazie erosion watershed in Réunion Island (France). This landslide is monitored daily by a DGPS station which registers the south-north displacements. Two pairs of ortho-rectified SPOT-5 images at 2.5 m resolution provided by Kalideos (http://kalideos.cnes.fr) were selected. The first pair frames the period between 2002 and 2005 during which the landslide activity was low. The second pair of images (2006–2008) frames a period of time during which the landslide was more active. Fifty-nine Image Control Points (ICP) were selected on the images by the SIFT method (Scale Invariant Feature Transform) and visually controlled. The shifts of these points used as external control are estimated for the two time periods. Two image correlator softwares are used: MicMac and Cosi-Corr. The results obtained by the two correlators are similar. For the 2002–2005 period, the shift measured by correlators in the landslide is similar to the shift outside the landslide. This means that the displacement cannot be detected and estimated during periods of low activity of the landslide. The shift of the landslide for the 2006–2008 period is out of noise and reaches 8.5 m. The displacement can be estimated by applying a correction factor extracted from the ICP located in the stable areas. The potential and limits of the image correlation in such complex environments is discussed. A strategy is proposed to evaluate the quality of the results and to extract the displacement signal from the shift measurements.

Graphical Abstract

1. Introduction

The displacement field of slow to moderate velocity landslides (1.5 m/year < v < 1.5 m/month, [1]) is a fundamental parameter to measure, for both applied and research purposes [2,3,4,5]. If followed for a long period of time and coupled with measurements of external parameters such as rainfall or seismic activity, the displacement field can constrain numerical models of landslide evolution [6,7] and is also essential for risk mitigation. The techniques used to evaluate the displacement fields of landslides have evolved during the last 30 years. The first measurements were punctual and realized using tachometers. These methods were expensive and also extremely costly because of the number of measurements needed. They produced only a sparse cloud of measurements and do not always permit to obtain an overall view of the cinematics of the landslide. In addition, these data can be dangerous to acquire in poorly accessible areas where these techniques are very difficult to implement. They were mainly applied for the monitoring of landslides that presented a risk to human lives and anthropic infrastructures. DGPS techniques were an interesting alternative to ensure the temporal continuity of the measurements at some specific points on the monitored landslides [8,9]. Permanent stations were installed on points that needed a continuous monitoring.
A synoptic view of landslide cinematics can be obtained through the use of aerial images, which allow displacement fields to be measured using the available archives [10]. The time span between two aerial missions realized in a country such as France by the National Geographic Institute (IGN) was not shorter than five to seven years during the last century. This time span was sometimes too long to investigate the cinematics of landslides. The development of new satellite platforms and the enhancement of data resolution opened a new way to study surface changes and displacements on the earth’s surface from both active and passive remote sensing signals. Radar data of ERS tandem mission were the first to be processed by the DinSAR technique to extract the displacement field produced by fault activity, volcanoes, and landslides [11]. Due to the loss of coherence in mountainous areas, the time baseline between two acquisitions could not exceed a few days. Moreover, a dense vegetation cover prevented the use of these techniques except if a long wave length (L Band) was used. The DinSAR technique produced results with a sensitivity that was a fraction of the wavelength emitted by the radar parallel to the line of sight of the radar signal and could thus be better than 1 cm [12]. Only one component of displacement is measured. The results cannot be extrapolated to produce maps of 2D or 3D surface displacement. More recently, new techniques of permanent and persistent scatterers have been developed for landslide analyses [13,14,15]. These techniques permit measurement of the displacement of highly reflective points on a long series of radar data limiting the decorrelation effects.
Passive remote sensing data acquired by satellite platforms have been used to measure displacement fields caused by natural phenomena on the Earth surface using techniques of image correlation [16]. On two images acquired at different times and ortho-rectified (geometrically corrected from the topographic effect), homologous points are detected by correlation methods with a theoretical sensitivity of one-tenth of a pixel [17,18].The shift detected between the homologous points on the two images corresponds to the displacement that occurred between the acquisition of the two images. The correlation of ortho-rectified optical images has been applied to measure the co-seismic displacement fields [19,20], the displacement of glaciers [21,22], of landslides [23], and of dunes [24]. One advantage of the image correlation technique is its capability to measure displacements larger than a few pixels on long time baselines. Moreover, image correlation can be applied to data of various origins. Delacourt et al. [23] showed that it was possible to correlate images acquired by satellites and aerial platforms if well ortho-rectified. The correlation methods work very well in arid environments on poorly vegetated soils on images at medium, high, or very high resolution. Stumpf et al. [25] showed that the displacement field of a landslide can be measured using 1 m resolution Pléiades images. The result is very sensitive to the quality of the ortho-rectification that required a Digital Elevation Model (DEM) at a resolution close to the resolution of the images.
In the last few years, the amount of remote sensing images of land surfaces that have been acquired by optical sensors on board satellite platforms has exponentially increased. The development of new operational platforms with high resolution capabilities such as Sentinels-2 and Landsat 8 completes the data offer from satellites such as SPOT-6 and -7 or Pléiades and other satellites with high or very high spatial resolution capabilities. Moreover, the distribution data policy has evolved. It is now very easy, cheap, and sometimes free to obtain high resolution ortho-rectified images on any point on Earth. In parallel, large efforts have been made in the scientific community to provide open source image processing software with correlation capabilities such as MicMac (Multi Images Correspondances par Méthodes Automatiques de Corrélation [26]) or Cosi-Corr (Co-Registration of Optically Sensed Images and Correlation, [27,28,29]). Thus, there is a democratization of data and techniques which were reserved until recently to specialists of image processing. Potential limitations of these correlation techniques applied to remote sensing data have been partially explored [18]. For an optimal result, it is better to work on bare soils with a series of images acquired with similar incidence angles to avoid the differences in geometries that can be produced by the ortho-rectification process using a DEM at low resolution. The limits and the potential of satellite image correlation in complex environments from images easily accessible on the internet are yet to be explored. We applied two correlation chains (Mic-Mac and Cosi-Corr) to SPOT-five ortho-rectified images diffused by the Kalideos web-platform (
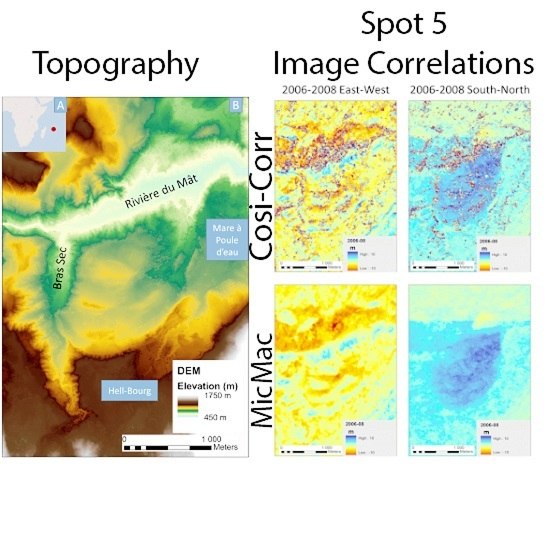
http://kalideos.cnes.fr/) for two periods (2002–2005 and 2006–2008). These 2.5 m resolution images show an active landslide called “Mare à Poule d’Eau” (MAPE) located on the Réunion Island (France) within the Salazie erosion watershed. This 2.5 km2 landslide moves at around 1 m/year with very high accelerations in the case of high rainfall associated with storms. It has been monitored since 2002 by a permanent DGPS station. The landslide was less active during the 2002–2005 period than during the 2006–2008 period. The two main land uses at the surface of the landslide are cultivated soils and areas covered by a dense tropical forest. A few anthropogenic constructions are visible as well as some asphalted roads and tracks. After a description of the study area in terms of geology and climate, data and methods of correlation are described. The resulting maps of shifts measured from image pair correlation are presented and discussed relative to (1) the measure of shifts of some points estimated by SIFT methods (Scale Invariant Feature Transform) and relative to (2) the value of displacement measured by DGPS. Precision and reliability are finally discussed to propose a frame of the potential and limitation of correlation methods on SPOT-5 images in order to measure displacements in such complex environments.

2. Study Site

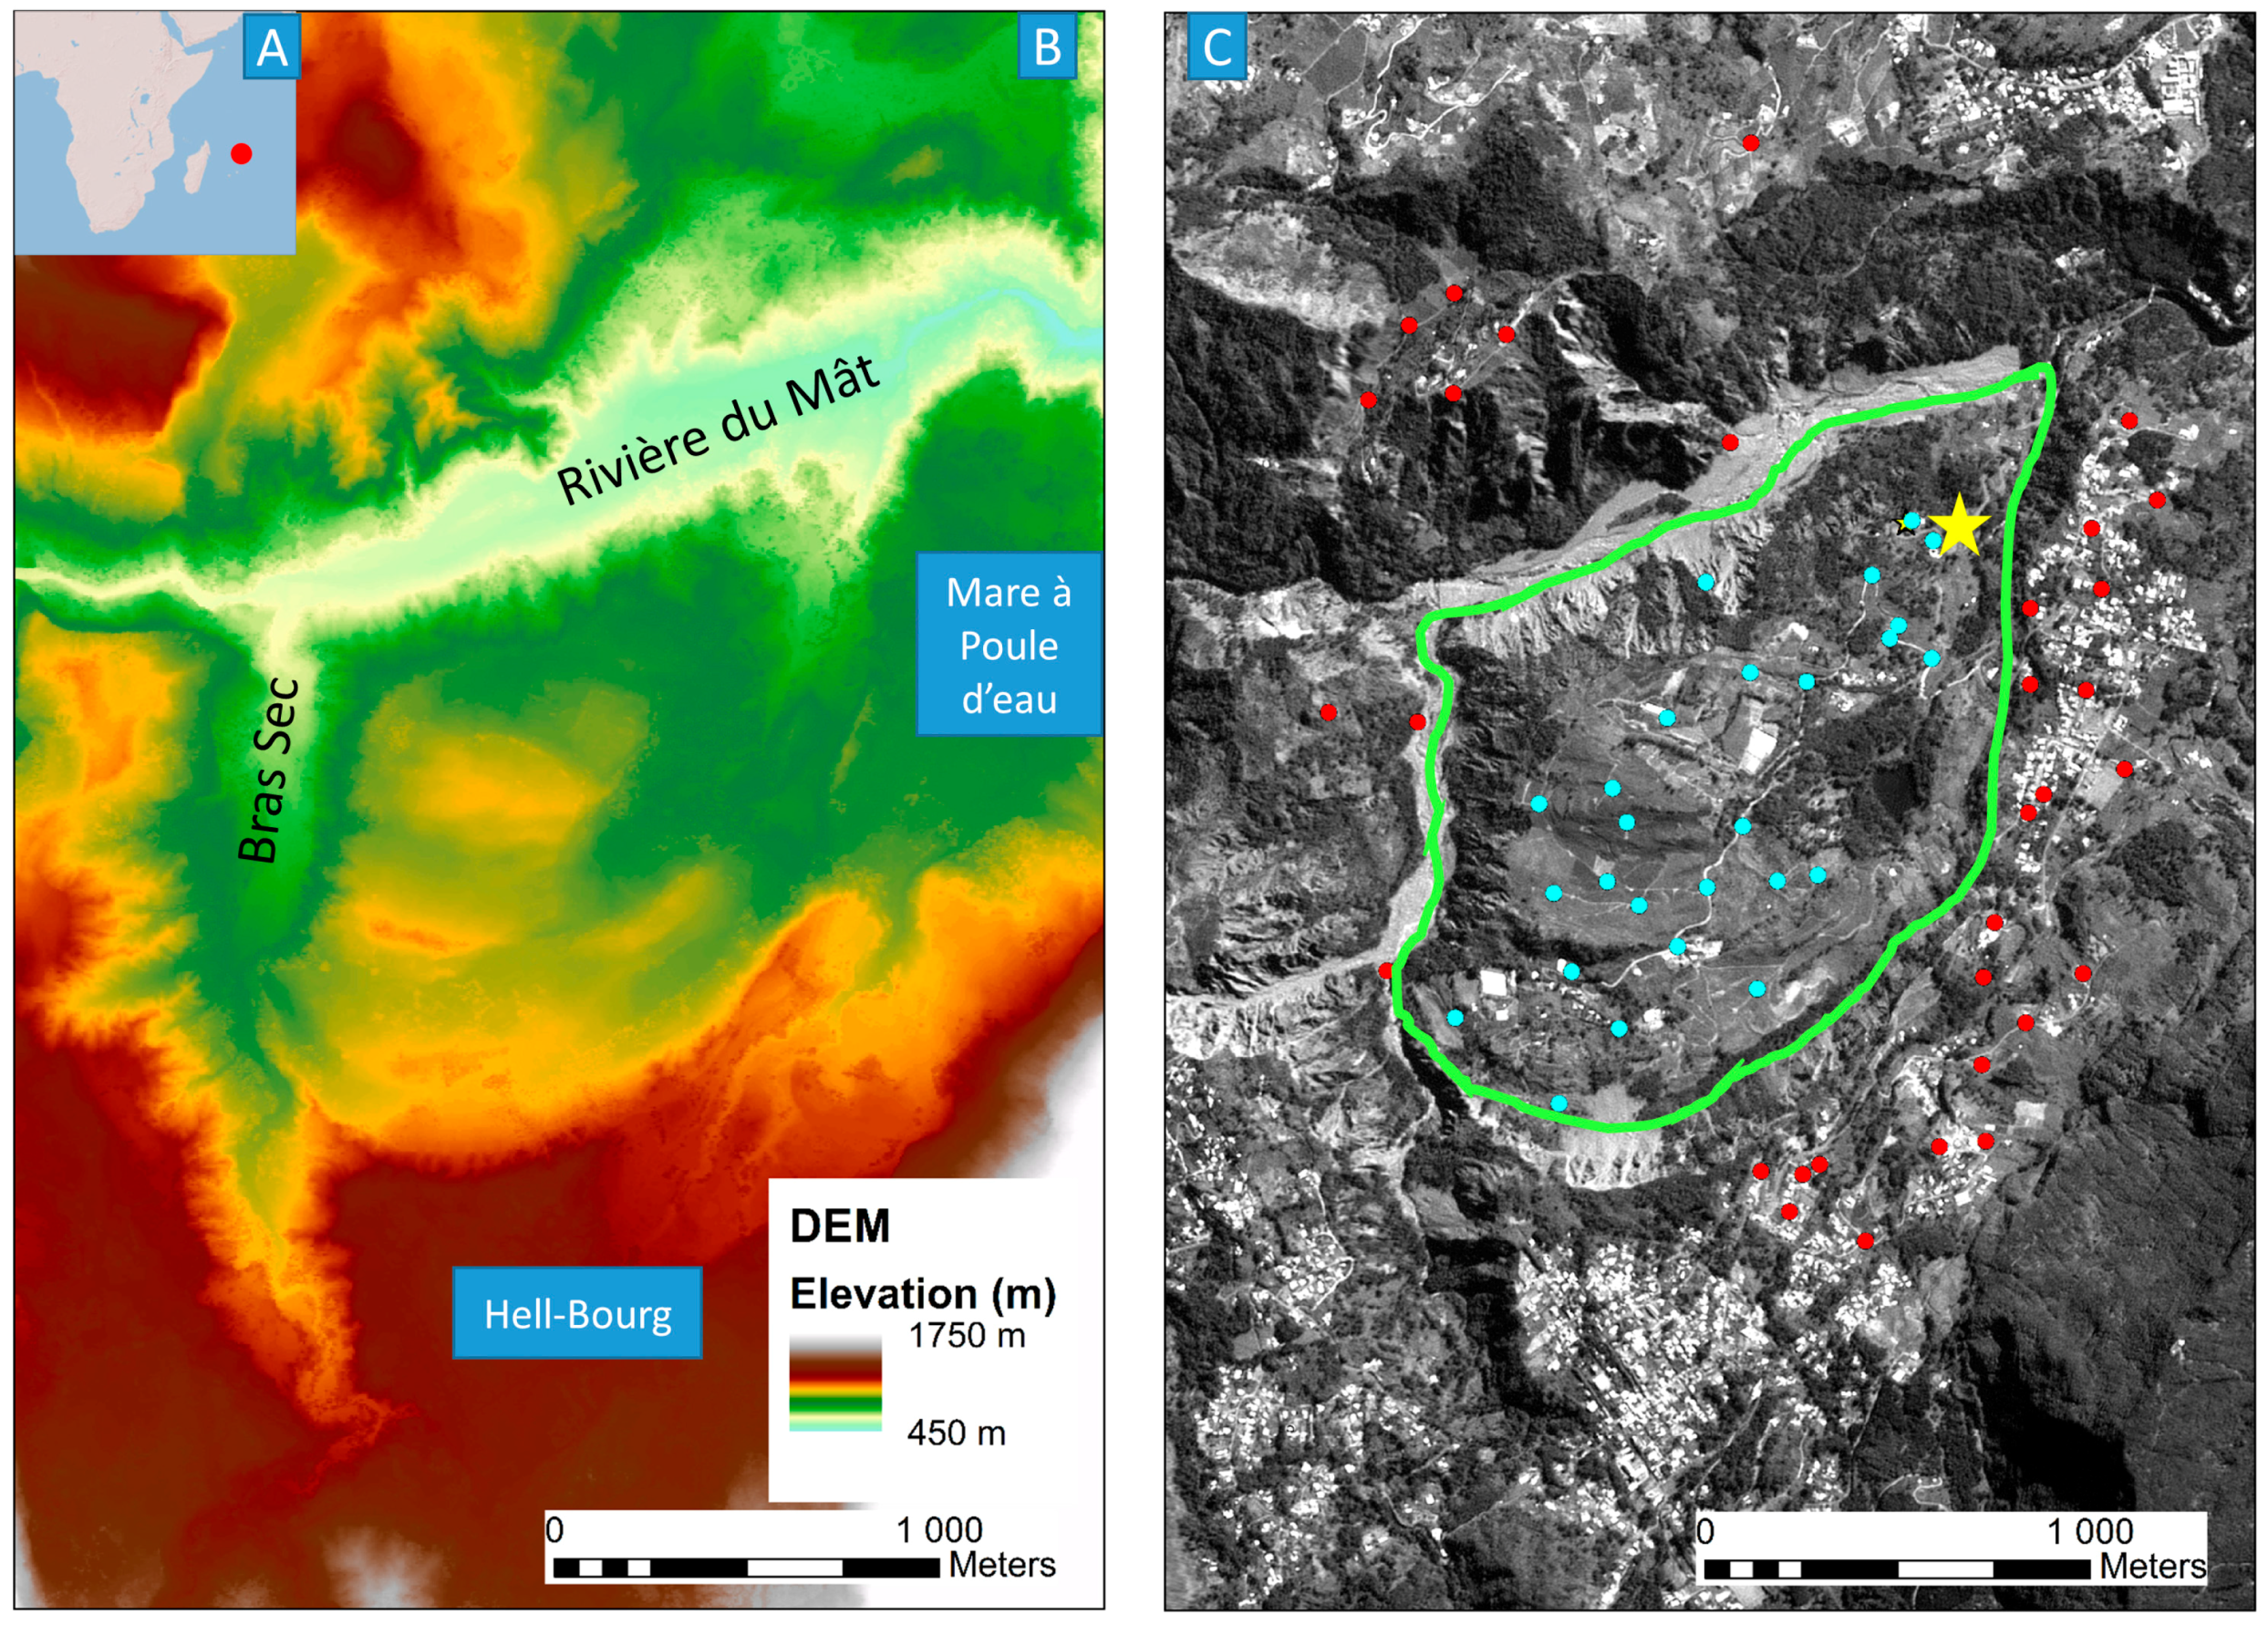
The MAPE landslide (Figure 1) is located in Réunion Island in the Salazie erosion basin. The landslide covers an area of 2.5 km2 for an estimated volume of approximately 400 × 106 m3 [30].
This slow-moving landslide (<2 m/year) is a hazard for the two villages of “Hell-Bourg” and “Mare à Poule d’Eau” located at its borders. The landslide extends on about 2 km between the River du Mât to the north and the Hell-Bourg plateau to the south that forms a scarp of 120 m above the landslide. The east-west extent of the landslide is 1.3 km, between the ephemeral river of Bras Sec in the east and the village of “Mare à Poule d’Eau” to the west. To this day, no geophysical data acquisition of the internal structure of the landslide has been conducted. Therefore, the vertical extent of the landslide remains unknown. The landslide body is composed of recent breccia of differentiated volcanic rocks (the “MAPE breccia”, [31,32]) overlying a layer of old breccia, which is characterized by alteration and clay facies. This layer plays the role of detachment surface on which the upper mass slides toward the north [31]. The landslide topography (Figure 1B) suggests that the landslide displacement has both translational and rotational components [31,33]. The landslide can be divided into four or five compartments delimited by scarps visible on the DEM [30]. The displacement of the landslide has been partly monitored since 2002, using GNSS data from permanent DGPS receivers located on the slipping area. The displacement has a strong component to the north, with an average velocity increasing northward from 0.8 to 1.33 m/year over the period 2005–2011 [30].
The climate in Réunion Island is characterized by a temporal heterogeneity of rainfall. The dry season runs from June to November. Major rainfalls occur from December to May. Cyclones and storms regularly affect the island during that period. These intense rainfall events lead to an acceleration of the MAPE landslide [33]. Average annual rainfalls recorded in the Salazie erosion basin are approximately 3 m.

3. Data and Methods

The data used in this study consist of (1) four SPOT-5 images at 2.5 m resolution dating from 2002, 2005, 2006, and 2008 (Table 1) (2) A series of positions of the Vira DGPS station (Figure 1C) measured daily by DGPS since 2002 along a south-north axis in UTM 40 S projection and (3) around 60 Image Control Points (ICP) that have been identified on the four SPOT-5 images by the SIFT algorithm [34] and visually inspected. The SIFT algorithm (Scale Invariant Feature Transform) is an object recognition method based on the use of local invariant features [34]. The purpose of such a method is to identify homologous points on two images of same object taken in different acquisition conditions (different, cameras, different angles of view, different times, different scales…). The SIFT algorithm is divided in three phases. In the first one, key points are extracted independently on both images by a technique called Difference of Gaussian that searches the structures which disappear under a certain level of blur [35]. In the second phase, each point is characterized by a descriptor of its local pixel environment. The SIFT descriptors are based on the normalized gradient of grey level. In the last phase, the geometric descriptors of each point are compared on both images to define the most probable homologous points. The quality of point matching is evaluated from the quality of geometric transformation between of the point clouds identified on both images.
The SPOT-5 images have been acquired with an incidence angle of approximately 25° for the oldest set (2002–2005) and with an incidence angle close to 17° for the more recent set (2006–2008). The images were ortho-rectified and projected in UTM40S on WGS84 (level 3) by the Kalideos service (
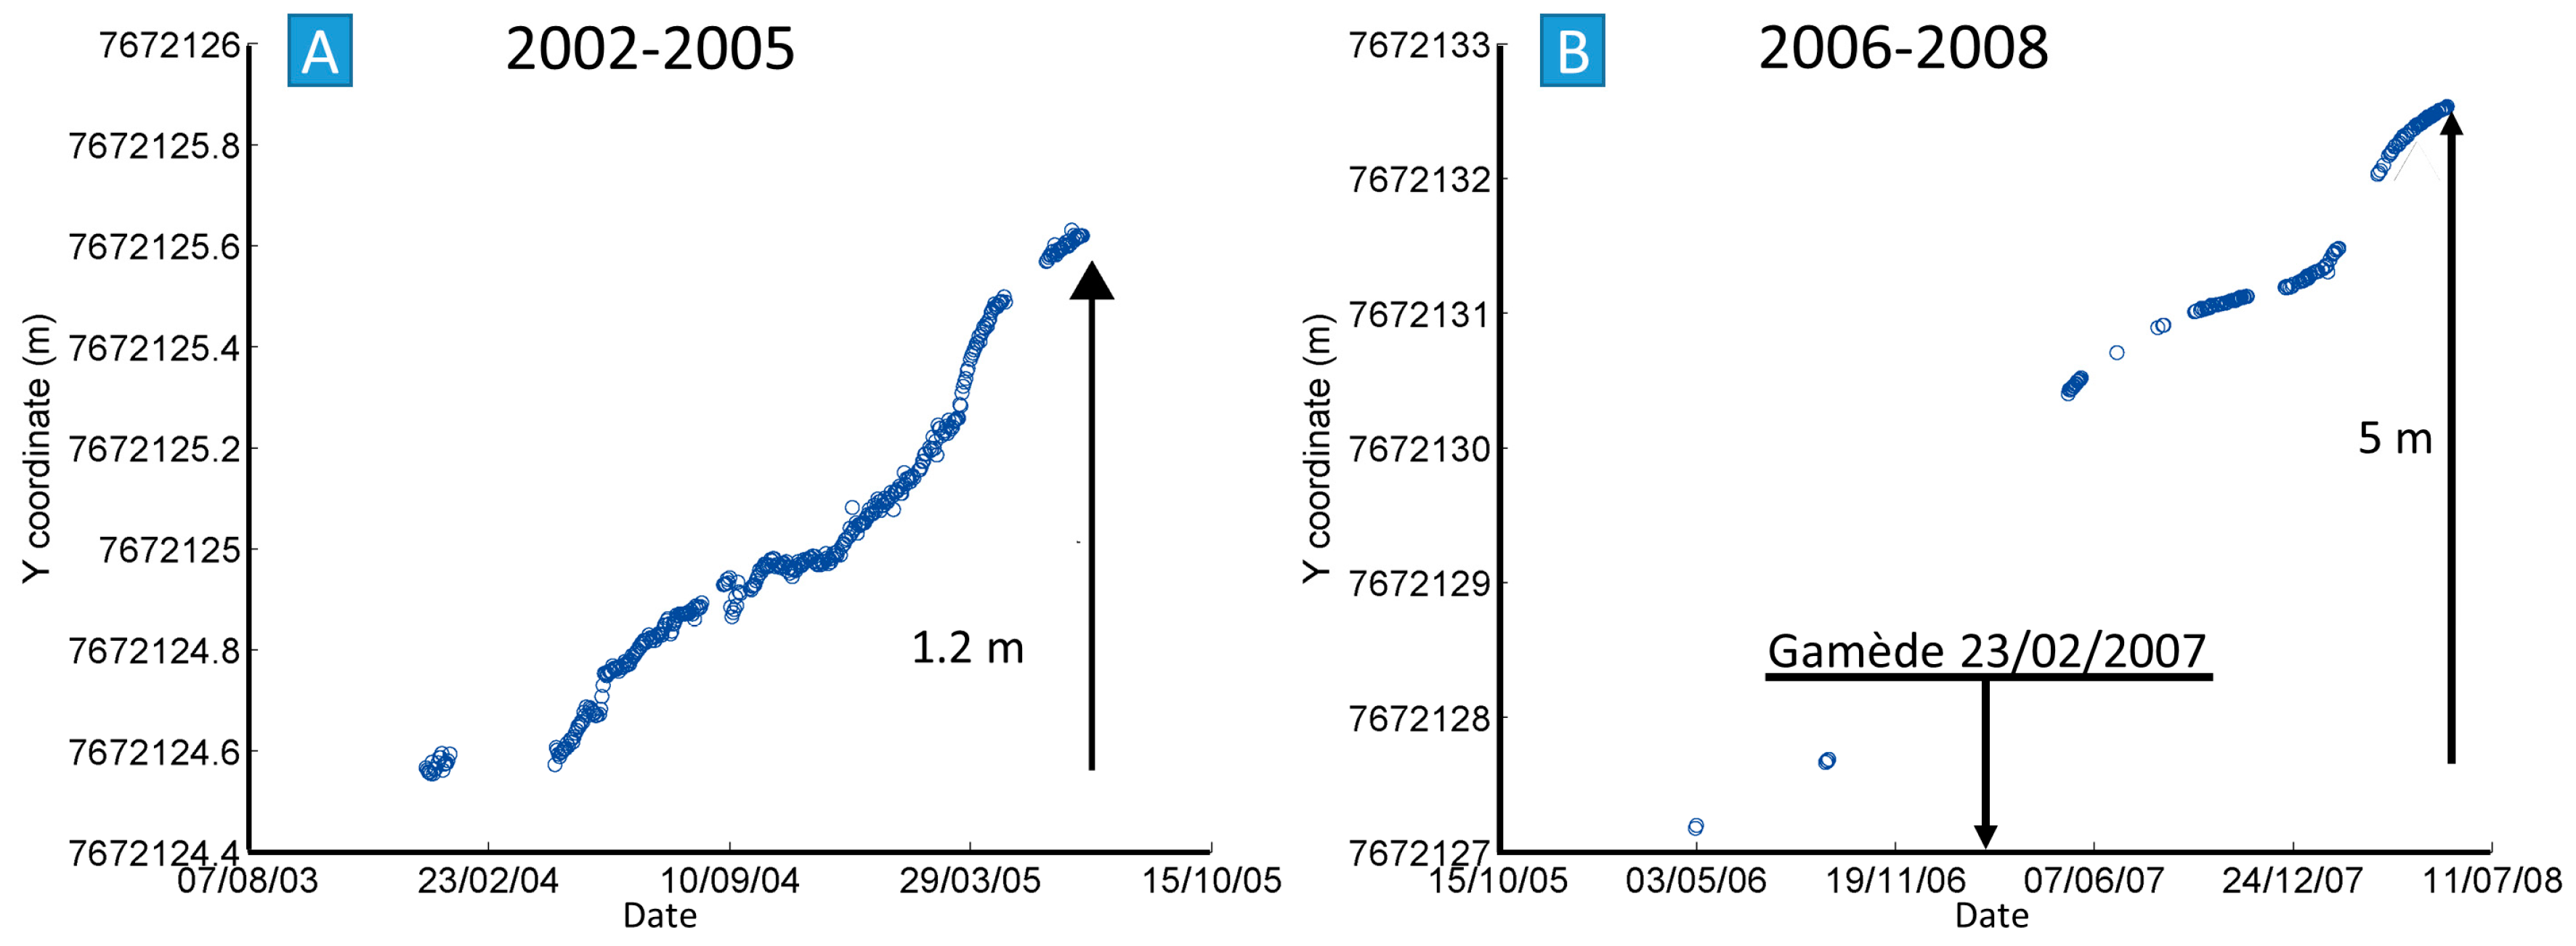
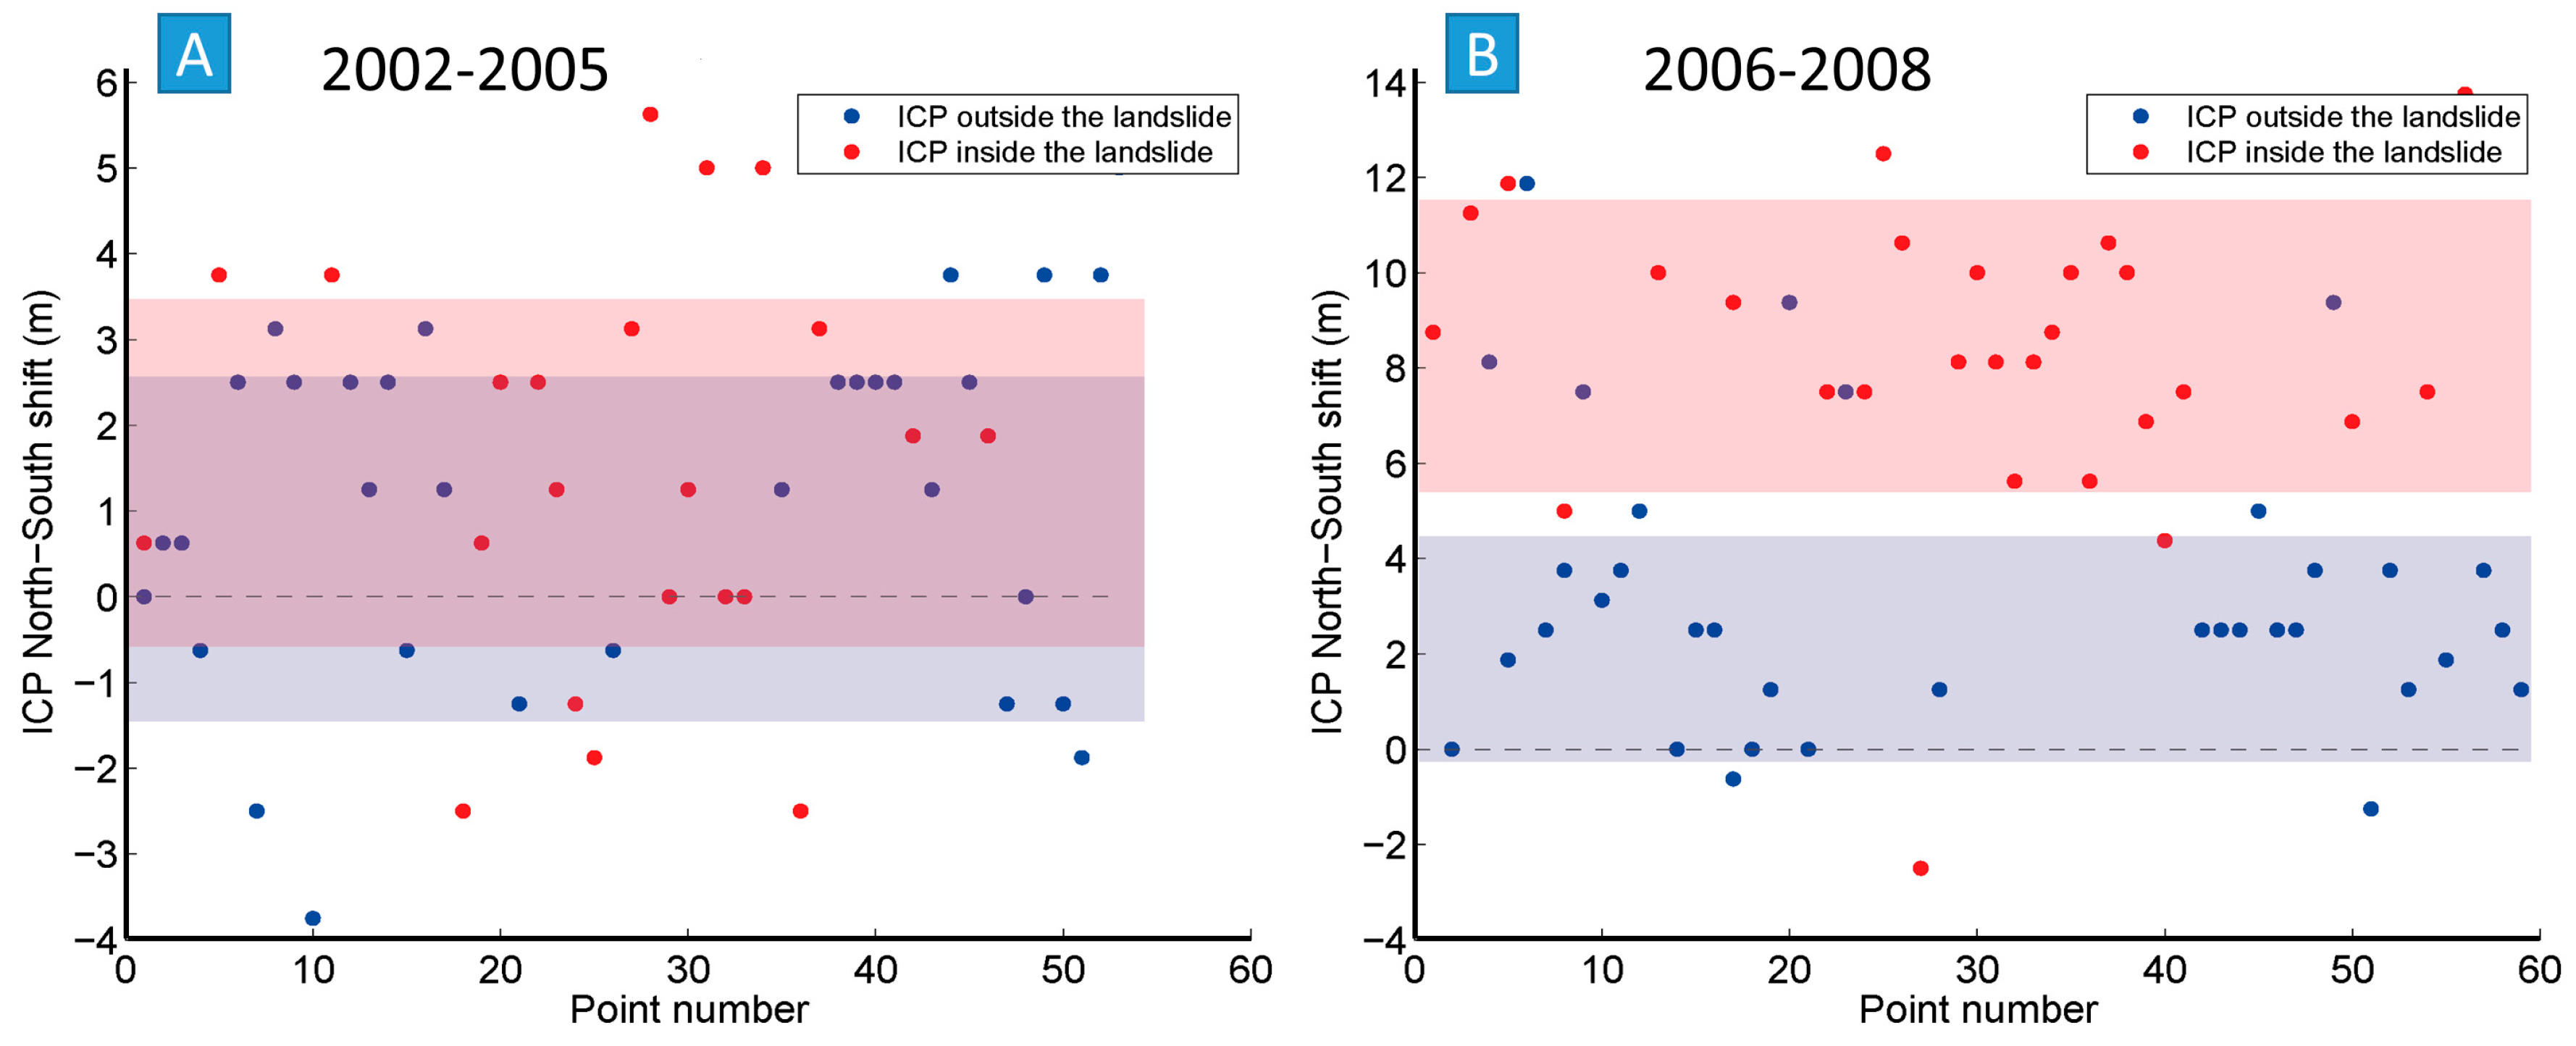
http://kalideos.cnes.fr/). The images of 2002 to 2005 cover a period of low displacement according to the DGPS located at Vira (Figure 2). The landslide was not affected by intense rainfall during that period. The period of 2006 to 2008 corresponds to a period of intense landslide activity. A major storm called Gamède hit Réunion in February 2007. Rainfall reached 1096 mm in one day. The DGPS measurements at Vira station (Figure 2) showed that a displacement of at least 5 m towards the north occurred during the year that followed this extreme event [30].
Only the south-north component of the displacement measured by DGPS is available. As the east-west component is very low [30], this work will mainly concern the south-north component of displacement.
The mathematical principles of image correlation have been extensively presented in others studies [17,18] and are briefly outlined. The purpose of image correlation is to detect similar pixel organizations or objects on two images acquired in different conditions in order to measure the shift of the homologous pixels between two images. If the two images have been acquired specifically for photogrammetric purposes, the value of the shift will be used to measure the elevation of the point. If the images are diachronic and ortho-rectified, the shift is then a measure of the surface displacement that occurred between the two acquisitions. One window is defined around the point to correlate on one image. A homologous window of the same size is searched on the other image that will maximize a correlation function. The process can be refined to obtain a precision that reaches one-tenth of a pixel in the ideal case [17,18] which is 0.25 m for a SPOT-5 image with a 2.5 m resolution. Various correlation functions can be used that can be statistical or defined in the frequency domain after the decomposition of the image signal in its frequency components. The size of the windows is a critical parameter in the correlation process. The precision of correlation increases when the size of the windows decreases but the results are more sensitive to noise. Less noisy results can be obtained with larger windows but with less precision. Rosu et al. [18] have tested the effect of window size on the precision of the results.
MicMac [36] is an open source software originally dedicated to photogrammetry. Image correlation being at the core of photogrammetry, a statistical correlation function is proposed from the correlation engine of MicMac. This correlation function uses a multiscale technique with regularization methods which enable working with very small windows without being sensitive to noise assuming a regular displacement and searching the coherency in the data set [26,37]. An option permits the retention of only the pixels that present a coefficient of correlation above a give threshold defined by the user. Windows of 9 × 9 pixels have been used in this study. The threshold of the correlation coefficient was set to the default value that is 0.5 as suggested by Rosu et al. [18]. The outputs consist of three maps, one of the shifts along the rows, one of the shifts along the columns, and one of the correlation coefficients indicative of the quality of the results.
Cosi-Corr [27,28,29] is an add-on to Envi (Harris Geospatial Solutions) developed by the Tectonics Observatory of Caltech. This free add-on is programmed in IDL and available since 2007. The last version was published in 2014. Cosi-Corr can ortho-rectify aerial or satellite images, can compute internal and external parameters of cameras, provides various filters such as non-local mean filters, etc. Cosi-Corr can also correlate images using frequency or statistical correlation functions. It can use multi-size decreasing windows with resampling of data to increase precision if the shift is large. The GUI (Graphical User Interface) of Cosi-Corr is simple. The user has to define the type of correlator and the size of the correlation window. As suggested by Rosu et al. [18] a square window of 32 pixels was used in this study with a spatial step of one pixel. As with MicMac, Cosi-Corr produces a map of shift along the line, a map of shift along the row and a map of quality of correlation. If the images are georeferenced the shift is expressed in meters.
These two correlation softwares have been used in various cases to estimate the ground displacement from ortho-rectified images. Rosu et al. [18] tested the two softwares in three different cases (two ground displacements from earthquakes and one dike intrusion). They showed that the regularization methods of MicMac produces smoother results with less noise and permit to use smaller windows and thus could be used to obtain more accurate displacement values.
The results of these methods consist in (1) the value of shift of the ICP by SIFT measured by the difference of coordinates of each ICP on successive images; (2) the value of shift of the ICP estimated by Cosi-Corr and MicMac and (3) the correlation maps produced by Cosi-Corr and MicMac.

4. Results

4.1. Shift and Displacements of Image Control Points Measured from SIFT Algorithm

The shift of the ICP (Image Control Points) between two image acquisitions is equal to the difference of the coordinates of the pixels representing these ICP. South-north shift values measured on ICP by SIFT are shown for the two periods of study in Figure 3 for points located inside and outside the landslide.
For the 2002–2005 period, the average shift of the ICP located inside the landslide is 1.6 ± 2 m toward the north. The average shift of the ICP located outside the landslide is 0.5 ± 2 m. It is thus impossible to distinguish ICP located inside the landslide from ICP located outside the landslide from only the shift measured on the ICP and thus to estimate the displacement due to landslide in this dataset. For the 2006–2008 period, the average shift of the ICP located inside the landslide is 8.5 ± 3.1 m toward the north. The average shift of the ICP located outside the landslide is 2 ± 2.2 m. For this period the difference of shift of the two families of ICP is significant. Assuming that the shift of the ICP located outside the landslide is independent of the position of the ICP, it is necessary to subtract their average shift from the shift measured on the ICP located in the landslide to estimate a value of the displacement of these points. The average displacement of the landslide toward the north could therefore be 6.5 m. The cumulative displacement toward the north of the Vira station during the 2006–2008 period is at least 5 m toward the north (Figure 2), close to the value of displacement estimated on the ICP.

4.2. Shift Maps and Displacements Obtained by Cosi-Corr and MicMac

The shift maps produced by MicMac and Cosi-Corr are shown in Figure 4 for the two periods of study and for the east-west and south-north directions. For the 2002–2005 period, the surface of the landslide cannot be distinguished from the stable areas on the shift maps. The east-west shift measured by MicMac ranges from −6 to 3 m. The south-north shift ranges from −5 to 5 m. The shift on each map is smooth, certainly due to the effects of the method of regularization used by MicMac. At first order the signal variability seems not strongly correlated to topography. Elongated east-west correlation structures are slightly visible in the landslides and could correspond to the east-west elongated hills located in the western part of the landslide (Figure 1B). The results produced by Cosi-Corr for the 2002–2005 period are noisy in both directions (Figure 4). Square patches 20 to 40 pixels wide appear, presenting unrealistic shift values of 10 to 20 pixels. These patches are concentrated in the river that borders the landslide to the north. They are also numerous on the landslide, on the southern scarp of the Salazie erosion basin and on the left bank of the Mât River.
For the 2006–2008 period, the south-north shift map produced by MicMac clearly shows the landslide characterized by a 8 to 10 m shift toward the north (Figure 4). On this map, the stable areas located close by the landslide display a shift of 2 to 3 m toward the north. Contrary to the south-north sift map, the east-west shift map produced by MicMac is strongly correlated to topography. The south oriented slopes display a strong displacement toward the east whilst the north oriented slopes show a strong displacement toward the west (Figure 5). This east-west shift is not significant of displacement. The results of Cosi-Corr for the same period are similar to the results of MicMac with more noise. The landslide clearly appears on the south-north displacement map with maximum shifts of up to 10 m towards the north. Topography may have a small effect on this south-north shift map visible on the east-west elongated hills located on the western part of the landslide. The east-west map of shift is similar to the map produced by MicMac with a strong effect of topography on the shift signal.

4.3. Shift and Displacements of Image Control Points Measured By MicMac and Cosi-Corr

South-north shifts measured on ICP by SIFT are reported versus the south-north shifts measured by MicMac and Cosi-Corr at the same points for the two periods of study (Figure 6). For the 2002–2005 period, the shifts measured by SIFT and by MicMac are less than 5 m without correlation between the two sets of measurements. For the same period, the same observation can be made between the shifts measured by SIFT and by Cosi-Corr excluding anomalous values of Cosi-Corr. For the 2006–2008 period, the shifts measured on ICP by SIFT and the shifts measured by Cosi-Corr and Mic Mac are linearly correlated (Figure 6B,D). The slope of the trend line is around 0.72 for both cases indicating that the shifts measured by SIFT are larger than the shifts measured by Cosi-Corr and MicMac. On the Figure 6B,D, the points located in the landslide are clearly distinct from the points located outside the landslide. This confirms that the shifts observed for these points are related to the displacement of the landslide.

4.4. Shift and Displacements Measured by MicMac and Cosi-Corr at Vira DGPS Station

The south-north values of shifts measured by MicMac and by Cosi-Corr at the Vira DGPS station are compared to the values of south-north displacement measured by DGPS on Table 2. The shifts values measured by MicMac and Cosi-Corr are the average of shifts estimated on a square window of five pixels centered on the Vira location. For the first period, the displacement measured by DGPS is lower than 1.2 m. The shift measured by MicMac is 0.75 m and the shift produced by Cosi-Corr is 4.5 m. Therefore, it seems that MicMac produces acceptable results and that Cosi-Corr indicates a shift too large perhaps due to noise in the correlation results. For the second period, Cosi-Corr and MicMac indicate shifts ranging from 7 to 8 m. The displacements measured by DGPS are around 5 m. The shifts measured by Cosi-Corr and MicMac are an overestimation of the displacement. The difference of 2 to 3 m observed between the DGPS measurement on one side and the results of Cosi-Corr and MicMac is similar to the shift measured by Cosi-Corr and MicMac on the stable zones surrounding the landslide (Figure 4) and to the average value of shift of ICP located outside the landslide (Figure 3). This difference could result from errors in the ortho-rectification processing and has to be subtracted from the south-north shift value to obtain a realistic displacement value.

5. Discussion

The goal of this work is to evaluate the precision and sensitivity of the methods of image correlation to measure displacements in complex settings from ortho-rectified images produced by National Space Agencies. Four points are discussed: (1) the correlation of the east-west shifts to slopes; (2) the differences and similarities between the MicMac and Cosi-Corr; (3) the conversion of the measured shifts in a reliable value of ground displacements; and (4) the potential and limits of image correlation to measure displacement in complex environment.
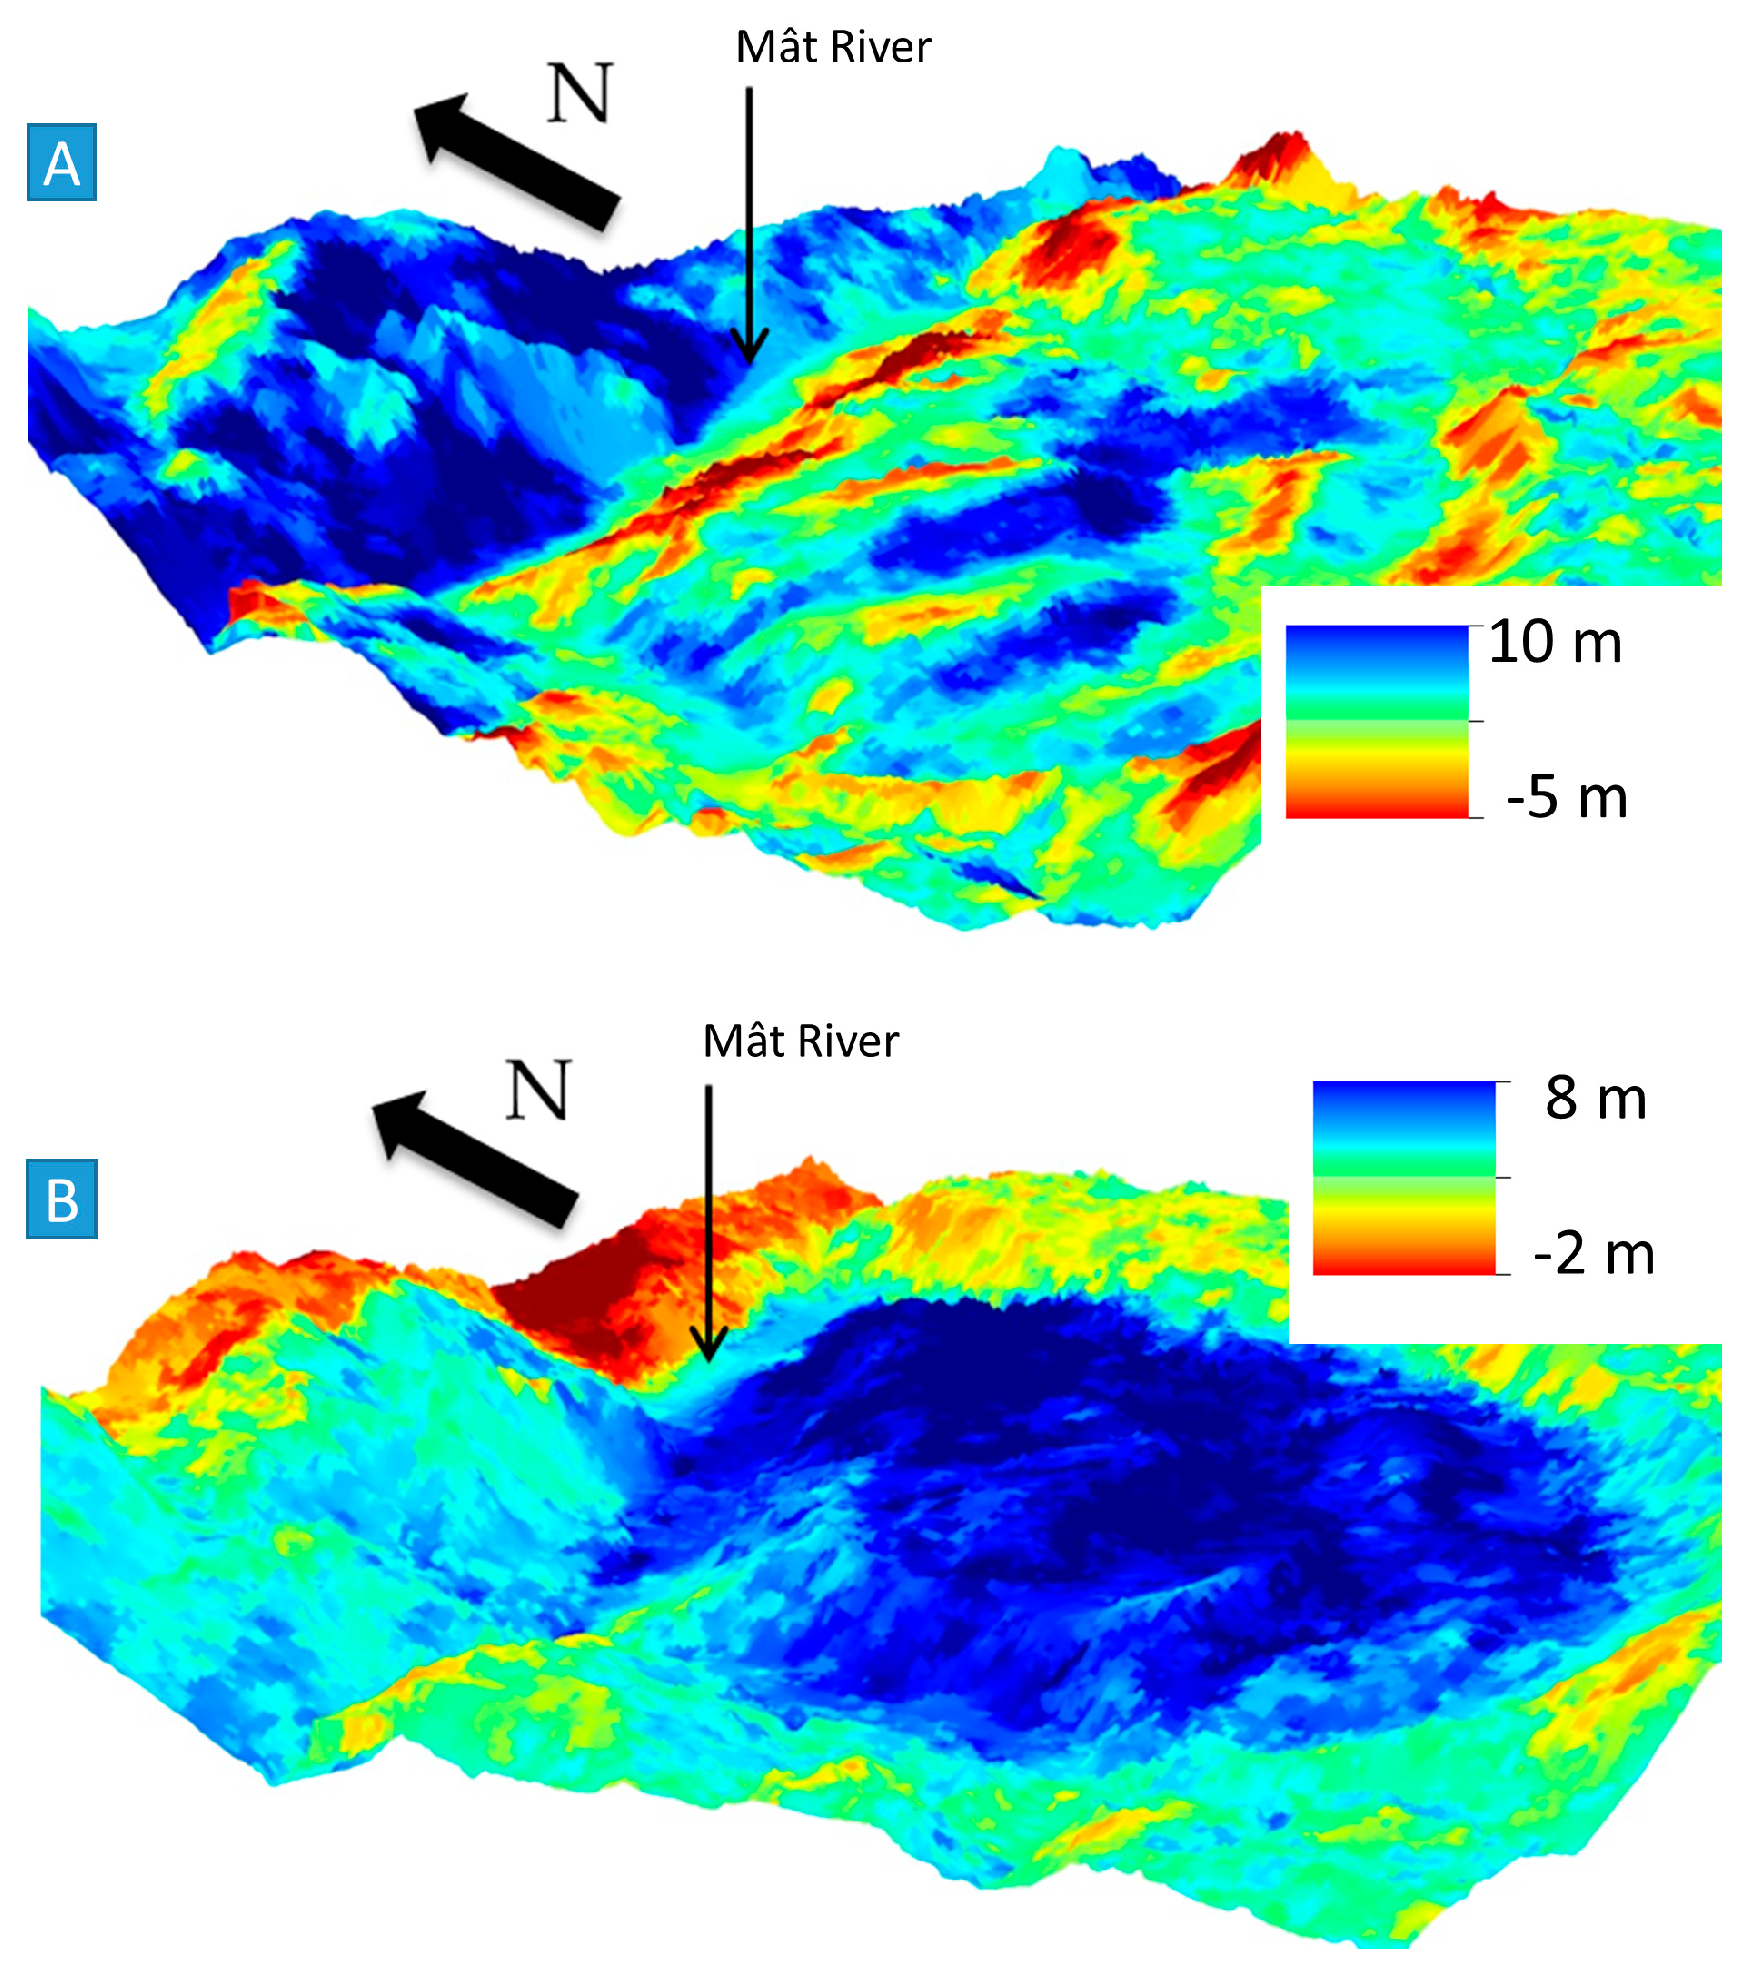
As already observed by Delacourt et al. [23,
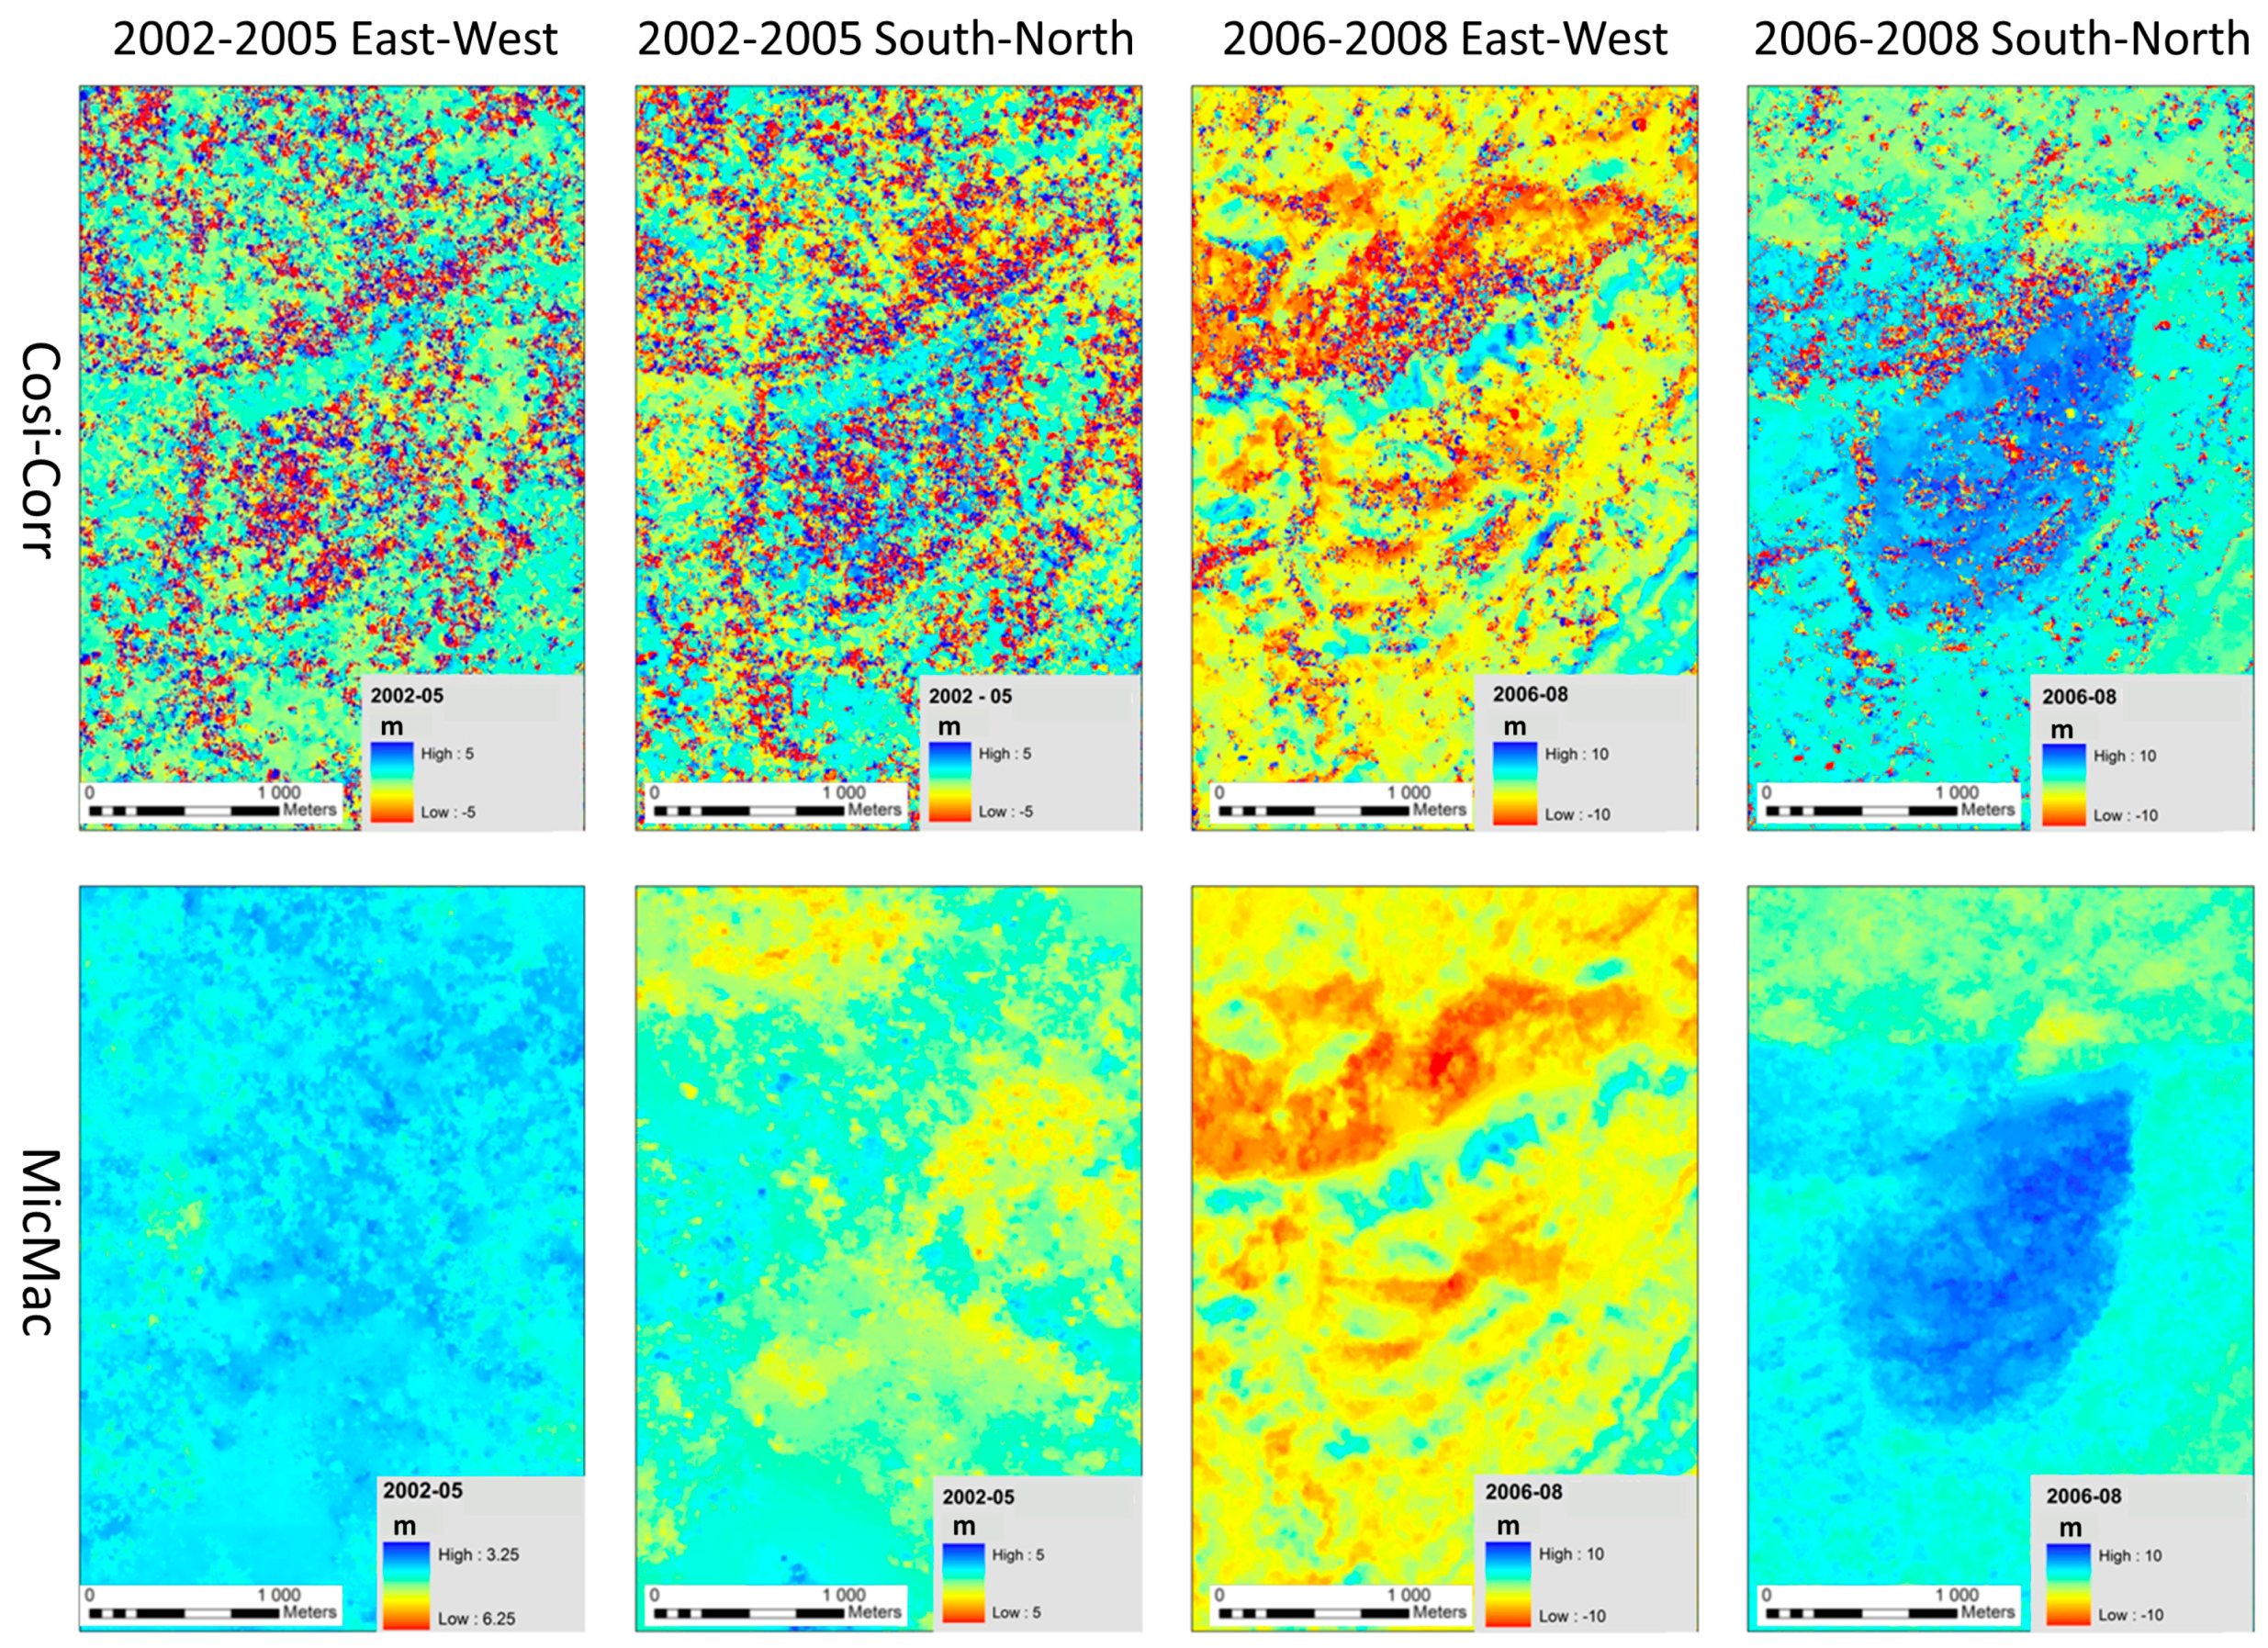
38], image correlation of ortho-rectified SPOT images detects shifts in the east-west direction that seems unrelated to displacement. These shifts, mainly visible on the 2006–2008 data set, are strongly correlated to the slope aspect. The north facing scarps are shifted toward the west while the south facing scarps are shifted toward the east. The shift values reach 10 m in both directions. It seems thus impossible to measure a reliable displacement in the east-west direction if this displacement produces a shift lower or equal than the topographic signal that is four pixels for an image at 2.5 m resolution. East-west (E-W) displacement could possibly be estimated better on flat areas. The E-W shift is certainly due to the large difference in resolution between the DEM (resolution of 25 m) used to ortho-rectify the data and the image (resolution of 2.5 m). Moreover, SPOT-5 uses a pushbroom detector oriented in the east-west direction and orthogonal to the platform path. Such technology could introduce distortions in the direction parallel to the sensor orientation. Correlation between displacement and slope values are interpreted as resulting from a low quality of ortho-rectification. The maximum error of ortho-rectification given by Kalideos for the images is ±2 pixels in both directions for every image that is ±10 m with an average close to 0 in both directions and a standard deviation close to 0.5 pixel in y and close to 0.72 in x. The effects of ortho-rectification on the results are first discussed for the 2006–2008 case on which the correlation shows a clear shift signal that can be related to displacement. In the south-north direction, a clear displacement signal is visible by correlation. If a topographic signal exists, it is minor and hidden by the displacement signal. That indicates that the ortho-rectification errors are nil or similar for the two images. In the east-west direction, the existence of a topographic signal in the correlation results that can reach four pixels (10 m) indicates that the ortho-rectification errors are spatially different for the two images. The acquisition geometry of the two images is slightly different (Table 1). The difference in incidence angle is close to 2°. This difference is certainly at the origin of the differences in ortho-rectification. This is confirmed by the results obtained on the other set of images for which no clear topographic signal is visible in both directions. The incidence angles of these images are very close with a difference of only 0.05° (Table 1).
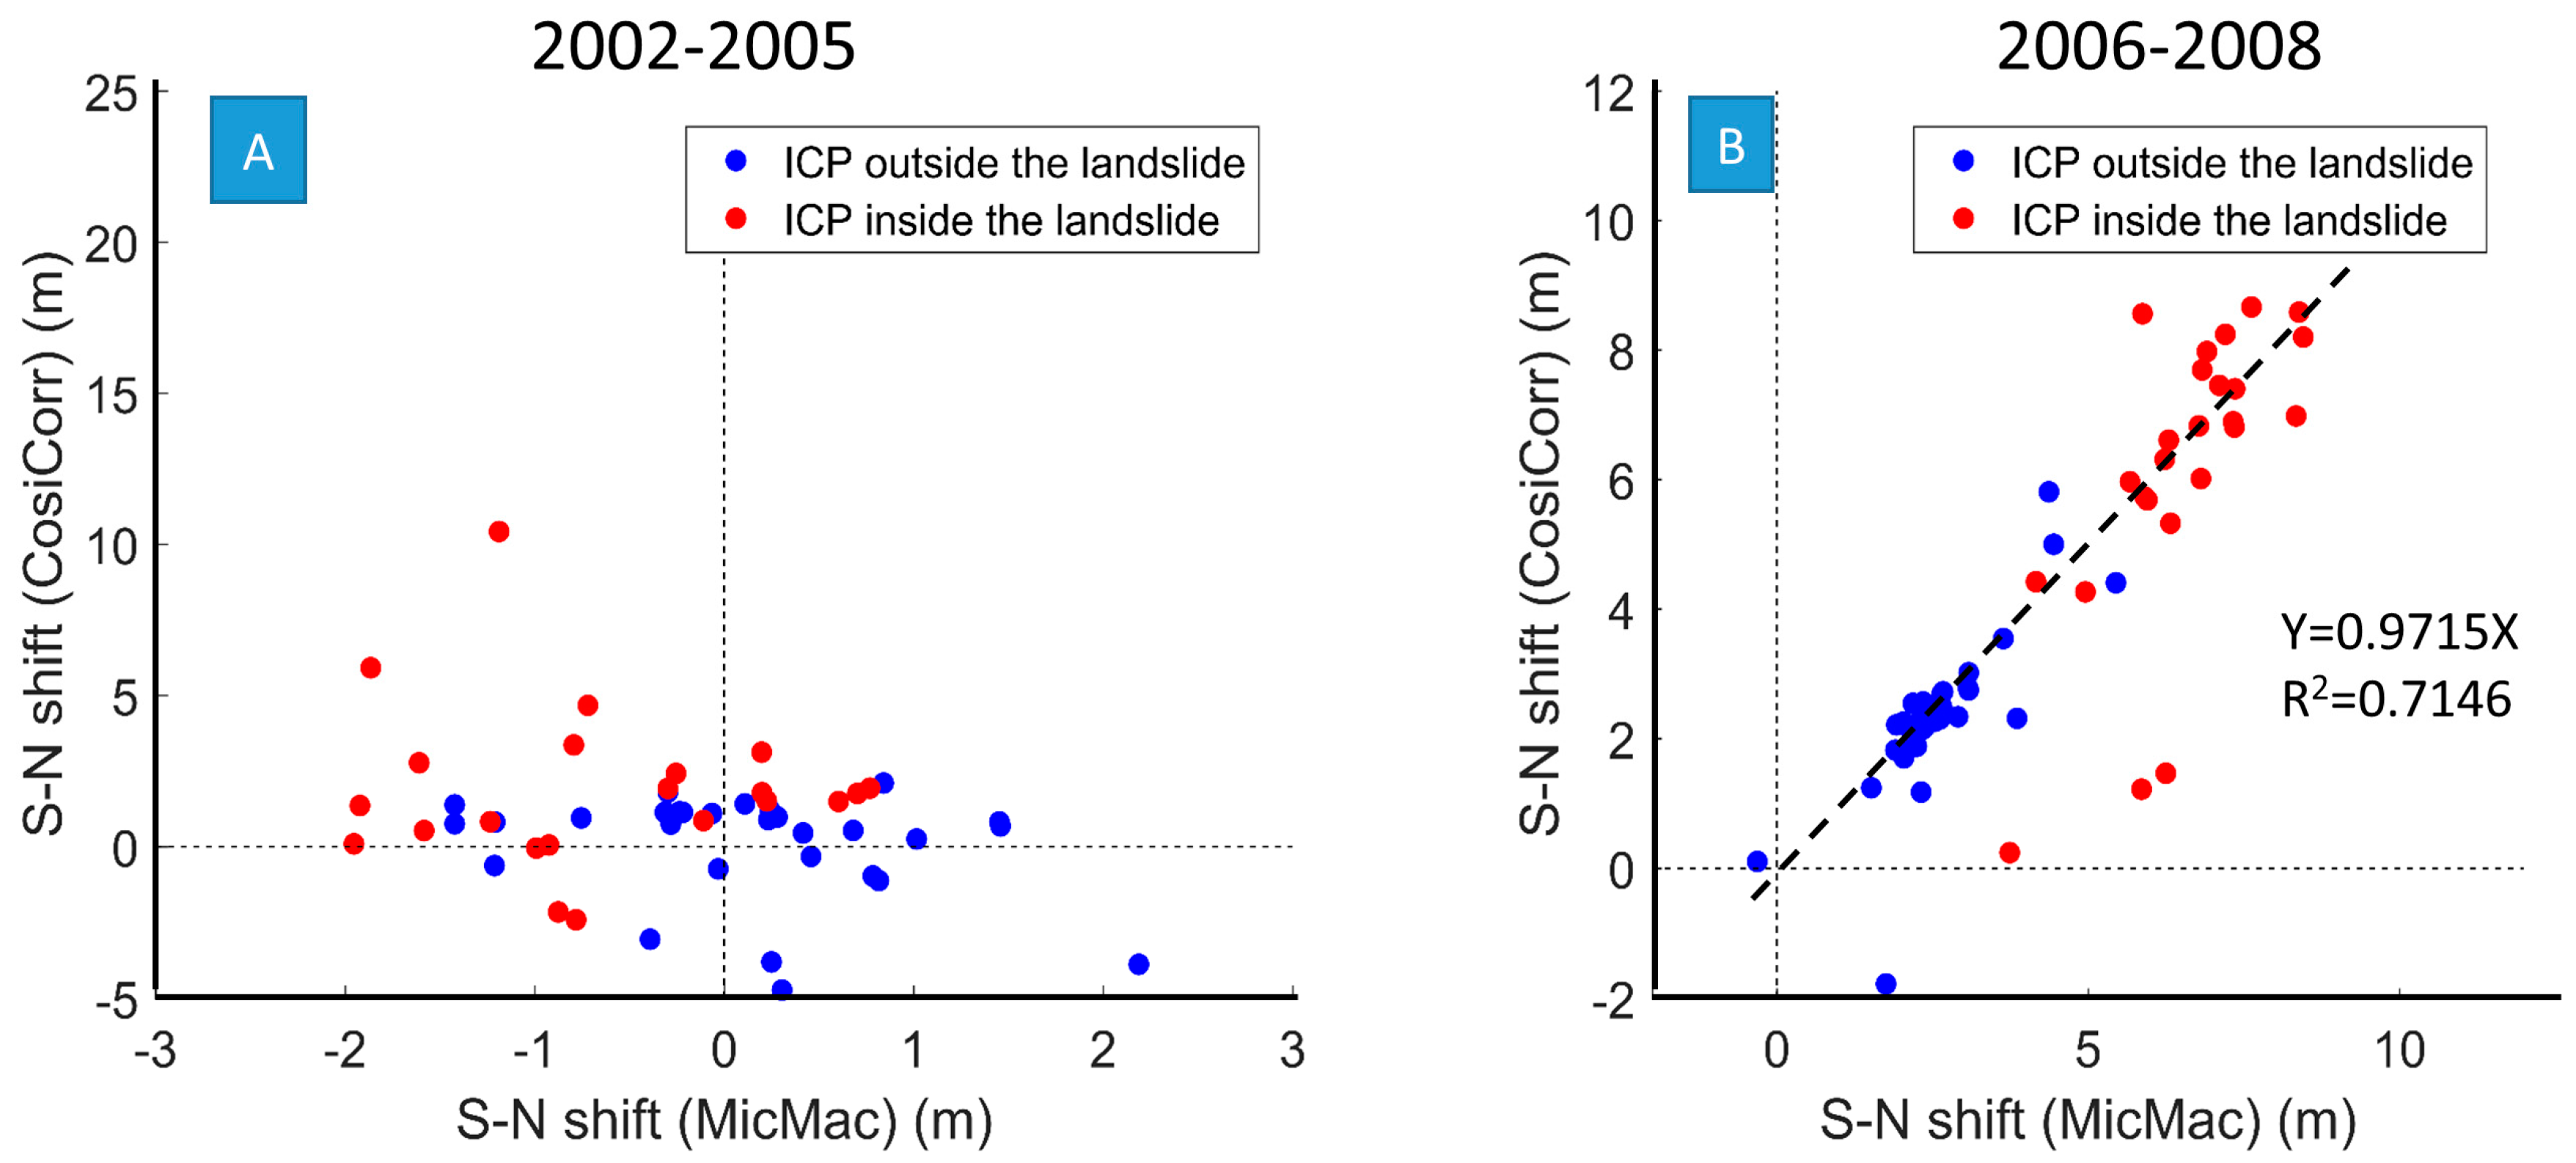
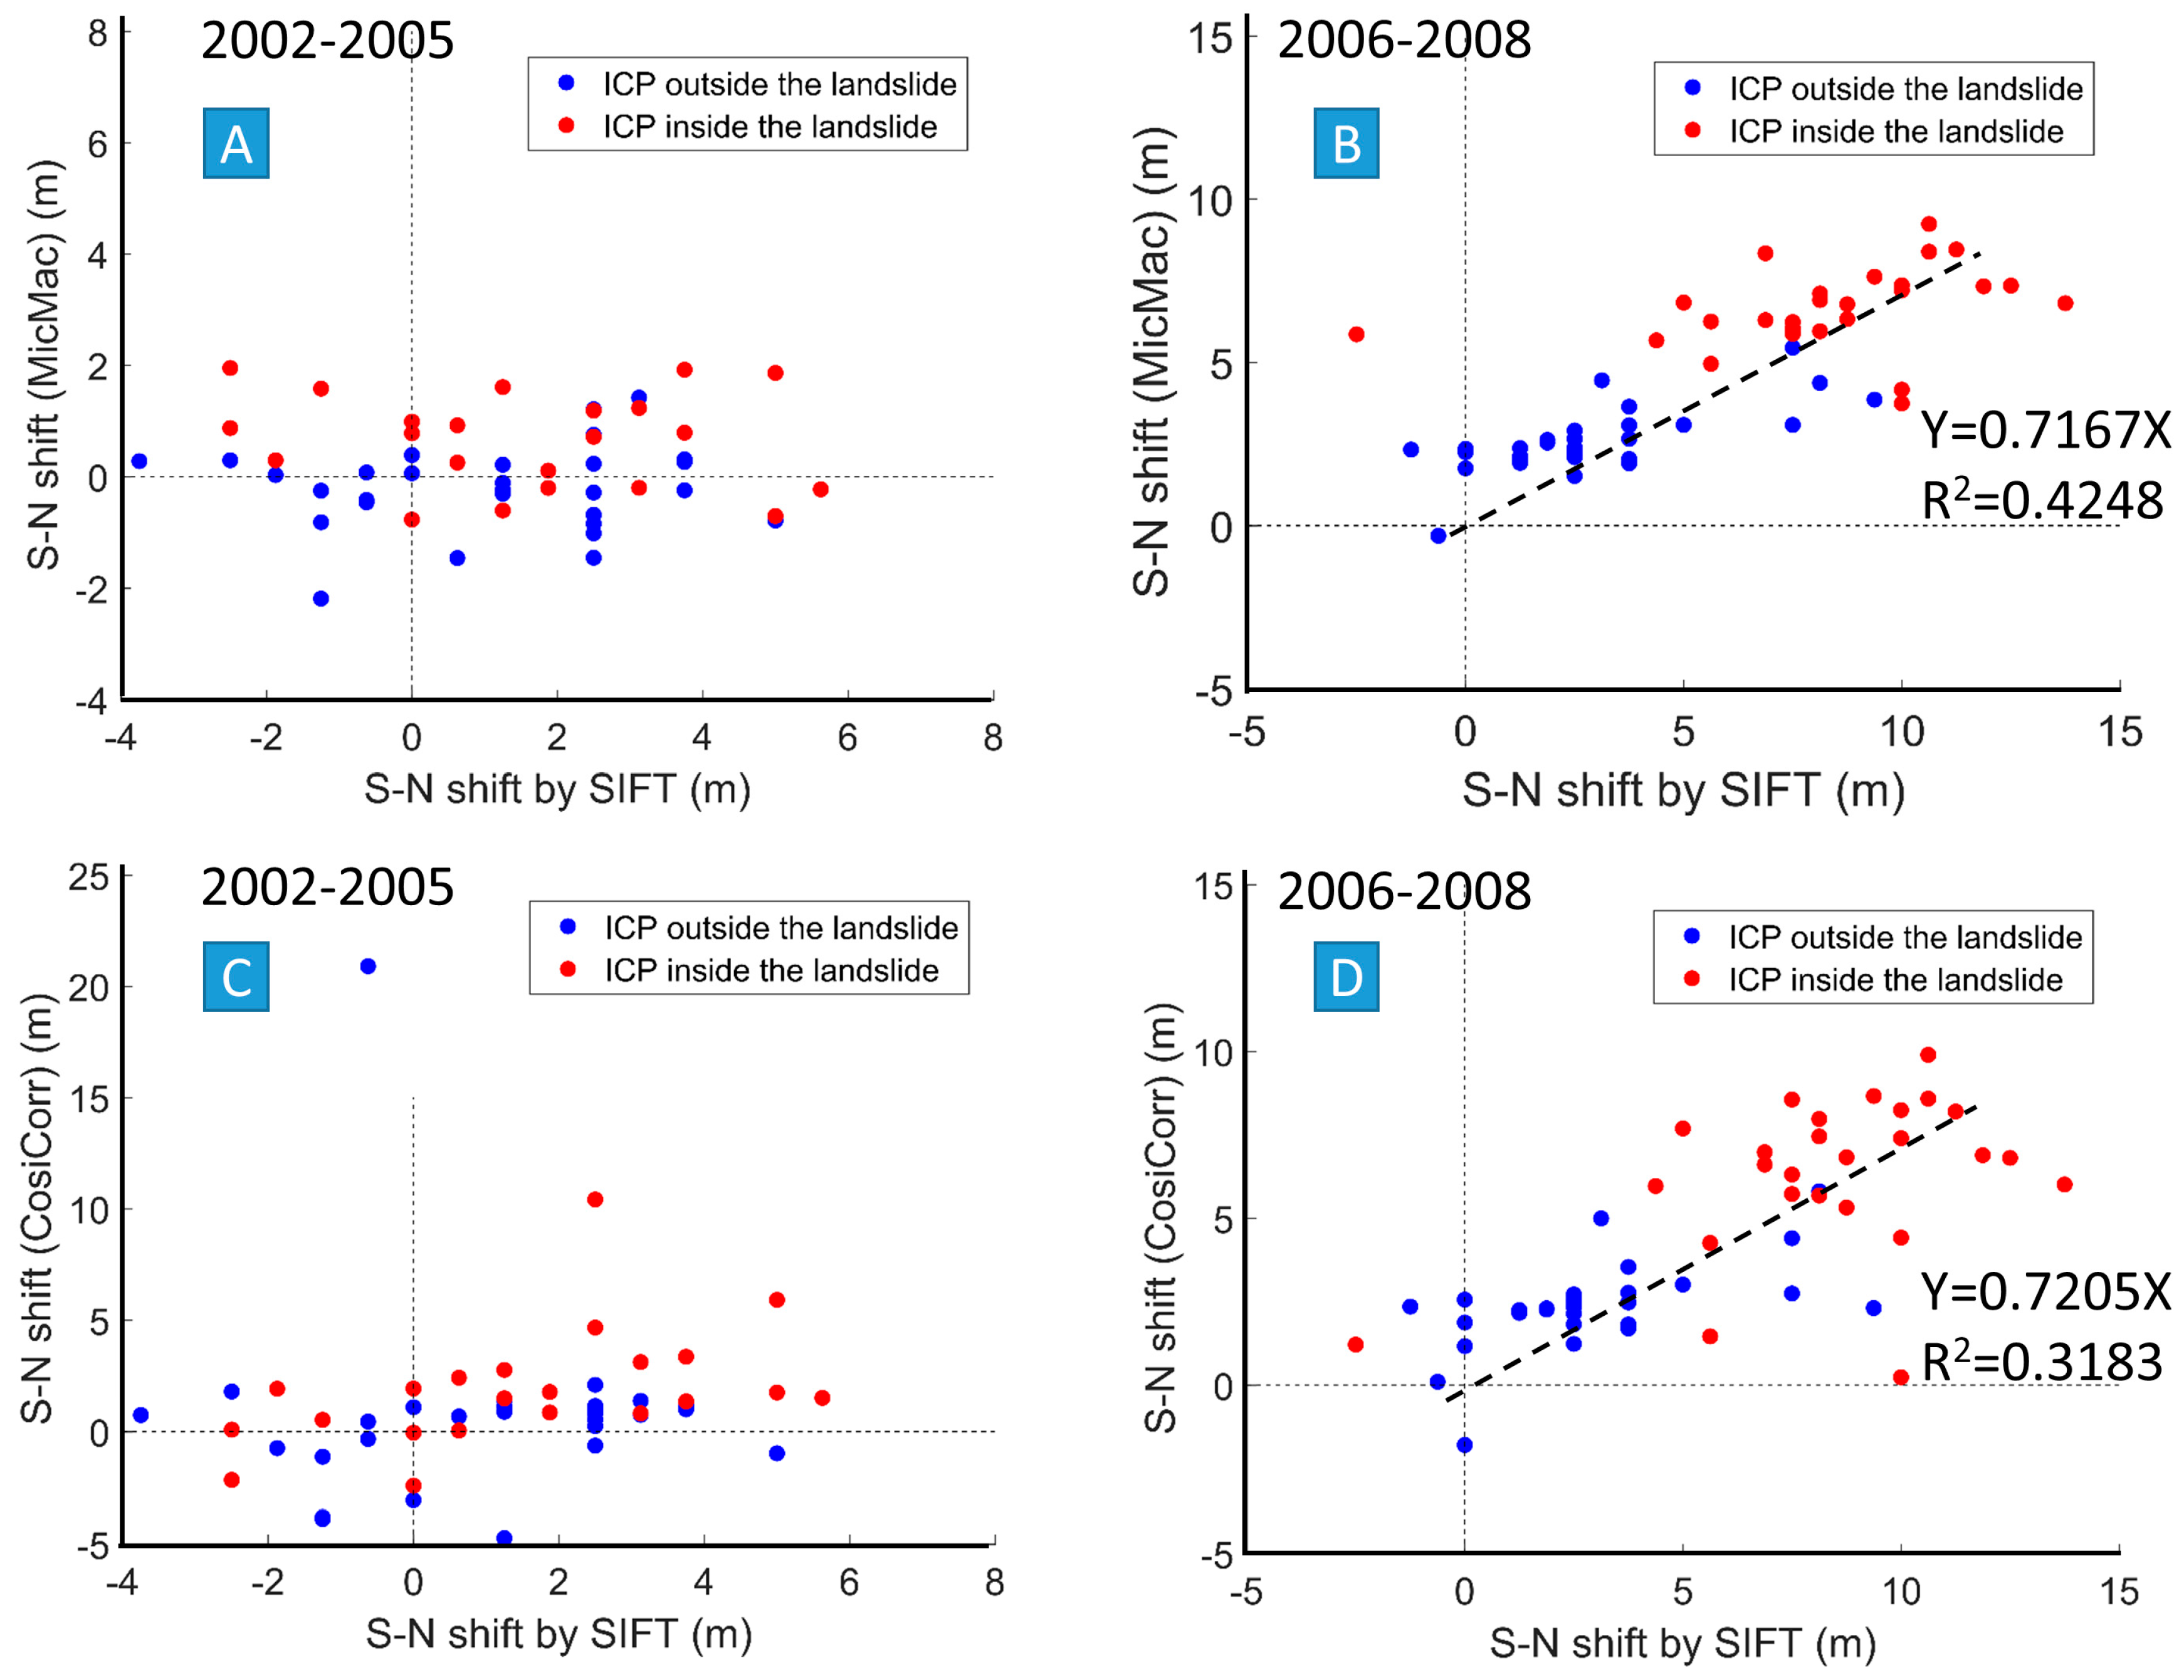
MicMac and Cosi-Corr produce similar results in terms of shift maps. The two correlators are able to detect a shift on the landslide area for a given period of high displacement but they are both unable to measure any coherent shift for the period of low displacement. The shifts measured by the two correlators on the ICP are strongly correlated (R2 > 0.7) except for some points for which the shift signal measured by Cosi-Corr is noisy (Figure 7). The smooth results produced by MicMac seem unsatisfactory everywhere on the images. For both periods and between two acquisitions, the land-use has locally changed. New constructions have been built and others have disappeared. New roads opened. Moreover, vegetation evolved, scree slopes were modified by transport and erosion of sediments. The boulder organization in the bed of the Mât River changed. It makes sense if a correlator is not able to define homologous points everywhere in such active landscape. The noisy pixels in the Cosi-Corr results indicate the position of pixels that evolved in term of land use between two acquisitions.
The shift of the ICP detected by SIFT can be discussed according their position and the displacement of the landslide. For the period of low displacement (2002–2005), the average shift of the points located outside the landslide is 0.5 m. The shift of the points located in the landslide is slightly higher and reaches 1.6 m. However, the dispersion of the results is high. It seems difficult to extract a significant shift in terms of displacement for such low values. The results produced by both correlators arrive at the same conclusion. The displacement of the landslide for this period is around 1.2 m toward the north measured by DGPS at the Vira station. It seems that the shift is not significant in such context where displacement and pixel size have similar dimension. For the second period, the average shifts of the ICP located outside the landslide is 2 m toward the north. The shift of the points located in the landslide is 8.5 m toward the north. The dispersion of the results is also high in that case. However, the south-north correlation maps clearly draw the landslide boundaries (Figure 3). The displacement of the landslide measured at the Vira DGPS station for this time period is larger than 5 m. This suggests that the shift is significant in terms of displacement if the displacement exceeds 5 m (approximately two pixels). For the second period, the shift measured by correlators is larger than the displacement measured by DGPS on one point of the landslide. This shift has to be corrected to estimate a displacement. Two methods can be proposed. The first one uses the average shift measured on the stable ICP point. For the 2006–2008 period, the average shift of the ICP is 2 m towards the north. This value can be subtracted from the shift measured by correlators to estimate the displacement. If applied at the position of DGPS, the corrected magnitude of the shift is approximately 6 m, which is more in accordance with the displacement value estimated by DGPS. The second method uses the background shift values measured by the correlator in the vicinity of the landslide. On the image of the south-north shift produced by both correlators, the landslide is surrounded by an area shifted towards the north by approximately 2 m (turquoise belt around the landslide on Figure 3). This value can be subtracted from the value of the shift measured on the landslide to estimate the displacement. Here again, a value of 6 m can be calculated for the landslide displacement, similar to the displacement measured by DGPS.
This work shows that correlation can be used to evaluate surface displacements of a complex landscape with images ortho-rectified by institutional providers under some conditions. The first one is that the displacement parallel to the direction of the sensor pushbroom has to be large enough that distortion produced during acquisition and ortho-rectification is negligible. In this study, a shift of ±10 m independent of displacement can be observed. This shift of four pixels represents 1/2.5 of the resolution of the DEM used for ortho-rectification. The second condition is that the displacement in the south-north direction has to be larger or at least equal to two pixels (5 m in the present study). Lower values of shift will be more difficult to detect and attribute to a reliable surface displacement. A good practice to estimate the quality of the results and to correct the shifts to measure displacements is to define some tenths of ICP (60 in our example) spread out all over the image on both stable and displaced surfaces. These ICP will be selected by SIFT and inspected visually to remove or correct the false points. Firstly, the shift values of the ICP will be used to evaluate the validity of the correlation. If the shift measured on points located outside and inside the displaced surface cannot be distinguished, the correlation will give insignificant results. Secondly, if the two categories of points can be distinguished the average shift value of the stable points will be used to correct the shift values of the displaced areas and to estimate their displacement.
The complexity of the study case results from at least four major conditions. The area is covered by vegetation both natural and cultivated that evolve with time. The area is also occupied by human buildings and infrastructures that can appear or disappear on successive images. The third difficulty is related to the high relief of the area which induces planimetric errors in the ortho-images if the satellite images are not taken exactly under the same incidence angle. The last difficulty is that the displacement is in the same order of magnitude as the size of the pixel. In simpler cases, the technique proposed in this study will give better results. On desert areas without evolving vegetation or evolving anthropic constructions the correlation software will produce less outliers and less noise than in the study case presented in this work. If the area is flat, in the case of study of displacement related to an earthquake, the errors of ortho-rectification will be minimum and will allow the use of images taken under different incidence angles. Finally, if the displacement is large compared to the pixel size, the correlation results will be more reliable.

6. Conclusions

Ortho-rectified 2.5 m resolution SPOT images produced by institutional providers were used to evaluate the possibility of measuring the displacement that occurred between two image acquisitions of a landslide located in a mountainous highly vegetated area with MicMac and Cosi-Corr. A clear difference can be made between the significance of the east-west shift and the south-north shift. The east-west shift is strongly correlated to slope aspect and can reach four pixels (10 m) in both directions. The displacement has to be larger than this artifact to be reliable. The south-north shift on stable area reaches a maximum of one pixel and is weakly correlated to topography. The displacement has to be larger than this shift value to be estimated. The shift needs to be corrected in order to be interpreted as a displacement value. The average shift of Image Control Points located outside the moving area have to be subtracted from the shift measured by image correlation to be used in terms of landslide displacement. The two correlators used in this study have their own potential and limitation. They provide similar results on average. The results of MicMac are smooth as the software uses a regularization method. The pixels that changed between two acquisitions are not taken into account in the correlation. Conversely, the results of Cosi-Corr are noisier specifically where the surface changed. A technique to evaluate the potential and limitation of correlation of diachronic ortho-rectified images can be proposed from these results. Firstly, ICP have to be defined on images and their shifts has to be measured. If the shifts of the ICP located inside the moving area are similar to the shifts of the ICP located inside the moving area, the dataset is not suitable for estimating the ground displacement. If the shifts of the ICP located inside the moving area are distinct from the shifts of the ICP located outside the moving area, the shift maps obtained by MicMac or Cosi-Corr or by other correlation software have to be corrected from the shift measured on ICP located on stable areas in order to obtain a displacement map.

Acknowledgments

Kalideos is warmly thanked for providing the SPOT-5 images and the information about the SPOT-5 images. The authors thank Bertrand Aunay (BRGM Réunion) for the DGPS data. The four reviewers of this paper are warmly thanked. The CNES funded this research through the TOSCA “Terre Solide” program.

Author Contributions

Rejanne Le Bivic performed the MicMac correlation on the SPOT-5 images, wrote the study site presentation and helped to revise the final version of the paper; Pascal Allemand organized the data, developed the ideas and wrote the paper apart from the study site presentation; Amélie Quiquerez contributed to the analyses of the data and to the discussion concerning the potential and limitations of the correlation method to investigate the cinematics of landslides; Christophe Delacourt has been involved in the selection and acquisition of the SPOT-Images and according to his knowledge on site in the interpretation of correlation maps either in environment noise or surface displacement.

Conflicts of Interest

The authors declare no conflict of interest. The founding sponsors had no role in the design of the study; in the collection, analyses, or interpretation of data; in the writing of the manuscript, and in the decision to publish the results.

References

  1. Cruden, D.M.; Varnes, D.J. Landslide types and processes. In Landslides: Investigation and Mitigation: Transportation; Turner, A.K., Shuster, R.L., Eds.; National Research Council: Washington, DC, USA, 1996; pp. 36–75. [Google Scholar]
  2. Casson, B.; Delacourt, C.; Allemand, P. Contribution of multi-temporal remote sensing images to characterize landslide slip surface? Application to the La Clapière landslide (France). Nat. Hazards Earth Syst. Sci. 2005, 5, 425–437. [Google Scholar] [CrossRef]
  3. Guzzetti, F.; Mondini, A.C.; Cardinali, M.; Fiorucci, F.; Santangelo, M.; Chang, K.T. Landslide inventory maps: New tools for an old problem. Earth-Sci. Rev. 2012, 112, 42–66. [Google Scholar] [CrossRef]
  4. Guerriero, L.; Coe, J.A.; Revellino, P.; Grelle, G.; Pinto, F.; Guadagno, F.M. Influence of slip-surface geometry on earth-flow deformation, Montaguto earth flow, southern Italy. Geomorphology 2014, 219, 285–305. [Google Scholar] [CrossRef]
  5. Tarolli, P. High-resolution topography for understanding Earth surface processes: Opportunities and challenges. Geomorphology 2014, 216, 295–312. [Google Scholar] [CrossRef]
  6. Malet, J.P.; Maquaire, O.; Locat, J.; Remaître, A. Assessing debris flow hazards associated with slow moving landslides: Methodology and numerical analyses. Landslides 2004, 1, 83–90. [Google Scholar] [CrossRef]
  7. Van Asch, T.W.J.; Malet, J.P.; van Beek, L.P.H.; Amitrano, D. Techniques, issues and advances in numerical modelling of landslide hazard. Bull. Soc. Geol. Fr. 2007, 178, 65. [Google Scholar] [CrossRef]
  8. Malet, J.-P.; Maquaire, O.; Calais, E. The use of Global Positioning System techniques for the continuous monitoring of landslides: Application to the Super-Sauze earthflow (Alpes-de-Haute-Provence, France). Geomorphology 2002, 43, 33–54. [Google Scholar] [CrossRef]
  9. Squarzoni, C.; Delacourt, C.; Allemand, P. Differential single-frequency GPS monitoring of the La Valette landslide (French Alps). Eng. Geol. 2005, 79, 215–229. [Google Scholar] [CrossRef]
  10. Powers, P.S.; Chiarle, M.; Savage, W.Z. A digital photogrammetric method for measuring horizontal surficial movements on the Slumgullion earthflow, Hinsdale County, Colorado. Comput. Geosci. 1996, 22, 651–663. [Google Scholar] [CrossRef]
  11. Massonnet, D.; Feigl, K.L. Radar interferometry and its application to changes in the Earth’s surface. Rev. Geophys. 1998, 36, 441–500. [Google Scholar] [CrossRef]
  12. Squarzoni, C.; Delacourt, C.; Allemand, P. Nine years of spatial and temporal evolution of the La Valette landslide observed by SAR interferometry. Eng. Geol. 2003, 68, 53–66. [Google Scholar] [CrossRef]
  13. Farina, P.; Colombo, D.; Fumagalli, A.; Marks, F.; Moretti, S. Permanent Scatterers for landslide investigations: Outcomes from the ESA-SLAM project. Eng. Geol. 2006, 88, 200–217. [Google Scholar] [CrossRef]
  14. Lu, P.; Casagli, N.; Catani, F.; Tofani, V. Persistent Scatterers Interferometry Hotspot and Cluster Analysis (PSI-HCA) for detection of extremely slow-moving landslides. Int. J. Remote Sens. 2012, 33, 466–489. [Google Scholar] [CrossRef]
  15. Tofani, V.; Raspini, F.; Catani, F.; Casagli, N. Persistent Scatterer Interferometry (PSI) Technique for Landslide Characterization and Monitoring. In Landslide Science for a Safer Geoenvironment: Volume 2: Methods of Landslide Studies; Sassa, K., Canuti, P., Yin, Y., Eds.; Springer: Cham, Switzerland, 2014; Volume 2, pp. 351–357. [Google Scholar] [CrossRef]
  16. Scambos, T.A.; Dutkiewicz, M.J.; Wilson, J.C.; Bindschadler, R.A. Application of image cross-correlation to the measurement of glacier velocity using satellite image data. Remote Sens. Environ. 1992, 42, 177–186. [Google Scholar] [CrossRef]
  17. Baratoux, D.; Delacourt, C.; Allemand, P. High-resolution digital elevation models derived from Viking Orbiter images: Method and comparison with Mars Orbiter Laser Altimeter Data. J. Geophys. Res. Planets 2001, 106, 32927–32941. [Google Scholar] [CrossRef]
  18. Rosu, A.M.; Pierrot-Deseilligny, M.; Delorme, A.; Binet, R.; Klinger, Y. Measurement of ground displacement from optical satellite image correlation using the free open-source software MicMac. ISPRS J. Photogramm. Remote Sens. 2015, 100, 48–59. [Google Scholar] [CrossRef]
  19. Klinger, Y.; Michel, R.; King, G.C.P. Evidence for an earthquake barrier model from Mw ∼ 7.8 Kokoxili (Tibet) earthquake slip-distribution. Earth Planet. Sci. Lett. 2006, 242, 354–364. [Google Scholar] [CrossRef]
  20. Barisin, I.; Leprince, S.; Parsons, B.; Wright, T. Surface displacements in the September 2005 Afar rifting event from satellite image matching: Asymmetric uplift and faulting. Geophys. Res. Lett. 2009, 36, L07301. [Google Scholar] [CrossRef]
  21. Kääb, A.; Vollmer, M. Surface Geometry, Thickness Changes and Flow Fields on Creeping Mountain Permafrost: Automatic Extraction by Digital Image Analysis. Permafr. Periglac. Process. 2000, 11, 315–326. [Google Scholar] [CrossRef]
  22. Heid, T.; Kääb, A. Evaluation of existing image matching methods for deriving glacier surface displacements globally from optical satellite imagery. Remote Sens. Environ. 2012, 118, 339–355. [Google Scholar] [CrossRef]
  23. Delacourt, C.; Allemand, P.; Casson, B.; Vadon, H. Velocity field of the “La Clapière” landslide measured by the correlation of aerial and QuickBird satellite images. Geophys. Res. Lett. 2004, 31, L15619. [Google Scholar] [CrossRef]
  24. Hermas, E.; Leprince, S.; El-Magd, I.A. Retrieving sand dune movements using sub-pixel correlation of multi-temporal optical remote sensing imagery, northwest Sinai Peninsula, Egypt. Remote Sens. Environ. 2012, 121, 51–60. [Google Scholar] [CrossRef]
  25. Stumpf, A.; Malet, J.P.; Allemand, P.; Ulrich, P. Surface reconstruction and landslide displacement measurements with Pléiades satellite images. ISPRS J. Photogramm. Remote Sens. 2014, 95, 1–12. [Google Scholar] [CrossRef]
  26. Pierrot-Deseilligny, P.; Paparoditis, N. A multiresolution and optimization-based image matching approach: An application to surface reconstruction from SPOT5-HRS stereo imagery. In Proceedings of the ISPRS Workshop on Topographic Mapping from Space (with Special Emphasis on Small Satellites), Ankara, Turquey, 14–16 February 2006; IAPRS: Vienna, Austria, 2006; Volume XXXVI-1/W41. [Google Scholar]
  27. Ayoub, F.; Leprince, S.; Keene, L. User’s Guide to COSI-Corr: Co-Registration of Optically Sensed Images and Correlation; California Institute of Technology: Pasadena, CA, USA, 2009; p. 38. Available online: http://tectonics.caltech.edu/slip_history/spot_coseis/pdf_files/CosiCorr-Guide2015a.pdf (accessed on 27 November 2016).
  28. Leprince, S.; Ayoub, F.; Klinger, Y.; Avouac, J.P. Co-Registration of Optically Sensed Images and Correlation (COSI-Corr): An operational methodology for ground deformation measurements. In Proceedings of the 2007 IEEE International Geoscience and Remote Sensing Symposium, Barcelona, Spain, 23–27 July 2007; pp. 1943–1946.
  29. Leprince, S.; Barbot, S.; Ayoub, F.; Avouac, J.P. Automatic and precise orthorectification, coregistration, and subpixel correlation of satellite images, application to ground deformation measurements. IEEE Trans. Geosci. Remote Sens. 2007, 45, 1529–1558. [Google Scholar] [CrossRef]
  30. Belle, P.; Aunay, B.; Bernardie, S.; Grandjean, G.; Ladouche, B.; Mazué, R.; Join, J.L. The application of an innovative inverse model for understanding and predicting landslide movements (Salazie cirque landslides, Reunion Island). Landslides 2014, 11, 343–355. [Google Scholar] [CrossRef]
  31. Arnaud, N. Les Processus de Démantèlement des Volcans, le cas d’un Volcan Bouclier en Milieu Océanique: Me Piton des Neiges, Ile de la Réunion. Ph.D. Thesis, Université de la Réunion, St Denis de la Réunion, France, 2005. [Google Scholar]
  32. Oehler, J.F.; Lénat, J.F.; Labazuy, P. Growth and collapse of the Reunion Island volcanoes. Bull. Volcanol. 2008, 70, 717–742. [Google Scholar] [CrossRef]
  33. Garnier, C.; Lucas, E. Etude du Glissement de Terrain de Grande Ampleur d’Hell-Bourg, Cirque de Salazie; BRGM, Les mouvements de terrain de grande ampleur dans les cirques et les grandes ravines de la Réunion BRGM/RP-56725-FR; BRGM: Orléans, France, 2008. [Google Scholar]
  34. Lowe, D.G. Distinctive Image Features from Scale-Invariant Keypoints. Int. J. Comput. Vis. 2004, 60, 91–110. [Google Scholar] [CrossRef]
  35. Loncomia, P.; Ruiz-del-Solar, J.; Martinez, L. Object recognition using local invariant feature for robotic applications: A survey. Pattern Recognit. 2016, 60, 499–514. [Google Scholar] [CrossRef]
  36. Pierrot-Deseilligny, M. MicMac, un Logiciel pour la Mise en Correspondance Automatique d’Images dans le Contexte Géographique. 2015. Available online: http://logiciels.ign.fr/IMG/pdf/docmicmac-2.pdf (accessed on 27 November 2016).
  37. Lisein, J.; Pineux, N.; Pierrot-Deseilligny, M.; Degré, A.; Lejeune, P. Détection de l’érosion dans un bassin versant agricole par comparaison d’images multidates acquises par drone. In Proceedings of the Colloque scientifique francophone: Drones et moyens légers aéroportés d’observation, Montpellier, France, 24–26 June 2014.
  38. Delacourt, C.; Raucoules, D.; Le Mouélic, S.; Carnec, C.; Feurer, D.; Allemand, P.; Cruchet, M. Observation of a Large Landslide on La Reunion Island Using Differential Sar Interferometry (JERS and Radarsat) and Correlation of Optical (Spot5 and Aerial) Images. Sensors 2009, 9, 616–630. [Google Scholar] [CrossRef] [PubMed] [Green Version]
Figure 1. (A) Réunion Island in the Indian Ocean; (B) DEM of the study area at a 5 m resolution in the Salazie erosion watershed. The “Mare à Poule d’Eau” landslide is bordered to the north by the “Rivière du Mat”, to the west by the “Bras Sec” gully. The Hell-Bourg plateau dominates the south border of the landslide along a 120 m high cliff; (C) Ortho-rectified SPOT-5 image of the study area at a 2.5 m resolution acquired in 2008. The green line shows the limits of the landslide. The red and turquoise points indicate the position of the ICP (Image Control Points) used to validate the correlation. The DGPS station of Vira is indicated by the yellow star.
Remotesensing 09 00106 g001
Figure 2. (A) N-S position of the Vira DGPS control point in UTM 40 S projection for the two study periods. The displacement is approximately 1.2 m toward the north from January 2004 to May 2005. No data exists before this date. As landslide activity is sensitive to extreme rainfall events and as no such event occurred from 2002 to 2005 in the Salazie circus, the displacement measured during this period is extrapolated to 2002. The total displacement is estimated to be 2.5 m during this period; (B) The displacement was approximately 5 m toward the north between February 2007 and June 2008. This displacement is interpreted as related to the occurrence of the storm “Gamède” that hit Réunion in February 2007. The EW displacement is lower than 1 m/year and not shown here.
Remotesensing 09 00106 g002
Figure 3. South-north shift of the ICP for the two periods of study. The points have been identified on successive images by SIFT [34]. The long axis of the pink rectangles (resp. blue rectangles) are located on the average shift value of the ICP located inside (resp. outside) the landslide. The width of the rectangles is equal to two times the standard deviation. (A) For the 2002–2005 period, the points located in the landslide display shifts similar to the points located out of the landslide. The difference between these shifts is not significant; (B) For the period 2006–2008, the points located in the landslide display a shift distinct from the shift of the points located out of the landslide. A clear signal of displacement is visible.
Remotesensing 09 00106 g003
Figure 4. Maps of east-west and south-north displacements measured by Cosi-Corr and MicMac. The shift between 2002 and 2005 is close to 0 m in both directions. The EW shift between 2006 and 2008 is strongly correlated to the topography (see Figure 1B) and cannot be interpreted as displacement. The south-north shift between 2006 and 2008 is clearly detected by the two methods. It reaches around 10 m toward the north. The results produced by Cosi-Corr are noisier than those produced by MicMac as already noticed by [18].
Remotesensing 09 00106 g004
Figure 5. (A) East-west shift measured by MicMac and draped on the topography of the study area. Positive values toward the east. A strong correlation appears between the slope aspect and the shift for the 2006–2008 period; (B) South-north shift measured by MicMac and draped on the topography of the area. Positive values toward the north. The landslide is clearly visible with a strong shift toward the north for the 2006–2008 period.
Remotesensing 09 00106 g005
Figure 6. South-north (S-N) shifts measured on ICP by SIFT versus south-north shifts measured on the same points by Cosi-Corr (A,B) and MicMac (C,D) for the two periods (A,C for 2002–2005 and B,D for 2006–2008). No correlation is visible for the first period (A,C) between the shifts measured by SIFT and the shifts measured by MicMac and Cosi-Corr. For the 2006–2008 period, the shifts measured by both MicMac and Cosi-Corr are correlated to the shifts measured by SIFT on ICP. The red points are located on the landslide. The linear trend line equations relating the value of S-N shift measured by SIFT (X) to the S-N shift measured by Cosi-Corr or Mic-Mac (Y) and the associated coefficients of determination (R2) are given on (B,D). The coefficients of determination (R2) are low.
Remotesensing 09 00106 g006
Figure 7. North-south shift measured by MicMac vs. shift measured by Cosi-Corr at ICP position for the two studied periods. (A) No correlation is visible for the period 2002–2005; (B) A clear correlation exists for the 2006–2008 period. The red points are those located on the landslide. The linear trend line equation relating S-N shift measured by MicMac (X) to the S-N shift of the same points measured by Cosi-Corr (Y) shows that the results of Cosi-Corr are very similar to the results of MicMac. The associated coefficient of determination (R2) is good.
Remotesensing 09 00106 g007
Table 1. Date of acquisition and incidence angle of the SPOT-5 images.
Date of AcquisitionIncidence Angle
18 October 200224.90°
6 June 200524.95°
26 June 200616.05°
2 May 200817.97°
Table 2. South-north component of the shift measured at the Vira DGPS Station by MicMac, Cosi-Corr and the measure of displacement by DGPS at the same location. The values of Cosi-Corr and MicMac are the average values of shift on a square window of five pixels centered on the DGPS station.
2002–20052006–2008
Cosi-Corr4.57.1
MicMac0.757.8
DGPS>1.2>5

