Article

A MODIS-Based Robust Satellite Technique (RST) for Timely Detection of Oil Spilled Areas

1
Institute of Methodologies for Environmental Analysis (IMAA), National Research Council (CNR), C.da S. Loja, 85050 Tito Scalo (PZ), Italy
2
School of Engineering, University of Basilicata, Via dell’Ateneo Lucano 10, 85100 Potenza, Italy
3
Masdar Institute of Science and Technology, 54224 Masdar City, UAE
*
Author to whom correspondence should be addressed.
Remote Sens. 2017, 9(2), 128; https://doi.org/10.3390/rs9020128
Submission received: 31 October 2016 / Revised: 23 January 2017 / Accepted: 30 January 2017 / Published: 4 February 2017

Abstract

:
Natural crude-oil seepages, together with the oil released into seawater as a consequence of oil exploration/production/transportation activities, and operational discharges from tankers (i.e., oil dumped during cleaning actions) represent the main sources of sea oil pollution. Satellite remote sensing can be a useful tool for the management of such types of marine hazards, namely oil spills, mainly owing to the synoptic view and the good trade-off between spatial and temporal resolution, depending on the specific platform/sensor system used. In this paper, an innovative satellite-based technique for oil spill detection, based on the general robust satellite technique (RST) approach, is presented. It exploits the multi-temporal analysis of data acquired in the visible channels of the Moderate Resolution Imaging Spectroradiometer (MODIS) on board the Aqua satellite in order to automatically and quickly detect the presence of oil spills on the sea surface, with an attempt to minimize “false detections” caused by spurious effects associated with, for instance, cloud edges, sun/satellite geometries, sea currents, etc. The oil spill event that occurred in June 2007 off the south coast of Cyprus in the Mediterranean Sea has been considered as a test case. The resulting data, the reliability of which has been evaluated by both carrying out a confutation analysis and comparing them with those provided by the application of another independent MODIS-based method, showcase the potential of RST in identifying the presence of oil with a high level of accuracy.

Graphical Abstract

1. Introduction

Oil spills cause the contamination of seawater, shores, and beaches, which may persist for several months, representing a serious hazard for marine resources and the ecosystem [1]. Besides natural crude-oil seeps, the biggest contribution to this type of sea pollution comes from tanker operative discharge that spreads in the sea, equivalent to one full tanker disaster every week [2,3].
Satellite remote sensing might effectively contribute to mitigating the environmental impact of oil spills, provided that reliable and effective detection techniques are used, and relevant information and products may be quickly delivered and shared. The large number of satellite data used and methodologies implemented/developed during the Deepwater Horizon spill event affecting the Gulf of Mexico in April–May 2010 have been a clear representation of the importance of using satellite remote sensing in response to oil spills [4,5].
Synthetic Aperture Radar (SAR) currently represents the most widely used satellite system for oil spill detection, due to its capability to identify oil spills with a good level of reliability and high spatial resolution (from tens of meters up to 1 m) with all-weather and all-day detection [6,7,8,9,10,11,12,13]. Unfortunately, besides the relatively high cost and a non-negligible rate of false alarms due to the variation of wind conditions, the presence of look-alikes, etc., the main limitation of SAR systems within an operational continuous monitoring system is represented by their low revisiting time, ranging from several days to dozens of days at mid-latitudes [13,14,15,16]. Even the full implementation of the COSMO-SkyMed satellite mission (an Italian mission with both military and civilian purposes) with four X-band SAR satellites in constellation [17] failed to guarantee an observation frequency suitable for operational surveillance activities. Some issues related to military restrictions, data distribution and access policies have, indeed, reduced their actual use for limited time and/or areas [18]. Neither is the full deployment of the Copernicus ESA Sentinel-1 mission [19], finalized in April 2016 with the launch of the second satellite (i.e., Sentinel 1B), able to assure a temporal resolution better than three days at the equator.
In this context, passive instruments working in the optical band (visible and infrared) aboard weather satellites may be a viable alternative or at least a complement to SAR-based techniques [5]. Despite their lower spatial resolutions (from 30 m to 3 km) with respect to SAR, they show temporal resolutions (from 6 h of polar satellites to 5 min of geostationary ones) and coverage continuity that is more suitable for real-time monitoring of those areas exposed to oil pollution risk. Obviously, such data, which are freely available and easily accessible on the Internet, must be processed using automated methods of analysis able to ensure both adequate response times with respect to the observation frequency and reliable results regardless of the considered areas or sensors [20].
Several techniques have already been proposed for oil spill detection and monitoring using satellite data acquired in the optical band [21,22,23,24,25,26,27,28,29,30,31,32,33,34]. Most of them are based on the analysis of satellite radiances acquired in the middle (MIR) and thermal (TIR) infrared spectral regions where the contrast between the emittance of the oil-polluted area and the surrounding clean seawater is more appreciable. Due to the thermal inertia of oil, which is lower than seawater, oil-polluted areas usually have the opposite behavior compared with the surrounding oil-free seawater, with higher brightness temperatures in TIR images collected in daytime and lower brightness temperatures during the nighttime [35,36]. Also in the visible (VIS) and near-infrared (NIR) regions of the electromagnetic spectrum it is possible to detect the presence of an oil layer on the sea surface thanks to the different reflectance of the two elements [22,33,37,38,39,40,41,42]. The main limits of these methodologies are related to their applicability only to particular geometries of observation [32], and their poor level of automation due to the need for several interventions of an operator (e.g., region of interest identification and visual recognition) [33,43,44,45].
Among the methodologies working in the optical band, the one specifically applied to oil detection based on the general robust satellite technique (RST), named RST-OIL [20,26,27], has already been successfully applied to Advanced Very High Resolution Radiometer (AVHRR) and Moderate Resolution Imaging Spectroradiometer (MODIS) TIR data [20,27], showing excellent performances with a high level of reliability (no false alarm). In this work, the same approach has been extended to MODIS visible bands to exploit their higher spatial resolution (250 m) than the thermal channel (1 km) to improve the detection sensitivity towards small spills such as in the wakes of ships or illicit vessel discharge. Such a better spatial resolution combined with a high revisit frequency may offer frequent and detailed mapping of oil-affected areas. The oil spill event studied in this paper is an illicit vessel discharge from 18 June 2007 off the south coast of Cyprus, reported by the European Maritime Safety Agency (EMSA) [46], which was undetectable by RST-OIL due to the non-adequate spatial resolution of the MODIS TIR data used for this event. The area affected by the event is shown in Figure 1, together with a Radarsat image collected on the same day. Three clear, elongated dark areas are recognizable (green ellipses in Figure 1) and seem to be connected, indicating the movement of a vessel along a triangular path. Several dark areas with a non-uniform shape are also present in the northern part of the scene, close to the Cyprus coastline, probably due to the sea current, representing a typical example of SAR look-alikes.

2. Materials and Methods

The RST approach is an automatic change-detection scheme, which has already been applied with good accuracy in monitoring different natural and environmental hazards (see [47] and references herein). It is based on the use of historical series of satellite data for a complete signal characterization (spectral, spatial and temporal) followed by an anomaly detection step using automatically-generated local (i.e., for a specific time and place of observation) thresholds. In its application to oil spill detection, namely RST-OIL, TIR data acquired by AVHRR or MODIS have been used to detect different oil spills occurred in different areas in the past [20,26,27]. In this paper, we use MODIS 250 m spatial resolution optical data for the detection and the monitoring of oil spills. MODIS channel 1 acquires information in the 620–670 nm spectral range (VIS), while MODIS channel 2 within 841–876 nm (NIR).
In one of the first studies based on visible data [35], the oil spill reflectance in the spectral range of MODIS channels 1 and 2 was found to be greater than the seawater reflectance, but not enough to permit an easy distinction under natural irradiation. More recent studies on optical models [37,38,40,42] demonstrated that the acquisition angle, combined with a particular irradiation geometry, may enhance the reflectance contrast between oil and the surrounding water [13,22,25,32]. One of the main problems related to the use of visible bands for detecting oil spills is that the signal reflected by the oil film is not unique but it may change depending on several factors (and on their mutual combinations) such as sun/satellite geometry and sea surface roughness. As a consequence, oil spill can appear, in VIS and NIR bands, less or more reflecting than seawater [37,38,40,42]. It is referred to as a “positive” contrast when the reflectance of oil spill is higher than that of the clear seawater and as a “negative” one when the reflectance of oil spill is less than that of the clear seawater. In detail, when sea surface is flat, the contrast between oil and sea surface is always negative since the oil produce a reflectance decrease; on the other hand, roughness of the sea surface produces a positive contrast [37]. Concerning sun/satellite geometry, when observing the surface from the vertical direction, even a small surface roughness results always in a positive contrast value: the contrast is most pronounced when the observer sees the oil slick close to the sun reflection (positive contrast) and when the slick is observed at a low angle, almost horizontally (negative contrast) [37].
Starting from previous considerations on oil spill spectral signatures, we applied the RST methodology to MODIS data. In order to identify the “signal anomaly” caused by the presence of oil on the clear seawater surface, two indices were computed (one for each MODIS channel x), as follows:
ρ x ( x , y , t ) = ρ x ( x , y , t ) μ ρ x ( x , y ) σ ρ x ( x , y )
where ρx (x,y,t) is the reflectance (expressed in terms of Rayleigh-corrected reflectance - Rrc) measured in the MODIS channel x (i.e., 1 or 2) at the pixel (x,y) at time (t). Further, μρx(x,y) and σρx(x,y) are the corresponding reference fields (temporal average and standard deviation, respectively) computed by analysing a long-term data set of cloud-free satellite records collected at location (x,y) in the same observational conditions (the same month of the year and the same time of acquisition) of the image under investigation. Flowchart depicted in Figure 2 provides a summary of the different steps implemented to produce the reference fields. Firstly, all the available MODIS-Aqua images of the month of June (from 2002 to 2010) acquired over the area affected by the event in the 9–12 p.m. GMT temporal range were collected. In detail, about 250 MODIS-Aqua data (level 0), downloaded from NASA ocean color web site [48], were converted to calibrated radiances using SeaDAS V7.3. It is worth nothing that the number of the investigated images (i.e., 250) is higher than the one found as minimum value (i.e., 80) to be representative of the investigated long-term time-series signal by an independent study applied on RST approach [49]. Then Rrc data were derived for MODIS bands 1–2 and mapped to a WGS84 Lat/Long projection, producing a subset sized 800 × 800 and centred at 34°N 32.5°E (e.g., Figure 3) for each pass. Secondly, starting from this long-term Rrc series, temporal average (μρx(x,y)) and standard deviation (σρx(x,y)) reference fields were computed at a pixel level over this area for MODIS channels 1 and 2. Before finalizing such a procedure, a cloud screening test was applied to discharge any cloudy-affected pixel. Cloud-free satellite records were selected by implementing the One-channel Cloud-detection Approach (OCA) [50,51] using, within an RST-based scheme, the combination of the signal measured in MODIS channels 1 and 32 (11.770–12.270 µm) at a spatial resolution of 1 km and then downscaled to 250 m. In detail, pixels showing at the same time statistically high reflectance values “AND” (i.e., as a logical operator) low brightness temperatures were considered as cloudy affected. Furthermore, a iterative procedure was implemented at a pixel level to remove possible outliers (known or not) from the investigated series [52]. At the end of this phase, four reference fields (one temporal mean + one standard deviation x two channels) were produced for the month of June. Among them, μρx(x,y) represents the expected value (i.e., in unperturbed conditions) at pixel level of the investigated signal, while σρx(x,y) describes its natural variability (i.e., the statistical dispersion of the data set values around the mean). Hence ⊗ρx(x,y,t), as computed in Equation (1), is a measure of how much the signal deviates from its normal behaviour taking also into account its variability. Such an index is, for construction, a standardized variable which should show a Gaussian behavior (i.e., mean = 0 and standard deviation = 1). Therefore, the higher the absolute value measured, the lower the probability of occurrence. Namely, the probability decreases from about 2.5% for |⊗ρx| > 2 to 1.5% for |⊗ρx| > 3, and even lower values for increasing |⊗ρx| values [53] in case of a perfect Gaussian distribution. Therefore, in the presence of oil, which should represent a perturbation of the normal seawater condition, such an index will show high positive values in case of a positive contrast and the opposite (i.e., high negative) in case of a negative one.

3. Results and Discussion

3.1. RST Implementation

On the day of the event, 18 June 2007, the first MODIS image available for the area affected was the Terra one acquired at 9:15 a.m. GMT. The corresponding red-green-blue (RGB) image (Figure 3) was generated using the georeferenced Rrc at 645 (R), 555 (G), and 469 (B) nm produced for such MODIS-Terra data.
Unfortunately, the whole area affected by the event was covered by clouds, masking the sea surface and preventing a reliable analysis. Owing to the high revisiting time offered by sensors aboard weather satellites such as MODIS, the same area was sampled by Aqua at 10:50 a.m. GMT as shown in Figure 4 (with the same RGB combination of the previous figure).
In this image, thanks to the different conditions of the observation in terms of sun-satellite geometry and atmosphere contribution from the previous Terra acquisition, very few elongated areas characterized by a positive contrast are clearly evident, approximately at the same positions of the oil spill reported by EMSA (green ellipses in Figure 4). Some clouds are also present, more evident in the northwest corner of the image. By making a spatial profile on the related MODIS Rrc channel 1 and 2 images (depicted in grey tones in Figure 5a,b) in correspondence to the area within one of the green ellipses (Z-Z’ blue transect in Figure 5a,b), an increase of the reflectance is visible (Figure 5c), which reaches values higher than the one produced by the very low, thin stratocumulus (signal with a high frequency variability in the right part of the graph). The increase in reflectance is really relevant, up to 0.1%, which is very high for clean seawater.
The signal behavior shown in Figure 5c suggests that the indices presented in this work (cf. Equation (1)) should exhibit very high positive values in correspondence to the areas with such a high increase in reflectance. The outputs produced by the implementation of the two indices are plotted in Figure 6. In detail, in these images, the Rrc channel 1 (or 2) signal is plotted in the background in grey tones, while only the pixels characterized by the highest ⊗ρx values have been highlighted in blue. Such a strategy has to be preferred in the detection phase because it allows undeniably identifying the presence of oil-affected areas.
These areas were identified by the proposed approach when using the signal measured in MODIS channel l with a very high signal-to-noise (S/N) ratio value, namely higher than 26 (Figure 6a). Considering Equation (1), this means that the deviation of the signal observed at the pixel level with respect to the temporal mean is (at least) 26 times higher than the historically observed local variability, namely the standard deviation signal previously computed. In detail, four anomalous pixels were detected as certainly polluted by oil in the total absence of false alarms. The presence of the oil spill was detected by RST with a higher S/N value (⊗ch2 > 49) at channel 2 than at channel 1 (Figure 6b). The higher signal absorption by water in the NIR than in the VIS regions explains this difference, enhancing the contrast between reflecting bodies and the surrounding seawater. Also, in this case, the unique oil spill–affected pixel (commonly identified by the VIS approach) was detected in the total absence of false alarms.
Once the presence of the oil spill is detected for certain, the “adjustability” (tunability) of the RST technique allows us to map the intensity and the structure of the detected anomalies in detail (Figure 7). By implementing a recursive buffer around these areas, indeed, the full structure of the oil slick can be identified by both indices. In detail, starting from the pixel with the highest anomalous value (H), an ad hoc implemented tool detects as anomalous all those pixels showing a S/N value within the “H–5” range in a 5 × 5 mobile window. Focusing on the area where the oil spill was detected, several different ranges of confidence levels were identified. The lowest range (in green) corresponds to pixels where the oil is less present or thinner, while, with the increase of the confidence levels, the oil presence and thickness should grow.
To better summarize the achieved results, Table 1 reports the number of the pixels identified as anomalous at each of the confidence levels for the two channels. Considering the 250 m spatial resolution of the used data, an area of at least 63 km2 was recognized as anomalous, which, speculating an average oil thickness of 1 μm [5], corresponds to about 63 m3 of oil.
The same analysis was performed for the MODIS image acquired the following day (not shown) without finding any anomalous pixels. Weathering effects, as well as the presence of clouds, limited the capability to further detect the presence of the oil spill.

3.2. Confutation Analysis

To assess RST performances in the case of normal seawater conditions (i.e., unperturbed by the presence of an oil spill), a falsification analysis was carried out to verify that, in such conditions, no “false positive” values were detected. To this aim, we first looked for the information available in the main oil spill catalogues available online (e.g., EMSA and the Centre of Documentation, Research and Experimentation on Accidental Water Pollution (CEDRE) web sites [54,55]), finding that no other event affected the investigated area during June 2007. Then we applied the indices of Equation (1) to the approximately 30 MODIS-Aqua images available for this period. In Figure 8, an example of the obtained results is reported for two representative MODIS-Aqua images, one acquired before and the other after the event, respectively, on 03 June 2007 at 11:33 a.m. GMT (Figure 8a,b) and 22 June 2007 at 10:25 a.m. GMT (Figure 8c,d). For both images and channels, no ⊗chx values higher than three were found. Similar results were found for the whole dataset of June 2007, indicating the ability and the robustness of the RST approach to detect only pixels affected by the anomalous presence of the oil spill.
Such a result encourages the implementation of operational RST-based products that might furnish an estimation of the amount of oil spilled in a specific area, which could be crucial information for those regions affected by heavy oil-tanker traffic.

3.3. Discussion

Timely identification of oil spill events can be fundamental for reducing their environmental impacts, implementing adequate countermeasures and providing detailed information about their evolution in the spatiotemporal domain [56]. Weather satellites, usually working in a constellation, can provide the revisiting time useful for such kinds of applications. Considering that, in the oil spill detection context, these satellites acquire information in the optical band, it is worth noting that the main limiting factor is represented by clouds, which can completely mask the sea surface, hampering any kind of detection. Other issues derive from the usual low level of difference, in terms of radiance reflected or emitted, between the oil-contaminated area and the surrounding oil-free water, which deserves the implementation of very sensitive methods. The results presented in this work seem to indicate that RST can be confidently used for first detecting for certain the presence of a spill, and then mapping its structure. It should be stressed here that a fundamental requirement of a RST near-real-time implementation is the availability of adequate reference fields for a specific area of interest that, as previously mentioned, relies on the availability of a historical dataset of satellite images larger, at least, than 80 records collected for the same month over different years [49,52].
To further assess the accuracy of the achieved results, the event image (Figure 4) was analyzed implementing the Floating Algae Index (FAI) following guidelines indicated by [33]. FAI was calculated using Rrc at 645, 859, and 1240 nm [57]. These wave bands in the red and infrared regions are less sensitive to atmospheric effect and the presence of colored, dissolved organic matter (CDOM). The corresponding FAI map (Figure 9) generally indicated higher values in the oil-contaminated areas than in adjacent oil-free areas. It is also worth noting that at the edge of the wind-driven feather of oil slicks, the FAI in the oiled water was lower than in the non-oiled water. This phenomenon could be related to the thickness of the oil slicks. Thin oil sheens indicated low FAI values as demonstrated by [33], while thick oil slicks forming mats floated on the surface and indicated high FAI values. Rrc spectra (data not shown) over the contaminated areas did not show chlorophyll-a fluorescence peaks in the red region which can be clearly distinguished when algal blooms happen. This corroborates that algal blooms can be ruled out of the causes of high FAI values shown in Figure 9. On the other hand, it can be seen that the FAI over land is much higher than over water with values generally >0.02, and areas with FAI < 0 are due to water such as reservoirs. A general good agreement exists between the FAI map and the results provided by RST, indicating the potential of the latter in giving reliable results. It should also be pointed out that the texture of oil spills is different from that of algal blooms. However, these two phenomena are, to some extent, related. Oil can kill snails and other algae grazers, which is then favorable for a period of unimpeded phytoplankton growth [58]. The algal bloom in 2010 in the Gulf of Mexico after the Deepwater Horizon oil spill is one of the examples across the world [59].

4. Conclusions

Exploiting the intrinsic exportability of the RST approach to any satellite data, in this paper we applied it to MODIS records for the detection and the mapping of oil spills. In particular, higher-spatial-resolution MODIS data (250 m) in the first two channels have been used. The results obtained show, also in comparison with those achieved by implementing another MODIS-based independent method, the feasibility of such an attempt. Anomalies with a very high level of confidence were detected using both data acquired in MODIS channels 1 and 2 in correspondence to a positive contrast between the reflectance of the oil spill and seawater. Such a feature allows us to map the oil slick extension and structure (i.e., the relative thickness) accurately. In addition, the reliability of the proposed approach was further assessed by means of a confutation analysis, which indicated the absence of any “false”-positive anomalous signal when no oil spill was likely to be present. Although further studies on additional events and under several observational conditions must be carried out to better evaluate its actual potential, even in the presence of in situ data which could allow its full assessment, especially concerning its mapping capability, these first outcomes encourage us to continue the research in this field. In particular, the generation of operational and reliable products may represent a useful tool especially for heavy oil-tanker traffic areas to evaluate the amount of oil spilled in such regions, provided that information about slick thickness is also available. Besides, concerning possible future methodological developments, using atmospherically corrected radiances instead of Rrc might improve the accuracy of the achieved results for specific local conditions, but with a decrease in the comparability of the achieved results among different geographical areas.
In the future, MODIS data could be coupled with those provided by other sensors, such as the Operational Land Imager (OLI) and the Thermal Infrared Sensor (TIS) aboard Landsat 8, the Visible Infrared Imaging Radiometer Suite (VIIRS) aboard Suomi-NPP, as well as the Multi Spectral Imager (MSI) on the Sentinel-2 satellites and the two sensors aboard the Sentinel-3 satellites (i.e., the Ocean and Land Colour Instrument (OLCI) and the Sea and Land Surface Temperature Radiometer (SLSTR)). These data, offering higher performances in terms of spatial and spectral resolutions than MODIS, will help in further improving the overall relevance of the achieved results. Furthermore, the integration with SAR data will allow the implementation of a multi-sensor system, which, exploiting the specific advantages of each single technology, will be able to guarantee a near-real-time sea monitoring system useful in helping the local authorities with the timely management of oil spill risks.

Acknowledgments

This work was carried out in the framework of the OP European Regional Development Fund (ERDF) Basilicata Region 2007–2013 IOnian Sea water quality MOnitoring by Satellite data (IOSMOS) project, and the OP European Social Fund (ESF) Basilicata Region 2007–2013 MOnitoraggio delle acque del mar MEDiterraneo mediante DAti Satellitari (MOMEDAS) project. We would like to thank the NASA OBPG group for providing the MODIS data used in this study.

Author Contributions

Teodosio Lacava, Caterina S.L. Grimaldi and Valeria Satriano wrote the majority of the paper. Teodosio Lacava, Caterina S.L. Grimaldi and Irina Coviello implemented RST for oil spill detection on MODIS data. Marouane Temimi and Jun Zhao contributed to the analysis of the achieved results. Emanuele Ciancia, Carmine Di Polito and Valeria Satriano contributed to the data analysis. Valerio Tramutoli and Nicola Pergola designed the algorithm.

Conflicts of Interest

The authors declare no conflict of interest.

References

  1. Kostianoy, A.; Litovchenko, K.; Lavrova, O.; Mityagina, M.; Bocharova, T.; Lebedev, S.; Stanichny, S.; Soloviev, D.; Sirota, A.; Pichuzhkina, O. Operational Satellite Monitoring of Oil Spill Pollution in the Southeastern Baltic Sea: 18 Months Experience. Environ. Res. Eng. Manag. 2006, 4, 70–77. [Google Scholar]
  2. Kvenvolden, K.A.; Cooper, C.K. Natural seepage of crude oil into the marine environment. Geo Mar. Lett. 2003, 23, 140–146. [Google Scholar] [CrossRef]
  3. Maribus. World Ocean Review, 2010. Available online: http://worldoceanreview.com/wp-content/downloads/wor1/WOR1_english.pdf (accessed on 28 November 2016).
  4. Liu, Y.; MacFadyen, A.; Ji, Z.G.; Weisberg, R.H. (Eds.) Monitoring and Modeling the Deepwater Horizon Oil Spill: A Record-Breaking Enterprise; Geophysical Monograph Series; AGU: Washington, DC, USA, 2011; Volume 195, p. 271.
  5. Leifer, I.; Lehr, W.J.; Simecek-Beatty, D.; Bradley, E.; Clark, R.; Dennison, P.; Huf, Y.; Mathesone, S.; Jones, C.E.; Holtg, B.; et al. State of the art satellite and airborne marine oil spill remote sensing: Application to the BP Deepwater Horizon oil spill. Remote Sens. Environ. 2012, 124, 185–209. [Google Scholar] [CrossRef]
  6. Pavlakis, P.; Sieber, A.; Alexandry, S. Monitoring oil-spill pollution in the Mediterranean with ERS SAR. Oceanogr. Lit. Rev. 1997, 9, 1067. [Google Scholar]
  7. Fiscella, B.; Giancaspro, A.; Nirchio, F.; Pavese, P.; Trivero, P. Oil spill detection using marine SAR images. Int. J. Remote Sens. 2000, 21, 3561–3566. [Google Scholar] [CrossRef]
  8. Miranda, F.P.; Marmol, A.M.Q.; Pedroso, E.C.; Beisl, C.H.; Welgan, P.; Morales, L.M. Analysis of RADARSAT-1 data for offshore monitoring activities in the Cantarell Complex, Gulf of Mexico, using the unsupervised semivariogram textural classifier (USTC). Can. J. Remote Sens. 2004, 30, 424–436. [Google Scholar] [CrossRef]
  9. Brekke, C.; Solberg, A.H.S. Review on Oil spill detection by satellite remote sensing. Remote Sens. Environ. 2005, 95, 1–13. [Google Scholar] [CrossRef]
  10. Ferraro, G.; Bernardini, A.; David, M.; Meyer-Roux, S.; Muellenhoff, O.; Perkovic, M.; Tarchi, D.; Topouzelis, K. Towards an operational use of space imagery for oil pollution monitoring in the Mediterranean basin: A demonstration in the Adriatic Sea. Mar. Pollut. Bull. 2007, 54, 403–422. [Google Scholar] [CrossRef] [PubMed]
  11. Akkartal, A.; Sunar, F. The usage of RADAR images in oil spill detection. Int. Arch. Photogramm. Remote Sens. Spat. Inf. Sci. 2008, 37, 271–277. [Google Scholar]
  12. Marghany, M. Utilization of a genetic algorithm for the automatic detection of oil spill from RADARSAT-2 SAR satellite data. Mar. Pollut. Bull. 2014, 89, 20–29. [Google Scholar] [CrossRef] [PubMed]
  13. Fingas, M.; Brown, C. Review of oil spill remote sensing. Mar. Pollut. Bull. 2014, 83, 9–23. [Google Scholar] [CrossRef] [PubMed]
  14. Chust, G.; Sagarminaga, Y. The multi-angle view of MISR detects oil slicks under sun glitter conditions. Remote Sens. Environ. 2007, 107, 232–239. [Google Scholar] [CrossRef]
  15. Feng, J.; Chen, H.; Bi, F.; Li, J.; Wei, H. Detection of oil spills in a complex scene of SAR imagery. Sci. China Technol. Sci. 2014, 57, 2204–2209. [Google Scholar] [CrossRef]
  16. Trivero, P.; Adamo, M.; Biamino, W.; Borasi, M.; Cavagnero, M.; De Carolis, G.; Di Matteo, L.; Fontebasso, F.; Nirchio, F.; Tataranni, F. Automatic oil slick detection from SAR images: Results and improvements in the framework of the PRIMI pilot project. Deep Sea Res. Part II Top. Stud. Oceanogr. 2016, 133, 146–158. [Google Scholar] [CrossRef]
  17. Agenzia Spaziale Italiana. COSMO-SkyMed. System Description & User Guide. Available online: http://www.asi.it/en/activity/observation-earth/cosmo-skymed (accessed on 28 November 2016).
  18. Nirchio, F.; Pandiscia, G.; Ruggieri, G.; Santoleri, R.; Tataranni, F.; Giancaspro, A.; Trivero, P.; Pinardi, N.; Masini, A.; Castellani, C. COSMO-SkyMed contribution in oil spill monitoring of the Mediterranean Sea. In Proceedings of the 2009 IEEE International Geoscience and Remote Sensing Symposium, Cape Town, South Africa, 12–17 July 2009; pp. II-781–II-784.
  19. Copernicus. Space Technology Reveals Where Oil Pollutes the Oceans; ESA Web Publication, Issue 21. 2013. Available online: www.copernicus.eu/sites/default/files/documents/Copernicus_Briefs/Copernicus_Brief_Issue21_OilSpill_Sep2013.pdf (accessed on 28 November 2016).
  20. Grimaldi, C.S.L.; Casciello, D.; Coviello, I.; Lacava, T.; Pergola, N.; Tramutoli, V. An improved RST approach for timely alert and Near Real Time monitoring of oil spill disasters by using AVHRR data. Nat. Hazard. Earth Syst. Sci. 2011, 11, 1281–1291. [Google Scholar] [CrossRef]
  21. Cross, A.M. Monitoring marine oil pollution using AVHRR data: observation off coast of Kuwait and Saudi Arabia during January 1991. Int. J. Remote Sens. 1992, 13, 781–788. [Google Scholar] [CrossRef]
  22. Hu, C.; Müller-Krager, F.E.; Taylor, C.J.; Myhre, D.; Murch, B.; Odriozola, A.L.; Godoy, G. MODIS detects oil spills in Lake Maracaibo, Venezuela. EOS Trans. AGU 2003, 84, 313–319. [Google Scholar] [CrossRef]
  23. Howari, F.M. Investigation of hydrocarbon pollution in the vicinity of United Arab Emirates coasts using visible and near infrared remote sensing data. J. Coast. Res. 2004, 20, 1089–1095. [Google Scholar] [CrossRef]
  24. Shi, L.; Zhang, X.; Seielstand, G.; Zhao, C.; He, M. Oil spill detection by MODIS images using Fuzzy Cluster and Texture Feature Extraction. In Proceedings of the IEEE OCEANS-2007-Europe, Scotland, UK, 18–21 June 2007.
  25. Dessì, F.; Melis, M.T.; Naitza, L.; Marini, A. MODIS data processing for coastal and marine environment monitoring: A study on anomaly detection and evolution in gulf of Cagliari (Sardinia-Italy). Int. Arch. Photogramm. Remote Sens. Spat. Inf. Sci. 2008, XXXVII Pt B8, 695–698. [Google Scholar]
  26. Casciello, D.; Lacava, T.; Pergola, N.; Tramutoli, V. Robust Satellite Techniques for oil spill detection and monitoring using AVHRR thermal infrared bands. Int. J. Remote Sens. 2011, 32, 4107–4129. [Google Scholar] [CrossRef]
  27. Grimaldi, C.S.L.; Coviello, I.; Lacava, T.; Pergola, N.; Tramutoli, V. A new RST-based approach for continuous oil spill detection in TIR range: The case of the Deepwater Horizon platform in the Gulf of Mexico. In Monitoring and Modeling the Deepwater Horizon Oil Spill: A Record-Breaking Enterprise, Geophysical Monograph Series; Liu, Y., MacFadyen, A., Ji, Z.G., Weisberg, R.H., Eds.; American Geophysical Union (AGU): Washington, DC, USA, 2011; pp. 19–31. [Google Scholar]
  28. Etellisi, E.A.; Deng, Y. Oil spill detection: Imaging system modeling and advanced image processing using optimized SDC algorithm. Signal Image Video Process. 2014, 8, 1405–1419. [Google Scholar] [CrossRef]
  29. Maianti, P.; Rusmini, M.; Tortini, R.; Dalla Via, G.; Frassy, F.; Marchesi, A.; Rota Nodari, F.; Gianinetto, M. Monitoring large oil slick dynamics with moderate resolution multispectral satellite data. Nat. Hazards 2014, 73, 473–492. [Google Scholar] [CrossRef]
  30. Zhao, J.; Temimi, M.; Ghedira, H.; Hu, C. Exploring the potential of optical remote sensing for oil spill detection in shallow coastal waters—A case study in the Arabian Gulf. Opt. Exp. 2014, 22, 13755–13772. [Google Scholar] [CrossRef] [PubMed]
  31. Laneve, G.; Luciani, R. Developing a satellite optical sensor based automatic system for detecting and monitoring oil spills. In Proceedings of 2015 IEEE 15th International Conference on Environment and Electrical Engineering, Rome, Italy, 10–13 June 2015; pp. 1653–1658.
  32. Pisano, A.; Bignami, F.; Santoleri, R. Oil spill detection in glint-contaminated near-infrared MODIS imagery. Remote Sens. 2015, 7, 1112–1134. [Google Scholar] [CrossRef]
  33. Zhao, J.; Temimi, M.; Al Azhar, M.; Ghedira, H. Satellite-based tracking of oil pollution in the Arabian Gulf and the Sea of Oman. Can. J. Remote Sens. 2015, 41, 113–125. [Google Scholar] [CrossRef]
  34. Pisano, A.; De Dominicis, M.; Biamino, W.; Bignami, F.; Gherardi, S.; Colao, F.; Coppini, G.; Marullo, S.; Sprovieri, M.; Trivero, P.; Zambianchi, E.; Santoleri, R. An oceanographic survey for oil spill monitoring and model forecasting validation using remote sensing and in situ data in the Mediterranean Sea. Deep Sea Res. Part II Top. Stud. Oceanogr. 2016, 133, 132–145. [Google Scholar] [CrossRef]
  35. Fingas, M.F.; Brown, C.E. Remote sensing of oil spills. Sea Tech. 1997, 38, 37–46. [Google Scholar]
  36. Fingas, M.F.; Brown, C.E. A review of the status of advanced technologies for the detection of oil in and with ice. Spill Sci. Technol. Bull. 2000, 6, 295–302. [Google Scholar] [CrossRef]
  37. Otremba, Z.; Piskozub, J. Modelling of the optical contrast of an oil film on a sea surface. Opt. Exp. 2001, 9, 411–416. [Google Scholar] [CrossRef]
  38. Otremba, Z.; Piskozub, J. Modelling the remotely sensed optical contrast caused by oil suspended in the sea water column. Opt. Exp. 2003, 11, 2–6. [Google Scholar] [CrossRef]
  39. Xiao, K.; Xu, H. Detection of oil spill in Mexico Gulf based on MODIS data. In Proceedings of 2010 International Conference on IEEE Multimedia Technology, Ningbo, China, 29–31 October 2010; pp. 1–4.
  40. Haule, K.; Freda, W.; Darecki, M.; Toczek, H. Possibilities of optical remote sensing of dispersed oil in coastal waters. Estuar. Coast. Shelf Sci. 2016. [Google Scholar] [CrossRef]
  41. Otremba, Z. Oil droplet clouds suspended in the sea: Can they be remotely detected? Remote Sens. 2016, 8, 857. [Google Scholar] [CrossRef]
  42. Baszanowska, E.; Otremba, Z. Modification of optical properties of seawater exposed to oil contaminants based on excitation-emission spectra. JEOS:RP 2015, 10. [Google Scholar] [CrossRef]
  43. Lotliker, A.A.; Mupparthy, R.S.; Tummala, S.K.; Nayak, S.R. Evaluation of high resolution MODIS-Aqua data for oil spill monitoring. Proc. SPIE 2008, 7150. [Google Scholar] [CrossRef]
  44. Bradford, B.N.; Sanchez-Reyes, P.J. Automated oil spill detection with multispectral imagery. Proc. SPIE 2011, 8030. [Google Scholar] [CrossRef]
  45. Cococcioni, M.; Corucci, L.; Masini, A.; Nardelli, F. SVME: An ensemble of support vector machines for detecting oil spills from full resolution MODIS images. Ocean Dyn. 2012, 62, 449–467. [Google Scholar] [CrossRef]
  46. EMSA 2010, European Maritime Safety Agency Pollution Preparedness and Response Activities. 2010. Available online: http://www.emsa.europa.eu/emsa-documents/latest/download/1027/617/23.html (accessed on 28 November 2016).
  47. Tramutoli, V. Robust Satellite Techniques (RST) for Natural and Environmental Hazards Monitoring and Mitigation: Theory and Applications. In Proceedings of IEEE Fourth International Workshop on the Analysis of Multitemporal Remote Sensing Images, Leuven, Belgium, 18–20 July 2007; pp. 1–6.
  48. Nasa’s Ocean Color Web. Available online: http://oceancolor.gsfc.nasa.gov/cms/ (accessed on 28 November 2016).
  49. Koeppen, W.C.; Pilger, E.; Wright, R. Time series analysis of infrared satellite data for detecting thermal anomalies: A hybrid approach. Bull. Volcanol. 2011, 73, 577–593. [Google Scholar] [CrossRef]
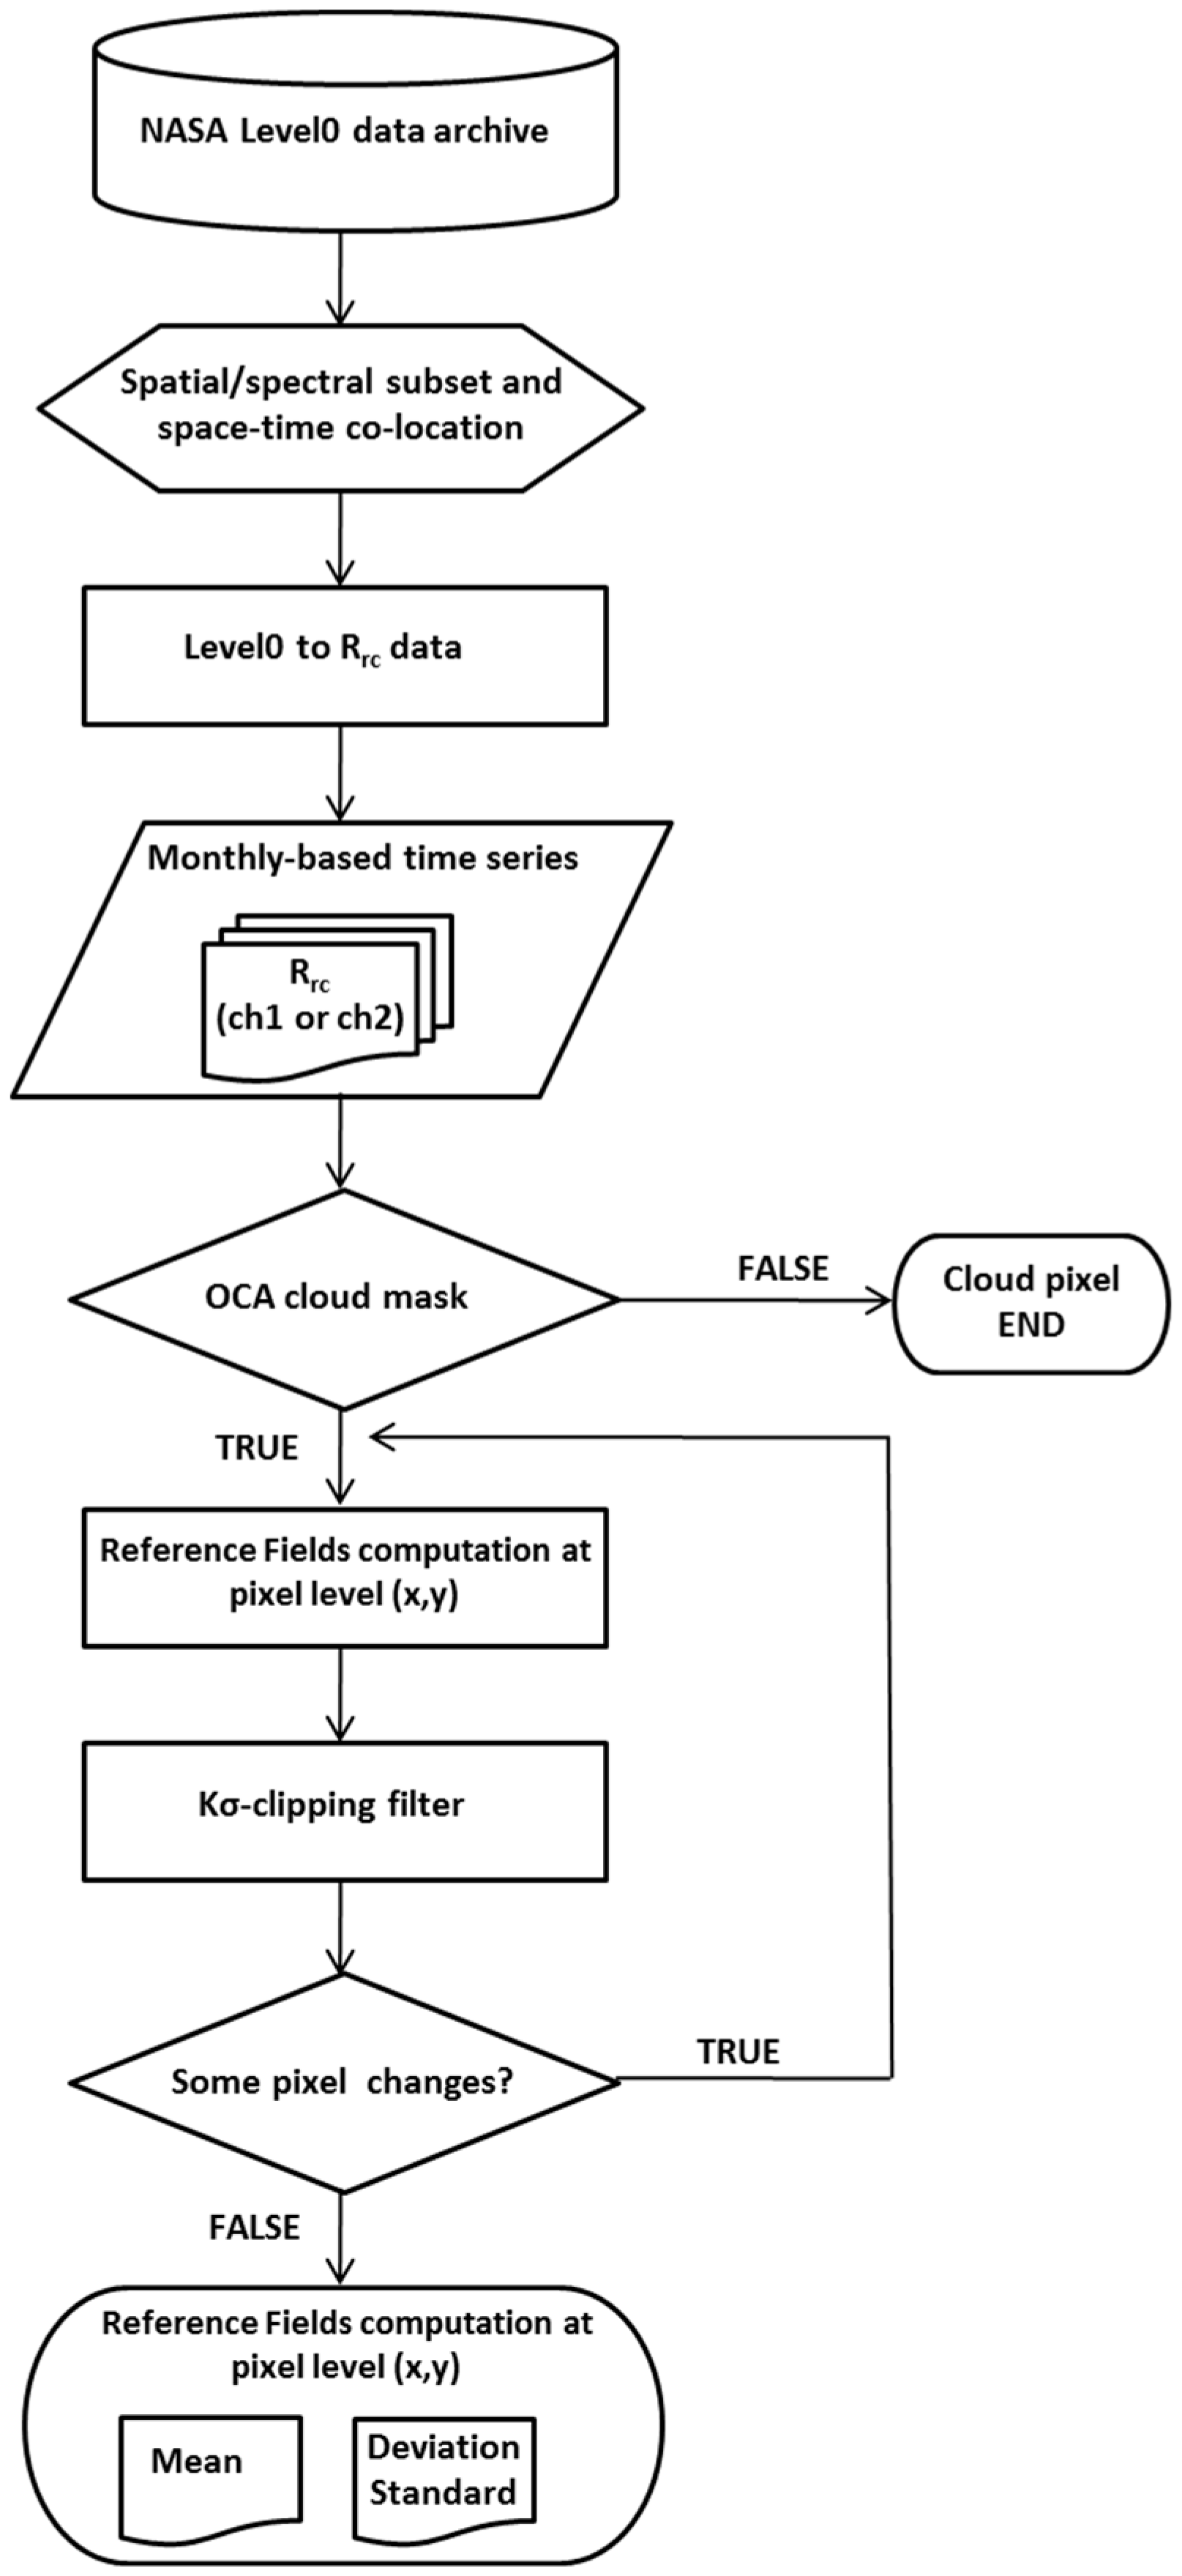
  50. Pietrapertosa, C.; Pergola, N.; Lanorte, V.; Tramutoli, V. Self adaptive algorithms for change detection: OCA (the One-channel Cloud-detection Approach) an adjustable method for cloudy and clear radiances detection. In Proceedings of the Eleventh International (A) TOVS Study Conference (ITSC-XI), Budapest, Hungary, 20–26 September 2000; pp. 20–26.
  51. Cuomo, V.; Filizzola, C.; Pergola, N.; Pietrapertosa, C.; Tramutoli, V. A self-sufficient approach for GERB cloudy radiance detection. Atmos. Res. 2004, 72, 39–56. [Google Scholar] [CrossRef]
  52. Tramutoli, V. Robust AVHRR Techniques (RAT) for environmental monitoring: Theory and applications. Proc. SPIE 1998, 3496. [Google Scholar] [CrossRef]
  53. Di Polito, C.; Ciancia, E.; Coviello, I.; Doxaran, D.; Lacava, T.; Pergola, N.; Satriano, V.; Tramutoli, V. On the Potential of Robust Satellite Techniques Approach for SPM Monitoring in Coastal Waters: Implementation and Application over the Basilicata Ionian Coastal Waters Using MODIS-Aqua. Remote Sens. 2016, 8, 922. [Google Scholar] [CrossRef]
  54. European Maritime Safety Agency (EMSA). Available online: http://www.emsa.europa.eu/ (accessed on 28 November 2016).
  55. CEDRE, Centre of Documentation, Research and Experimentation on Accidental Water Pollution. Available online: http://wwz.cedre.fr/en/ (accessed on 28 November 2016).
  56. Liu, Y.; Weisberg, R.H.; Hu, C.; Zheng, L. Tracking the Deepwater Horizon oil spill: A modeling perspective. Eos Trans. AGU 2011, 92, 45–46. [Google Scholar] [CrossRef]
  57. Hu, C. A novel ocean color index to detect floating algae in the global oceans. Remote Sens. Environ. 2009, 113, 2118–2129. [Google Scholar] [CrossRef]
  58. Jernelöv, A. The threats from oil spills: Now, then, and in the future. Ambio 2010, 39, 353–366. [Google Scholar] [CrossRef] [PubMed]
  59. Hu, C.; Weisberg, R.H.; Liu, Y.; Zheng, L.; Daly, K.L.; English, D.C.; Zhao, J.; Vargo, G.A. Did the northeastern Gulf of Mexico become greener after the Deepwater Horizon oil spill? Geophys. Res. Lett. 2011, 38. [Google Scholar] [CrossRef]
Figure 1. Oil spill localization (left) and EMSA Radarsat-1 Image of 18 June 2007 at 03:52 a.m. GMT (adapted from [46] over the area within the red box (right). Three main oil slicks are outlined with the green ellipses.
Remotesensing 09 00128 g001
Figure 2. RST reference fields computation flowchart.
Remotesensing 09 00128 g002
Figure 3. MODIS-Terra true color Rrc RGB image of 18 June 2007 at 09:15 a.m. GMT. The green ellipses indicate the same areas already highlighted in Figure 1.
Remotesensing 09 00128 g003
Figure 4. MODIS-Aqua true color Rrc RGB image of 18 June 2007 at 10:50 a.m. GMT. The green ellipses indicate the same areas already highlighted in Figure 1.
Remotesensing 09 00128 g004
Figure 5. Rrc images of (a) channel 1 and (b) channel 2 of the MODIS-Aqua image of 18 June 2007 at 10:50 a.m. GMT. The grey bars show the sea surface Rrc range of variation for each of the image; land is masked in black. (c) Variation of Rrc signal along the Z-Z’ blue transect in (a,b).
Remotesensing 09 00128 g005
Figure 6. Application of ⊗ch1 index (a) and ⊗ch2 (b) to the MODIS image of 18 June 2007 at 10:50 a.m. GMT. In the background, the corresponding Rrc images already shown in Figure 5a,b; land is masked in black. The two red insets highlight the few pixels detected as anomalous at the S/N levels reported in the legends.
Remotesensing 09 00128 g006
Figure 7. Oil slick mapping during the event on 18 June 2007 at 10:50 a.m. GMT using (a) ⊗ch1 index and (b) ⊗ch2. The images on the right side highlight results achieved for the areas outlined in red in the left panels. The corresponding background Rrc images are in greyscale.
Remotesensing 09 00128 g007
Figure 8. As Figure 7 for MODIS-Aqua image of 03 June 2007 at 11:33 a.m. GMT (a) channel 1; (b) channel 2 and 22 June 2007 at 10:25 a.m. GMT (c) = channel 1; (d) channel 2. No anomalous pixel was detected. In the background, the corresponding Rrc images are depicted in grey tones on the basis of the values indicated in the color bars. Land is masked in black.
Remotesensing 09 00128 g008
Figure 9. MODIS-Aqua-derived Floating Algae Index (FAI) image for 10:50 a.m. GMT 18 June 2007.
Remotesensing 09 00128 g009
Table 1. Number of pixels identified as anomalous at each of the ⊗chx confidence levels used in Figure 7.
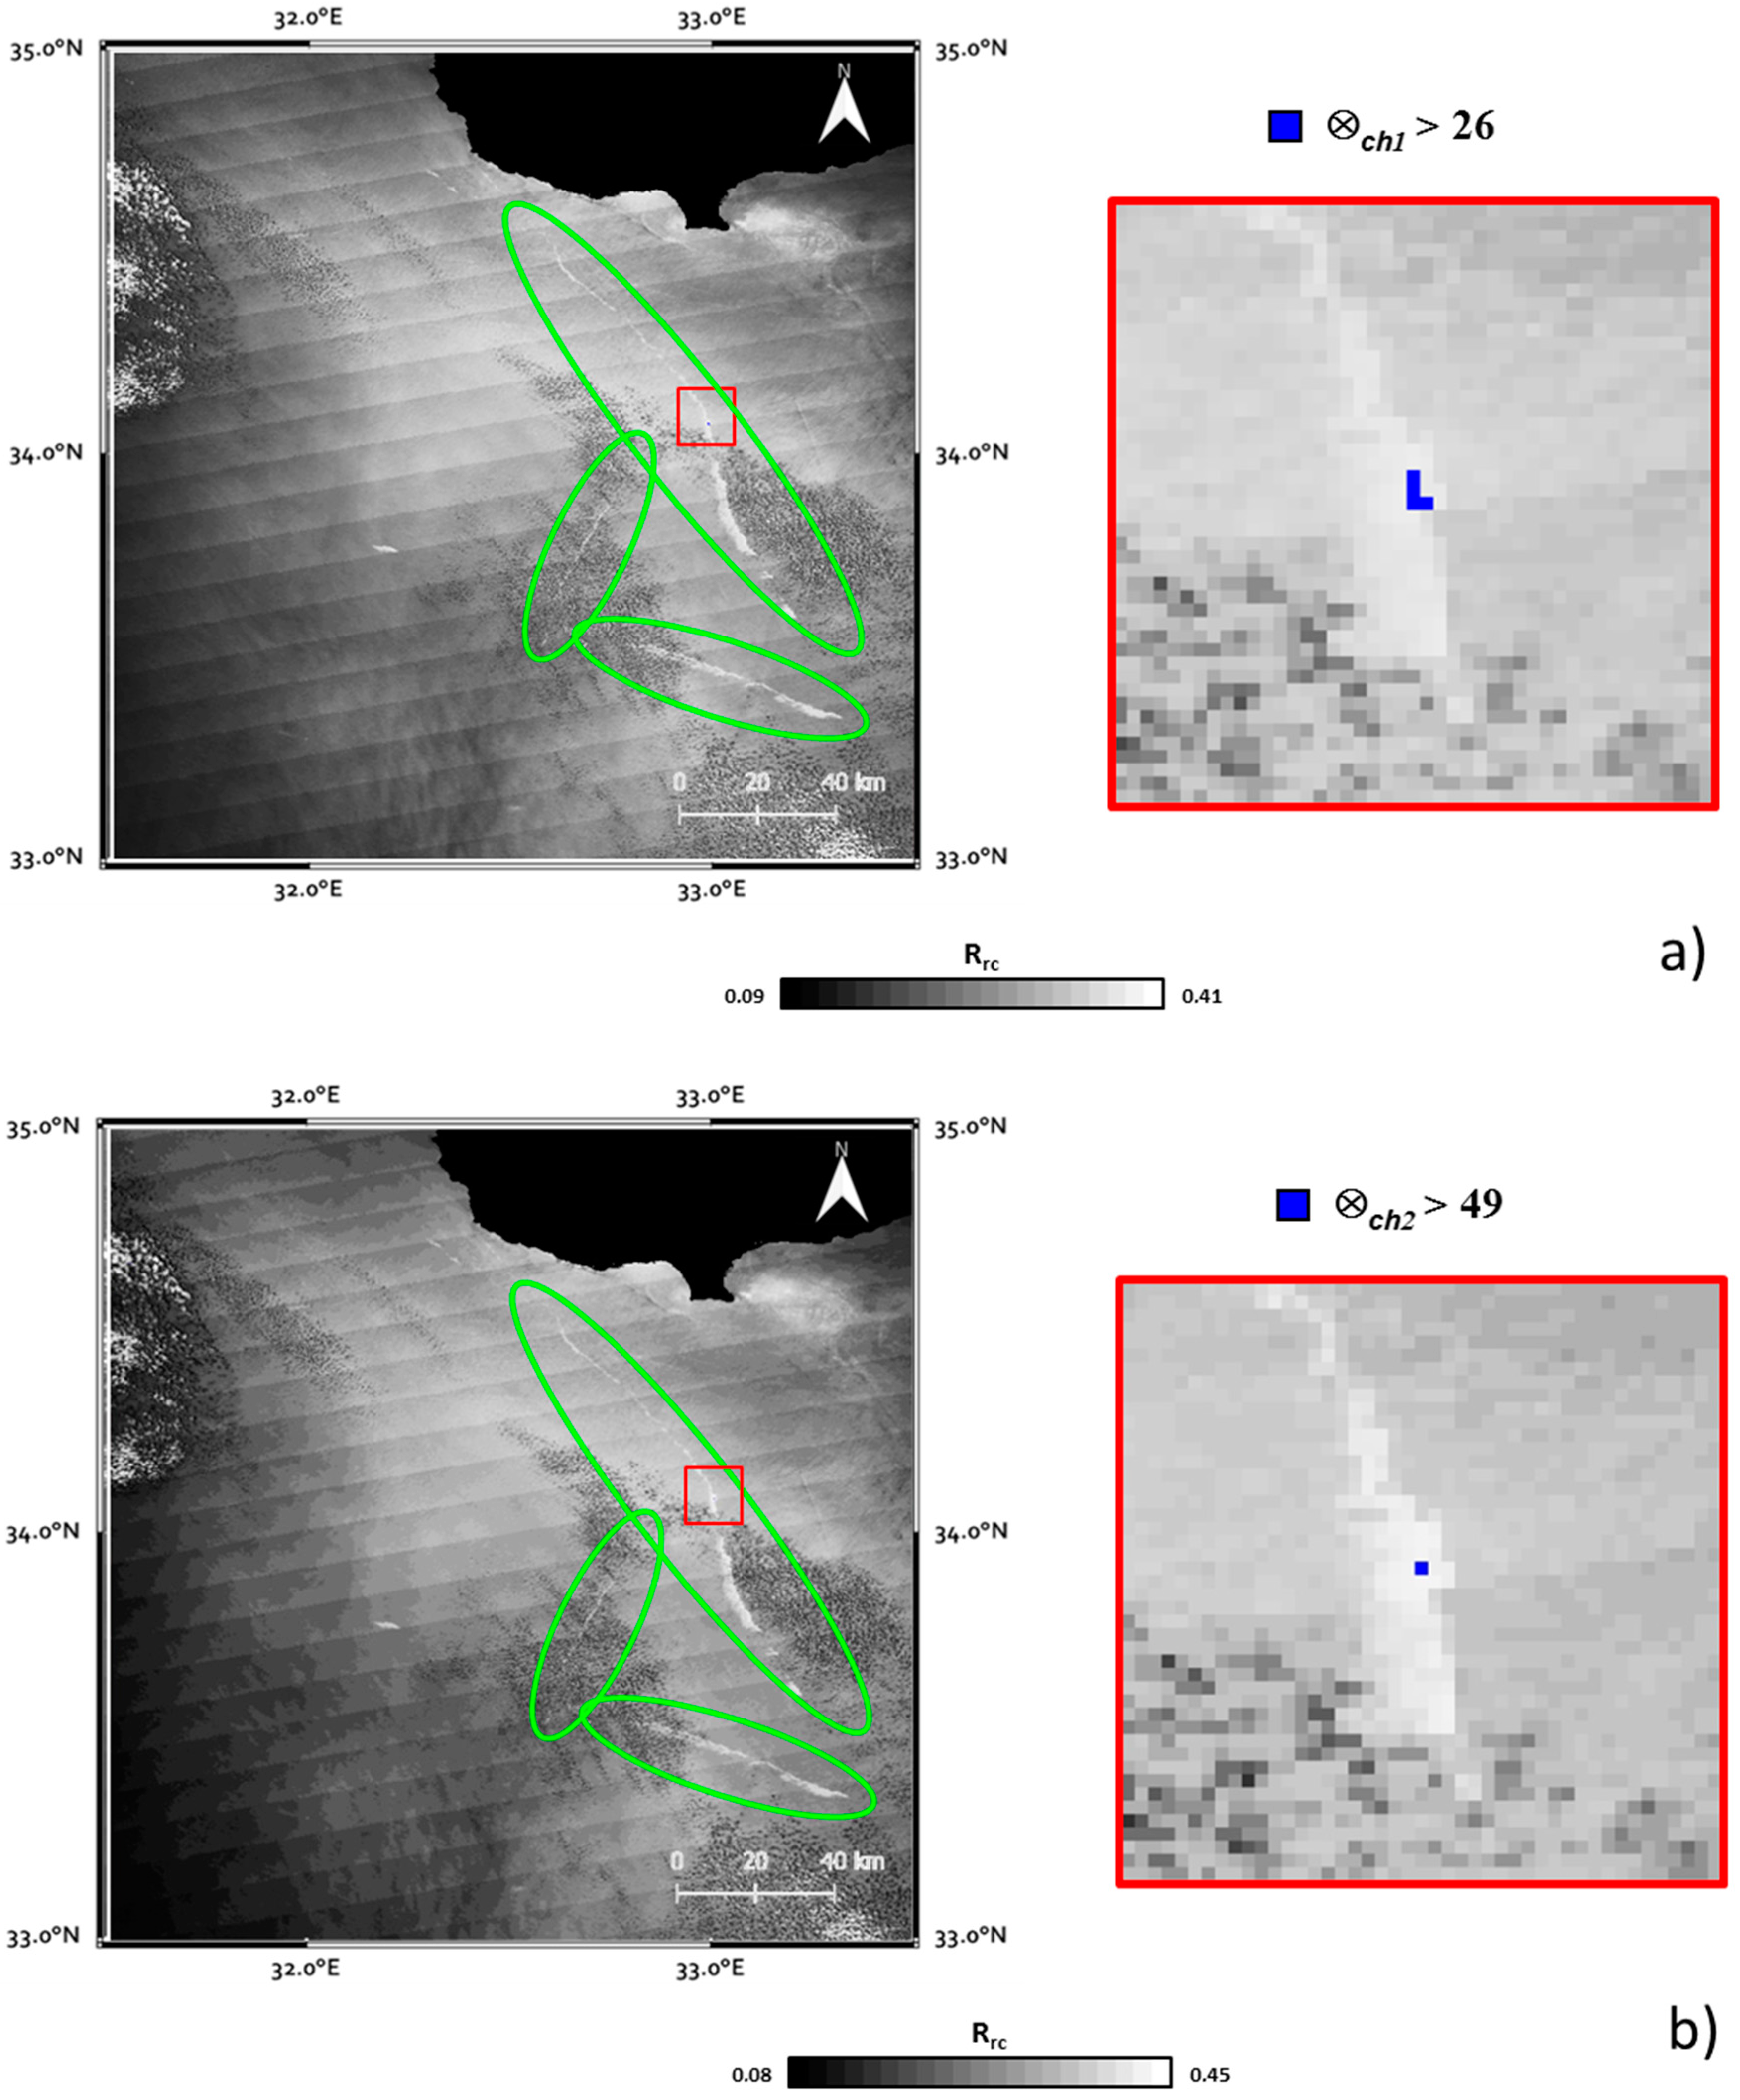
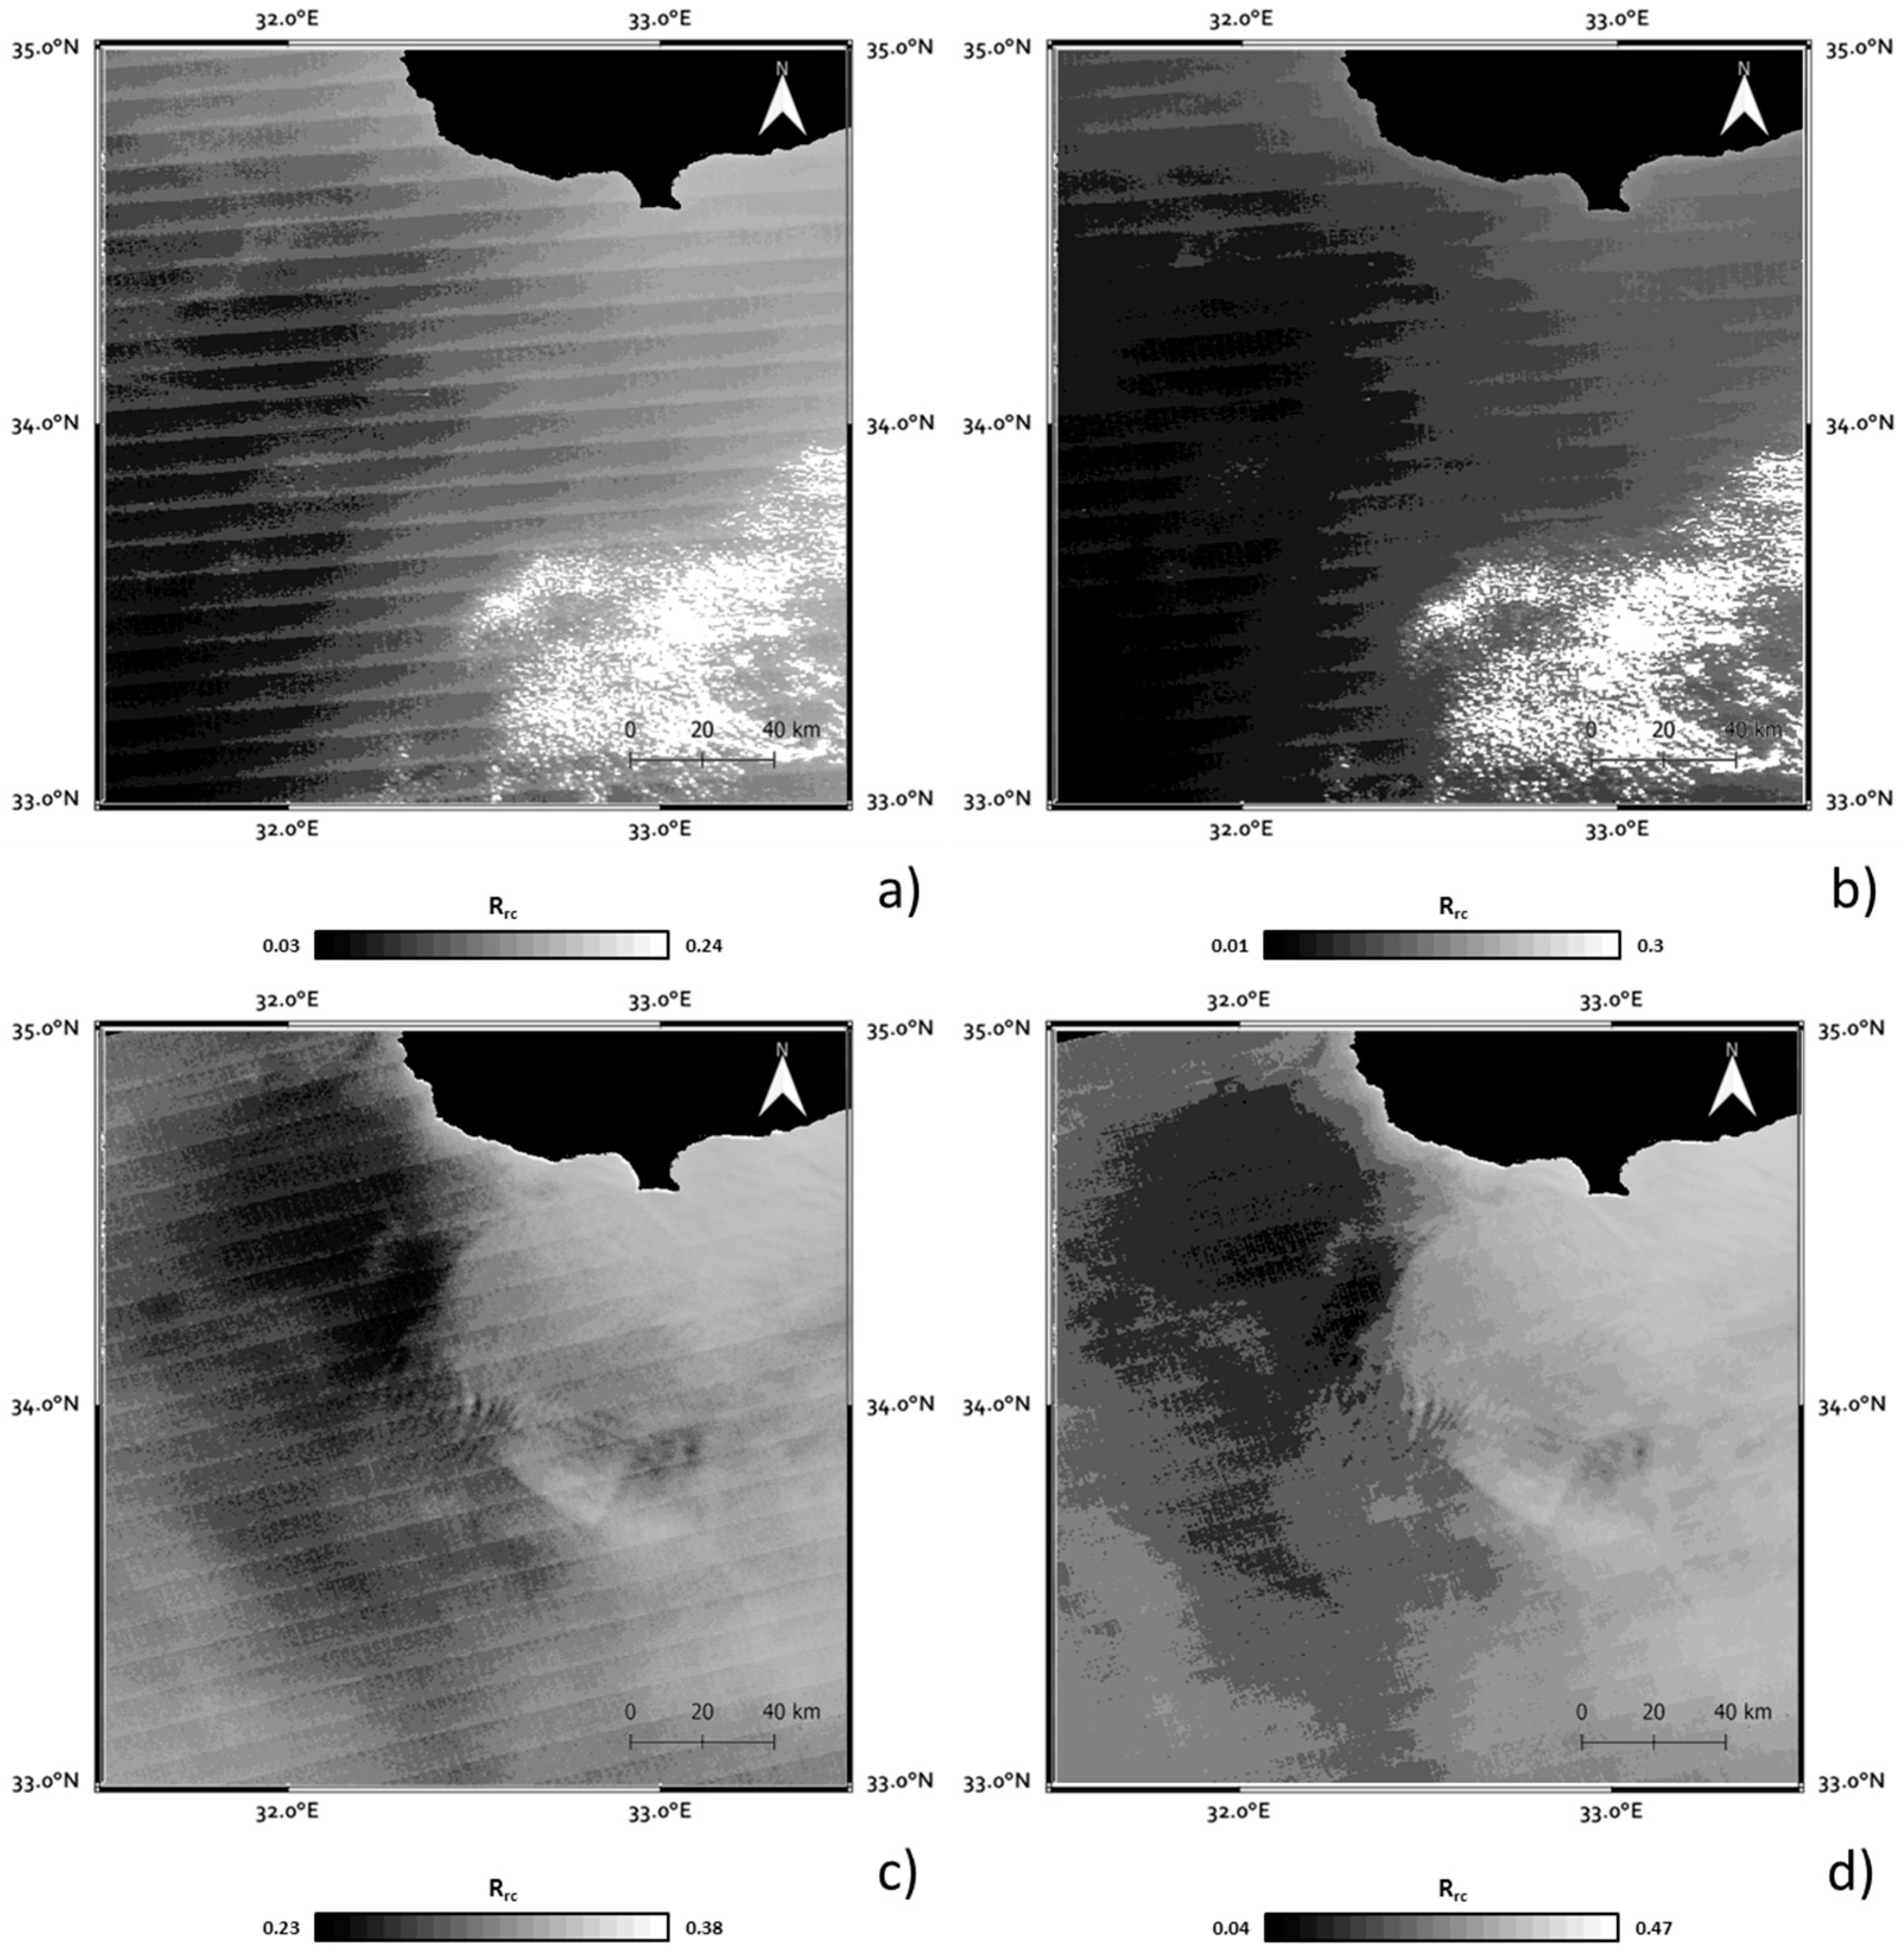
MODIS-Aqua Image of 18/06/2007 10:50 a.m. GMT
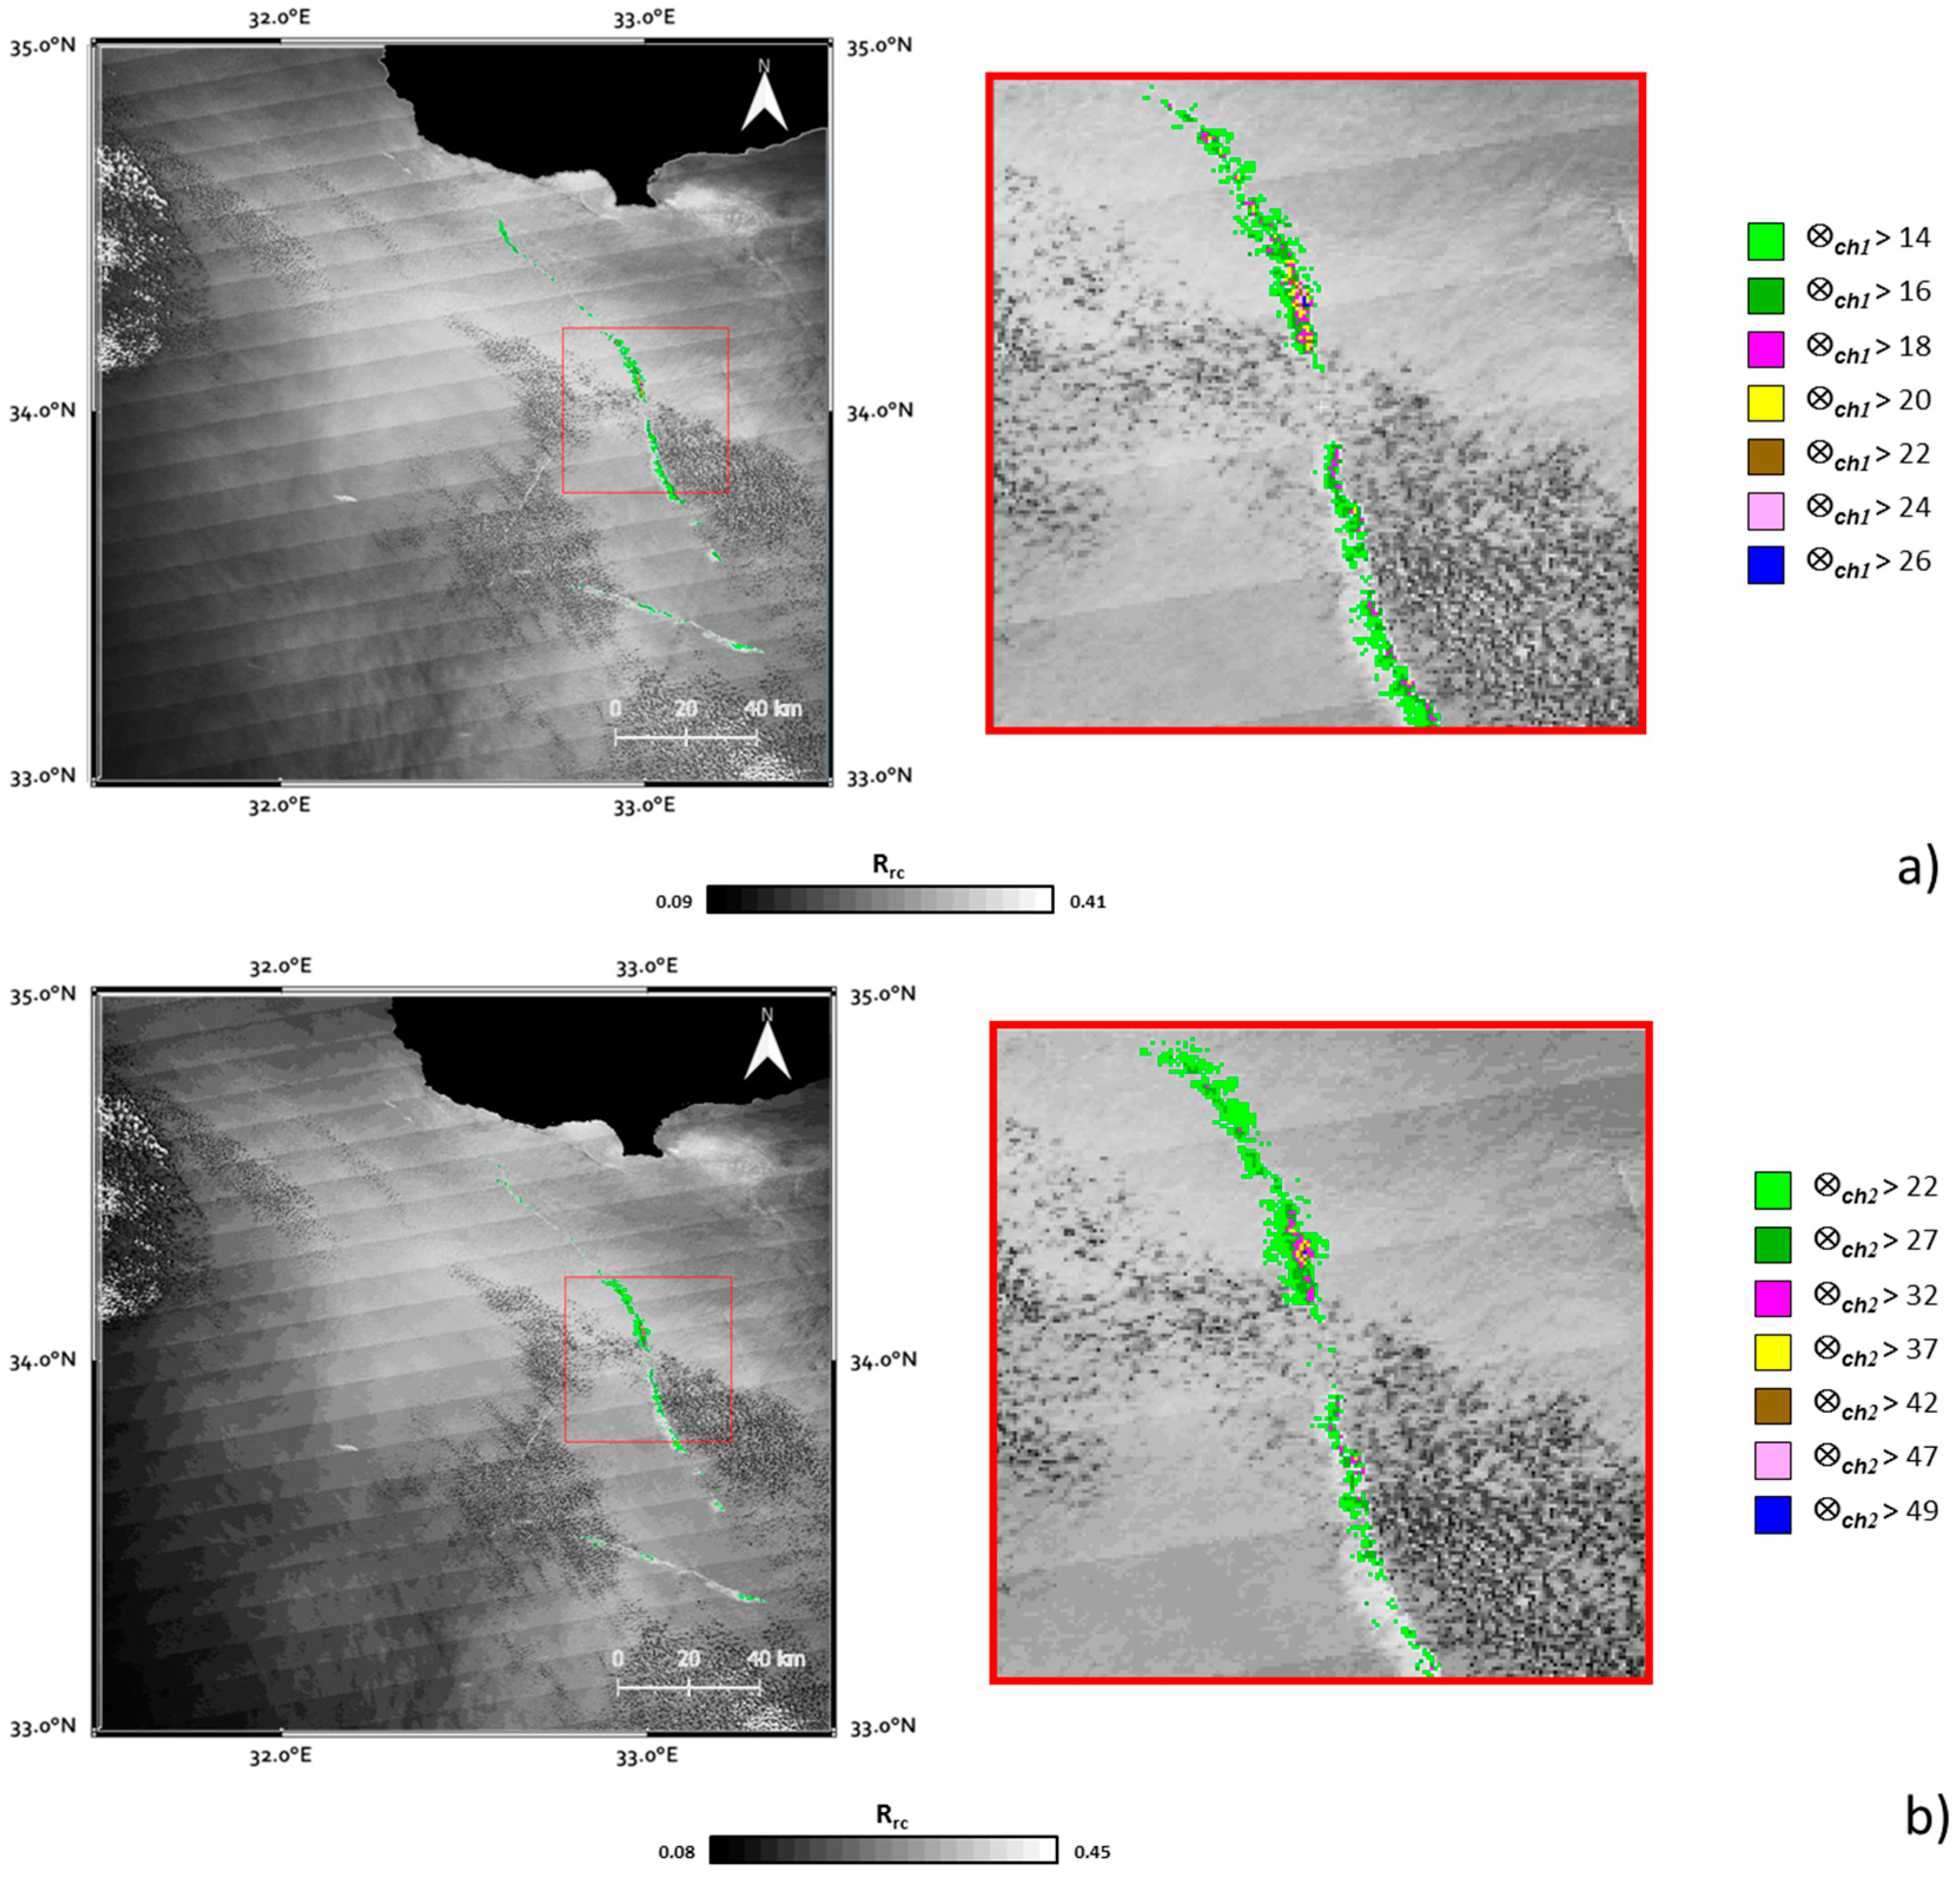
X = ⊗ch1 (Figure 7a)Number PixelsX = ⊗ch2 (Figure 7b)Number Pixels
14 < x ≤ 1678322 < x ≤ 27784
16 < x ≤ 1827327 < x ≤ 32157
18 < x ≤ 2010132 < x ≤ 3753
20 < x ≤ 223937 < x ≤ 4211
22 < x ≤ 241542 < x ≤ 477
24 < x ≤ 26847 < x ≤ 491
x > 264x > 491
TOT1223TOT1014

