Article

Texture-Analysis-Incorporated Wind Parameters Extraction from Rain-Contaminated X-Band Nautical Radar Images

Department of Electrical and Computer Engineering, Memorial University, St. John’s, NL A1B 3X9, Canada
*
Author to whom correspondence should be addressed.
Remote Sens. 2017, 9(2), 166; https://doi.org/10.3390/rs9020166
Submission received: 18 November 2016 / Revised: 10 February 2017 / Accepted: 14 February 2017 / Published: 16 February 2017
(This article belongs to the Special Issue Radar Systems for the Societal Challenges)

Abstract

:
In this paper, a method for extracting wind parameters from rain-contaminated X-band nautical radar images is presented. The texture of the radar image is first generated based on spatial variability analysis. Through this process, the rain clutter in an image can be removed while the wave echoes are retained. The number of rain-contaminated pixels in each azimuthal direction of the texture is estimated, and this is used to determine the azimuthal directions in which the rain-contamination is negligible. Then, the original image data in these directions are selected for wind direction and speed retrieval using the modified intensity-level-selection-based wind algorithm. The proposed method is applied to shipborne radar data collected from the east Coast of Canada. The comparison of the radar results with anemometer data shows that the standard deviations of wind direction and speed using the rain mitigation technique can be reduced by about 14.5° and 1.3 m/s, respectively.

Graphical Abstract

1. Introduction

Weather instruments such as anemometers have been widely installed on ships for the provision of sea surface wind information for navigation. Typically, however, anemometers may produce wind speed measurements with errors of 10% or more, depending on the nature of the ship’s motion and whether blockage due to the ship’s structure is a factor [1,2]. Furthermore, such instruments provide only point measurements. For these reasons, significant effort has been expended on wind measurement using X-band marine radar. The study of the effect of rain on microwave radar backscatter from the sea surface has gained significant attention, since rain may negatively influence the extraction of target information or sea surface parameters from the radar data. The rain affects the radar backscatter via volume scattering and attenuation by raindrops in the intervening atmosphere and by changes in sea surface roughness resulting from rain impinging the ocean [3,4]. Whether the normalized radar cross section (NRCS) is increased or decreased by rain depends on many factors such as rain rate, raindrop size, radar frequency, and polarization [3,4,5]. From marine radar images, it has been observed that sea surface radar backscatter is generally enhanced by the rain at X-band [6,7,8]. Although filters have been designed for marine radar systems to suppress the rain clutter (thereby improving hard targets detection performance [9]), algorithms for removing the effect of precipitation from X-band nautical radar images for the purpose of enhancing sea surface parameters estimation have not been studied. Due to the interaction between X-band radar transmitted signals and the small-scale sea surface roughness generated by local wind [10], the intensity of the radar backscatter strongly depends on wind speed [10,11] and direction [11,12]. It has been observed that—for a horizontally-polarized (HH-polarized) radar at grazing incidence—the normalized radar cross section (NRCS) is maximum in the upwind direction, but minimum in the crosswind direction [11,12], and it changes exponentially with wind speed [13]. Based on these principles, researchers have developed different X-band nautical radar wind algorithms producing results (as compared to anemometer measurements) with standard deviations (STDs) less than 17.4° and 1.1 m/s for wind direction and speed [6,13,14,15], respectively. Among these algorithms, that proposed by Lund et al. [6] provides a technique to recognize images contaminated by rain by analyzing the intensity histogram of the images. Those rain-contaminated images were then discarded from their wind retrieval analysis. In [6], it was shown that the radar-derived wind speed was overestimated and wind direction was less precise in the presence of rain. Thus, a technique for improving wind retrieval from rain-contaminated data is worth pursuing.
In [6], it was also found that the rain-contaminated image pixels are more uniformly bright than the wave echoes. The difference in the intensity features for rain-contaminated and rain-free portions of the radar images may be used to distinguish the two cases. In [16], a texture-analysis-based fuzzy logic algorithm for removing echoes (e.g., ground clutter) from rainfall accumulation maps of polarimetric radars was proposed to improve rain rate estimation. In this paper, an approach similarly incorporating texture analysis for improving the wind results from horizontally-polarized shipborne X-band radar images in the presence of rain is presented. The paper is organized as follows. In Section 2, the texture of X-band nautical radar images with and without rain-contamination is analyzed. The wind algorithm incorporating texture-analysis-based rain-contamination mitigation is described in Section 3. In Section 4, the proposed wind algorithm is tested using field data. The results are discussed in Section 5. Section 6 presents the main conclusion of this research and directions for future work.

2. Texture Analysis

The X-band nautical radar backscatter signals are passed through a logarithmic amplifier before being converted to grey-scale images. Figure 1 shows two examples of typical X-band nautical radar images. Figure 1a is a single radar image collected when it was not raining, and Figure 1b is a single image collected during rain. By comparing Figure 1a,b, it can be clearly seen that the intensity of the right half of Figure 1b is enhanced by rain. The rain-contaminated portion looks more uniformly bright than wave echoes. This means the texture of rain-contaminated echo is different from that of less-contaminated or rain-free echoes.
As in [16], the texture of the radar image used to quantify the spatial variability of the intensity is expressed in terms of root-mean-square (RMS) difference
T a , b = 1 9 i = 1 i = 1 j = 1 j = 1 ( I a , b I a + i , b + j ) 2 ,
where I a , b represents the radar image intensity of pixel ( a , b ) , in range ( a ) and in azimuth ( b ) . The texture intensity of pixel ( a , b ) is computed in the polar domain (B-scan image) as the RMS difference of the intensity levels of that pixel and its eight adjacent pixels. The texture maps for Figure 1a,b are depicted in Figure 1c,d, respectively.
In order to improve the readability of the texture map, the texture intensities for both cases are also rescaled to the same gray scale (i.e., [0, 255] here) as that of the radar images. For the radar image without rain contamination, it can be observed that most of the wave echoes—which display large spatial intensity variation—are retained in the texture map (see Figure 1c). It should be noted that large-scale image intensity variation may also appear in areas with wind gusts in the absence of long surface waves. For the radar image in Figure 1b that was contaminated by rain, wave signatures are still visible on the left half of the texture map (see Figure 1d), indicating that this portion may be less affected by rain. Actually, the analysis reveals that the image portion around the upwind direction is relatively less affected than that around the downwind direction. This is because the upwind clutter is usually stronger than that from downwind. Additionally, it may be observed that the blurred or uniformly bright area due to rain-contamination in the original image of Figure 1b corresponds to low intensity areas in the associated texture map in Figure 1d. This means that the rain-contaminated portion can be recognized from the texture map, and the corresponding portion in the original radar image will be removed from wind information extraction. This property will be utilized in Section 3 to improve the accuracy of wind parameters estimation.

3. Wind Algorithm Incorporating Rain Mitigation

3.1. Data Filtering

Due to the strong impact of rain on the number of pixels with zero intensity, the zero-pixel percentage (ZPP, i.e., the ratio, expressed as a percentage, of the number of image pixels with zero intensity to the overall number of pixels) was identified as a quality control parameter in determining the presence of rain [6]. In [6], those radar images contaminated by rain were discarded from the wind retrieval process. However, it was found that the influence of rain on different portions of the radar image may differ (see Figure 1d). The less-affected portions may still be useful for sea surface parameters extraction. In order to use this portion, the rain-contaminated portion in such an image should be recognized first.
Here, a simple scheme is proposed. For each azimuthal direction in the texture map, when the number of pixels with intensity higher than a threshold I T is less than a specified value N T (= 20 here), the data in such a direction will be identified as rain-contaminated. Usually, the image intensity increases with wind speed due to increased wave signature, in which case both the number of pixels with intensity higher than I T and the image intensity variation will increase. Thus, the threshold I T may also vary with wind speed, and will generally increase with wind speed. This needs to be determined adaptively for each texture image of the rain-contaminated cases. Firstly, the number ( n θ ) of pixels with intensity higher than an initial I T of 40 for each azimuthal direction is determined (see Figure 2). Figure 2a, in which the number of pixels with intensity higher than the initial threshold I T is greater than N T in almost all directions, is the corresponding result for the rain-free case shown in Figure 1c. After obtaining the directional distribution curve of data points with intensity higher than the initial I T , a 32-point moving average is applied to generate a smoothed n θ curve. Then, I T is modified empirically as
I T = n θ min + 5 , n θ max n θ min 35 n θ min + 0.25 ( n θ max n θ min ) , e l s e
where n θ min and n θ max represent, respectively, the minimum and maximum values of the smoothed n θ curve. The directions in which the number of data points with intensity higher than the updated I T in the texture maps is higher than N T are recognized as less affected by rain, and the data in any other direction in the image will be considered to be significantly affected by rain. From Figure 2b, it may be inferred that the data in directions of 0°–190° and 318°–360° are more affected by rain. To mitigate the rain effect on wind information extraction, the data in the identified rain-contaminated directions on the radar images will be removed from the wind retrieval process. Hereafter, this technique is referred to as Rain Mitigation. Moreover, to quantify the extent of rain contamination for each image, a new rain recognition parameter—the rain rejection percentage (RRP), defined as the percentage of directions rejected due to rain contamination—is proposed.

3.2. Wind Extraction Method

After the data filtering procedure, an appropriate algorithm can be applied to the images to extract wind parameters. Vicen-Bueno et al. [15] proposed an intensity-level-selection (ILS)-based method for deriving wind speed and wind direction from X-band nautical radar images. Although the radar images shown in Figure 1 are in Cartesian coordinate system, the wind algorithm is implemented in the polar coordinate system. An integrated image is first generated by temporally and spatially averaging every 32 radar images, each having 1024 (pulses) × 288 (ranges)). The wind vector is then extracted from each integrated image; the details are explained below.

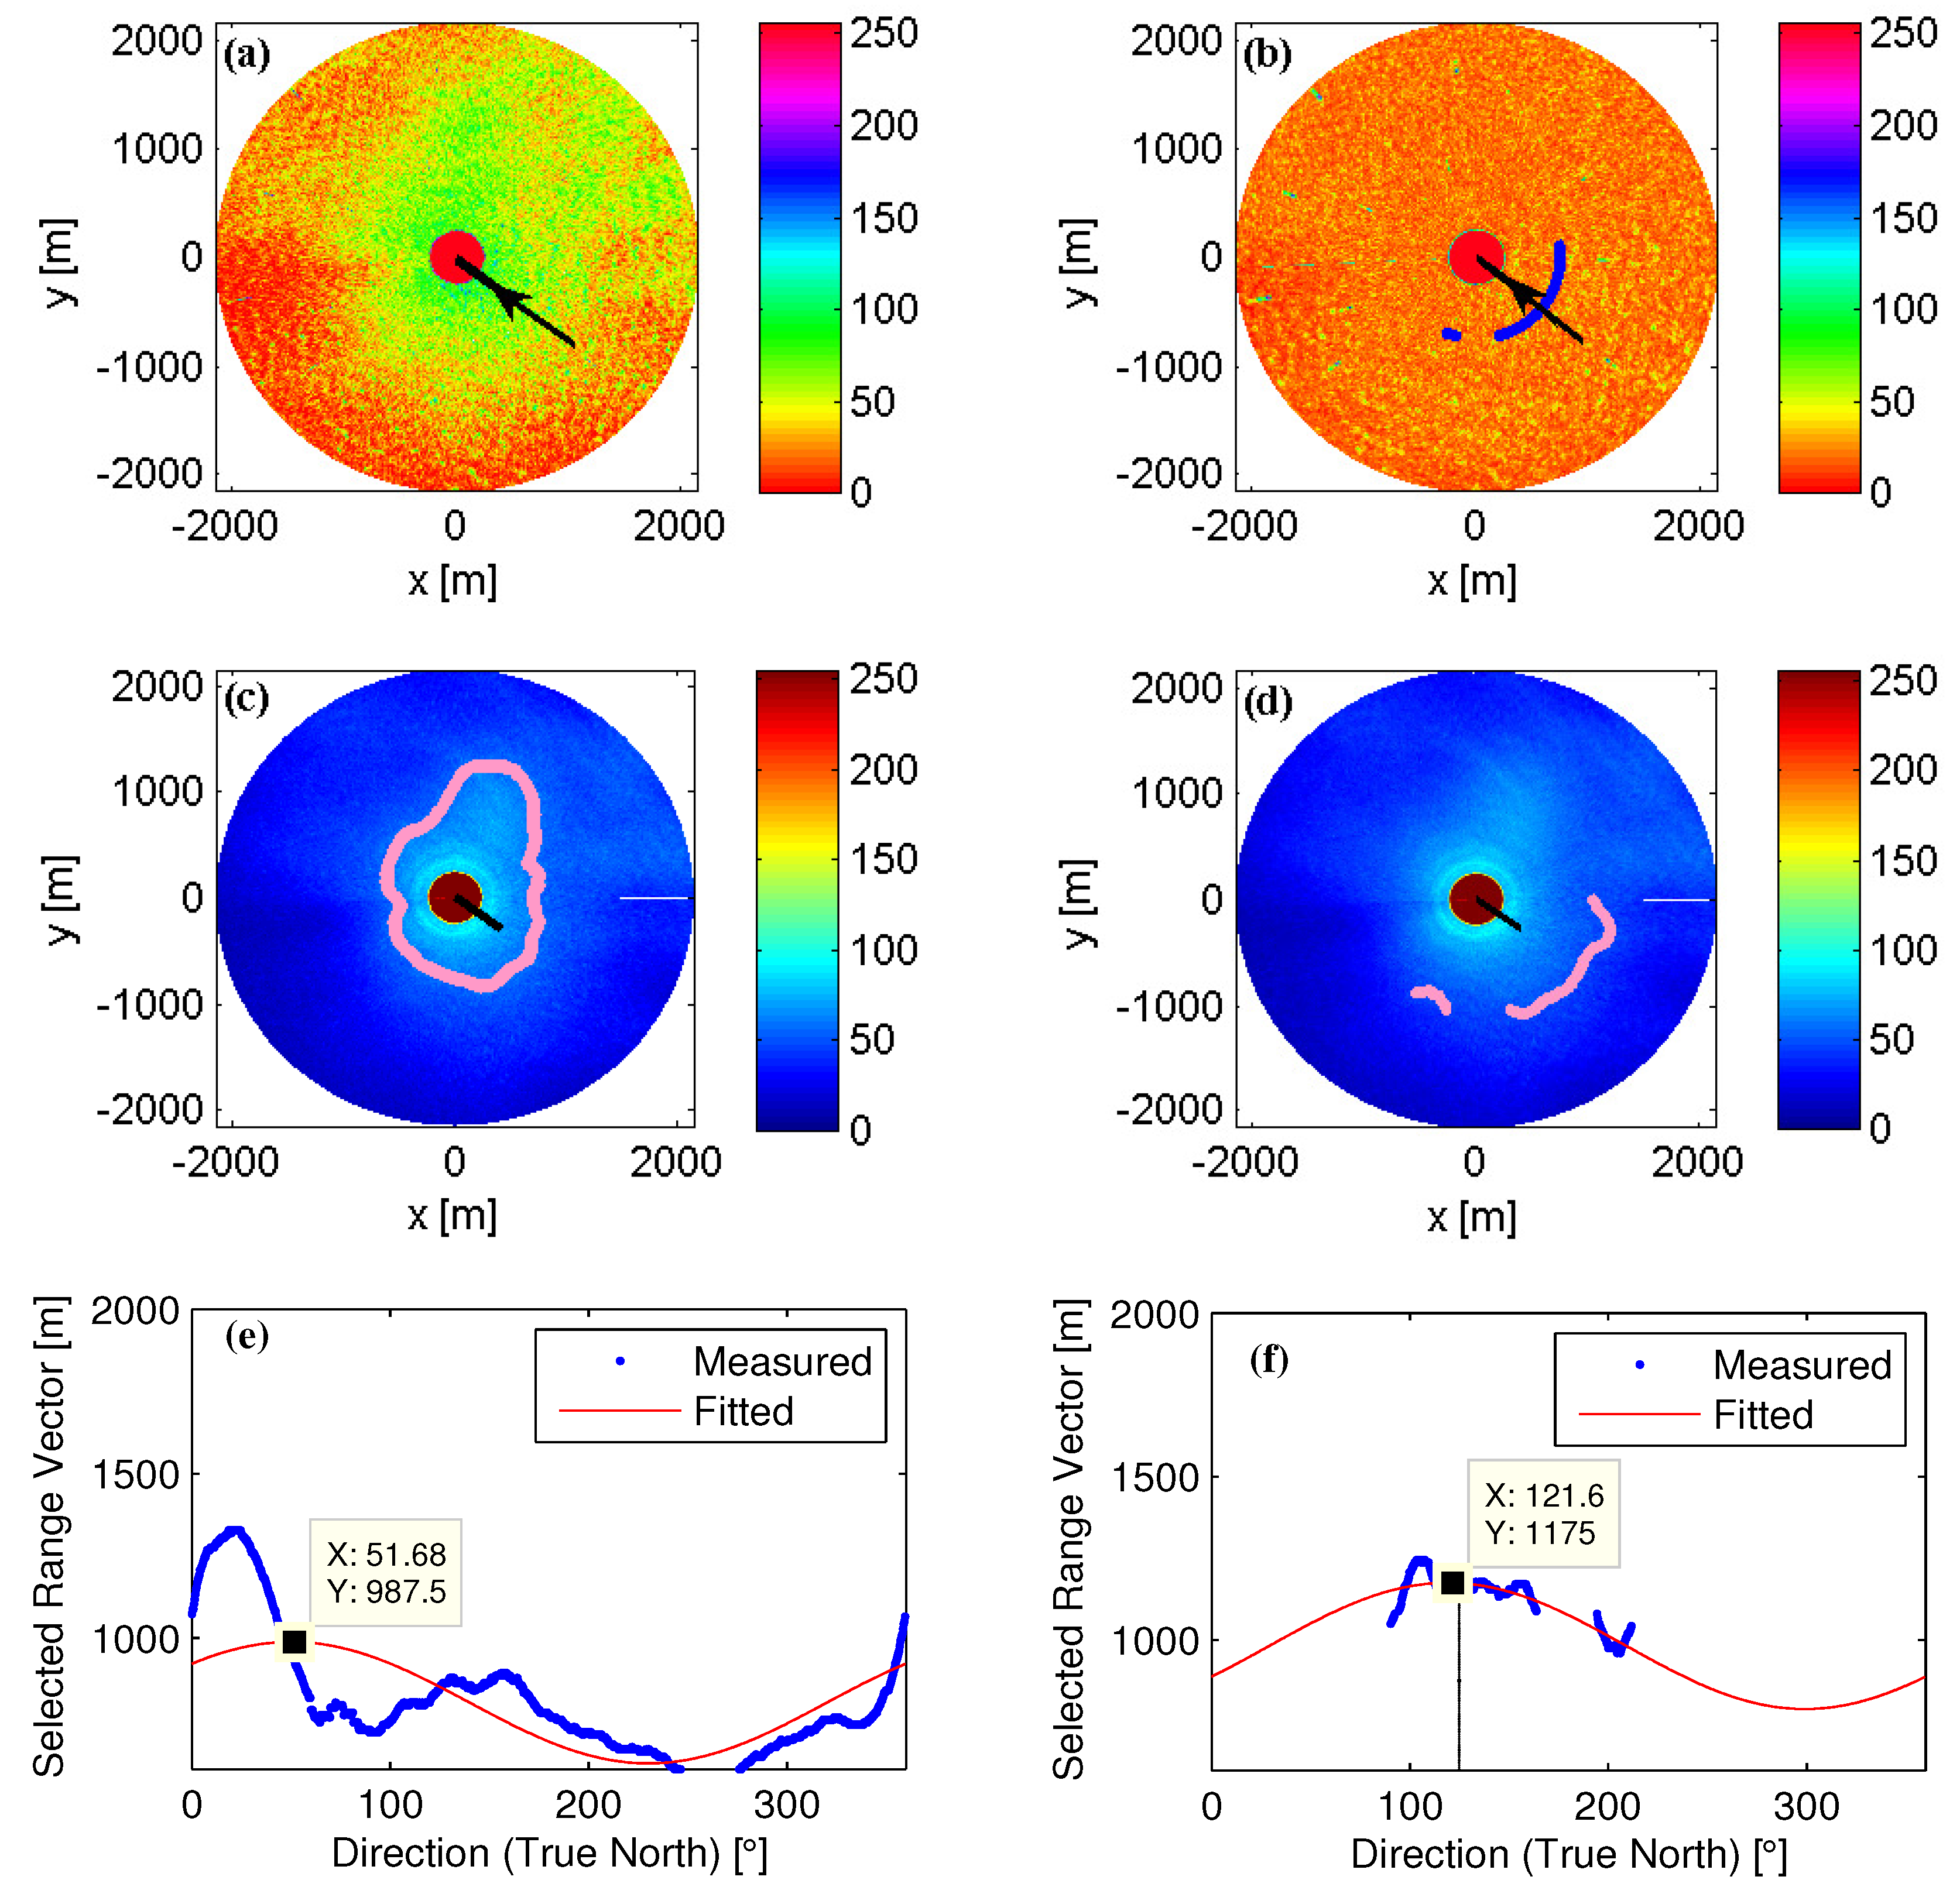
3.2.1. Intensity Level Selection

In the integrated image, for each predefined intensity level L i = 5 i ( i = 1 , 2 , , 25 ) , the first range distance where the backscatter intensity is lower than L i is determined for each look direction. All the obtained range distances for L i are then stored as elements of the range distances vector r i . From these vectors, the one with the lowest L i —for which all elements are greater than the inner distance boundary (here 315 m)—is selected. After the first eight integrated images, only the last-selected L i and its two adjacent intensity levels L i + 1 and L i 1 are used to obtain three corresponding range distances vectors. Of the three vectors, the one which meets the inner distance boundary condition and has the lowest intensity level is employed for wind direction retrieval, and is referred to as the retrieval range distances vector.

3.2.2. Wind Direction and Speed Retrieval

In [15], the wind direction is chosen as the azimuth along which the maximum of the retrieval range distances vector is located. The wind speed u 0 is assumed to be related to the maximum of the retrieval range distances vector corresponding to the selected intensity level L i as
u 0 = α i × max { r i } ,
where max { r i } is the maximum of the retrieval range distances vector and α i is the conversion rate corresponding to the selected intensity level L i . However, the relationship between α i and L i is nonlinear, and can be fitted by the third-order polynomial function [15]
α i = β 3 L i 3 + β 2 L i 2 + β 1 L i + β 0 ,
in which the parameters β j ( j = 0 , 1 , 2 , 3 ) can be determined by least-squares fitting. The fitting is implemented based on the obtained L i and the α i that is calculated from Equation (3) using in-situ wind speed and the maximum of the retrieval range distances vector. After the calibration polynomial function is derived, wind speed can be calculated from the maximum range distance associated with L i and the selected α i .

3.2.3. Modifications

It has been observed that the above-mentioned algorithm will not produce the correct direction if the upwind direction is aligned with discarded angles due to rain-contamination or obstruction. For this reason, a harmonic function
r i ( θ ) = b 0 + b 1 cos 2 ( 0.5 ( θ b 2 ) ) ,
inspired by [6], was introduced to fit the selected range distances vector. The coefficients b 0 , b 1 , b 2 in Equation (5) can be determined by curve-fitting. With this modification, the azimuth gap can be filled, and the accuracy of wind direction determination can be improved [17]. In addition, all the elements of the retrieved range distances vector r i should also be smaller than the outer distance boundary (1860 m here). An example showing the distribution of r i is depicted in Figure 3. It may be observed from Figure 3 that the radar-retrieved wind direction using curve-fitting with rain mitigation was improved from 54° to 122°. It is worth mentioning that when the RRP is too high, the wind results may not be satisfactory due to the small number of data points available for curve fitting.

4. Results

In order to test the proposed method, X-band nautical radar data collected from the East Coast of Canada by Defence Research and Development Canada (DRDC) are used (see Table 1). The marine radar utilized in the experiment is a standard ship-borne HH-polarized Decca nautical radar operating at 9.41 GHz. The radar covers 360° in azimuth with a beam width of about 2° and an antenna rotation speed of 28 rmp. The radar range extends to 2160 m (starting at 240 m in the near range) with a range resolution of 7.5 m. The marine radar was connected to a Wave Monitoring System II (WaMoS II) [18]. The system digitizes the radar backscatter intensities by azimuth-range bin and scales data into 8-bit unsigned integers ([0, 255]). Sets of 32 radar images are combined into a single file. The collection times found in Table 1 are in local standard time coordinates. The shipborne anemometer and radar data were collected on the Canadian Navy research ship CFAV Quest approximately 220 km from the coast of Halifax, Canada (42°21.3′N, 62°55.6′W) in late November 2008 [19]. Due to too-low wind speed or unknown system errors, some images may appear almost completely black with little or no wave signature. These images are referred to as low-backscatter images in Table 1.
Data filtering incorporating the texture map as described in Section 3.1 was applied to the radar data before wind parameters were extracted using the modified ILS-based algorithm. The data collected during the second period (i.e., 28 November 11:16–28 November 12:06) were used as the training dataset to determine the wind speed calibration parameters in Equations (3) and (4), and the data obtained from the first period (i.e., 26 November 23:45–28 November 04:04) were employed for validation. These two datasets are separated with a vertical black line in Figure 4a,b. By utilizing the rain recognition technique proposed in [6], 9924 out of 49,182 images (i.e., 312 out of 1540 files) were identified as rain cases from the 4-day experiment data. In order to validate the rain-recognition algorithm, the precipitation data provided in the Non-Acoustic Data Acquisition System (NADAS) data file are depicted in Figure 4c. Since the difference between the precipitation data measured by the two gauges is large, the average value is used for qualitative analysis. It may be observed that the precipitation was nonzero for most of the period of the recognized rain cases. Here, only the images identified from the ZPP analysis as being rain contaminated are used to produce the wind results displayed in Figure 4. The comparison of the radar-derived wind velocities with and without rain mitigation is shown in Figure 4, in which the anemometer data are plotted as ground truth. It should be noted that the model (i.e., Equation (4)) obtained using the data recognized as rain cases with least-squares fitting was employed in the proposed wind algorithm. The error statistics for rain-contaminated, rain-free images, and the full dataset are shown in Table 2.

5. Discussion

By observing Figure 4, it may be seen that the proposed method shows remarkable improvement over the period from 7:48 to 10:30 on November 27 (i.e., File Nos. 80 to No. 156), during which continuous rain was identified. With rain mitigation, the mean errors of wind direction and speed obtained for this period are reduced by 11.6° and 4.9 m/s, respectively. From Figure 4c, the ZPP of this period is relatively stable with a value of around 2%, and the RRP has a moderate value of about 20%–30%. Although the RRP value for this period is similar to that of other periods, both the wind speed and rain amount are high. Removing about 20%–30% of the data from such an image may significantly affect the selected intensity level L i in Equation (4), and thus may also affect the wind speed estimation. However, the ZPP is almost zero for File Nos. 36 to 51 and File Nos. 64 to 79, but the associated RRP is found to be high. This means that most of the directions in an image are rejected, and the retained small portion of the image may not be enough to obtain a satisfactory curve-fitted range distances vector. Thus, for these data points, the improvement with rain mitigation is negligible—especially for wind speed results. Similar performance can also be seen at the near-zero ZPP points after File No. 186. However, the RRPs of these data points are not as high as those of File Nos. 36 to 51 and File Nos. 64 to 79. This means that fewer directions on the texture maps are recognized as being contaminated by rain. In fact, the wave echoes on these images are found to be strong everywhere, and the rain rate is low. Fortunately, less than 15% of the rain-contaminated images are found to have a RRP higher than 60%. This indicates that most of the data collected under rainy conditions can benefit from using the proposed method. This can also be confirmed from the error statistics shown in Table 2. The overall STDs for wind direction and speed shown here are a little higher than the results in [6,13,14,15]. It should be noted that the results in this paper are based on the analysis of rain-contaminated data only. In addition, the procedure used in [14] for correcting the wind speed measurements for boundary layer stability is not incorporated here, since some necessary parameters for the correction are not available.

6. Conclusions

In this paper, a technique for wind parameter extraction from rain-contaminated X-band nautical images has been proposed. It was found that wave signatures in the directions with less rain-contamination are retained in the texture map of a radar image. By removing the data in the directions that are more affected by rain, the radar-derived wind results improve. For the data presented in this paper, with rain mitigation, the standard deviations of wind direction and speed are reduced by 14.5° and 1.3 m/s, respectively. Here, the analysis was conducted in the polar domain, for which the intensity-level-selection-based wind algorithm was designed. Performing analysis within small windows in Cartesian space may allow better location of any rain area to further improve the results.
Of course, there are limitations to the proposed rain mitigation technique. Firstly, after using the data filtering process, if most of the directions in an image are recognized as contaminated by rain (i.e., if the RRP is higher than 60%), the rain mitigation technique proposed in this paper may show little improvement. This is especially true when the entire image is rain-contaminated (i.e., RRP = 100%), and in such cases the data are simply discarded here. Secondly, when the ZPP is too low (i.e., less than 1%), the wind direction retrieval performance using rain mitigation is somewhat better than that without rain mitigation, and, in such cases, there is little to be gained for wind speed retrieval from implementing the technique. In the future, investigation of the possibility of retrieving wind direction from the texture map alone could be conducted. It would also be worthwhile to compare the performance of wind extraction from the horizontally- and vertically-polarized radar data presented in [20]. In addition, the ZPP-based rain recognition method sometimes failed. A more robust algorithm for rain recognition should be developed. Moreover, how rain rate affects wind determination and whether the rainfall information can be extracted from X-band marine radar data should be investigated.

Acknowledgments

This work was supported by Natural Sciences and Engineering Research Council of Canada grants to W. Huang (NSERC 402313-12) and Eric W. Gill (NSERC 238263-10), an Atlantic Innovation Fund (AIF) award to Memorial University (E. W Gill: principal investigator). The authors would also like to thank E. Thornhill of Defence Research and Development Canada (DRDC) for providing the radar and anemometer data.

Author Contributions

W.H. proposed the method, analyzed the data, interpreted the results and revised the manuscript. Y.L., under the supervision of W.H. and E.W.G., analyzed the data and prepared the manuscript. E.W.G. coordinated revisions of the manuscript.

Conflicts of Interest

The authors declare no conflict of interest.

References

  1. Moat, B.I.; Yelland, M.J.; Pascal, R.W.; Molland, A.F. The effect of ship shape and anemometer location on wind speed measurements obtained from ships. In Proceedings of the 4th International Conference on Marine Computational Fluid Dynamics, Southampton, UK, 30–31 March 2005.
  2. Liu, Y.; Huang, W.; Gill, E.W.; Peters, D.K.; Bueno, R.V. Comparison of algorithms for wind parameters extraction from shipborne X-band marine radar images. IEEE J. Sel. Top. Appl. Earth Obs. Remote Sens. 2015, 8, 896–906. [Google Scholar] [CrossRef]
  3. Tournadre, J.; Quilfen, Y. Impact of rain cell on scatterometer data: 1. Theory and modeling. J. Geophys. Res. 2003, 108. [Google Scholar] [CrossRef]
  4. Contreras, R.F.; Plant, W.J. Surface effect of rain on microwave backscatter from the ocean: Measurements and modeling. J. Geophys. Res. Oceans 2006, 111. [Google Scholar] [CrossRef]
  5. Melsheimer, C.; Alpers, W.; Gade, M. Investigation of multifrequency/multipolarization radar signatures of rain cells over the ocean using SIR-C/X-SAR data. J. Geophys. Res. 1998, 103, 18867–18884. [Google Scholar] [CrossRef]
  6. Lund, B.; Graber, H.C.; Romeiser, R. Wind retrieval from shipborne nautical X-band radar data. IEEE Trans. Geosci. Remote Sens. 2012, 50, 3800–3811. [Google Scholar] [CrossRef]
  7. Braun, N.; Gade, M.; Lange, P.A. Radar backscattering measurements of artificial rain impinging on a water surface at different wind speeds. In Proceedings of the IEEE International Geoscience and Remote Sensing Symposium, Hamburg, Germany, 28 June–2 July 1999.
  8. Liu, Y.; Huang, W.; Gill, E.W. Analysis of the effects of rain on surface wind retrieval from X-band marine radar images. In Proceedings of the MTS/IEEE Oceans, St. John’s, NL, Canada, 14–19 September 2014.
  9. Jang, M.K.; Choand, C.S. Target detection of marine radars using matrix bank filters. In Proceedings of the Asia Pacific Microwave Conference, Kaohsiung, Taiwan, 4–7 December 2012.
  10. Lee, P.H.Y.; Barter, J.D.; Beach, K.L.; Hindman, C.L.; Lake, B.M.; Rungaldier, H.; Shelton, J.C.; Williams, A.B.; Yee, R.; Yuen, H.C. X-band microwave backscattering from ocean waves. J. Geophys. Res. 1995, 100, 2591–2611. [Google Scholar] [CrossRef]
  11. Hatten, H.; Ziemer, F.; Seemann, J.; Borge, J.N. Correlation between the spectral background noise of a nautical radar and the wind vector. In Proceedings of the 17th International Conference on Offshore Mechanics and Arctic Engineering, Lisbon, Portugal, 5–6 July 1998.
  12. Trizna, D.; Carlson, D. Studies of dual polarized low grazing angle radar sea scatter in nearshore regions. IEEE Trans. Geosci. Remote Sens. 1996, 34, 747–757. [Google Scholar] [CrossRef]
  13. Dankert, H.; Horstmann, J.; Rosenthal, W. Ocean wind fields retrieved from radar-image sequences. J. Geophys. Res. Oceans 2003, 108. [Google Scholar] [CrossRef]
  14. Dankert, H.; Horstmann, J. A marine radar wind sensor. J. Atmos. Ocean. Technol. 2007, 24, 1629–1642. [Google Scholar] [CrossRef]
  15. Vicen-Bueno, R.; Horstmann, J.; Terril, E.; Paolo, T.D.; Dannenberg, J. Real-time ocean wind vector retrieval from marine radar image sequences acquired at grazing angle. IEEE Trans. Geosci. Remote Sens. 2013, 30, 127–139. [Google Scholar] [CrossRef]
  16. Gourley, J.J.; Tabary, P.; Chatelet, J.P.D. A fuzzy logic algorithm for the separation of precipitating from nonprecipitating echoes using polarimetric radar observations. J. Atmos. Ocean. Technol. 2007, 24, 1439–1451. [Google Scholar] [CrossRef]
  17. Liu, Y.; Huang, W.; Gill, E.W. Intensity-level-selection-based wind retrieval from shipborne nautical X-band radar data. In Proceedings of the IEEE International Geoscience and Remote Sensing Symposium, Quebéc, QC, Canada, 13–18 July 2014.
  18. WaMoS II Wave and Surface Current Monitoring System Operating Manual Version 4.0. Available online: https://www.scribd.com/document/237204782/OceanWaves-WaMoS-II-Operating-Manual (accessed on 14 February 2017).
  19. Huang, W.; Gill, E.W.; An, J. Iterative least-squares-based wave measurement using X-band nautical radar. IET Radar Sonar Navig. 2014, 8, 853–863. [Google Scholar] [CrossRef]
  20. Huang, W.; Carrasco, R.; Shen, C.; Gill, E.W.; Horstmann, J. Surface current measurements using X-band marine radar with vertical polarization. IEEE Trans. Geosci. Remote Sens. 2016, 54, 2988–2997. [Google Scholar] [CrossRef]
Figure 1. Examples of marine radar images and the their texture maps: (a) radar image without rain-contamination; (b) rain-contaminated radar image; (c) texture map of (a); (d) texture map of (b). The arrow indicates the direction from which the wind blows, and the blue ring in (c,d) denotes the azimuthal direction in which the image portion is less affected by rain. The ZPP and RPP values of (a) are 23% and 0%, respectively. The zero pixel percentage (ZPP) and rain rejection percentage (RRP) values of (b) are 1% and 68%, respectively.
Remotesensing 09 00166 g001
Figure 2. Number of pixels with intensity higher than the threshold for each direction of the (a) texture map in Figure 1c; (b) texture map in Figure 1d.
Remotesensing 09 00166 g002
Figure 3. An illustrative example. (a) the original radar image with a ZPP of 0.5%; (b) the texture map with an RRP of 73%; and the distribution of selected range distances vector ri: (c) on an integrated image (without rain mitigation); (d) on an integrated image (with rain mitigation); (e) curve-fitting without rain mitigation; (f) curve-fitting with rain mitigation. The black bar at the center shows the anemometer-measured wind direction (125°).
Remotesensing 09 00166 g003
Figure 4. Results: (a) wind speed; (b) wind direction; (c) zero pixel percentage (ZPP) and precipitation; (d) rain rejection percentage (RRP). The vertical black line in (a,b) separates the two data collection periods specified in Table 1.
Remotesensing 09 00166 g004aRemotesensing 09 00166 g004b
Table 1. Data Information.
Data Collecting TimeNumber of Radar ImagesNumber of Rain CasesNumber of Low-Backscatter Images
26 November 23:45–28 November 04:04 and 28 November 11:16–29 November 12:0649,18299241832
Table 2. Wind speed and direction recovery error statistics: bias and standard deviation (STD).
Wind AlgorithmWind Direction ErrorWind Speed Error
Bias (°)STD (°)Bias (m/s)STD (m/s)
Rain-Contaminated (With Rain Mitigation)5.319.90.32.0
Rain-Contaminated (Without Rain Mitigation)14.734.42.13.3
Rain-Free1.715.90.61.4
All (With Rain Mitigation)2.516.80.51.5
All (Without Rain Mitigation)4.421.20.91.9

