4.1. Data limitations
The results of the mass budgets show relatively low uncertainties according to the results of the selected method [
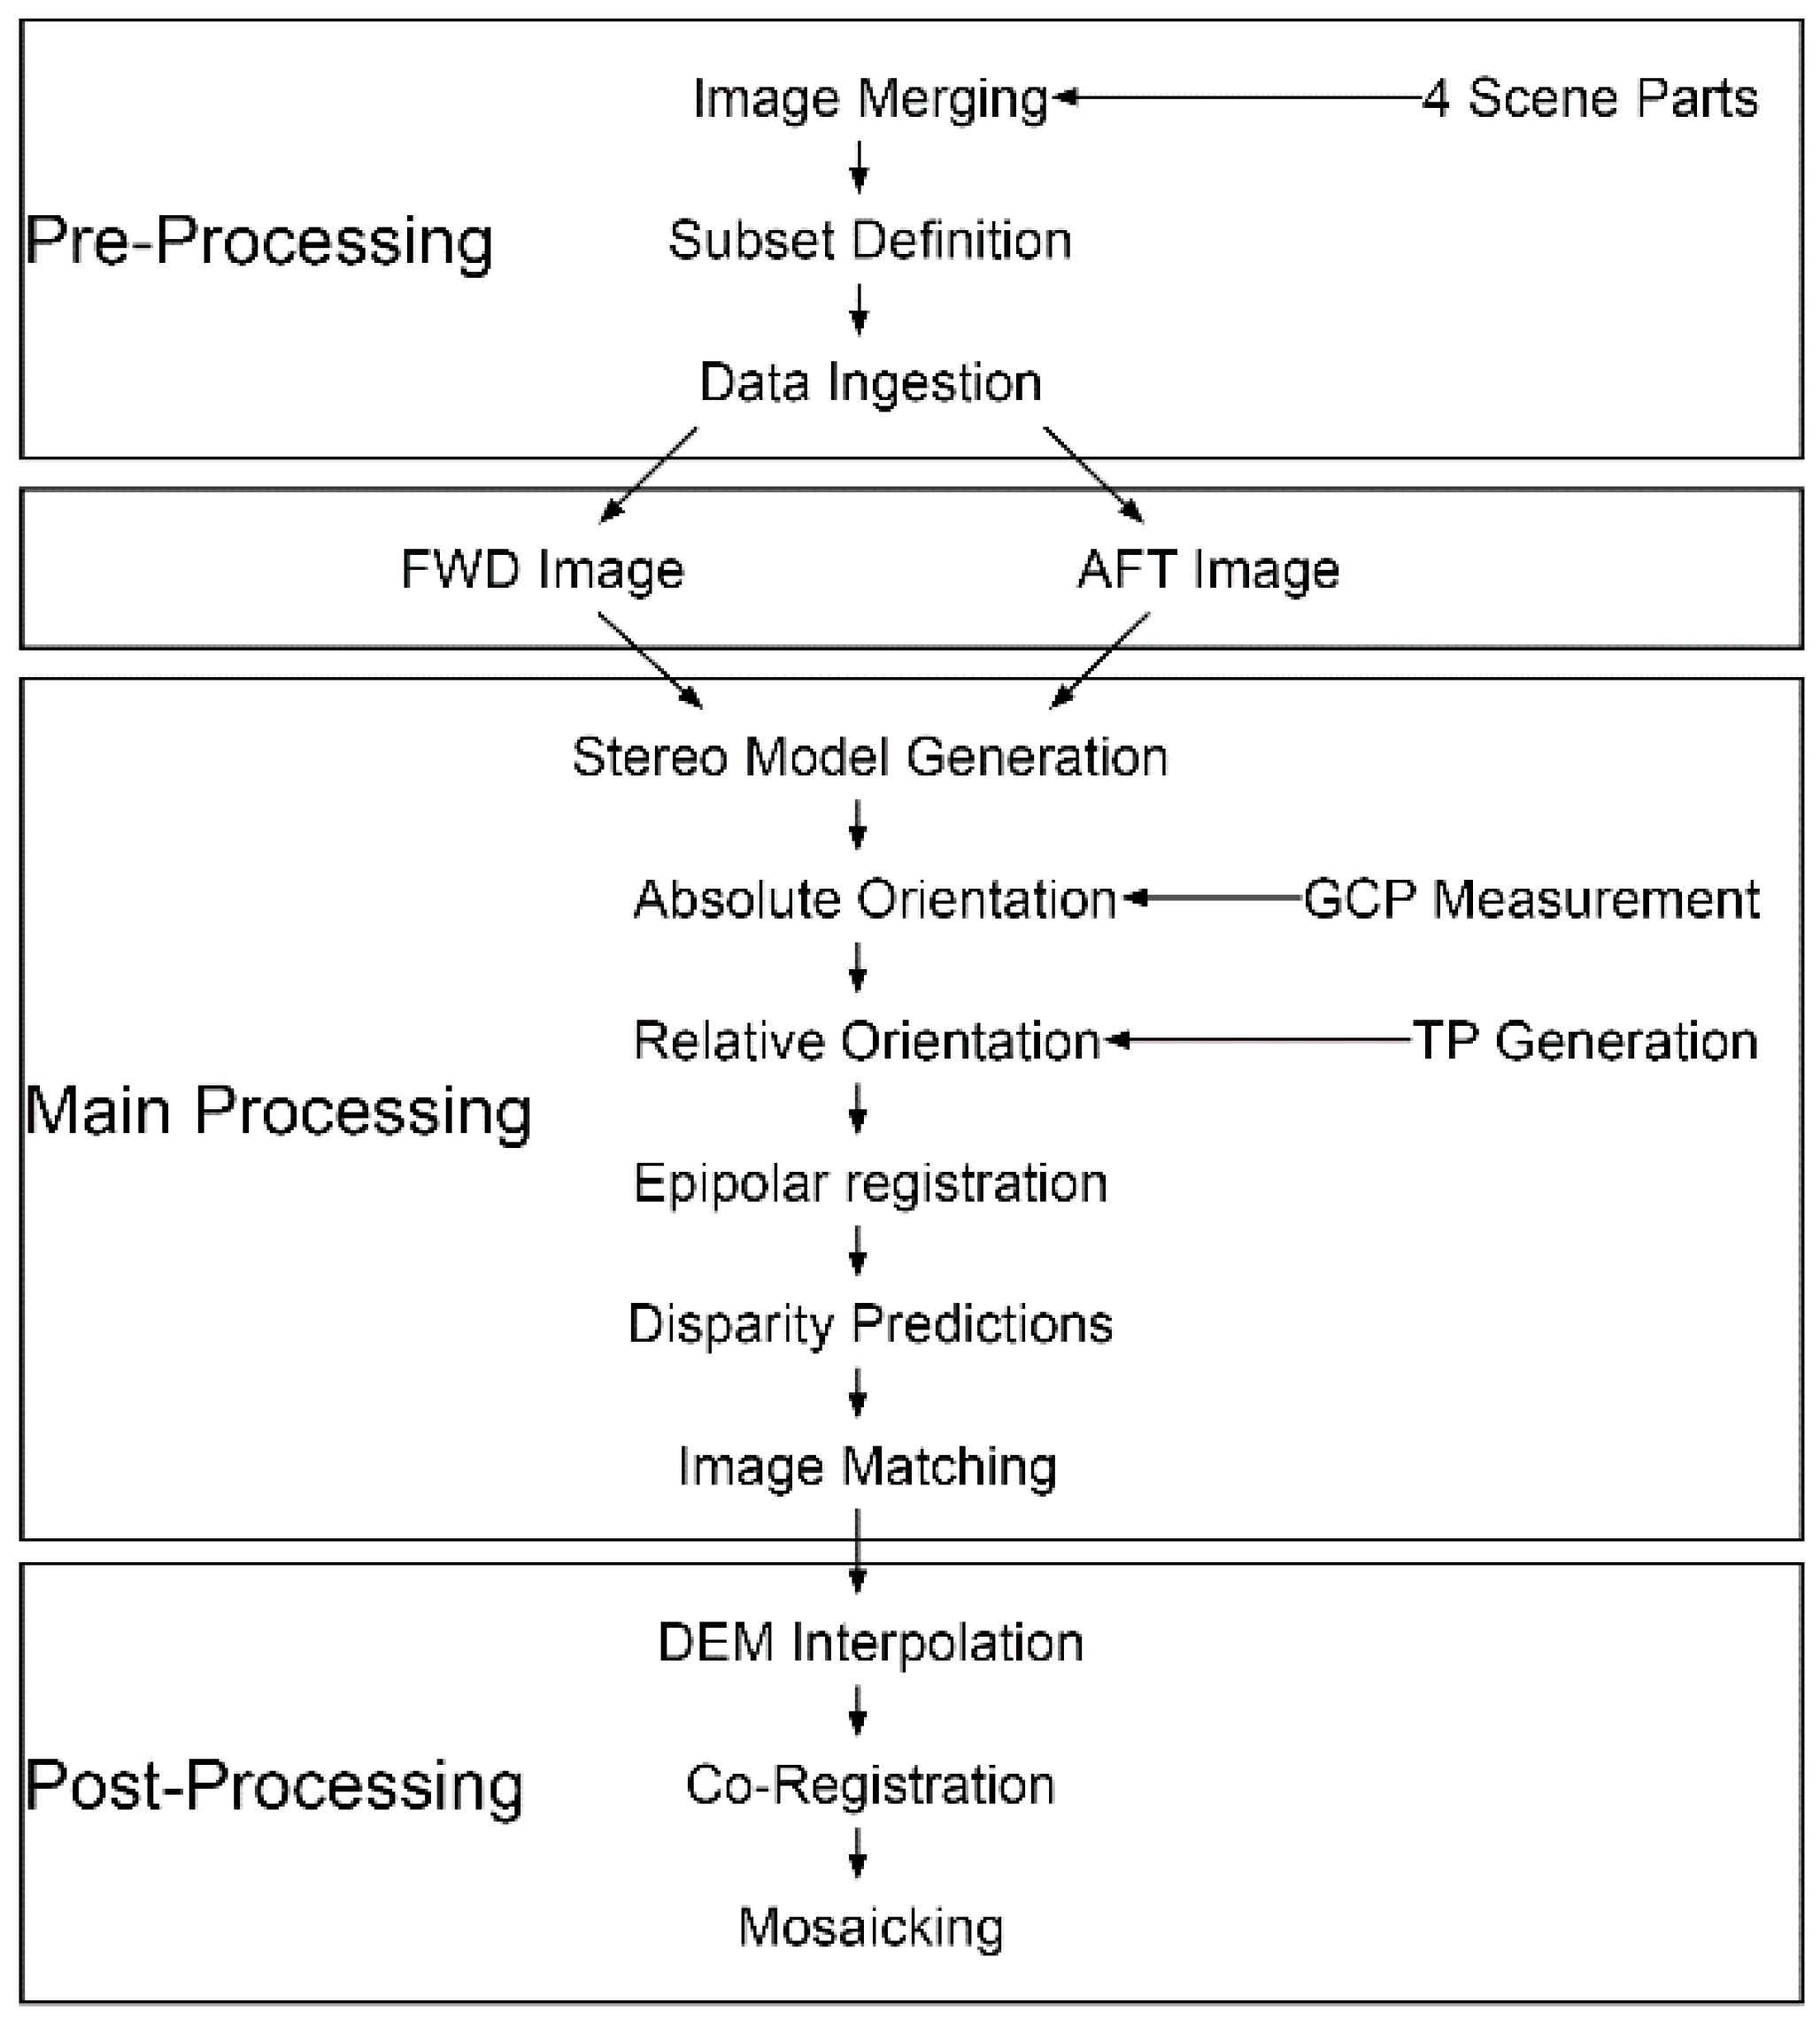
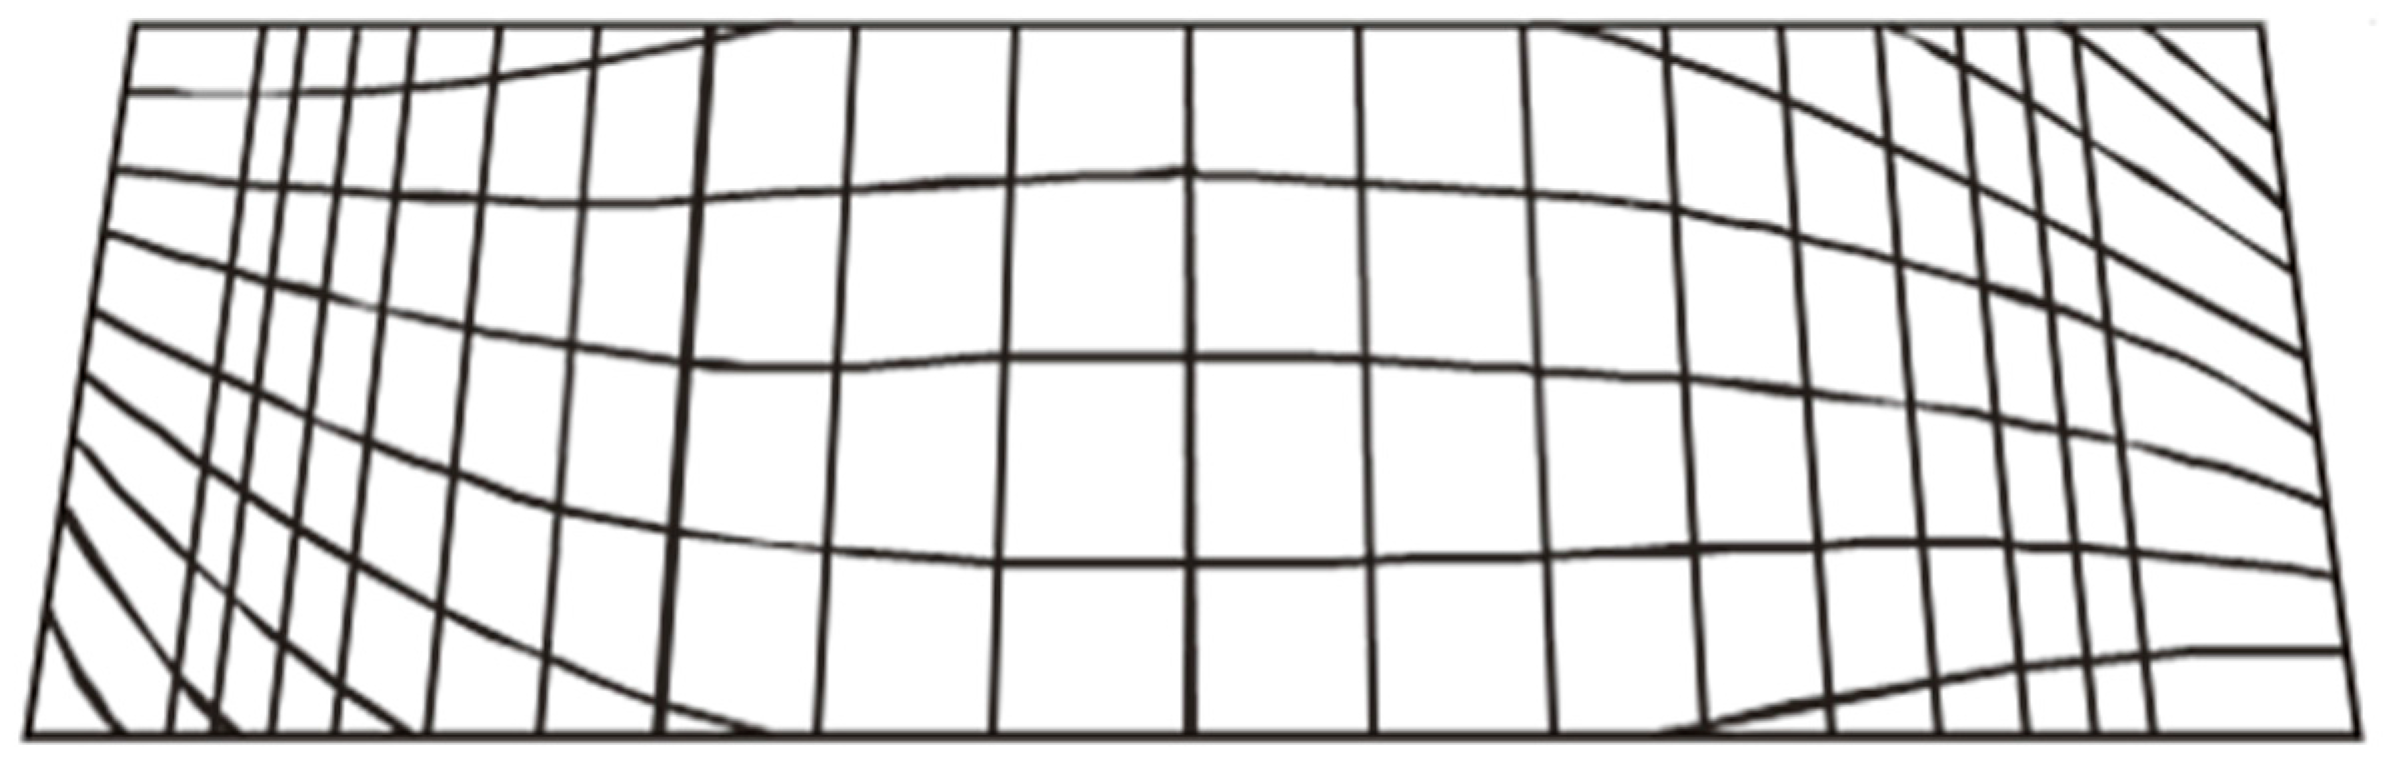
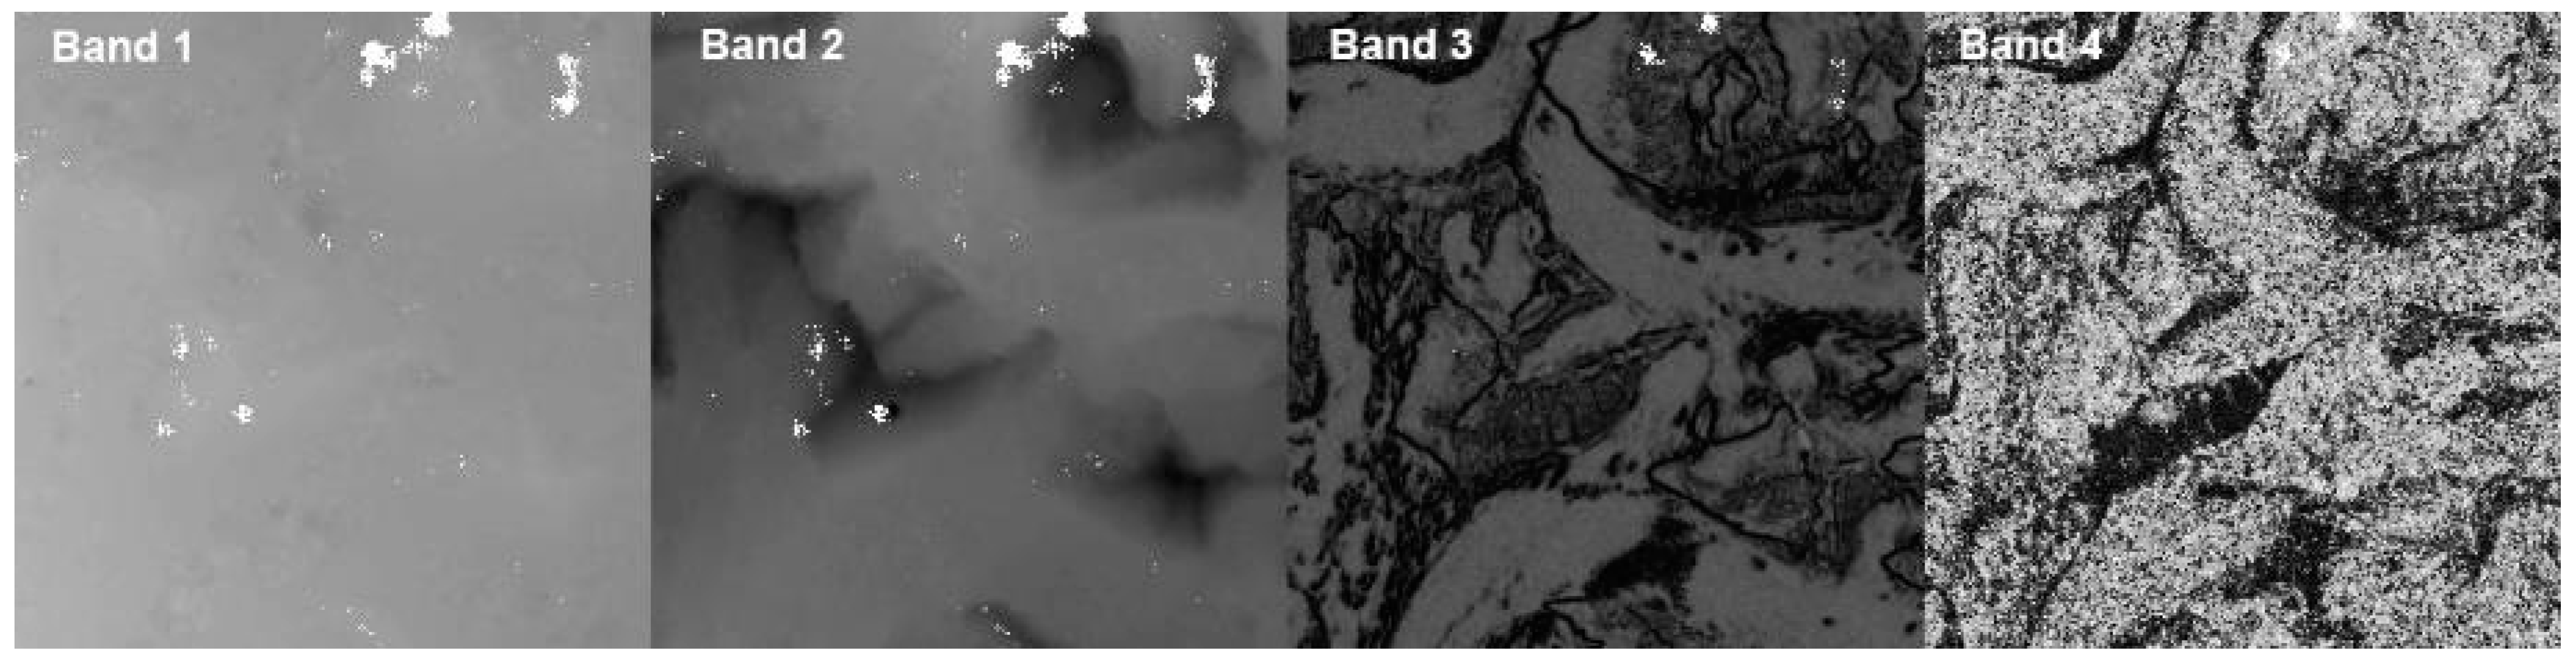
42]. However, we found some problems with the Corona data in general. A first aspect is the scanner used for the digitalisation of the analogue images. If the image is not perfectly adjusted during scanning, it is nearly impossible to recreate the entire scene from the four provided subsets. Furthermore, we detected small differences in the scanner head velocities, resulting in an impossibility to apply an epipolar registration (R. Perko, K. Gutjahr, pers. comm., 21 April 2015). Galiatsatos [
28] described these findings as well.
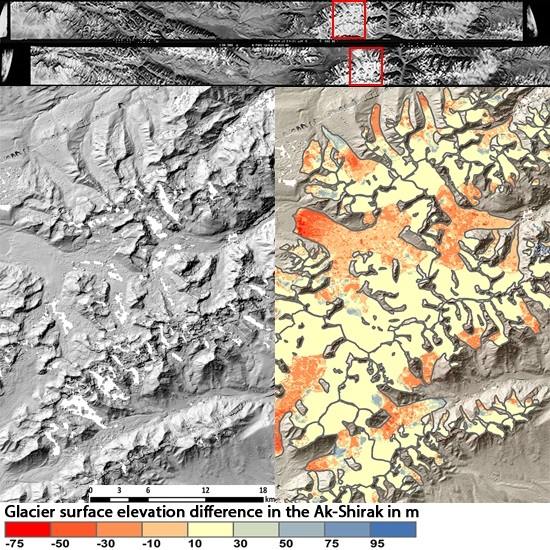
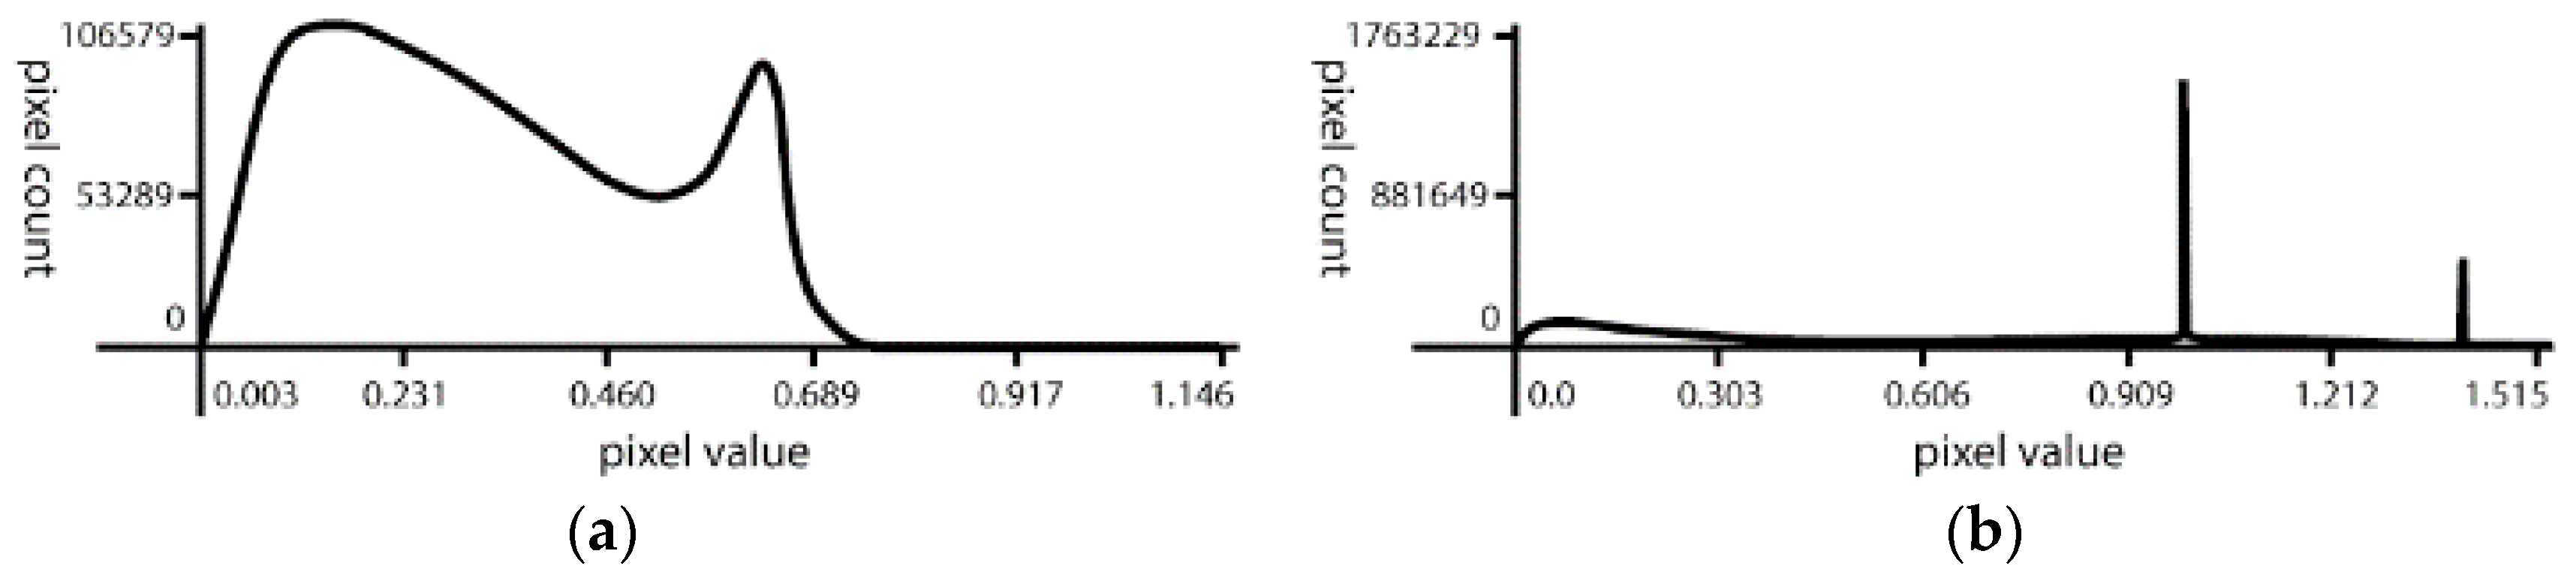
The second limitation is low image contrast in snow-covered or shadowed areas where matching failed and resulted in data gaps (~2.4% of the entire DTM; ~4% of glacierised terrain) and wrongly assigned pixels after DTM generation. This lowered the number of pixels for the uncertainty calculations and increased the number of pixels, which had to be interpolated, especially in the accumulation regions. We therefore compared our results to a second approach with an elevation-dependent filtering and an ordinary kriging interpolation without the threshold filter. For Bordu South Glacier, we found an unrealistic mass gain of 0.6 ± 0.3 m·w.e.a−1 for the 1964 to 1973 period. The reason is clearly visible in the orthophoto where extremely low contrast results in wrongly assigned elevation values. The large glaciers showed only small differences, for example Dschamansu Glacier with −0.8 ± 0.4 instead of −0.6 ± 0.4 m·w.e.a−1 (1964–1973) or Petrov with −0.7 ± 0.1 instead of −0.6 ± 0.1 m·w.e.a−1 (1964–1980).
In comparison to previous work on Corona DTM generation in glacierised high mountain regions of smaller or equal 100 km
2 [
21,
22,
23,
24,
46], we generated a DTM covering an area of ~4200 km
2 out of three stereo scenes, which is more than three times the size of the Ak-Shirak range. Besides the size of the DTM, it covers a high mountain region between 2500 m and 5200 m altitude. It consists of five single DTMs computed from six Corona scene subsets. The overlap of 9.7% impedes a perfect DTM mosaicking and is slightly visible in the final DTM. However, as the affected glacierised area is small (~12% of the glacierised area) and showing a median elevation difference of 9.5 m, there is a minor effect (±0.13 to ±0.07 m) on the mass budget accuracy calculations only. Another proof of the high quality of the generated DTM is the small amount of wrongly calculated surface elevation heights on stable terrain (
Supplementary Materials Figure S1).
Apart from the uncertainty calculation approach of Gardelle et al. [
42], we also took the approach of Höhle and Höhle [
47] into account. The normalised median absolute deviation (NMAD) is a rather conservative approach also mentioned by Kronenberg et al. [
26], which resulted in higher uncertainty values. For the sake of comparison, we did the entire uncertainty calculation for both approaches. This leads to uncertainty differences for Sary-Tor North Glacier of 6.1 m (1964–1980) with the approach of Gardelle et al. [
42] compared to 8.3 m [
47]. For Besimjannij Glacier the difference is slightly higher (3.4 to 9.4 m) for the same observation period. In the end, the uncertainties depict an estimate only and might be somewhere in between.
Furthermore, we used Landsat OLI and SRTM data as a basis for GCP measurements as there was no other reference data available. Both sources provide lower image resolution than the processed data, which might lead to non-linear transformations. As Landsat orthoimagery is processed based on SRTM data, the two sources should be correctly aligned, except SRTM data voids where other elevation data are used. To handle the issue of non-linear transformations, we checked the hillshade extract of the SRTM and the Landsat OLI data visually if they are aligned adequately (mountain ridges and summits in snow covered regions) and can confirm satisfying alignment. Additionally, we did as many co-registration iterations between the generated DTMs (KH-4A and KH-9 1980) and the KH-9 1973 DTM until we reached a horizontal accuracy of less than 1 px, which proofs a correct alignment and less geometric distortions.
The Corona and Hexagon scenes are acquired in different seasons of the year, which might have an influence on the snow cover and thus the calculated surface elevation. These seasonal variations should be considered [
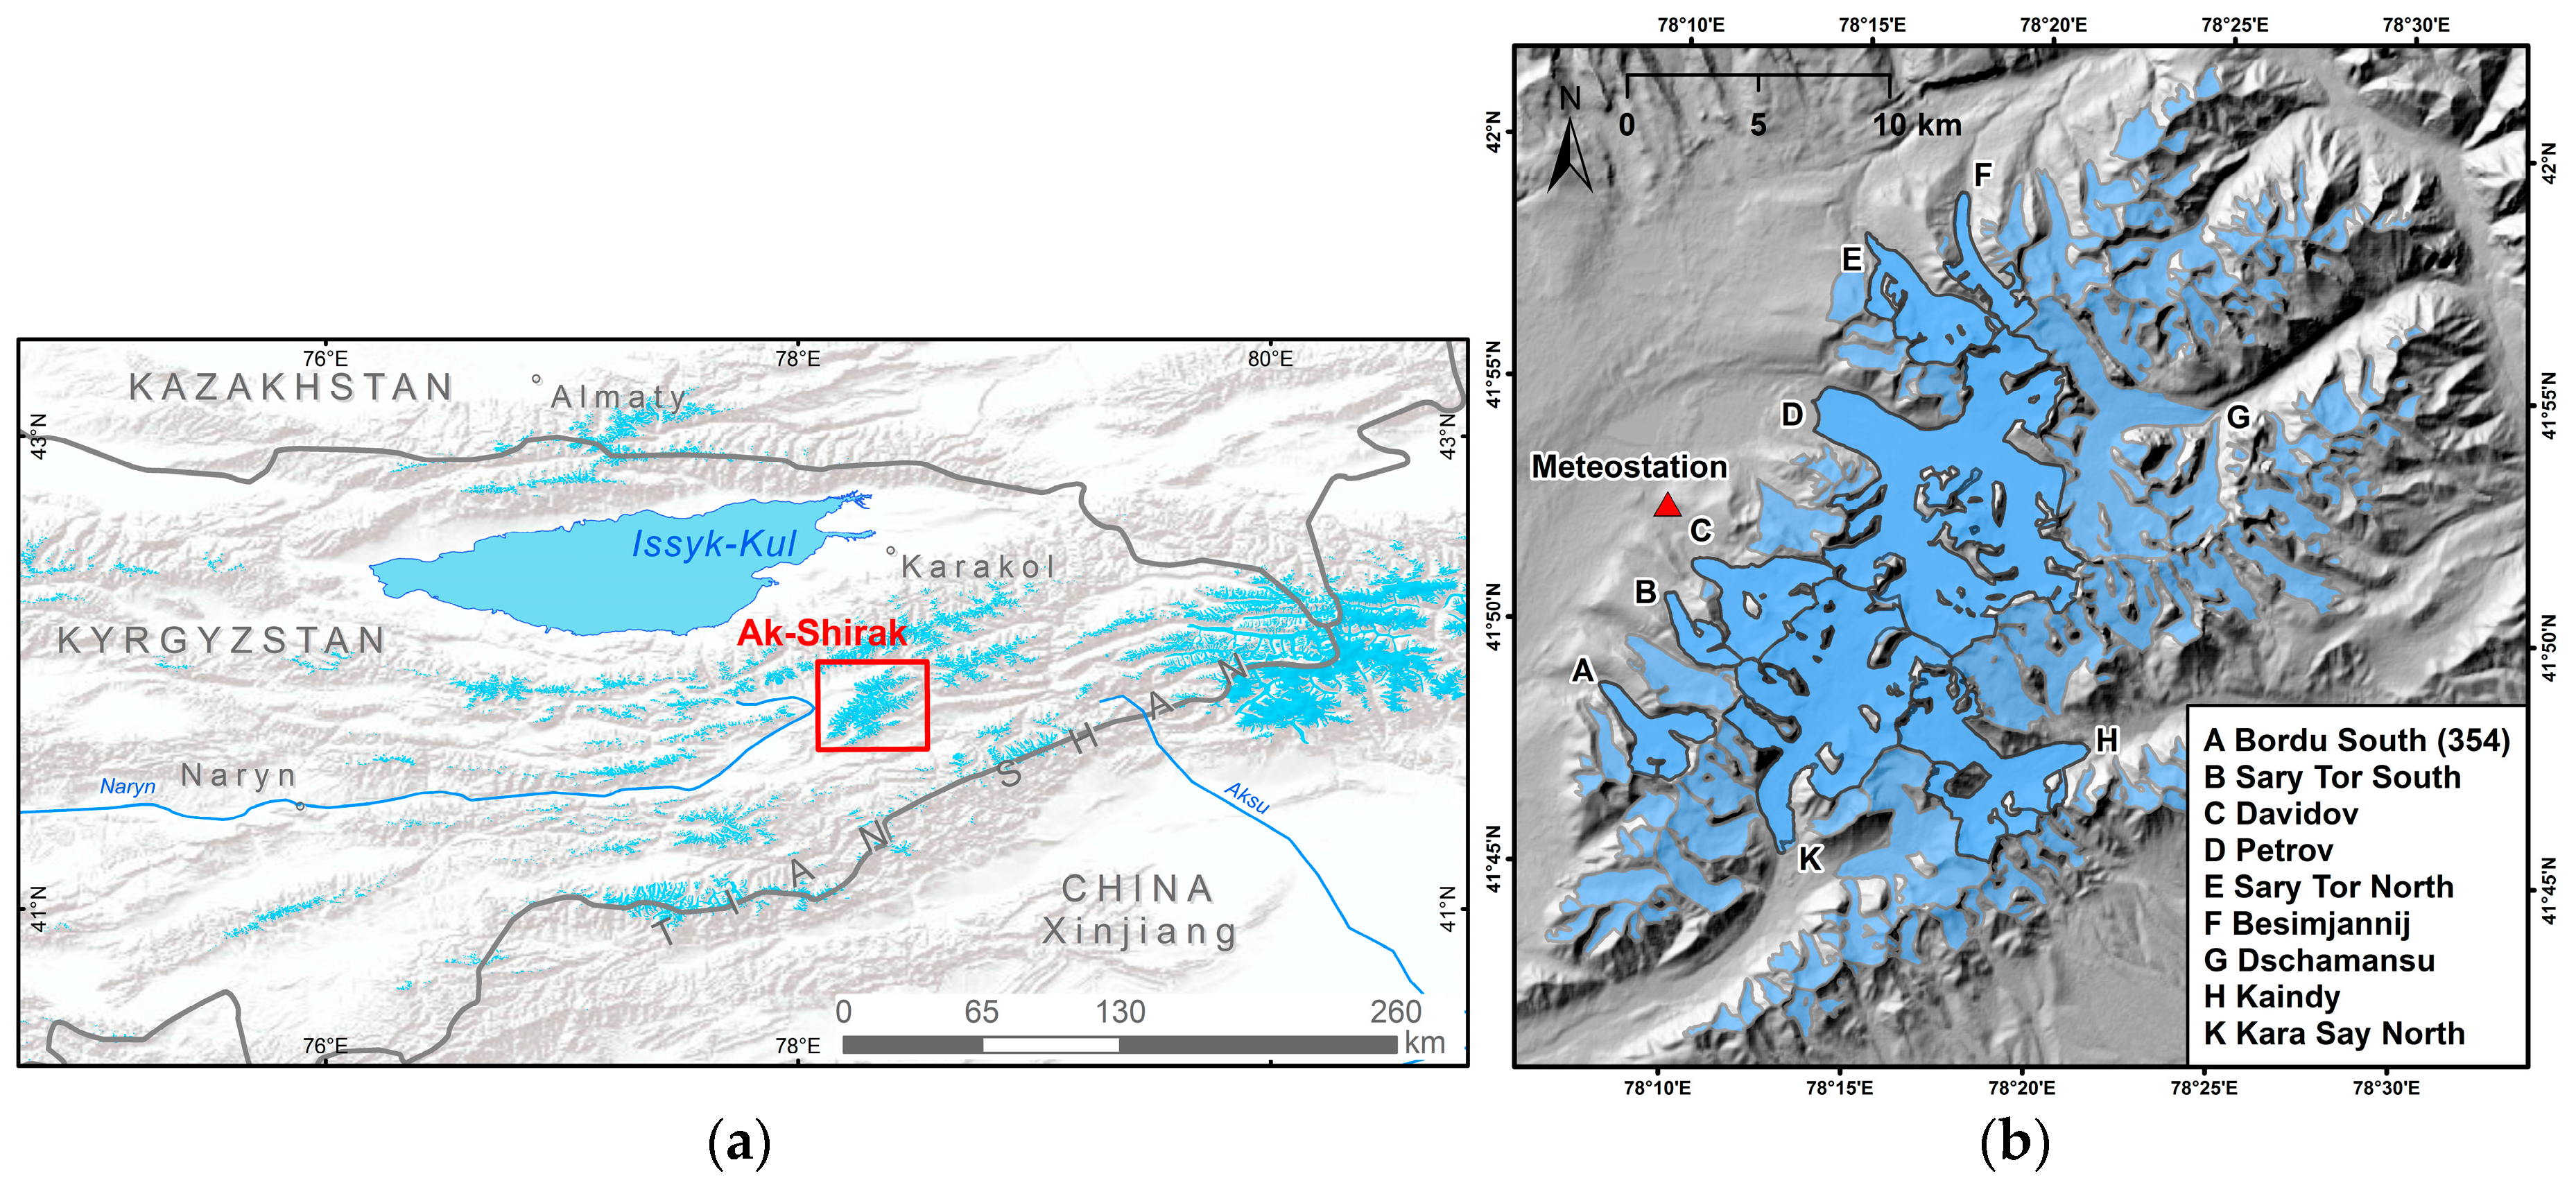
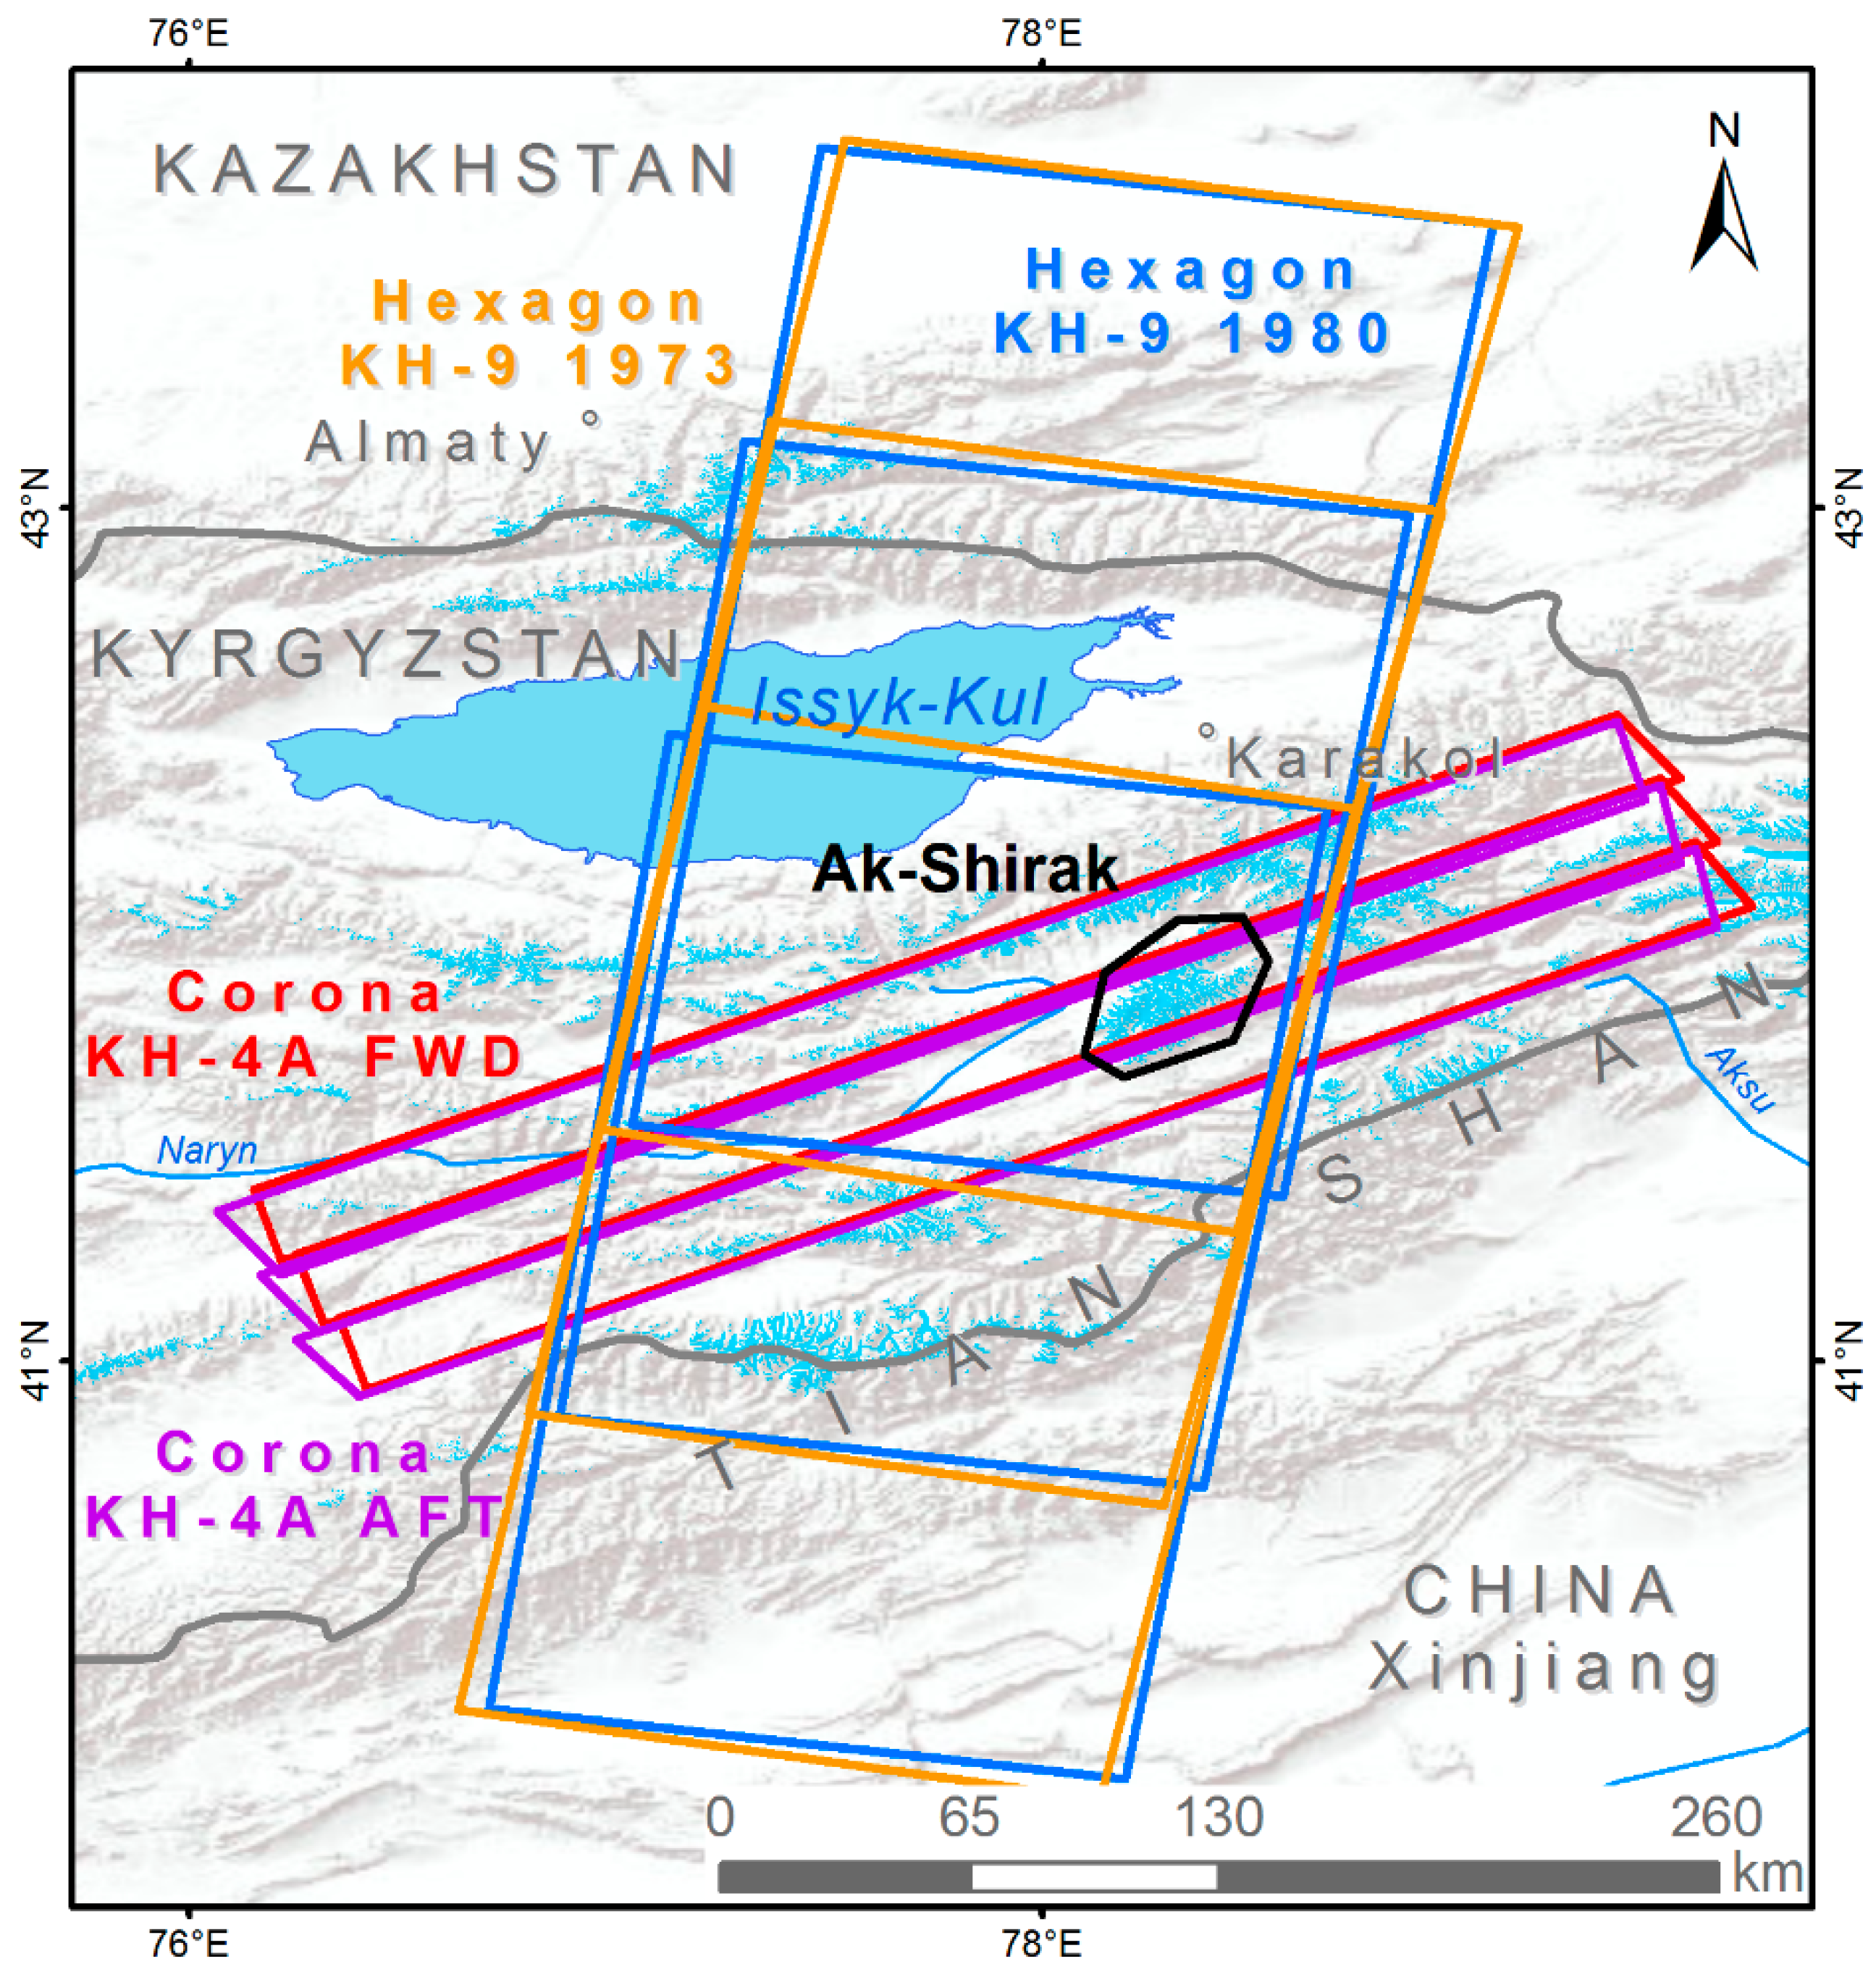
48]. In this specific case, we did not apply any seasonal corrections because the Ak-Shirak is situated in an arid region (mean annual precipitation measured at Tian Shan station ~320 mm, elevation 3614 m a.s.l.,
Figure 1) with precipitation maximum in summer and very low precipitation [
8] in winter. Additionally, the acquired scenes show no visible differences in snow cover (
Supplementary Materials Figure S2) and thus the seasonal effect is within the estimated uncertainty.
Besides data handling difficulties mentioned above, there is a high potential for the use of declassified Corona imagery for glacier research [
20,
21,
22,
23,
24,
46] but also on many other research fields like archaeology [
16,
17,
49] or surficial mass movements [
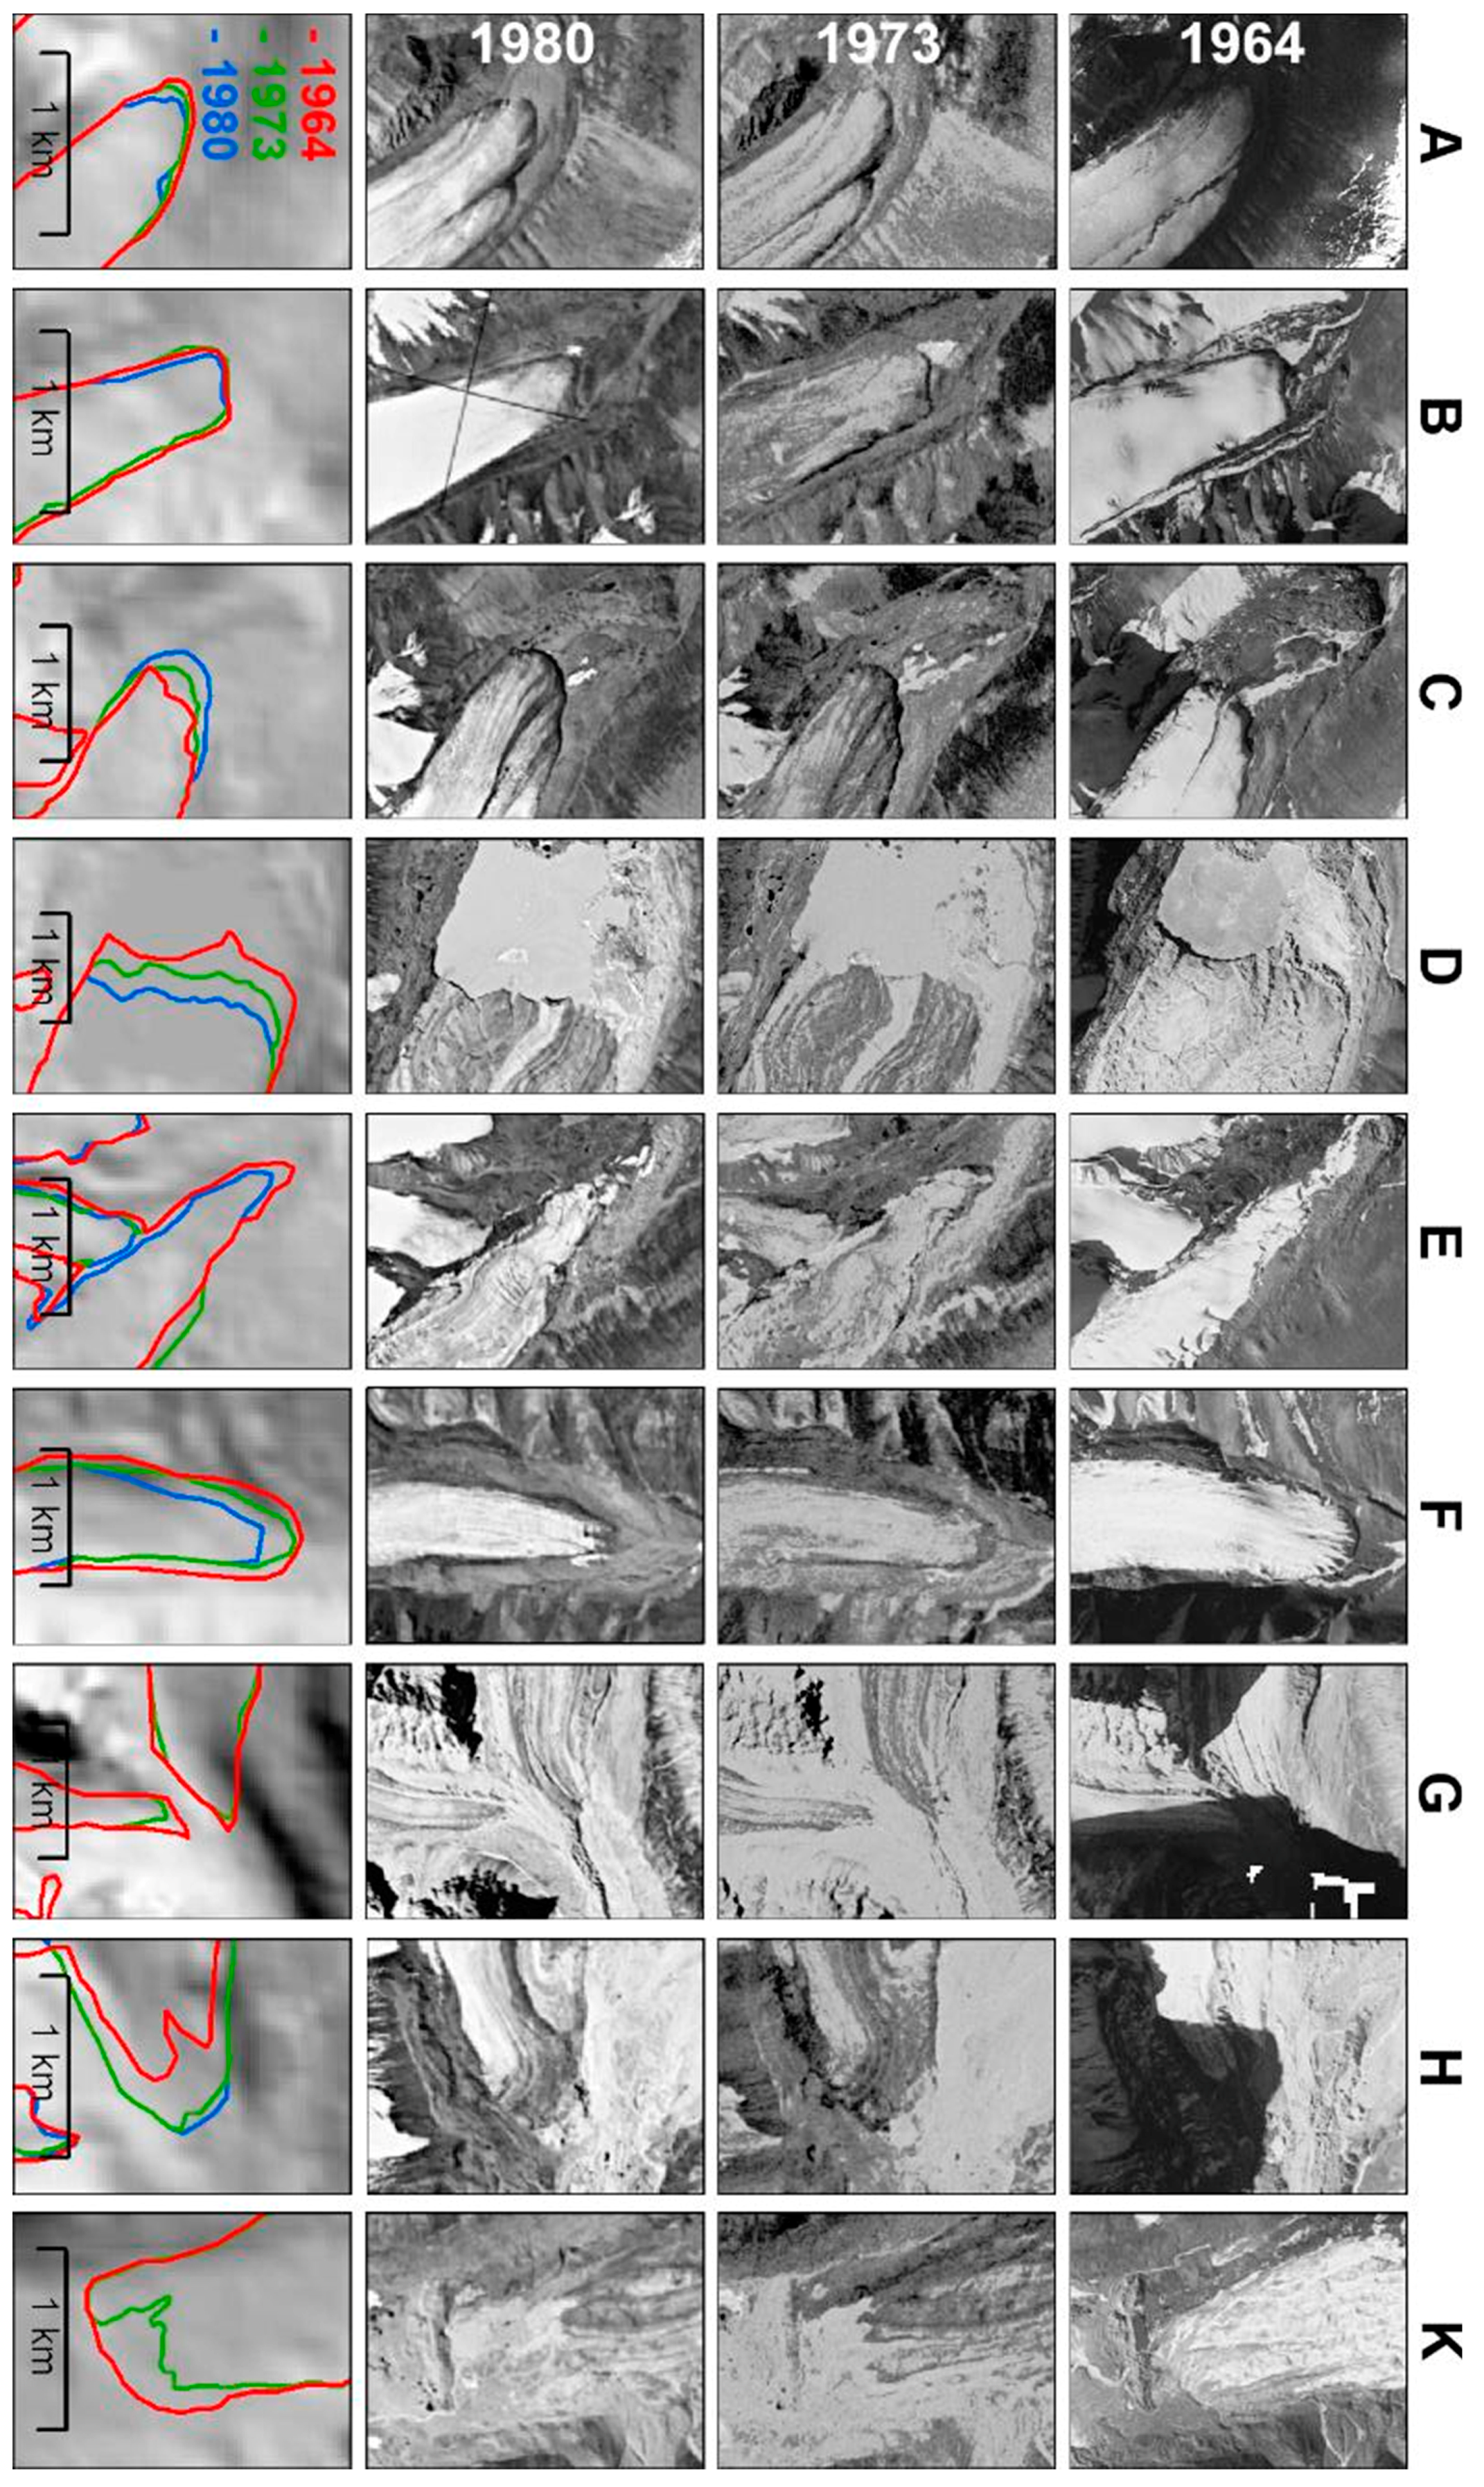
50]. The major advantage of our processing line is a true orthorectification of the highly-distorted Corona reconnaissance imagery resulting in higher precision in comparison to previous studies, which simplifies feature detection (e.g., for archaeology) and surface change detection. As displayed in
Figure 8, the high resolution of the KH-4A and KH-9 images reflect in general far more details of glacier surface structures and landforms than more recent freely available data such as Landsat images. Moreover, glacier volume changes, glacier velocities [
51] and speed up events can be detected by the huge number of scenes, which are available for the Central Asian mountain regions and could lead to unexpectedly dense multi-temporal time series with high spatial resolution.
4.2. Mass Budget
We found negative mass budgets for both analysed periods while the annual values for the period from 1964 to 1973 are comparable (−0.4 ± 0.2 m·w.e.a
−1) to the 1964–1980 period (−0.4 ± 0.1 m·w.e.a
−1). The negative values are generally in agreement with Aizen et al. [
10] who analysed the period from 1943 to 1977 based on aerial photographs and found glacier surface elevation lowering rates of −0.24 ± 0.12 m·a
−1 equivalent to −0.20 ± 0.10 m·w.e.a
−1 with the ice density parameters assumed in our study. However, our values for the 1964–1980 period are more negative. Although we expected an increase in glacier mass loss for the entire observation period due to a slight temperature increase and precipitation decrease recorded by the nearby Tian Shan meteorological station [
52] (for location see
Figure 1), the trend does not lead to a significant increase of the mass loss. Pieczonka and Bolch [
5] found similar negative mass budget rates of 0.51 ± 0.25 m·w.e.a
−1 for the period from 1975 to 1999. Gardner et al. [
53] found mass loss of 0.49 ± 0.08 m·w.e.a
−1 between 2003 and 2009 for the entire Tien Shan; however, mass loss in the Central Tian Shan is lower compared to the outer ranges [
3,
53].
A glacier-specific analysis reflects a different situation with an increasing mass loss for the time after 2003. Kronenberg et al. [
26] found mass changes for Bordu South Glacier (No. 354) of −0.43 ± 0.09 m·w.e.a
−1 from 2003 to 2012, which are higher than our calculated mass budgets from 1964–1980 (−0.3 ± 0.1 m·w.e.a
−1). All other individual glaciers show maximum mass loss rates of 0.9 ± 0.6 m·w.e.a
−1 until 1973 with a subsequent loss to 0.7 ± 0.2 m·w.e.a
−1 until 1980. Dschamansu Glacier with its terminus situated at 3660 m and an eastern aspect and displays the strongest absolute mass loss of 11.4 ± 3.9 m w.e. between 1964 and 1980. Regarding the observed length changes, Kara-Say North Glacier, on the other hand, showed a decelerating retreat rate. Besimjannij, Sary-Tor North and Petrov glaciers had the highest negative rates up to −33.5 ± 2 m·a
−1 whilst Besimjannij Glacier seemed to be in the retreat phase after a surge and Petrov Glacier calves in a large proglacial lake (
Figure 8), both favouring terminus retreat [
54]. The glaciers classified here as surge-type glaciers were also mentioned in other studies [
6,
7].
For Sary-Tor South Glacier, our mass budget rates of −0.3 ± 0.4 m·w.e.a
−1 between 1964 and 1980 agree with Kuzmichenok [
55] and Petrakov et al. [
56]. For the period from 1943 to 1977 they found values of −0.48 m·w.e.a
−1, respectively. Furthermore, the −0.3 ± 0.4 m·w.e.a
−1 found here for Sary-Tor South (1964–1980) are within the uncertainty range of mass budget measurements taken from 1985 to 1989 at the same glacier (−0.14 m·w.e.a
−1) [
57].
Finally, we found out that glaciers in the Ak-Shirak massif showed significant mass loss since the 1960s accompanied by a glacier retreat on average. Particularly Petrov and Kara-Say North glaciers showed strong retreats up to 24.2 ± 2.6 m·a−1 between 1964 and 1973 and corresponding elevation lowering rates.


