
Stratified Template Matching to Support Refugee Camp Analysis in OBIA Workflows


Abstract
:
1. Introduction
2. Material and Methods
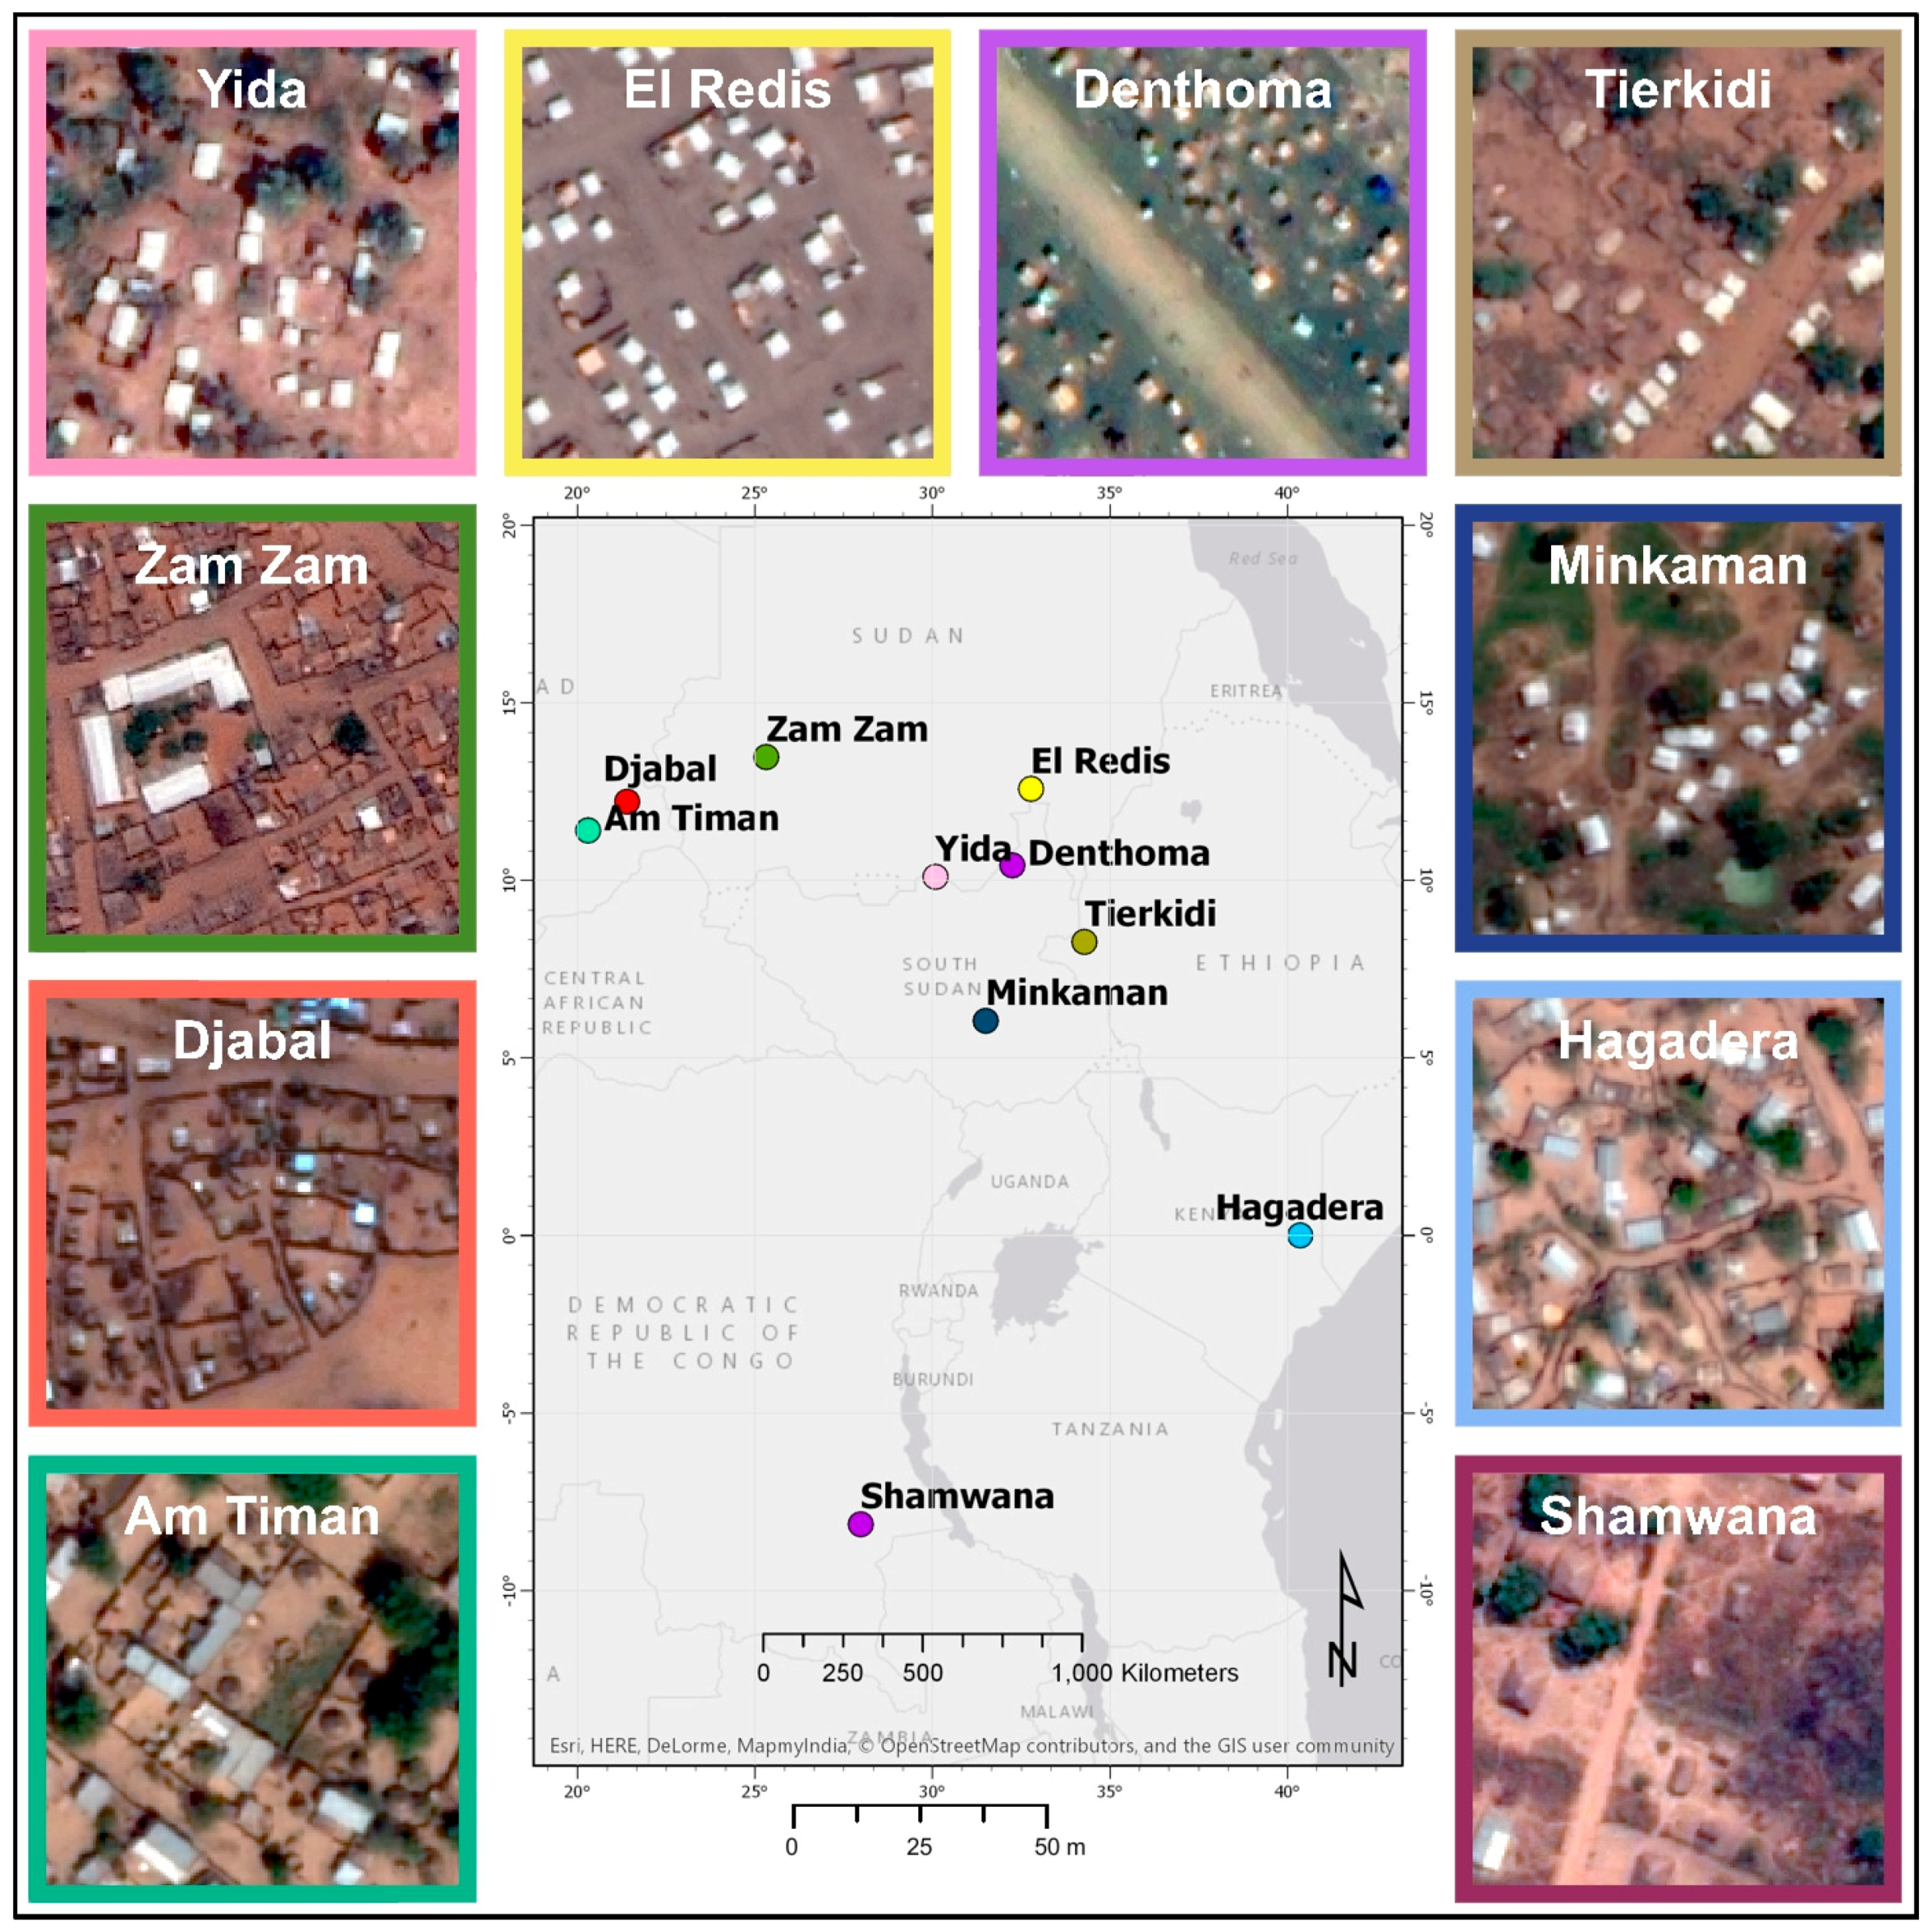
2.1. Study Area and Data
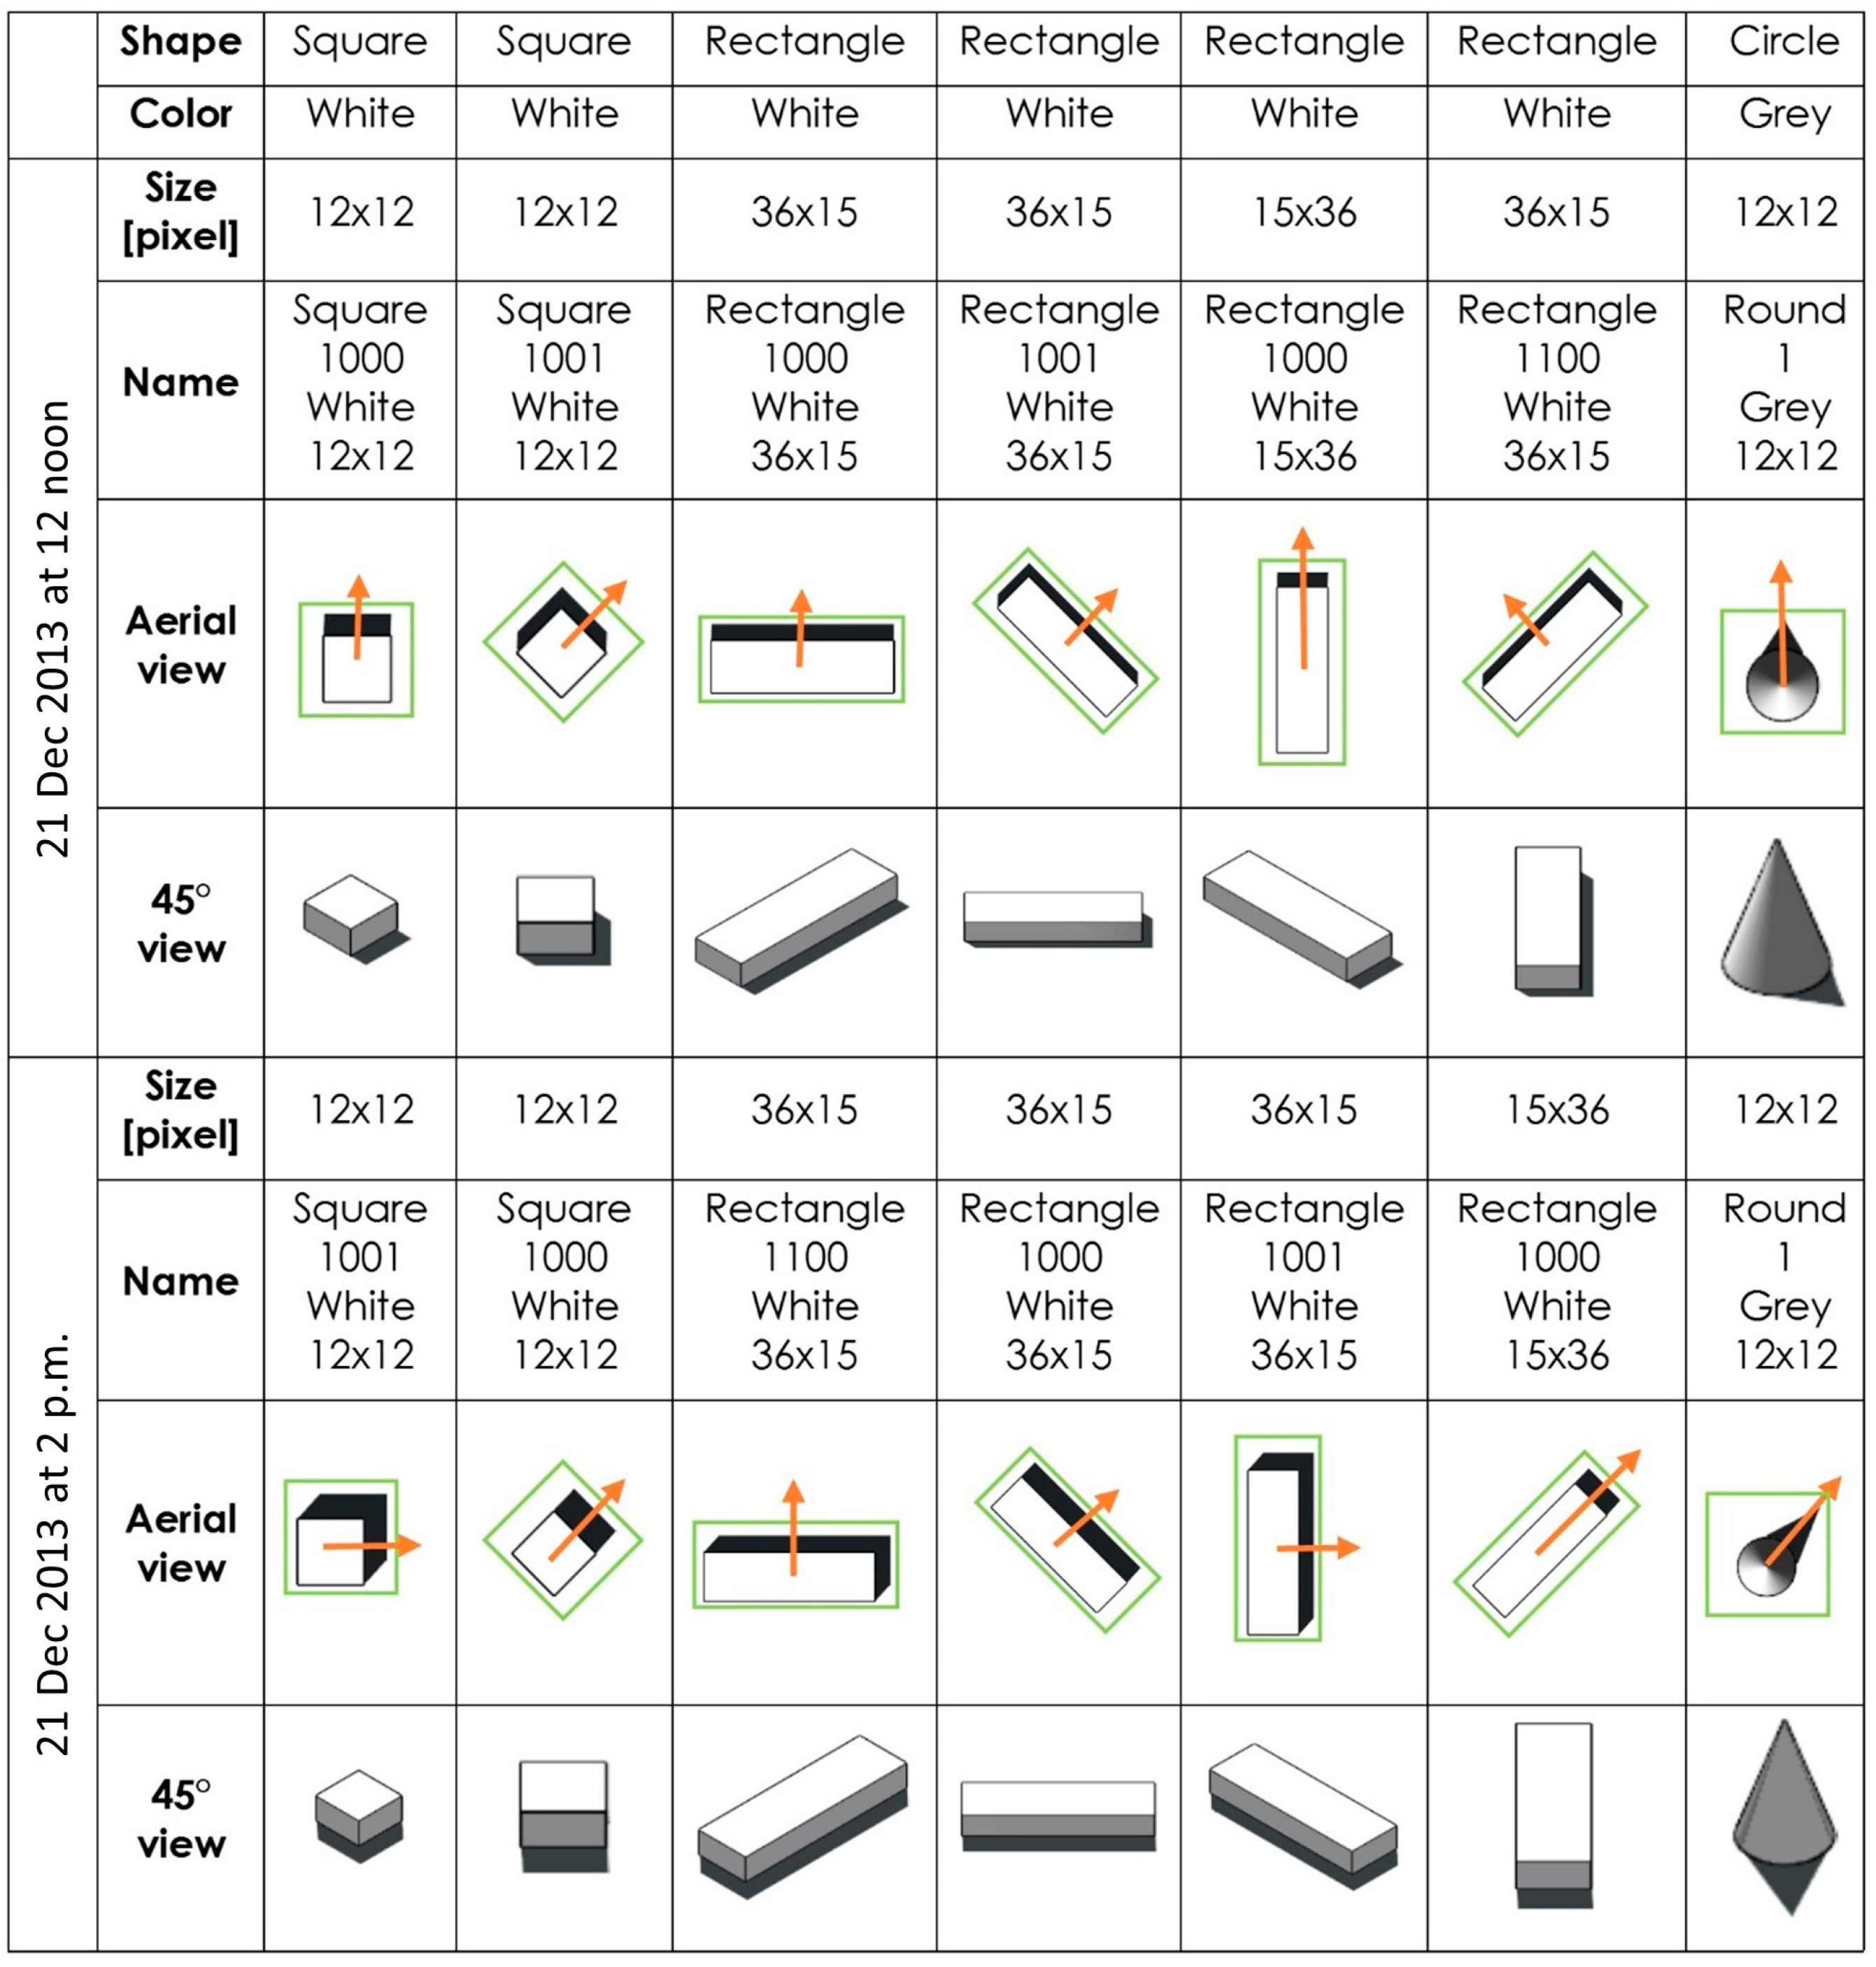
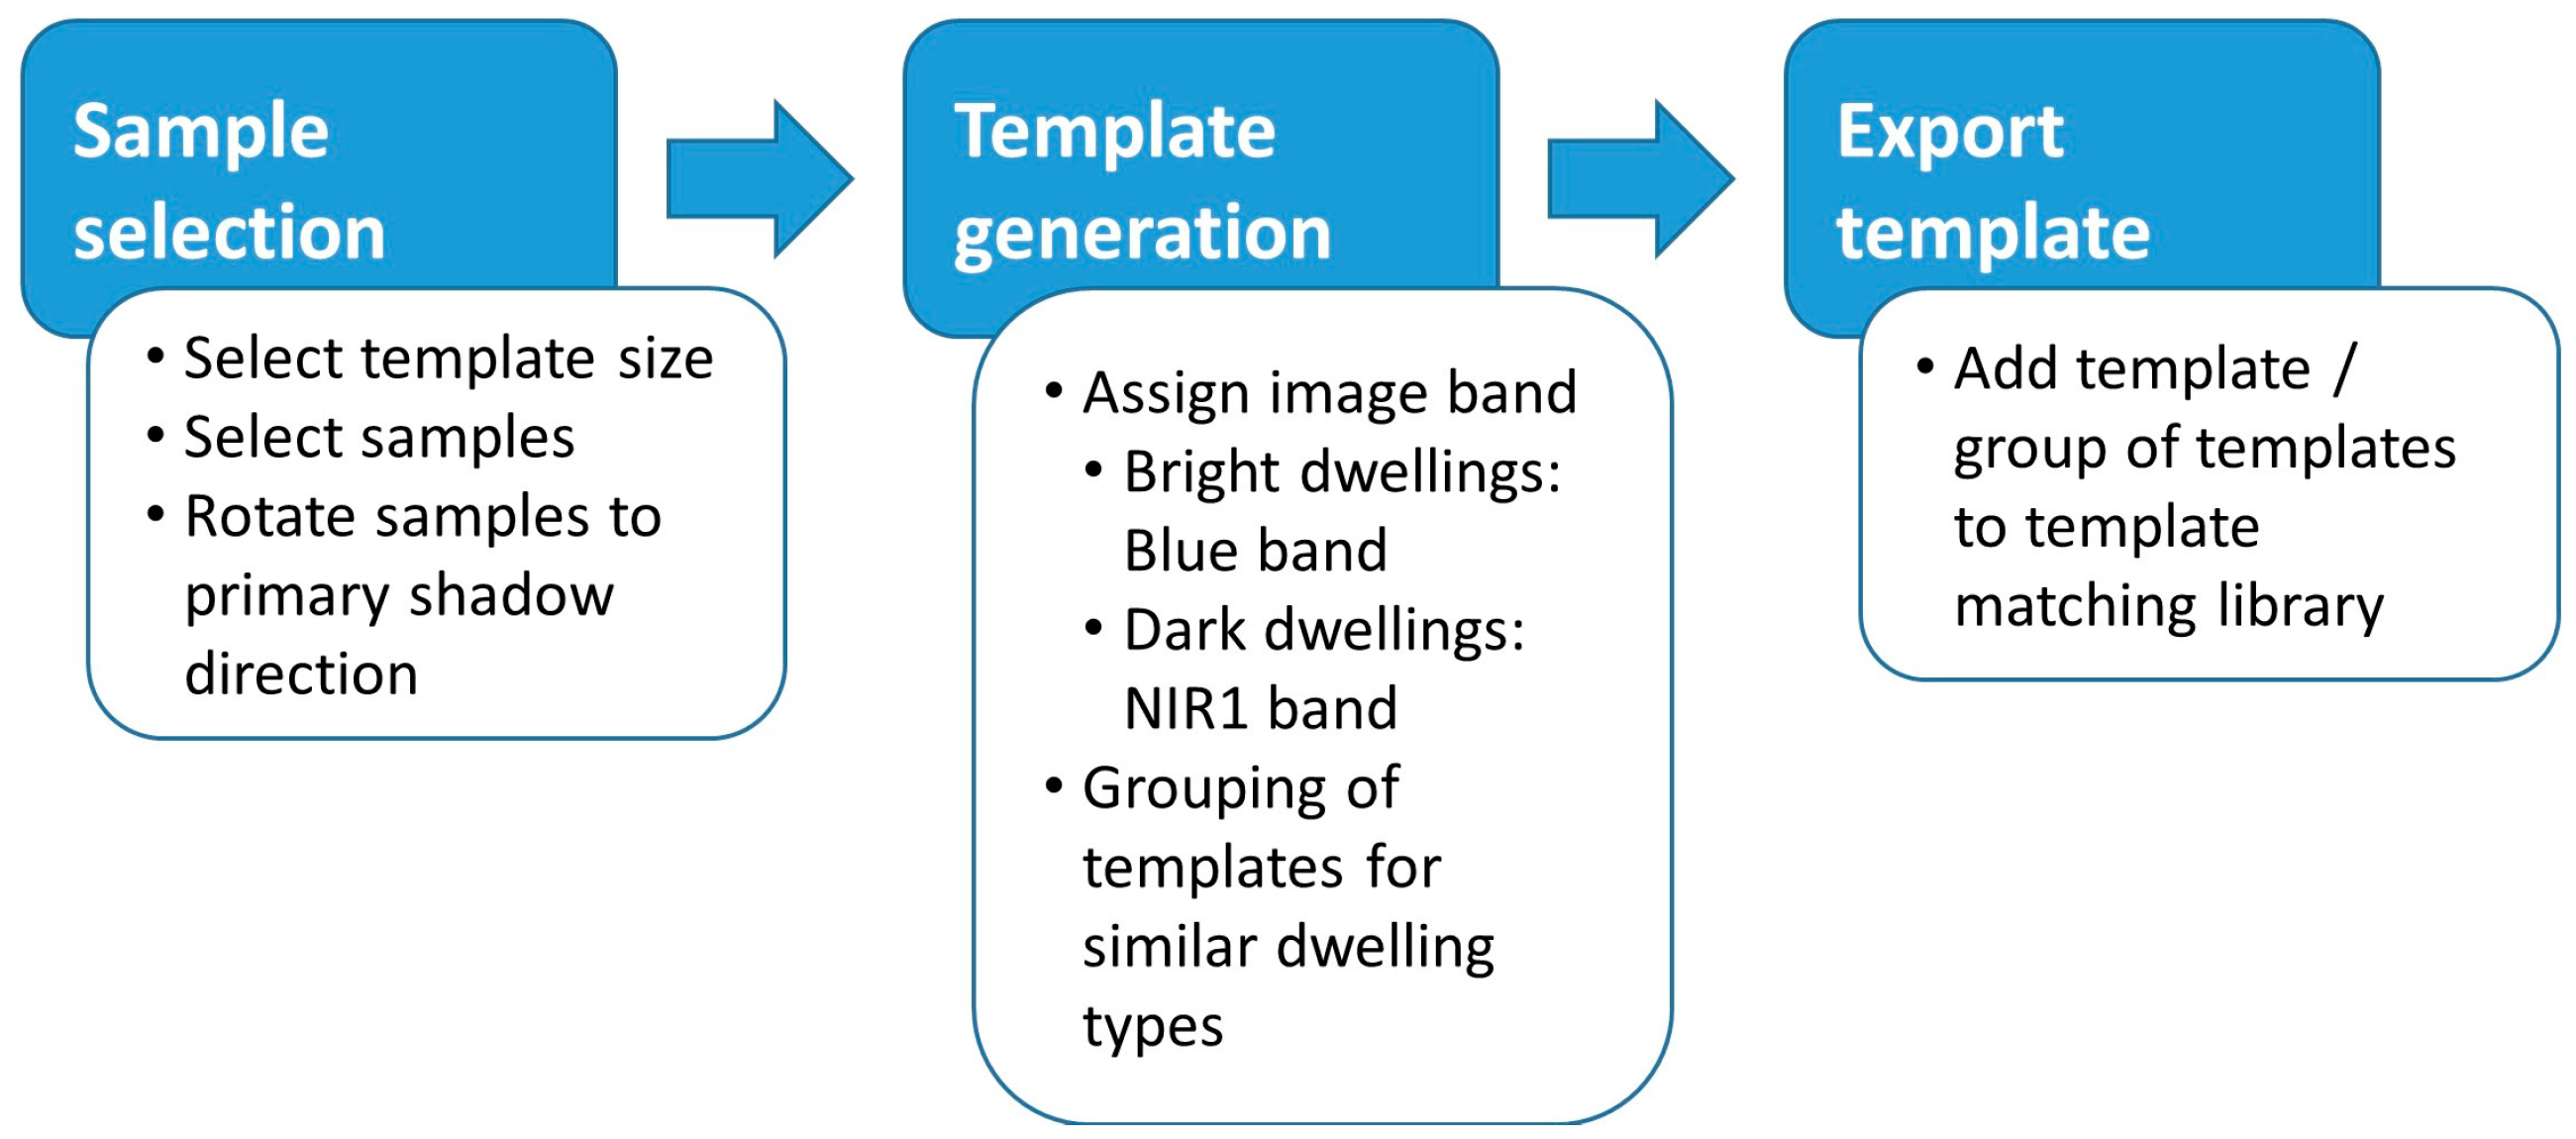
2.2. Template Matching Library
2.2.1. Dwelling Shape
2.2.2. Template Size
2.2.3. Dwelling Brightness
2.2.4. Shadow Direction
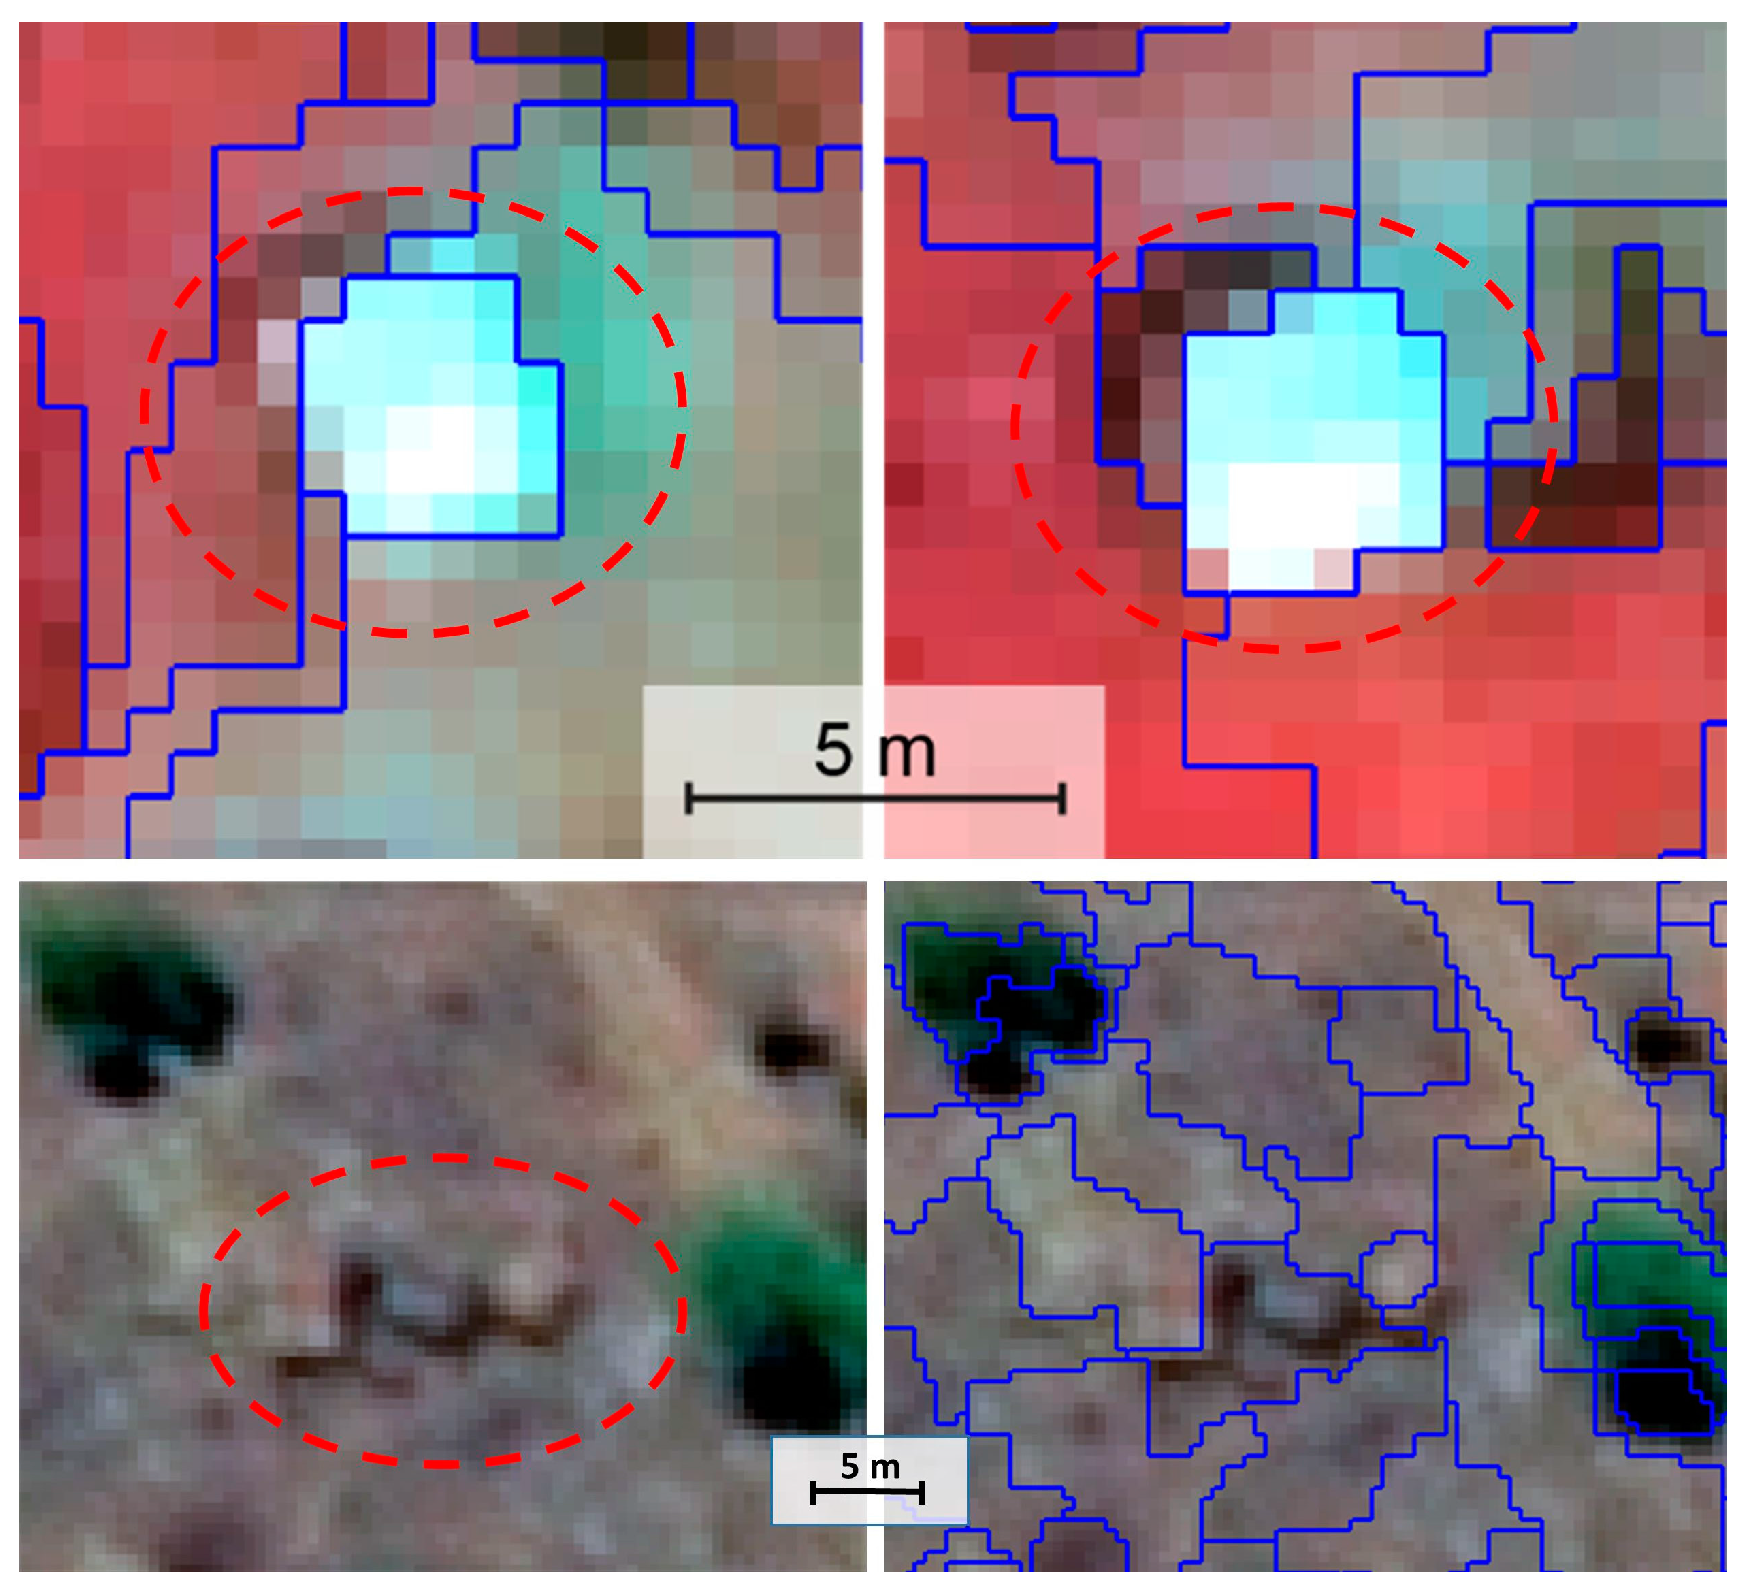
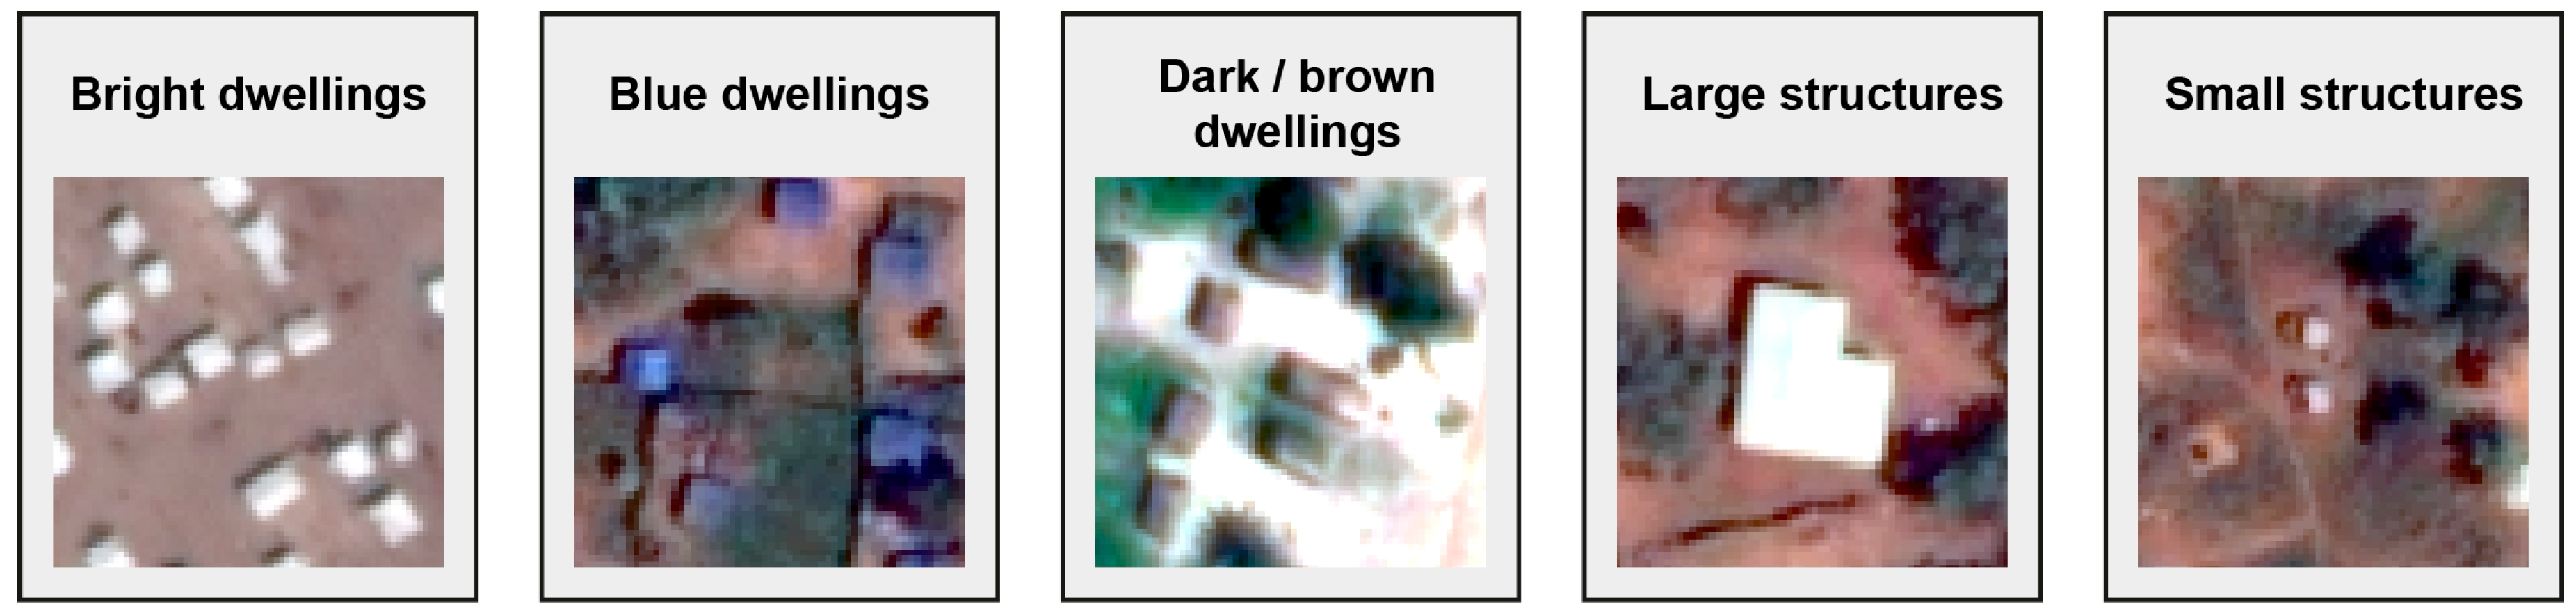
2.3. Application of the Template Matching Library
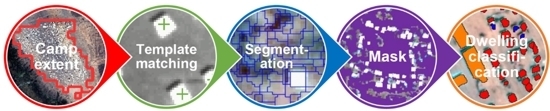
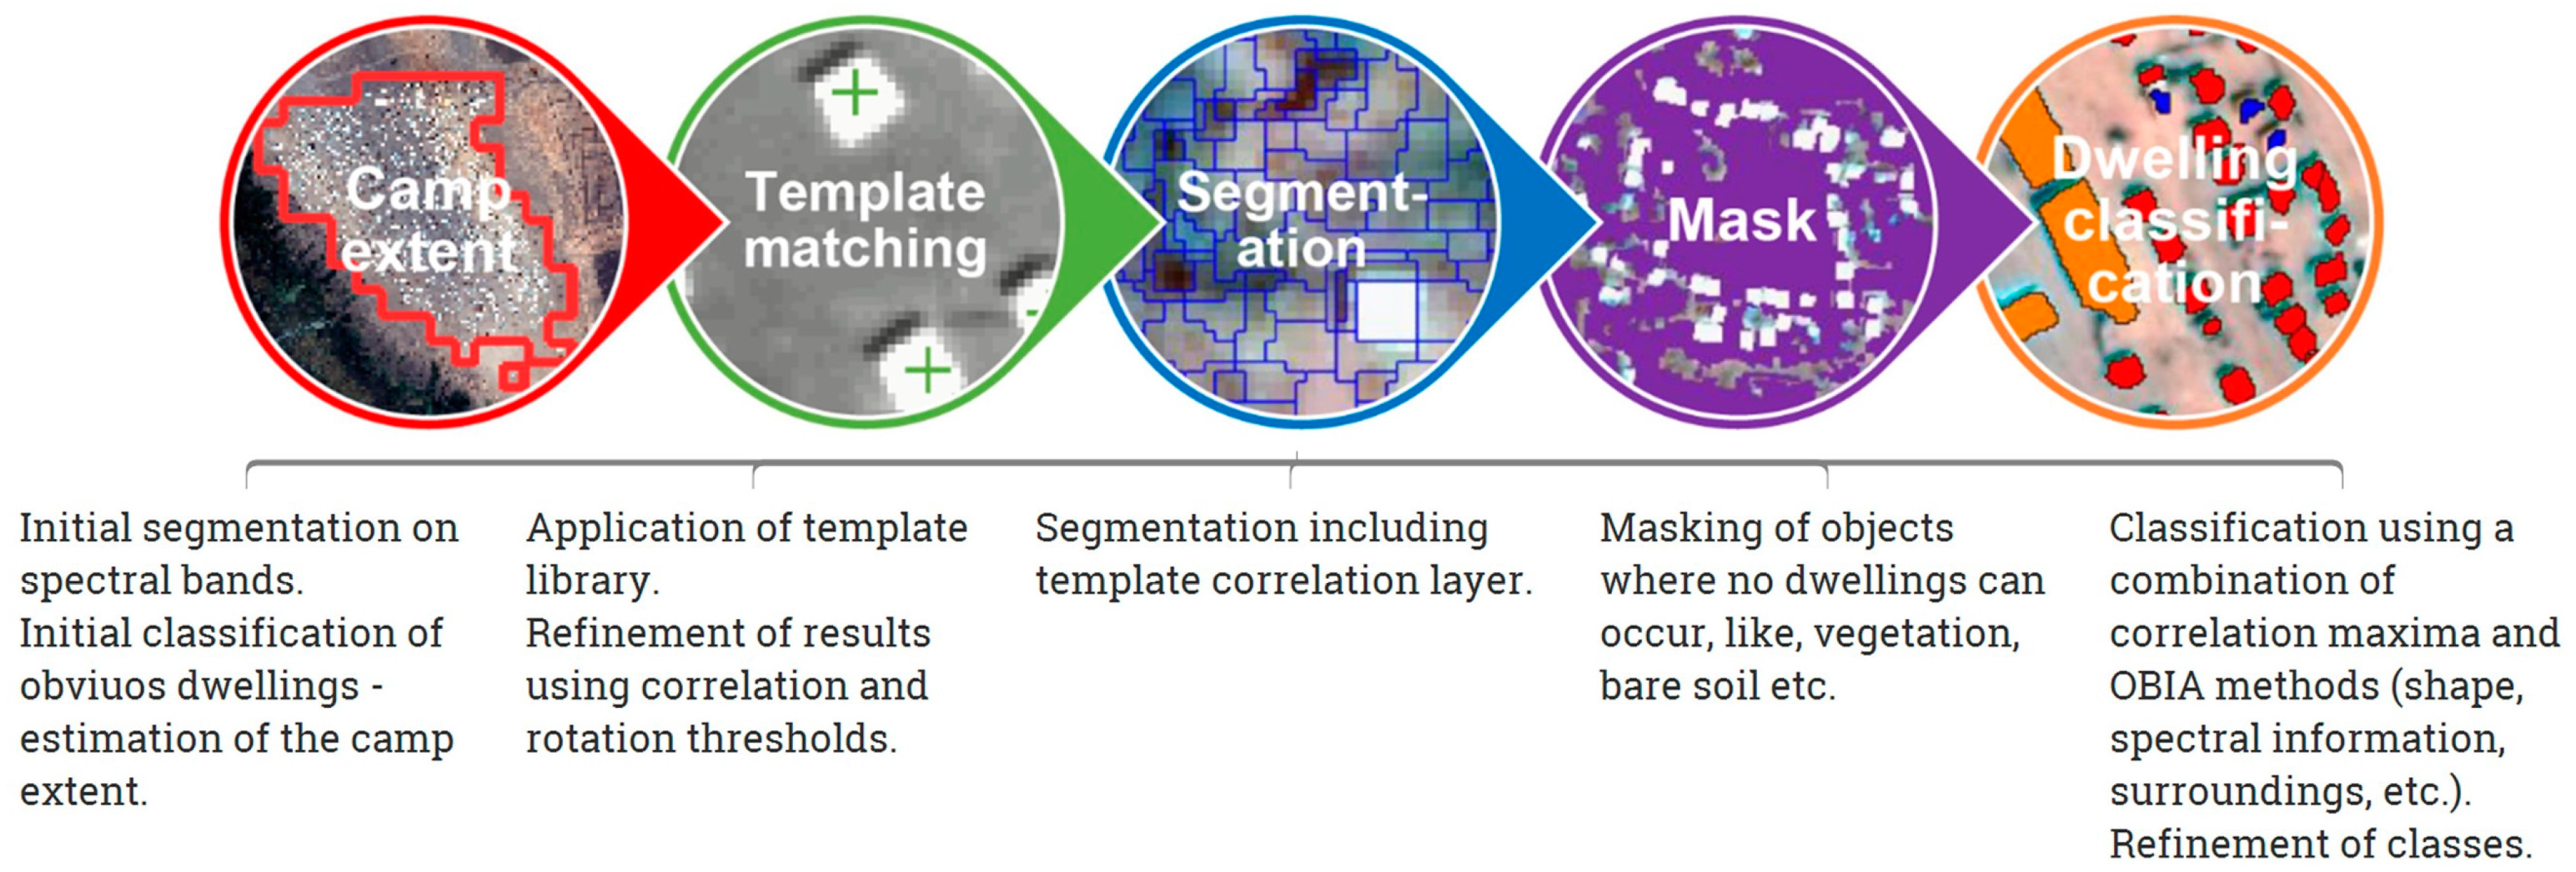
2.4. Integration of Template Matching in an Object-Based Image Analysis Workflow
3. Results and Discussion
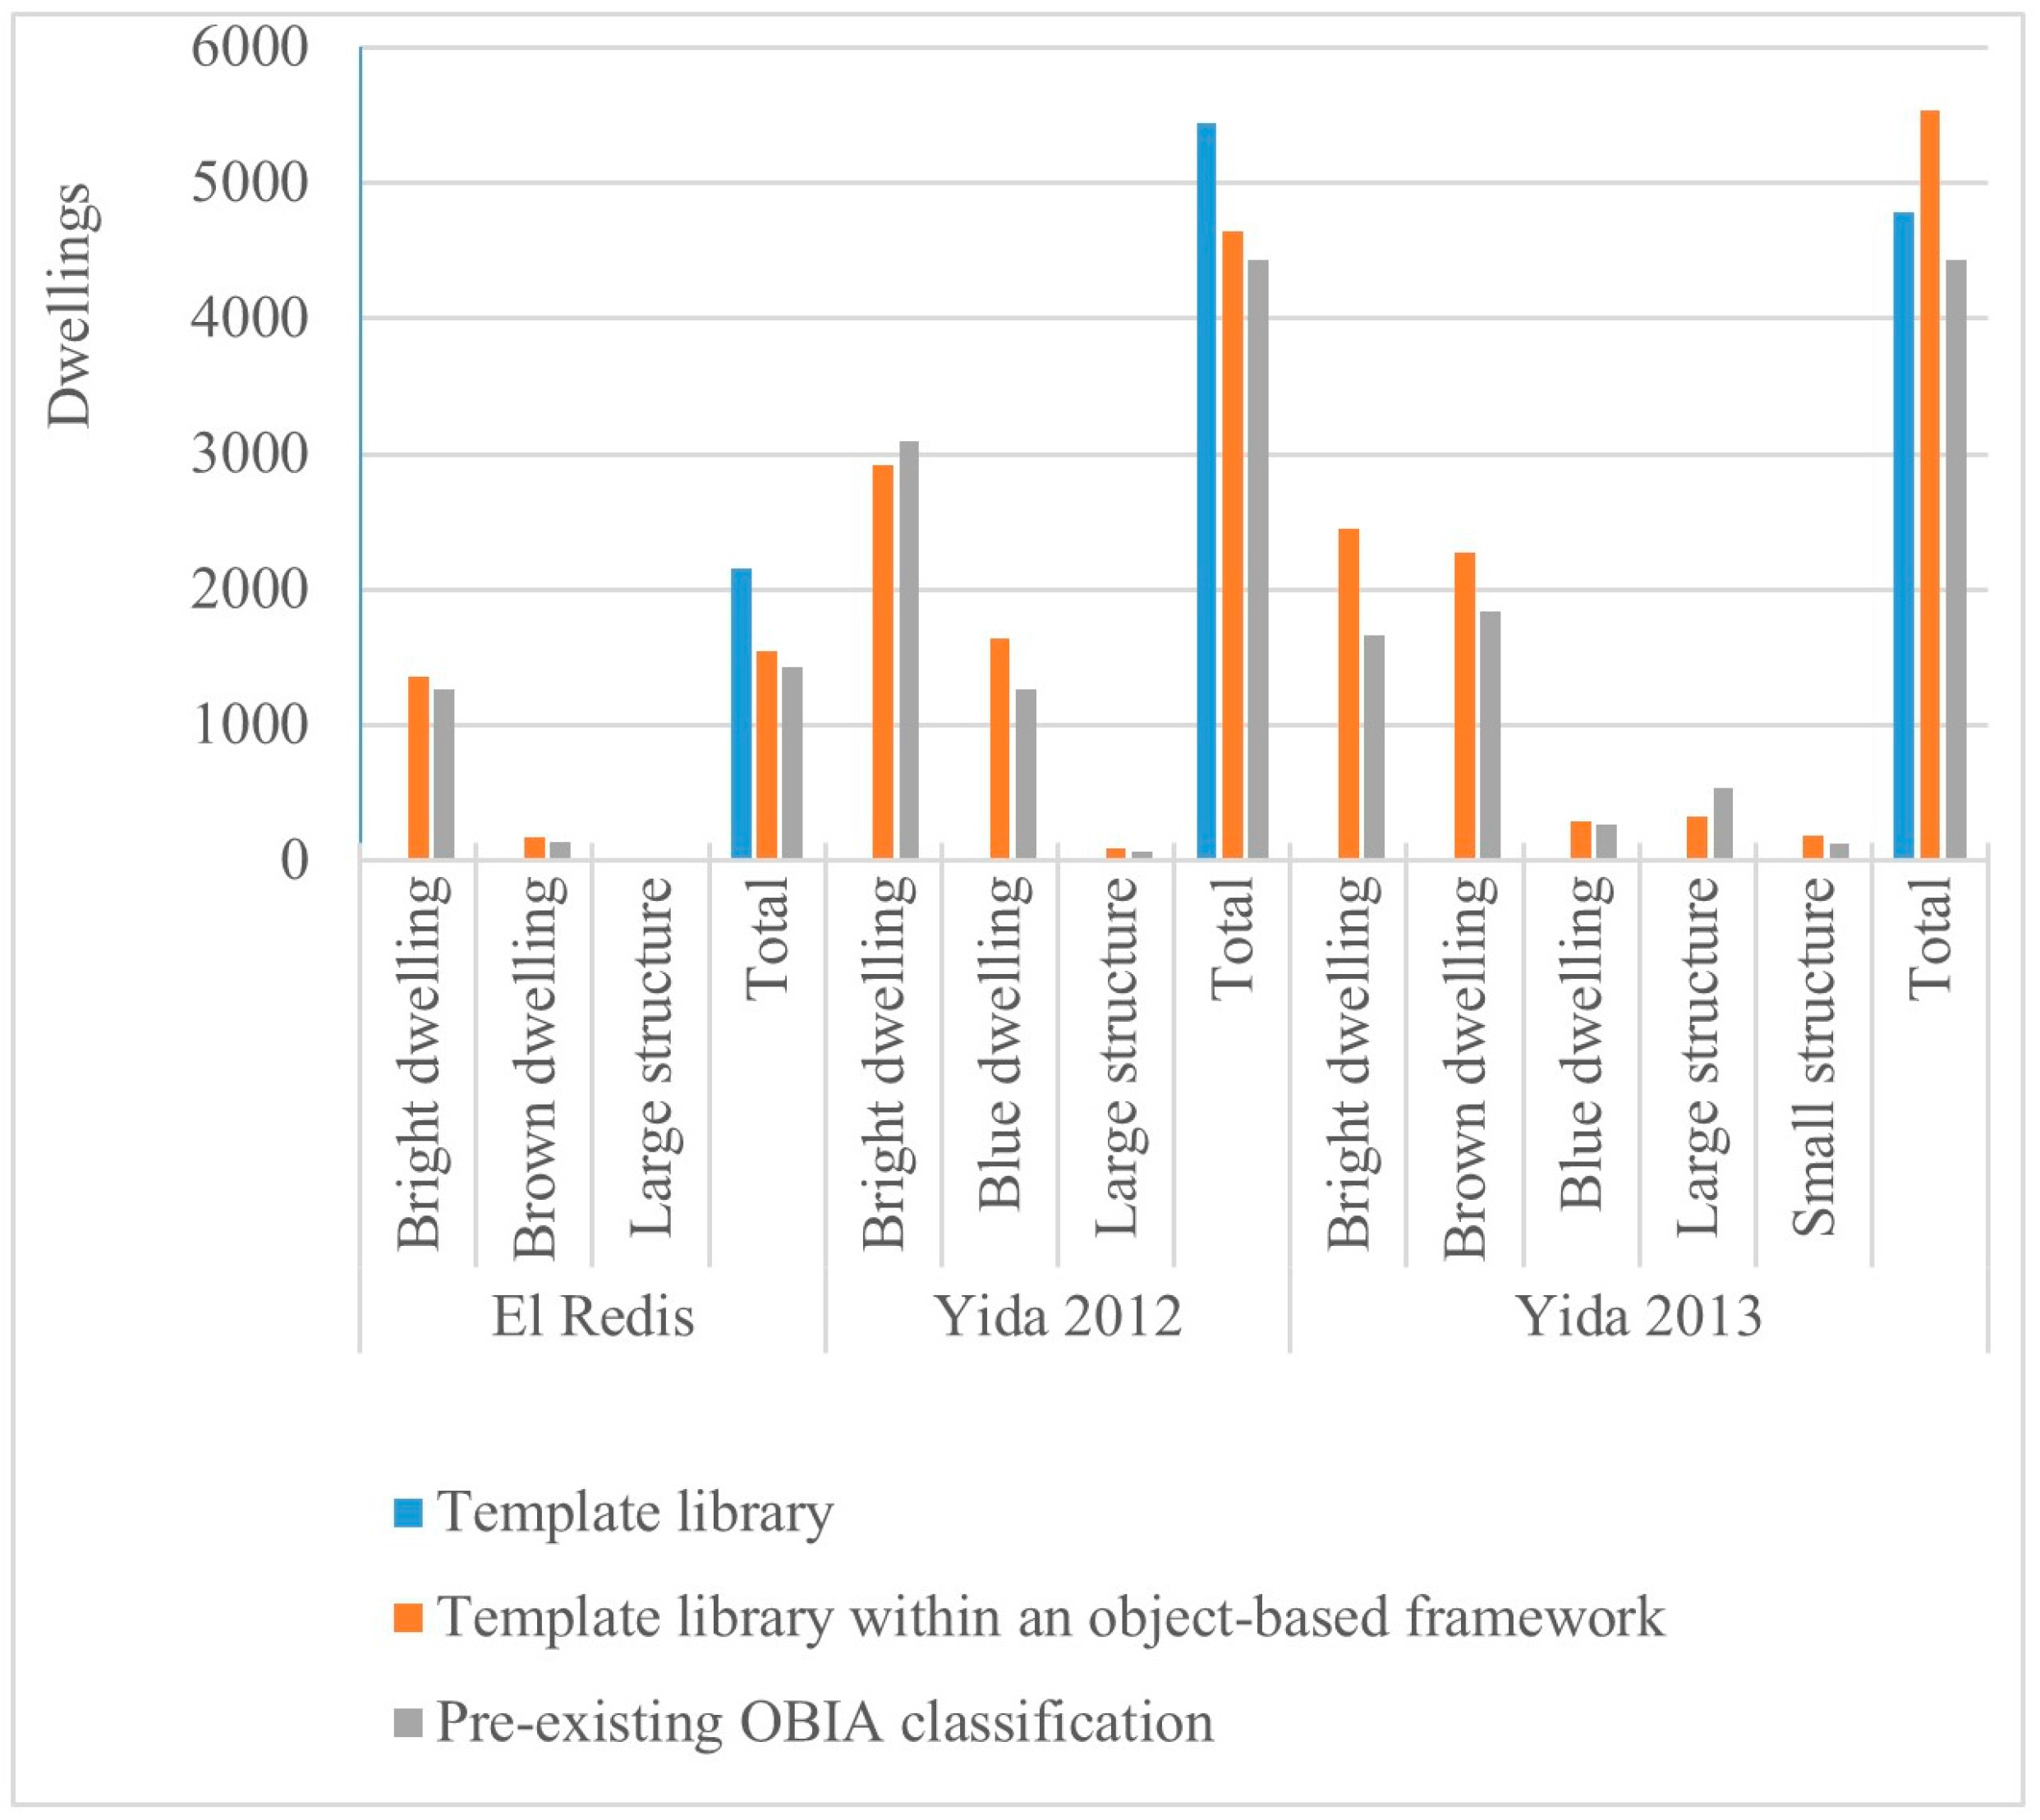
3.1. Results for the Three Test Images
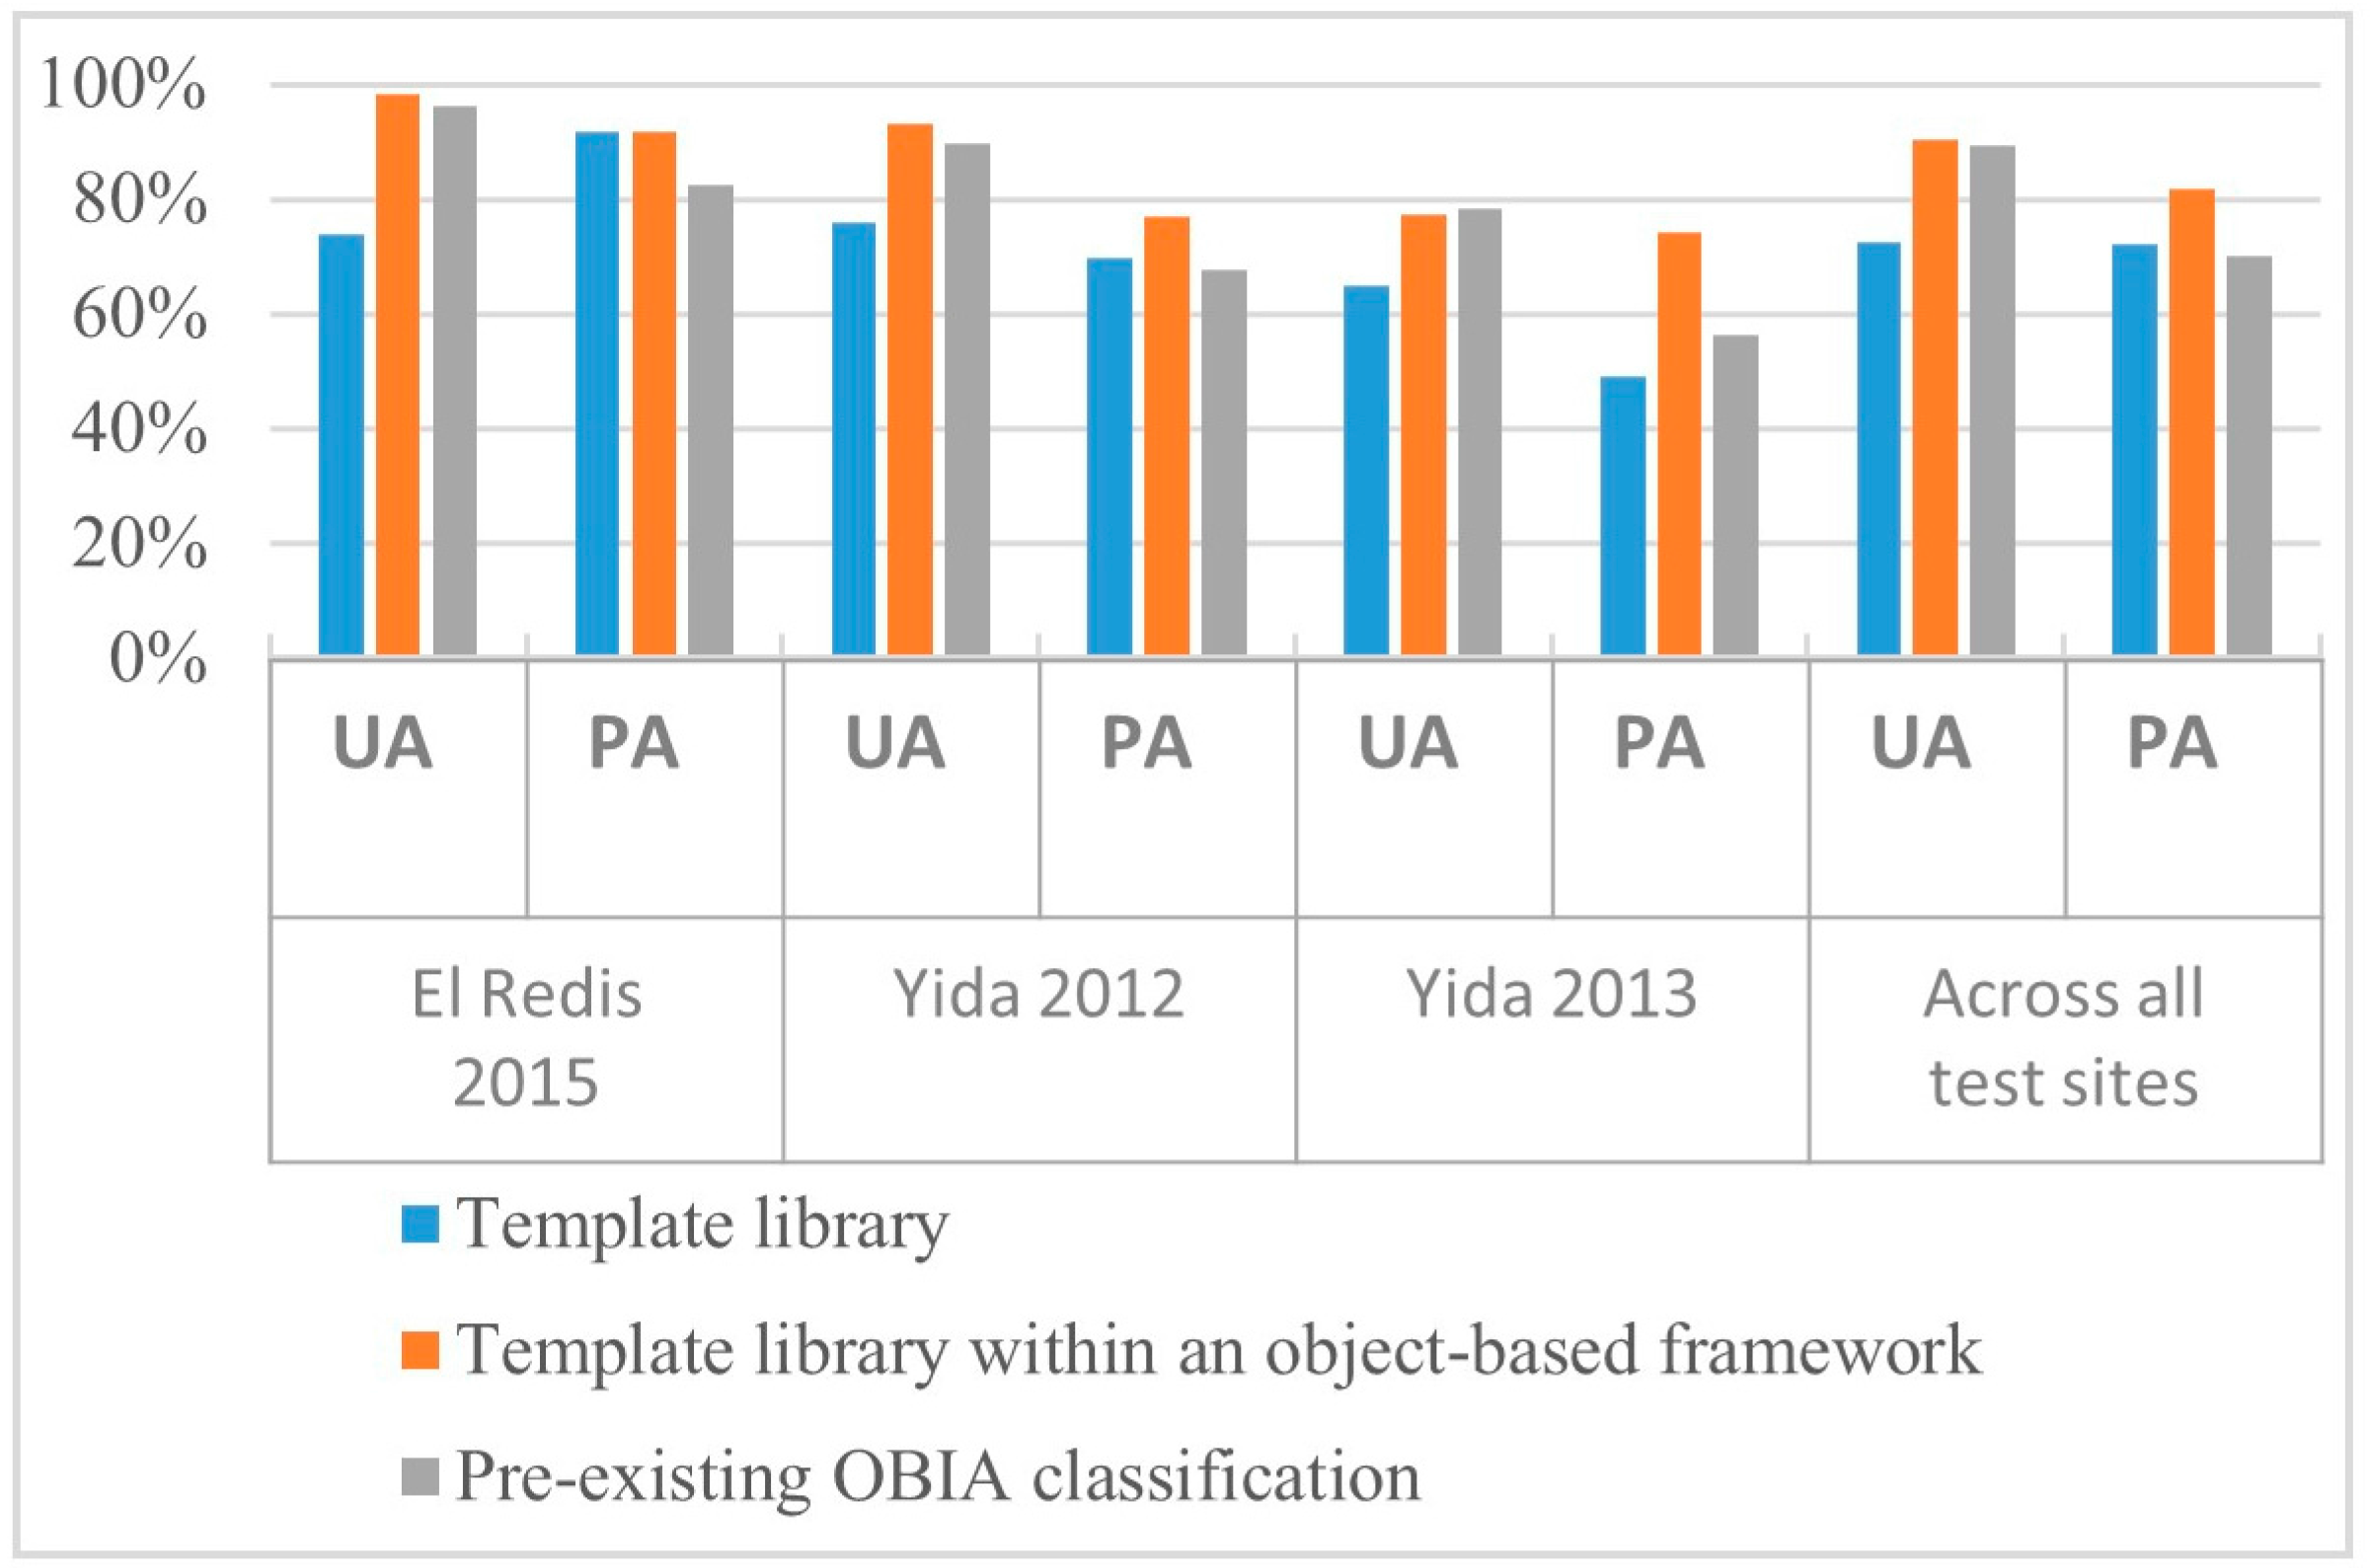
3.2. Accuracy Assessment
3.2.1. Accuracy Assessment: Not Differentiated between Dwelling Types
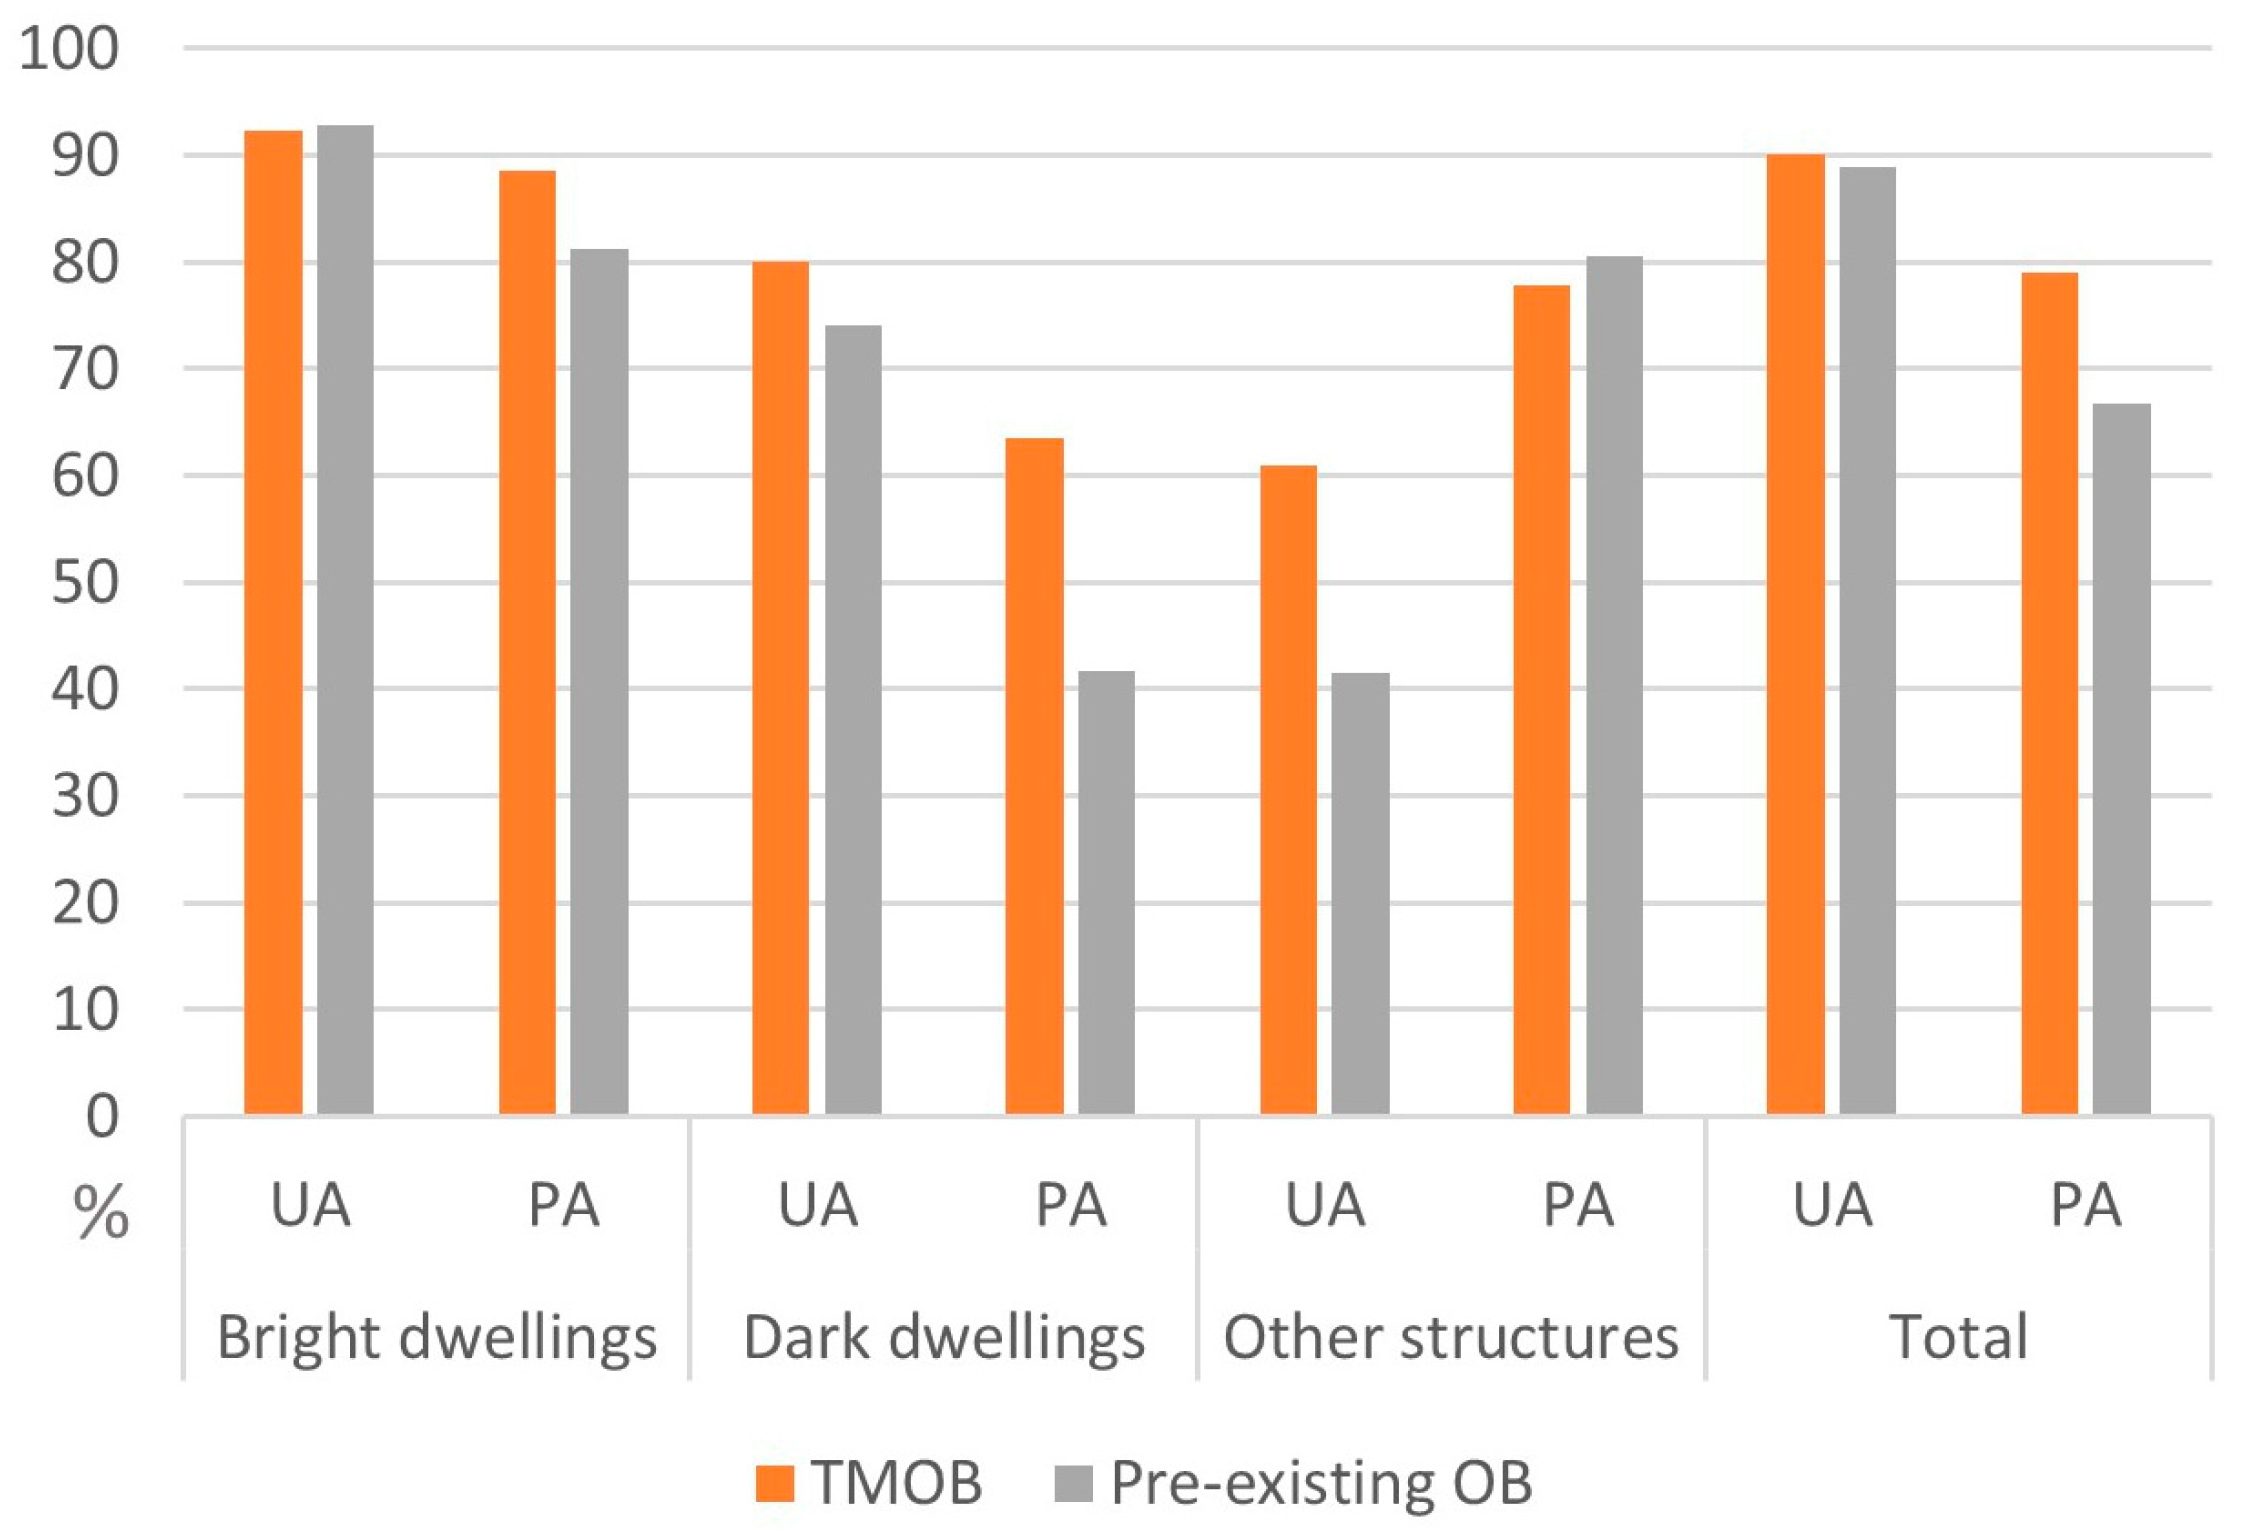
3.2.2. Accuracy Assessment: Differentiated between Dwelling Types
4. Conclusions
- (i)
- The extraction rate in difficult (e.g., low contrast, dense dwellings) situations can be improved by incorporating the shadow effect of a dwelling in a template library;
- (ii)
- It is possible to establish a general template matching library for dwellings to be applied in similar conditions;
- (iii)
- The combination of template matching with OBIA methods (stratification) can enhance the accuracy of dwelling extraction compared to template matching solely.
Acknowledgments
Author Contributions
Conflicts of Interest
References
- UNHCR Global Trends. Forced Displacement in 2015. Available online: http://www.unhcr.org/news/latest/2016/6/5763b65a4/global-forced-displacement-hits-record-high.html (accessed on 26 December 2016).
- Füreder, P.; Lang, S.; Rogenhofer, E.; Tiede, D.; Papp, A. Monitoring Displaced People in Crisis Situations Using Multi-temporal VHR Satellite Data During Humanitarian Operations in South Sudan. In Proceedings of the GI_Forum 2015—Geospatial Minds for Society, Salzburg, Austria, 7–10 July 2015; pp. 391–401. [Google Scholar]
- UNHCR Mid-Year Trends 2015. Available online: http://www.unhcr.org/statistics/unhcrstats/56701b969/mid-year-trends-june-2015.html (accessed on 26 December 2016).
- Lang, S.; Tiede, D.; Hölbling, D.; Füreder, P.; Zeil, P. Earth observation (EO)-based ex post assessment of internally displaced person (IDP) camp evolution and population dynamics in Zam Zam, Darfur. Int. J. Remote Sens. 2010, 31, 5709–5731. [Google Scholar] [CrossRef]
- Grundy, C.; Füreder, P.; Siddiqui, R.; Katsuva Sibongwe, D.; Tiede, D.; Lang, S.; Checci, F. Validation of satellite imagery methods to estimate population size. In MSF Scientific Day, 25 May 2012; MSF Association: London, UK, 2012. [Google Scholar]
- Knoth, C.; Pebesma, E. Detecting dwelling destruction in Darfur through object-based change analysis of very high-resolution imagery. Int. J. Remote Sens. 2017, 38, 273–295. [Google Scholar] [CrossRef]
- Tiede, D.; Füreder, P.; Lang, S.; Hölbling, D.; Zeil, P. Automated Analysis of Satellite Imagery to provide Information Products for Humanitarian Relief Operations in Refugee Camps—From Scientific Development towards Operational Services. PFG Photogramm. Fernerkund. Geoinf. 2013, 2013, 185–195. [Google Scholar] [CrossRef]
- Kemper, T.; Jenerowicz, M.; Pesaresi, M.; Soille, P. Enumeration of dwellings in darfur camps from GeoEye-1 satellite images using mathematical morphology. IEEE J. Sel. Top. Appl. Earth Obs. Remote Sens. 2011, 4, 8–15. [Google Scholar] [CrossRef]
- Checchi, F.; Stewart, B.T.; Palmer, J.J.; Grundy, C. Validity and feasibility of a satellite imagery-based method for rapid estimation of displaced populations. Int. J. Health Geogr. 2013, 12, 12. [Google Scholar] [CrossRef] [PubMed]
- Lang, S.; Füreder, P.; Kranz, O.; Card, B.; Roberts, S.; Papp, A. Humanitarian emergencies: Causes, traits and impacts as observed by remote sensing. In Remote Sensing Handbook, Vol III—Water Resources, Disasters, and Urban; Thenkabail, P.S., Ed.; Taylor and Francis: New York, NY, USA, 2015; pp. 483–512. [Google Scholar]
- Giada, S.; De Groeve, T.; Ehrlich, D.; Soille, P. Information extraction from very high resolution satellite imagery over Lukole refugee camp, Tanzania. Int. J. Remote Sens. 2003, 24, 4251–4266. [Google Scholar] [CrossRef]
- Wang, S.; So, E.; Smith, P. Detecting tents to estimate the displaced populations for post-disaster relief using high resolution satellite imagery. Int. J. Appl. Earth Obs. Geoinf. 2015, 36, 87–93. [Google Scholar] [CrossRef]
- Witmer, F.D. W. Remote sensing of violent conflict: Eyes from above. Int. J. Remote Sens. 2015, 36, 2326–2352. [Google Scholar] [CrossRef]
- Blaschke, T. Object based image analysis for remote sensing. ISPRS J. Photogramm. Remote Sens. 2010, 65, 2–16. [Google Scholar] [CrossRef]
- Blaschke, T.; Hay, G.J.; Kelly, M.; Lang, S.; Hofmann, P.; Addink, E.; Queiroz Feitosa, R.; van der Meer, F.; van der Werff, H.; van Coillie, F.; et al. Geographic Object-Based Image Analysis—Towards a new paradigm. ISPRS J. Photogramm. Remote Sens. 2014, 87, 180–191. [Google Scholar] [CrossRef] [PubMed]
- Spröhnle, K.; Tiede, D.; Schoepfer, E.; Füreder, P.; Svanberg, A.; Rost, T. Earth Observation-Based Dwelling Detection Approaches in a Highly Complex Refugee Camp Environment—A Comparative Study. Remote Sens. 2014, 6, 9277–9297. [Google Scholar] [CrossRef]
- Füreder, P.; Tiede, D.; Lüthje, F.; Lang, S. Object-based dwelling extraction in refugee/IDP camp—Challenges in an operational mode. South-Eastern Eur. J. Earth Obs. Geomat. 2014, 3, 539–543. [Google Scholar]
- Brunelli, R. Template Matching Techniques in Computer Vision: Theory and Practice; John Wiley & Sons, Inc.: Hoboken, NJ, USA, 2009; p. 338. [Google Scholar]
- Moon, T.K.; Stirling, W.C. Mathematical Methods and Algorithms For Signal Processing; Pearson: London, UK, 2000; Volume 204. [Google Scholar]
- Cheng, G.; Han, J. A Survey on Object Detection in Optical Remote Sensing Images. ISPRS J. Photogramm. Remote Sens. 2016, 117, 11–28. [Google Scholar] [CrossRef]
- Kim, T.; Park, S.S.; Kim, M.M.; Jeong, S.; Kim, K. Tracking road centerlines from high resolution remote sensing images by least squares correlation matching. Photogramm. Eng. Remote Sens. 2004, 70, 1417–1422. [Google Scholar] [CrossRef]
- Heid, T.; Kääb, A. Evaluation of existing image matching methods for deriving glacier surface displacements globally from optical satellite imagery. Remote Sens. Environ. 2012, 118, 339–355. [Google Scholar] [CrossRef]
- Debella-Gilo, M.; Kääb, A. Sub-pixel precision image matching for measuring surface displacements on mass movements using normalized cross-correlation. Remote Sens. Environ. 2011, 115, 130–142. [Google Scholar] [CrossRef]
- Schubert, A.; Faes, A.; Kääb, A.; Meier, E. Glacier surface velocity estimation using repeat TerraSAR-X images: Wavelet- vs. correlation-based image matching. ISPRS J. Photogramm. Remote Sens. 2013, 82, 49–62. [Google Scholar] [CrossRef]
- Liu, G.; Sun, X.; Fu, K.; Wang, H. Aircraft recognition in high-resolution satellite images using coarse-to-fine shape prior. IEEE Geosci. Remote Sens. Lett. 2013, 10, 573–577. [Google Scholar] [CrossRef]
- Bandeira, L.; Saraiva, J.; Pina, P. Impact crater recognition on mars based on a probability volume created by template matching. IEEE Trans. Geosci. Remote Sens. 2007, 45, 4008–4015. [Google Scholar] [CrossRef]
- Olofsson, K.; Wallerman, J.; Holmgren, J.; Olsson, H. Tree species discrimination using Z/I DMC imagery and template matching of single trees. Scand. J. For. Res. 2006, 21, 106–110. [Google Scholar] [CrossRef]
- Gomes, M.F.; Maillard, P. Identification of Urban Tree Crown in a Tropical Environment Using WorldView-2 Data: Problems and Perspectives. In Proceedings of the SPIE—The International Society for Optical Engineering, Dresden, Germany, 23 September 2013. [Google Scholar]
- Ke, Y.; Quackenbush, L.J. A review of methods for automatic individual tree-crown detection and delineation from passive remote sensing. Int. J. Remote Sens. 2011, 32, 4725–4747. [Google Scholar] [CrossRef]
- Erikson, M.; Olofsson, K. Comparison of three individual tree crown detection methods. Mach. Vis. Appl. 2005, 16, 258–265. [Google Scholar] [CrossRef]
- Shafri, H.Z.M.; Hamdan, N.; Saripan, M.I. Semi-automatic detection and counting of oil palm trees from high spatial resolution airborne imagery. Int. J. Remote Sens. 2011, 32, 2095–2115. [Google Scholar] [CrossRef]
- Laneve, G.; Santilli, G.; Lingenfelder, I. Development of Automatic Techniques for Refugee Camps Monitoring using Very High Spatial Resolution (VHSR) Satellite Imagery. In Proceedings of the IEEE International Conference on Geoscience and Remote Sensing Symposium, Denver, CO, USA, 31 July–4 August 2006; pp. 841–845. [Google Scholar]
- Lüthje, F.; Tiede, D.; Füreder, P. Don’t See the Dwellings for the Trees: Quantifying the Effect of Tree Growth on Multi-temporal Dwelling Extraction in a Refugee Camp. In Proceedings of the GI_Forum 2015—Geospatial Minds for Society, Salzburg, Austria, 7–10 July 2015; pp. 406–415. [Google Scholar]
- Baltsavias, E.P.; Gruen, A.; VanGool, L. Automatic Extraction of Man-Made Objects from Aerial and Satellite Images III; Verità, M., Ed.; Taylor & Francis: New York, NY, USA, 2001. [Google Scholar]
- Lewis, J.P. Fast Normalized Cross-Correlation. Vis. Interface 1995, 10, 1–7. [Google Scholar]
- United Nations High Commissioner for Refugees. UNHCR Statistical Yearbook 2012, 12th ed.; United Nations High Commissioner for Refugees: Geneva, Switzerland, 2013; p. 172. [Google Scholar]
- Nubareports.org On the Move Again; 70,000 Refugees Compelled to Leave Camp|Nuba Reports. Available online: http://nubareports.org/on-the-move-again-70000-refugees-compelled-to-leave-camp/ (accessed 26 December 2016).


| Image Size (Pixel) | Number of Template Rotations | ||||||
|---|---|---|---|---|---|---|---|
| 1 | 2 | 4 | 8 | 16 | 32 | 64 | |
| 6400 × 6400 | 3.21 | 5.98 | 11.05 | 99.16 | 275.14 | 653.06 | 1433.05 |
| 3200 × 3200 | 1.16 | 1.56 | 2.75 | 25.80 | 70.156 | 154.09 | 332.72 |
| 1600 × 1600 | 0.22 | 0.36 | 0.61 | 5.14 | 14.219 | 32.75 | 69.69 |
| 800 × 800 | 0.08 | 0.11 | 0.19 | 1.22 | 3.19 | 7.16 | 15.02 |
| Site | Acquisition Date | Size (Pixel) | Sensor | Complexity |
|---|---|---|---|---|
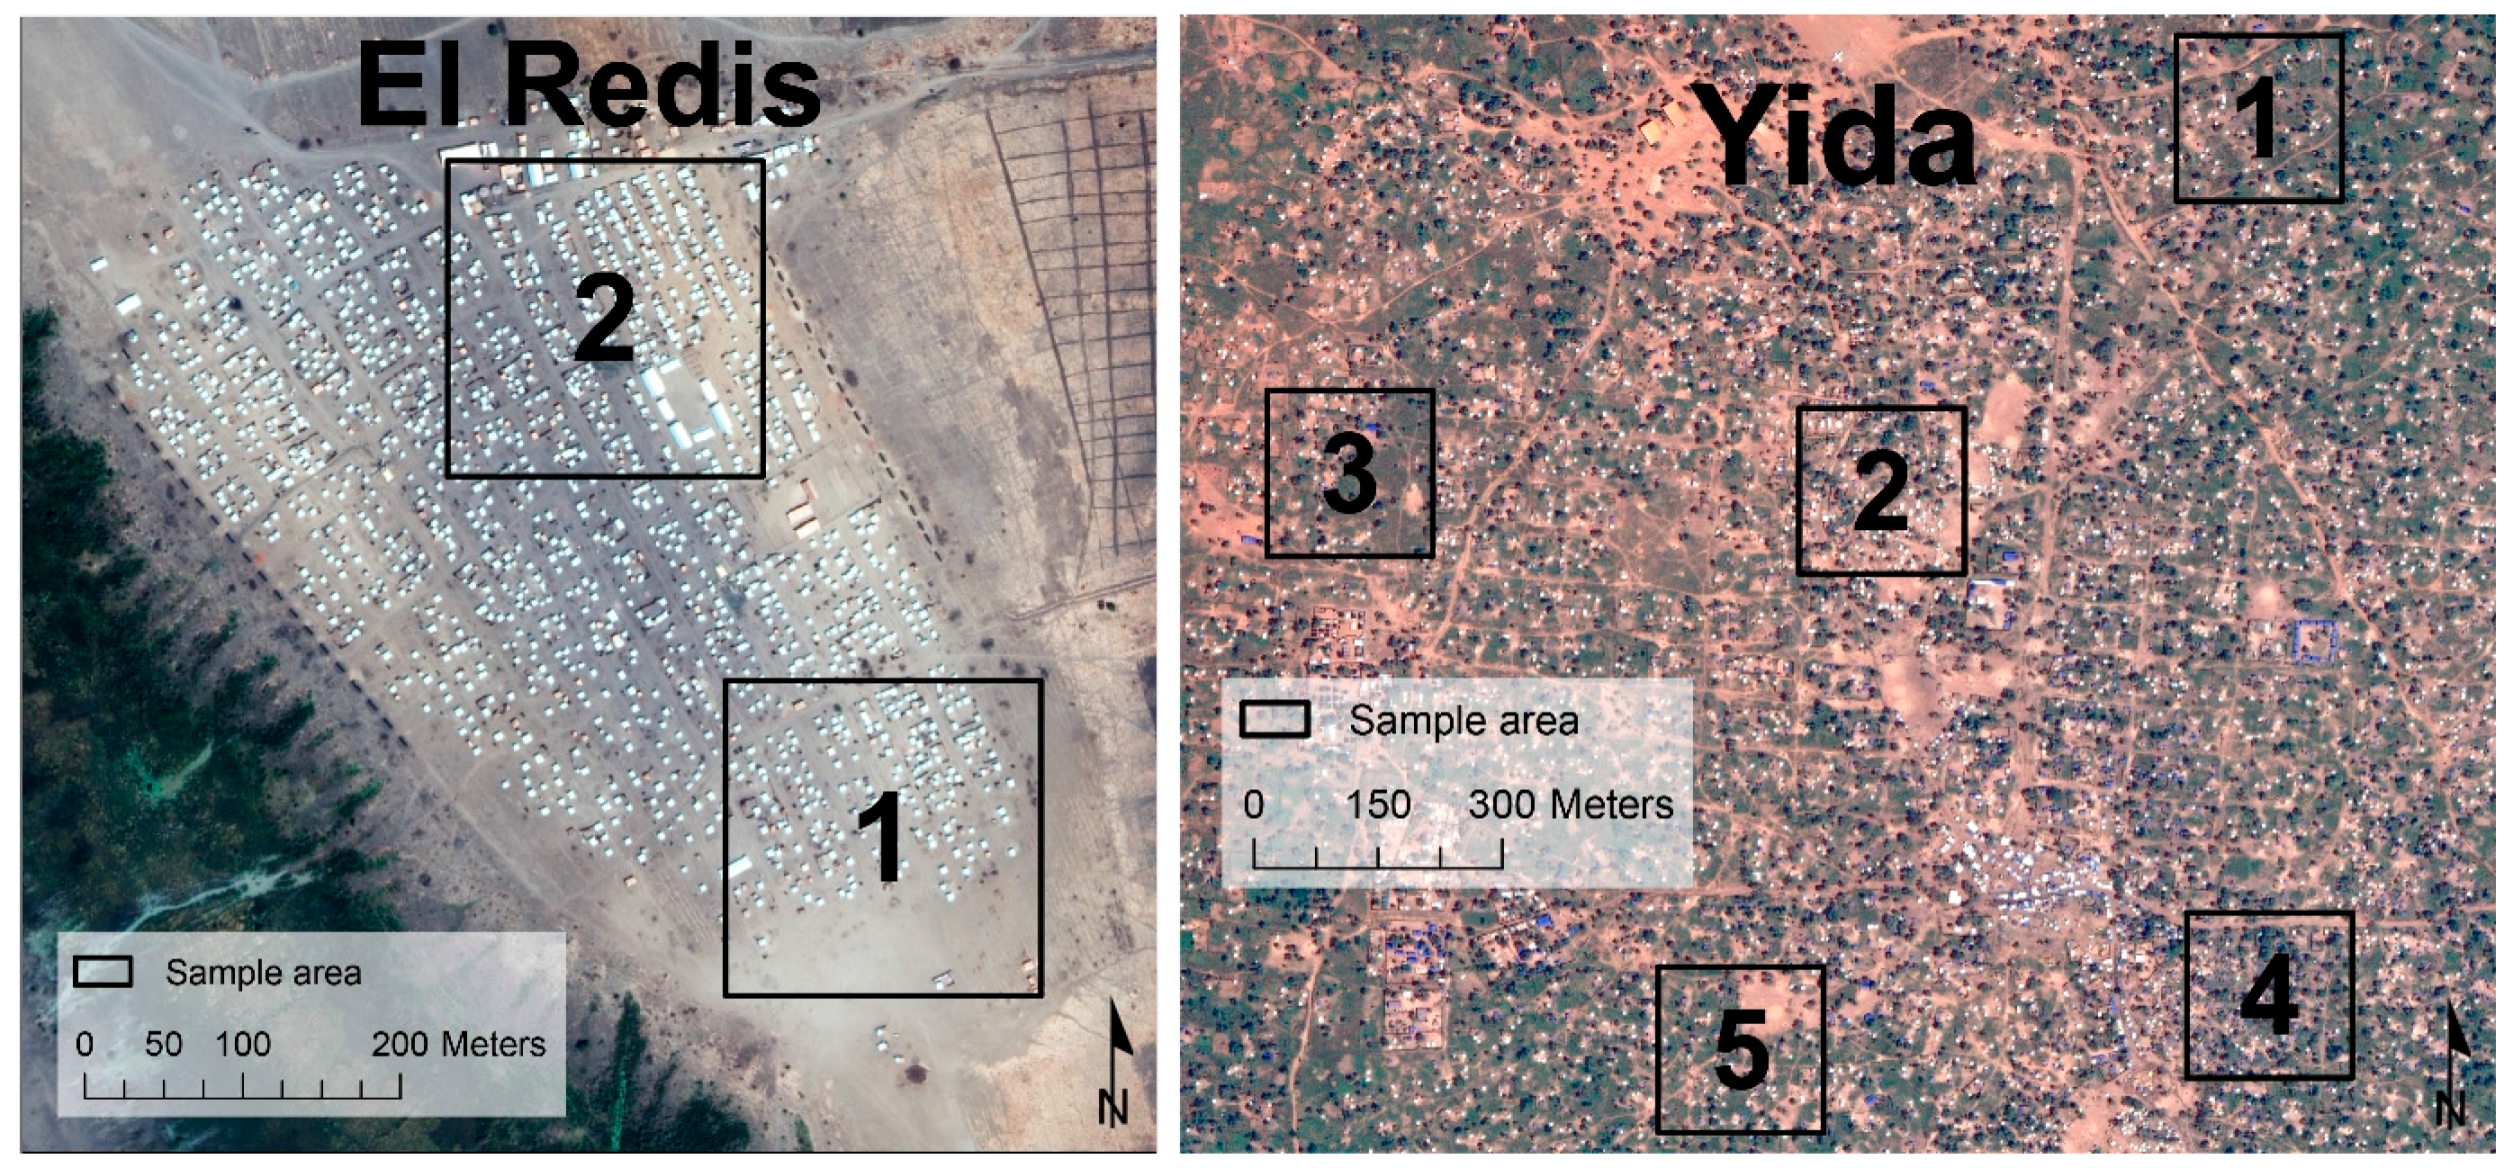
| El Redis | 3 December 2015 | 1657 × 1658 | WV-2 | Low |
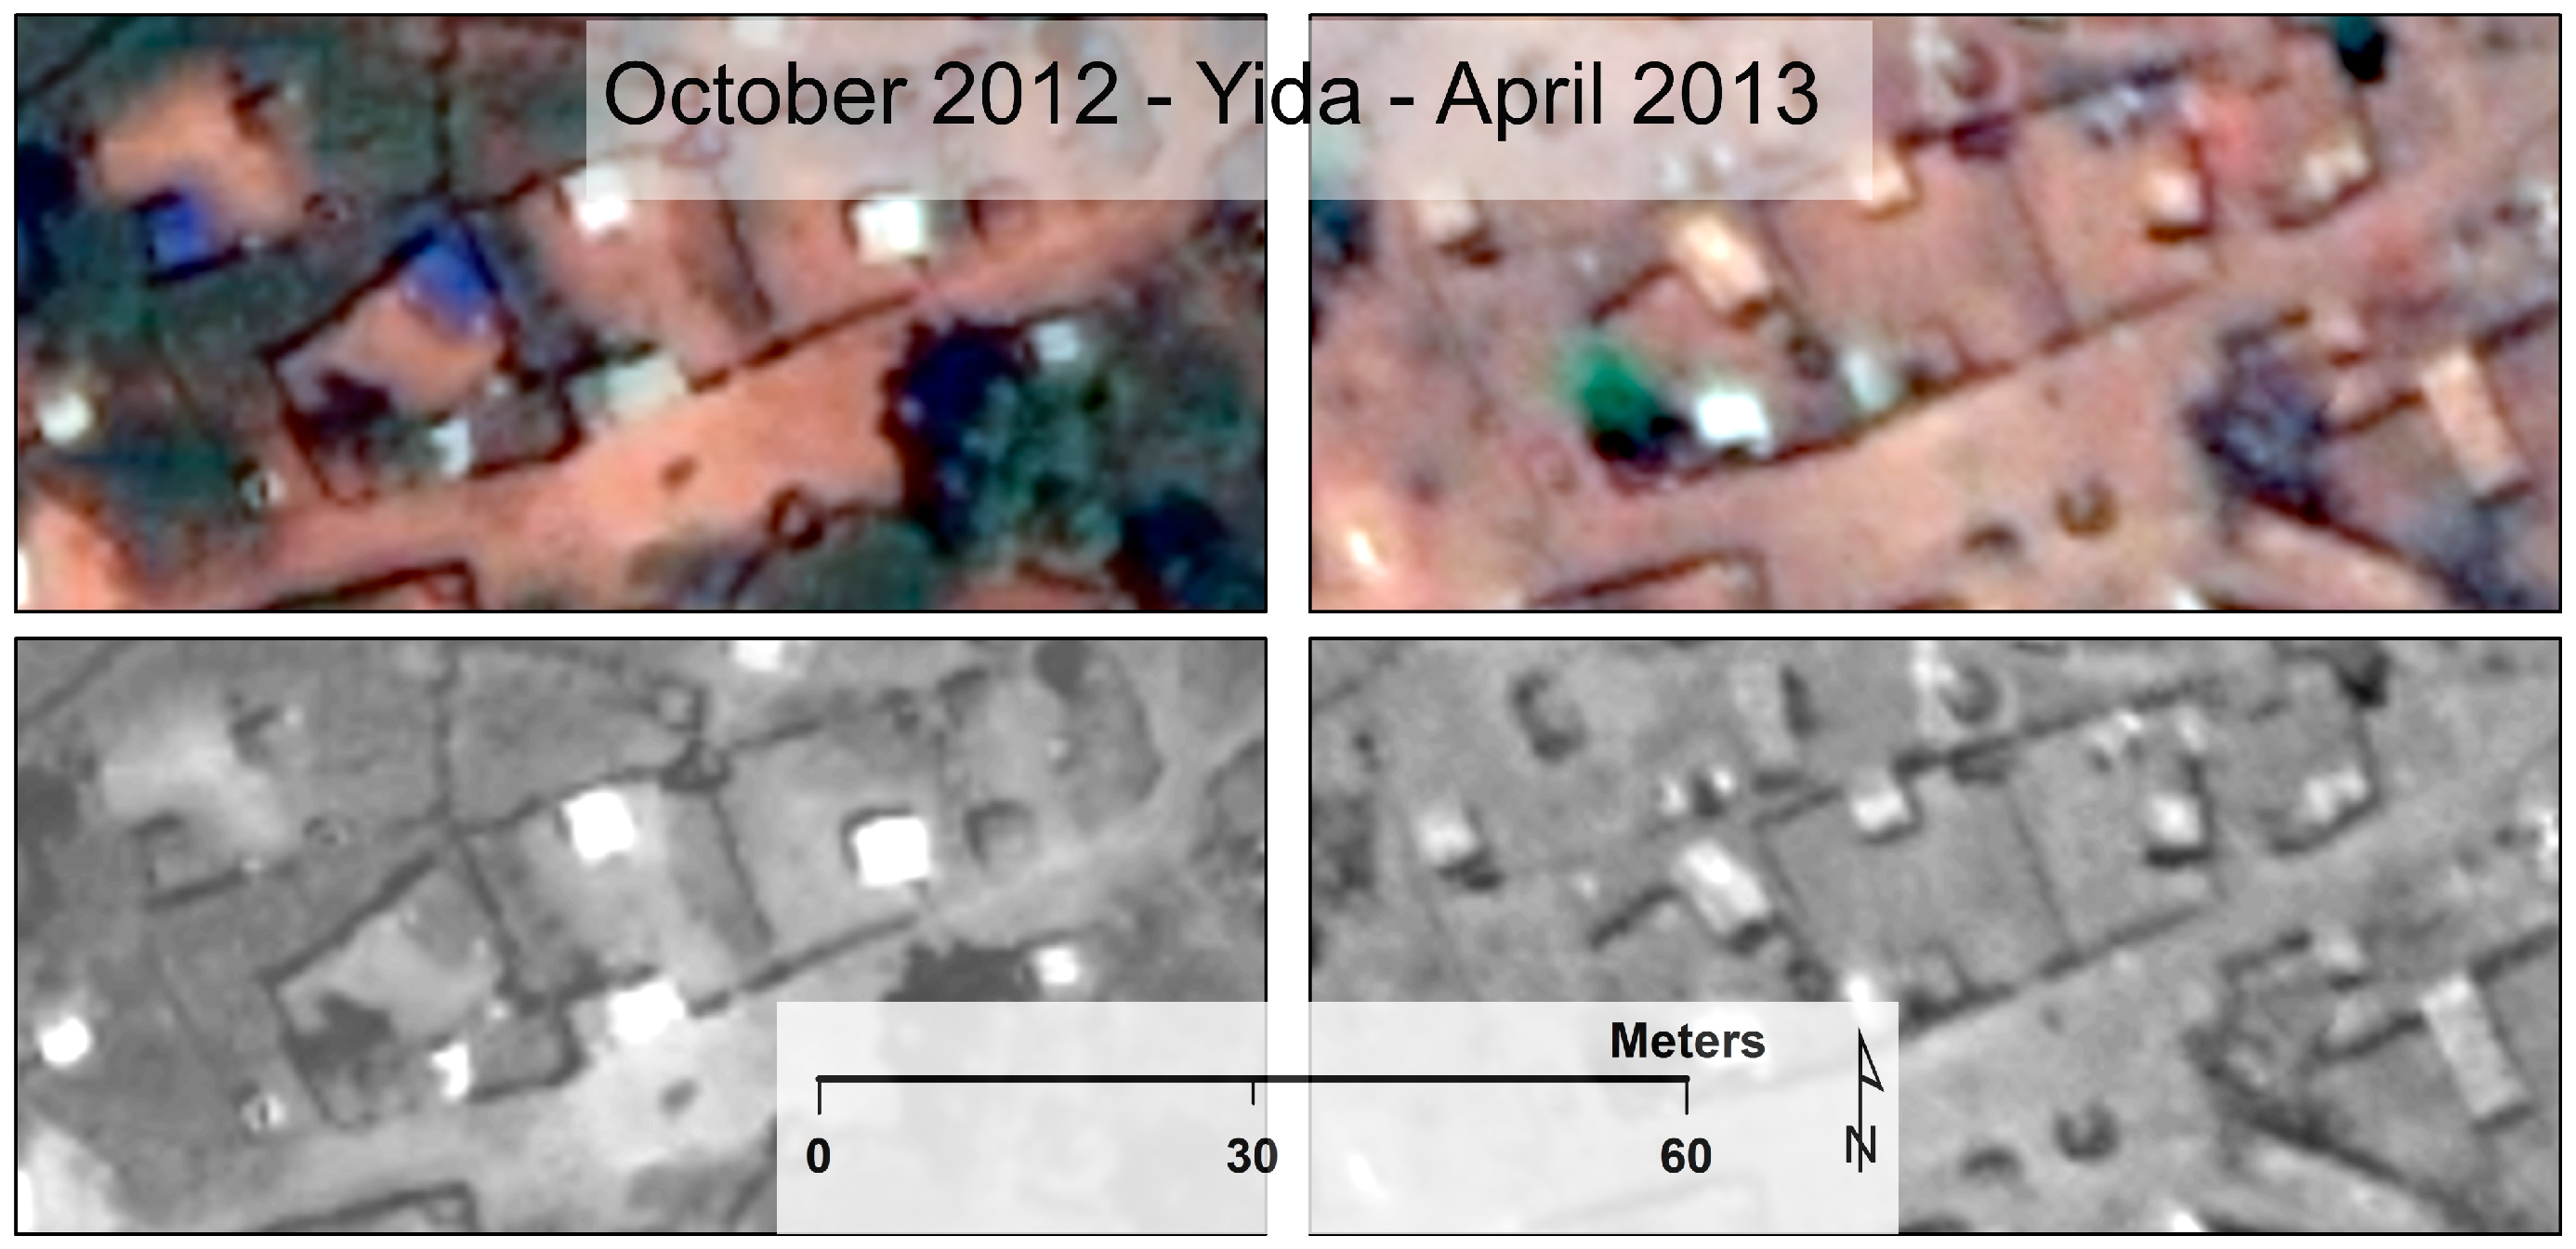
| Yida | 10 December 2012 | 2698 × 2337 | QB | Moderate |
| Yida | 4 March 2013 | 3237 × 2805 | WV-2 | High |
| El Redis 2015 | Visual Interpretation | TMOB | Pre-Existing OB | |
|---|---|---|---|---|
| Bright dwelling | TP (No.) | 548 | 522 | 491 |
| FP (No.) | 0 | 7 | 1 | |
| UA (%) | 100 | 98.7 | 99.8 | |
| PA (%) | 100 | 95.3 | 89.6 | |
| Brown dwelling | TP (No.) | 96 | 63 | 33 |
| FP (No.) | 0 | 7 | 22 | |
| UA (%) | 100 | 90 | 60 | |
| PA (%) | 100 | 65.6 | 34.4 | |
| Large structure | TP (No.) | 13 | 13 | 13 |
| FP (No.) | 0 | 0 | 3 | |
| UA (%) | 100 | 100 | 81.3 | |
| PA (%) | 100 | 100 | 100 | |
| Total | TP (No.) | 657 | 598 | 537 |
| FP (No.) | 0 | 14 | 26 | |
| UA (%) | 100 | 97.7 | 95.4 | |
| PA (%) | 100 | 91 | 81.7 | |
| Yida 2012 | Visual Interpretation | TMOB | Pre-Existing OB | |
|---|---|---|---|---|
| Bright dwelling | TP (No.) | 373 | 291 | 287 |
| FP (No.) | 0 | 11 | 23 | |
| UA (%) | 100 | 96.4 | 92.6 | |
| PA (%) | 100 | 78 | 76.9 | |
| Blue dwelling | TP (No.) | 211 | 147 | 101 |
| FP (No.) | 0 | 34 | 26 | |
| UA (%) | 100 | 81.2 | 79.5 | |
| PA (%) | 100 | 69.7 | 47.9 | |
| Large structure | TP (No.) | 3 | 2 | 2 |
| FP (No.) | 0 | 1 | 4 | |
| UA (%) | 100 | 66.7 | 33.3 | |
| PA (%) | 100 | 66.7 | 66.7 | |
| Total | TP (No.) | 587 | 452 | 397 |
| FP (No.) | 0 | 46 | 53 | |
| UA (%) | 100 | 90.5 | 88 | |
| PA (%) | 100 | 74.9 | 66.4 | |
| Yida 2013 | Visual Interpretation | TMOB | Pre-Existing OB | |
|---|---|---|---|---|
| Bright dwelling | TP (No.) | 148 | 133 | 90 |
| FP (No.) | 0 | 61 | 44 | |
| UA (%) | 100 | 68.6 | 67.2 | |
| PA (%) | 100 | 89.9 | 60.8 | |
| Brown dwelling | TP (No.) | 311 | 185 | 123 |
| FP (No.) | 0 | 58 | 45 | |
| UA (%) | 100 | 76.1 | 73.2 | |
| PA (%) | 100 | 59.5 | 39.6 | |
| Blue dwelling | TP (No.) | 25 | 13 | 11 |
| FP (No.) | 0 | 3 | 1 | |
| UA (%) | 100 | 81.3 | 91.7 | |
| PA (%) | 100 | 52 | 44 | |
| Large structure | TP (No.) | 17 | 10 | 12 |
| FP (No.) | 0 | 8 | 23 | |
| UA (%) | 100 | 55.6 | 34.3 | |
| PA (%) | 100 | 58.8 | 70.6 | |
| Small structure | TP (No.) | 3 | 3 | 2 |
| FP (No.) | 0 | 9 | 11 | |
| UA (%) | 100 | 25 | 15.4 | |
| PA (%) | 100 | 100 | 66.7 | |
| Total | TP (No.) | 504 | 344 | 238 |
| FP (No.) | 0 | 109 | 78 | |
| UA (%) | 100 | 71.2 | 64.8 | |
| PA (%) | 100 | 68.3 | 47.2 | |
© 2017 by the authors. Licensee MDPI, Basel, Switzerland. This article is an open access article distributed under the terms and conditions of the Creative Commons Attribution (CC BY) license (http://creativecommons.org/licenses/by/4.0/).
Share and Cite
Tiede, D.; Krafft, P.; Füreder, P.; Lang, S. Stratified Template Matching to Support Refugee Camp Analysis in OBIA Workflows. Remote Sens. 2017, 9, 326. https://doi.org/10.3390/rs9040326
Tiede D, Krafft P, Füreder P, Lang S. Stratified Template Matching to Support Refugee Camp Analysis in OBIA Workflows. Remote Sensing. 2017; 9(4):326. https://doi.org/10.3390/rs9040326
Chicago/Turabian StyleTiede, Dirk, Pascal Krafft, Petra Füreder, and Stefan Lang. 2017. "Stratified Template Matching to Support Refugee Camp Analysis in OBIA Workflows" Remote Sensing 9, no. 4: 326. https://doi.org/10.3390/rs9040326
APA StyleTiede, D., Krafft, P., Füreder, P., & Lang, S. (2017). Stratified Template Matching to Support Refugee Camp Analysis in OBIA Workflows. Remote Sensing, 9(4), 326. https://doi.org/10.3390/rs9040326