Article

Hyperspectral and Multispectral Retrieval of Suspended Sediment in Shallow Coastal Waters Using Semi-Analytical and Empirical Methods

1
Department of Civil and Environmental Engineering, Duke University, Durham, NC 27708, USA
2
School of Civil and Environmental Engineering, Cornell University, Ithaca, NY 14853, USA
3
Nicholas School of the Environment, Duke University, Durham, NC 27708, USA
4
Department of Civil, Architectural and Environmental Engineering, University of Padova, Padova 35131, Italy
*
Author to whom correspondence should be addressed.
Remote Sens. 2017, 9(4), 393; https://doi.org/10.3390/rs9040393
Submission received: 27 January 2017 / Revised: 8 April 2017 / Accepted: 16 April 2017 / Published: 21 April 2017

Abstract

:
Natural lagoons and estuaries worldwide are experiencing accelerated ecosystem degradation due to increased anthropogenic pressure. As a key driver of coastal zone dynamics, suspended sediment concentration (SSC) is difficult to monitor with adequate spatial and temporal resolutions both in the field and using remote sensing. In particular, the spatial resolutions of currently available remote sensing data generated by satellite sensors designed for ocean color retrieval, such as MODIS (Moderate Resolution Imaging Spectroradiometer) or SeaWiFS (Sea-Viewing Wide Field-of-View Sensor), are too coarse to capture the dimension and geomorphological heterogeneity of most estuaries and lagoons. In the present study, we explore the use of hyperspectral (Hyperion) and multispectral data, i.e., the Landsat TM (Thematic Mapper) and ETM+ (Enhanced Thematic Mapper Plus), ASTER (Advanced Spaceborne Thermal Emission and Reflection Radiometer), and ALOS (Advanced Land Observing Satellite), to estimate SSC through semi-analytical and empirical approaches in the Venice lagoon (Italy). Key parameters of the retrieval models are calibrated and cross-validated by matching the remote sensing estimates of SSC with in situ data from a network of water quality sensors. Our analysis shows that, despite the higher spectral resolution, hyperspectral data provide limited advantages over the use of multispectral data, mainly due to information redundancy and cross-band correlation. Meanwhile, the limited historical archive of hyperspectral data (usually acquired on demand) severely reduces the chance of observing high turbidity events, which are relatively rare but critical in controlling the coastal sediment and geomorphological dynamics. On the contrary, retrievals using available multispectral data can encompass a much wider range of SSC values due to their frequent acquisitions and longer historical archive. For the retrieval methods considered in this study, we find that the semi-analytical method outperforms empirical approaches, when applied to both the hyperspectral and multispectral dataset. Interestingly, the improved performance emerges more clearly when the data used for testing are kept separated from those used in the calibration, suggesting a greater ability of semi-analytical models to “generalize” beyond the specific data set used for model calibration.

Graphical Abstract

1. Introduction

Suspended sediment is an important optically-active water constituent and descriptor of the quality of a water body, with important implications for the geomorphological and ecological dynamics of aquatic systems. The suspended sediment concentration (SSC) largely determines water turbidity, a chief control of coastal ecosystem dynamics [1]. Furthermore, sediment supplied by rivers and tidal currents is essential to the survival of intertidal (i.e., saltmarshes) and sub-tidal structures (i.e., tidal flats) as sea level rise accelerates [2,3,4,5,6,7,8]: sediment “starvation” is one of the main sources of ongoing coastal degradation [9,10,11,12,13]. Consequently, methods for monitoring SSC in a spatially-distributed manner are vital for understanding and managing coastal systems. However, due to the high spatial and temporal variability of SSC, point measurements within networks of monitoring stations cannot adequately characterize the space-time distribution of SSC.
In recent years, the use of satellite data, such as the SeaWifs, MODIS-Aqua, and MERIS (MEdium Resolution Imaging Spectrometer), for the retrieval of SSC has been used with some success, allowing effective monitoring of ocean (Case I) and coastal (Case II) waters in a distributed manner [14,15,16,17]. However, the low spatial resolution of these sensors designed for ocean applications (typically between 250 and 1000 m) is inadequate to resolve the heterogeneous spatial distribution of SSC in most lagoons and estuaries around the world [18,19,20].
Originally designed for terrestrial applications, multispectral sensors with finer spatial resolutions (10 to 30 m), such as Landsat TM and ETM+, ASTER, and ALOS, have been successfully applied to SSC retrievals in estuaries and lagoons [21,22,23]. The improved spatial resolution significantly improves the description of the SSC spatial variability typical of estuaries and lagoons. Moreover, the longer data archive and periodic acquisitions provide a large database that can better capture events of intense sediment re-suspension, of key importance for estuarine dynamics [21,24]. The limited spectral resolution and coverage of these sensors have often been considered as the main limitations for their use in water quality monitoring [19]. Hyperspectral sensors, such as HICO (Hyperspectral Imager for the Coastal Ocean), Hyperion, and CHRIS (Compact High Resolution Imaging Spectrometer), provide similar spatial resolutions (60 m for HICO, 30 m for Hyperion, and 18m or 36 m for CHRIS depending on configuration) and high spectral resolutions (5 nm for HICO, 10 nm for Hyperion, and 1.3 nm–11.3 nm for CHRIS) if compared to the above-mentioned multispectral sensors. However, whether the low spectral resolution of these multispectral sensors (typically about 60 nm in the visible spectrum) have significantly curtailed the accuracy of SSC estimates in shallow coastal areas, despite their larger data archive, is still unknown, particularly in comparison with the existing and planned hyperspectral missions.
The first objective of this paper is to determine whether the use of hyperspectral sensor data presents advantages with respect to the use of multispectral sensor data for SSC retrievals in shallow coastal zones, a subject relatively under-examined in the existing literature. A comparison of the performance of hyperspectral- and multispectral-based SSC retrievals is particularly relevant in light of the planned hyperspectral missions for coastal water quality monitoring (such as HyspIRI (Hyperspectral Infrared Imager) from NASA (National Aeronautics and Space Administration)) and the increasing availability of multispectral sensors with high spatial resolutions (such as Sentinel-2). In this study, we seek to quantify the potential of future hyperspectral missions for coastal SSC retrieval by systematically analyzing SSC estimation from a variety of Hyperion bands. Results are then compared with those obtained from the same SSC retrieval methods using multispectral sensors (Landsat TM and ETM+, ASTER, and ALOS).
The second objective of the present work is to explore the relative strengths and weaknesses of empirical versus semi-analytical approaches in the retrieval of SSC in shallow coastal areas. Semi-analytical method is based on a simplified description of the physical processes governing radiative transfer in the water columns (e.g., [25,26,27,28]), and empirical methods only seek a correspondence between the observed optical “response” and SSC (e.g., [15,29,30]). A variety of semi-analytical and empirical approaches have been used for SSC retrieval, as reviewed in [31]. A recent study compared 31 empirically-based methods to retrieve SSC using MODIS reflectance [32]. Binding et al. [33] explored the empirical correlation between SSC and the ratios of different MODIS bands in “Red” and near-infrared (NIR) spectrum, so as to infer an optimal spectral band to calibrate a semi-analytical model. However, no direct and systematic comparison of empirical versus semi-analytical methods has been made. As a result, there is no quantitative evidence as to the optimal approach for the remote sensing retrieval of SSC, particularly in complex shallow waters and in regions where field calibration data are scarce. In this study, we evaluate the performance of empirical and semi-analytical methods to retrieve SSC from hyperspectral and multispectral data in the Venice lagoon (Italy). First, remote sensing data are atmospherically corrected, and processed to eliminate the potential effect of sun glint and whitecaps. We then comparatively apply a simplified radiative-transfer model in the water column [25,26] and empirical regressions between SSC and selected combinations of spectral bands. In situ measurements from a network of multi-parametric water quality sensors are used to calibrate and validate remote sensing estimates.

2. Materials and Methods

2.1. Study Site and Datasets

The Venice Lagoon is one of the largest lagoons in Europe with a surface area of about 550 km2 and a watershed of 1800 km2. It is separated from the Adriatic Sea by two barrier islands, with three large inlets connecting it to the sea. The lagoon is relatively shallow, with a mean depth of about 1.2 m and a mean semi-diurnal tidal amplitude of about 0.7 m. It includes several islands with a total surface of 29 km2, salt marshes (covering almost 40 km2), and tidal flats. The lagoon is incised by a network of channels (total length of about 1500 km) ranging from shallow (less than 1 m deep) to very deep (the Malamocco inlet is 22 m deep). Due to a very low sediment input from the watershed caused by historical river diversions, most of the spatial variability in suspended sediment is due to sediment re-suspension by wind waves and its transport by tidal circulation [24]. Because of the asymmetry in the tidally-driven sediment exchange between the sea and the lagoon, the lagoon is currently characterized by a marked erosional trend and an annual sediment deficit of about 400,000 m3.
Several hyperspectral (Hyperion) and multispectral (Landsat, ASTER and ALOS) datasets are used here. Launched in 2001, Hyperion is onboard the EO-1 satellite and typically covers a swath of 7.7 km (width) by 42 km (length), with a spectral coverage from 400 to 2500 nm (~10nm full width at half maximum, or FWHM) and a spatial resolution of 30 by 30 m [34]. Five cloud-free Hyperion scenes, two collected in winter and three in summer, are considered here (Table 1). Concurrent wind data were obtained from a nearby meteorological station (45.459444°N, 12.249722°E), which recorded hourly wind measurements at a 10 m height. The average wind speed for the 5 Hyperion scenes analyzed here was 2.8 m/s (with a standard deviation of 1.1 m/s), slightly higher than the annual average of 2.5 m/s. Spectral bands in the 460–700 nm range are selected to constrain the semi-analytical retrieval model (Section 2.3), mainly due to their high sensitivity to water constituents [28]. In this spectral range, absorption and backscattering coefficients of water constituents are estimated from local measurements [21,27]. 13 multispectral images (Landsat 5 TM, Landsat 7 ETM+, ASTER, and ALOS) are also used in this study (Table 1), with the purpose of comparing the estimation accuracy attained using hyperspectral and multispectral observations. The cloud-free, nadir-viewing multispectral images were specifically selected to sample windy conditions (average wind speed 3.6 m/s with a standard deviation of 1.2 m/s, almost 50% greater than the annual average of 2.5 m/s). Because sediment re-suspension from the bottom is mainly driven by wind-introduced waves, the selection of high wind speeds ensures that high turbidity values are included in the dataset, and thus the largest range of SSC values can be explored in training and testing the retrieval models.
Field data are provided by the Italian Ministry of Public Works, which monitors the water quality of the Venice lagoon through a network of 10 multi-parametric water quality sensors (Figure 1). All sensors are inspected and maintained by the Venice Water Authority (including bio-fouling cleaning if necessary) at least monthly. Sensors are routinely removed from the field (and substituted with spare calibrated sensors) and tested in the laboratory for re-calibration if needed. Raw data are processed and abnormal/unphysical sensor readings are discarded. Available data include water pressure at the sensors (from which water level was inferred for this study), temperature, conductivity, dissolved oxygen, pH, chlorophyll-a, and turbidity at 30-minute intervals. Turbidity (also applies to chlorophyll-a concentration and water pressure) at the satellite overpassing time is obtained by linear interpolation of the closest sensor data (e.g., sensor data recorded at 9:30 a.m. and 10:00 a.m. is used to estimate turbidity at satellite overpassing at 9:46 a.m.). Turbidity is determined, at all stations, by Seapoint optical turbidity meters, which measure the amount of scattering by the water column in a beam emitted at a wavelength of 880 nm. According to the turbidity meter nominal characteristics, it has ±2% deviation (noise level) from 0 to 1250 Formazine Turbidity Units (FTU) [35]. The amount of scattering is proportional to the concentration of the matter suspended in the water column. These turbidity observations are expressed in FTU, which can be directly related to the SSC (g/m3). We applied a linear relationship with a unit slope to convert FTU to g/m3, suggested by a previous study that utilized the same sensor data [36]. Chlorophyll-a concentration (CC) is observed by a Seapoint chlorophyll fluorometer, which measures the emission spectrum at 685 nm after excitation at 470 nm, and water pressure is measured by a pressure transducer included in the Ocean Seven 316 CTD multi-parameter sensor. Both CC and water depth are used as inputs in the SSC retrievals. Due to the limited Hyperion swath width, only 5 to 6 sensors are covered by a typical Hyperion scene (Figure 1). After excluding data from stations affected by cloud/haze or by probe malfunctioning, we have a total of 20 reliable sensor measurements from the 5 available Hyperion scenes. The number of sensor measurements corresponding to the 13 multispectral scenes, is 53 when obtained through a similar procedure.

2.2. Data Processing

The preprocessed Hyperion data (Level 1R) are known to exhibit striping in certain spectral bands due to poorly calibrated detectors [37]. We first replace the erroneous stripes with a linear interpolation of the adjacent columns. Data were then atmospherically corrected using the ACORN (Atmospheric CORrection Now) software, which implements the MODTRAN 4.0 (moderate resolution atmospheric transmission) Radiative Transfer Model developed by the Air Force Research Lab [38]. ACORN also automatically corrects for the “smile” effect, which is a wavelength shift in across-track pixels mainly caused by the push-broom sensor configuration [39]. A mid-latitude, seasonally-dependent, atmospheric model was applied. The atmospheric water vapor distribution is estimated by ACORN on a pixel-by-pixel basis using both the 940 nm and the 1140 nm bands [40]. Visibility was assumed to be spatially homogeneous over the entire scene, and calculated using the aerosol optical thickness (AOT) values measured by sun-photometers from the aerosol robotic network (AERONET) network [41]. Data from two AERONET sites are used in the study: the Istituto per lo Studio della Dinamica delle Grandi Masse-Consiglio Nazionale delle Ricerche (ISDGM-CNR) site, located on the roof of a building in central Venice (45.43698°N, 12.33198°E), and the Venice site, located in the Adriatic Sea 8 nautical miles offshore from the Venice Lagoon (45.31390°N, 12.50830°E). The average AOT values from these two sites are used when both data values are available. Finally, spectral bands ranging from 1560 nm to 1750 nm are used to correct for radiance contributions from the air-water interface such as sun glint and whitecaps. By assuming zero reflectance in the shortwave infrared (SWIR) region for turbid waters also [42], we postulate that the non-zero reflectance in the SWIR after atmospheric correction is due to effects at the air-water interface. As a result, reflectance at 1650 nm (mean reflectance from 1560 nm to 1750 nm) was subtracted from that of all the bands, assuming that the reflection from the air-water interface is uniform over the entire Hyperion spectrum [42,43]. The atmospherically-corrected Hyperion images were georeferenced with a root-mean-square-error (RMSE) <1.5 pixels to ensure a suitable matching between the remote sensing image and the locations of the water quality sensors (Figure 1).
The multispectral data are atmospherically corrected using MODTRAN 4.1 implemented in the ATCOR (Atmospheric and Topographic CORrection) 2/3 [44]. The AOT values were retrieved from the AERONET network [41], and specifically from the same locations (ISDGM-CNR site and Venice site) used for atmospheric correction of Hyperion data. The atmospheric correction was applied using the “maritime” aerosol type and the “mid-latitude” water vapor content. The resulting above-surface remote sensing reflectances were compared to available reference spectra as described in [21].
The atmospheric correction process can potentially introduce errors, especially for Case II waters, in the absence of water-leaving radiance measurements [45]. Hence, we validate our atmospheric correction by comparing the reflectance obtained from Hyperion with the MODIS surface reflectance product (MOD09GA, with preprocessing level 2G), which provides global daily surface spectral reflectance at 500-m and 1-km resolutions [46]. The atmospheric correction of the MODIS surface reflectance products was validated at the coast of Lanai Island, Hawaii, during its early development [47], and has been subsequently verified in moderate to high turbid coastal environments or estuaries, such as the Gironde estuary [48], Adour River plume [15], and Gulf of Mexico [49]. It should be noted that all MODIS data selected for the comparison were acquired within 30 min of the corresponding Hyperion overpass.
We first simulated MODIS reflectances for bands B1 (620–670 nm), B3 (459–479 nm), and B4 (545–565 nm), by resampling the atmospherically-corrected Hyperion bands falling within the spectral interval of these MODIS bands and by applying the appropriate MODIS spectral response functions. Only MODIS pixels that completely falls on water were considered in the comparison, and pixels located at the edge of the lagoon were excluded to avoid effects of mixed land/water pixels. For each MODIS pixel (500 by 500 m), we selected ~256 “synthetic” MODIS spectra resampled from the Hyperion pixels (30 by 30 m each) that fell within it. The mean value of the spectral reflectance of the ~256 synthetic MODIS pixels selected in this manner, which we call here the Hyperion Synthetic MODIS (HSM) reflectance, were used to compare against the MODIS reflectance.

2.3. Radiative Transfer Model

For a nadir-viewing sensor, the above-surface remote sensing reflectance Rrs (sr−1), defined as the ratio of water-leaving radiance to downwelling irradiance, can be approximated as [26]:
R r s = 0.5 r r s 1 1.5 r r s
where rrs (sr−1) is the below surface remote sensing reflectance in the nadir looking direction. Following [25,26], rrs (sr−1) can be modeled as a function of the water depth, the optical properties of the water column, and the optical properties of the water bottom:
r r s = r r s d p [ 1 e ( k d + k u c ) H ] + ρ b π e ( k d + k u B ) H
where r r s d p (sr−1) is the subsurface remote sensing reflectance for an infinitely deep water, k d is the vertically-averaged diffuse attenuation coefficient for downwelling irradiance, and k u c and k u B are the vertically-averaged diffuse attenuation coefficients for upwelling irradiance from the water body and from the bottom, respectively. H (m) is the water depth, and ρ b is the bottom reflectance (assuming to be Lambertian). r r s d p , k d , k u c , and k u B can be calculated following [26]:
r r s d p = b b a + b b ( 0.17 b b a + b b + 0.084 ) k d = 1 c o s θ ( a + b b ) k u c = 1.03 ( a + b b ) 2.4 b b a + b b k u B = 1.04 ( a + b b ) 5.4 * b b a + b b
where a (m−1) and bb (m−1) are the total absorption and backscattering coefficients of water, respectively. θ (rad) is the subsurface solar zenith angle. bb is considered as a fraction of the total scattering coefficient (b (m−1)). We adopt a fixed ratio of b b / b = 0.019 suggested by existing observations in turbid waters [50] and assume this ratio to be independent of wavelength [21,51]. Both theoretical [52] and observational studies [53,54,55,56] show a weak spectral dependence of the b b / b ratio between 440 nm and 700 nm, with values in the range of 0.018–0.055 for measured turbidity ranges from 2.7 to 30 g/m3. Higher SSC values correspond to lower a b b / b ratio, and we consider the fixed value b b / b = 0.019 to be reasonable given the relatively turbid waters in the Venice lagoon. The mean (standard deviation) of summer and winter SSC are 25.5 (44.6) and 20.5 (33.3) g/m3, respectively. The high standard deviation of SSC suggests a marked temporal variability of suspended sediment, which is mainly wind/tidal driven in the lagoon.
a and b can be estimated as:
a = a w + a n a p + a p h + a c d o m b = b w + b n a p + b p h
where aw (m−1), anap (m−1), aph (m−1), and acdom (m−1) are the absorption coefficients of pure water, inorganic particles, phytoplankton, and colored dissolved organic matter (CDOM), respectively. bw (m−1), bnap (m−1), and bph (m−1) are the backscattering coefficients for pure water, inorganic particles, and phytoplankton. aw is obtained from previous studies [57]. anap, and aph are modeled as a function of SSC, CC, and their corresponding specific absorption coefficients a N A P * ( λ ) and a p h * ( λ ) , respectively [21,27].
a N A P ( λ ) = a N A P * ( λ ) × S S C a p h ( λ ) = a p h * ( λ ) × C C
Field measurements show that a N A P * ( λ ) follows an exponential decay with increasing wavelength, while a p h * ( λ ) has a bimodal behavior with two peaks located at 440 and 675 nm [27]. Following [21,58], we model a N A P * as: a N A P * ( λ ) = γ × 0.75 × e 0.0128 ( λ 443 ) , in which γ (m2/g) is a calibration parameter. a p h * ( λ ) values are obtained from [27] as measured during a field campaign in the Venice lagoon.
We assume that a c d o m ( λ ) also follows an exponential function [21,58]:
a c d o m ( λ ) = a c d o m * e 0.0192 ( λ 375 )
where a c d o m * is a c d o m at λ = 375 nm. Due to a lack of CDOM measurement specific for this study, we used a fixed a c d o m * = 1.25   m 1 , which is consistent with field measurements [59] and other modeling studies [21] from the Venice lagoon.
In turbid waters, bw and bph are negligible with respect to bnap in Equation (4) [21,58]. Following Volpe et al. [21], we model bnap as a function of SSC and its corresponding suspended sediment specific backscattering coefficient ( b n a p * ( λ ) ).
b n a p ( λ ) = b n a p * ( λ ) * S S C
We assume b n a p * ( λ ) = η * ( 400 / λ ) 0.3 following [60], where η [m2/g] is a calibration parameter. As reported in Venier et al. [36], the median sediment diameter ranges from 10 to 74 μm and the bottom sediment is chiefly composed of sandy silts. Given the narrow range of sediment diameter, we consider a single b n a p * ( λ ) value to be sufficient in this study area (e.g., [21,27]).
Combining Equations (1)–(7), we obtain:
S S C E = f R ( η , γ ,   ρ b , H , θ ,   α w ( λ ) ,   a p h * ( λ ) , a C D O M * , C C , R r s ( λ ) )
Equation (8) is the inversion of the radiative transfer model (RTM) and can be solved numerically to estimate SSC (denoted as SSCE). The parameters used in Equation (8), and their typical values and ranges, are summarized in Table 2. It should be noted that the reported ranges of ρ b , a p h * ( λ ) , and a w ( λ ) refer to the observed variability as a function of wavelength λ from 460 nm to 700 nm.

2.4. Empirical Retrieval Models

Various empirical models have been developed to correlate SSC with remote sensing reflectance. Readers may refer to [19] for a detailed review. In many cases, a linear regression of SSC with a single “Red” band or with a NIR/Red ratio shows high correlations, especially for highly turbid waters (e.g., [48,49,61,62,63,64,65]). Other methods use log-linear (e.g., [66]), exponential (e.g., [67]), or linear regressions over multiple spectral bands [68,69]. However, the regression coefficients retrieved through in-situ calibration are typically site-specific and are not generally applicable to other datasets. Given the range of observed reflectance (0.01–0.04 sr−1) and turbidity data (4–100 g/m3) as shown in Table 2, we found the log-linear or exponential models inappropriate. In this study, we apply polynomial functions (first and second order) that relate SSC with either the reflectance of an individual spectral band, R r s ( λ ) , or with the ratio of reflectance values from pairs of spectral bands, R r s ( λ 2 ) / R r s ( λ 1 ) , where λ , λ 1 and λ 2 cover the same range of wavelengths used in the RTM for a direct comparison. Bottom reflectance was not taken into account since most sensors are installed in locations where water depth are greater than 1.3 m (Table 2), above which the contribution of the bottom reflectance is less than 10% of the total reflectance for turbid waters typical of the Venice lagoon [21].
S S C E = { f E , 1 ( R r s ( λ ) ) f E , 2 ( R r s ( λ 2 )   R r s ( λ 1 ) )

2.5. Calibration and Validation

The RMSE between estimated and measured SSC is used to evaluate model performance:
R M S E = 1 N ( S S C S S C E ) 2 N
where N is the number of measurements.
For the RTM (Equation (8)), the absorption and backscattering coefficients of the suspended sediment, ( γ and η ), are calibrated to minimize RMSE. For the empirical models (Equation (9)), the coefficients of the polynomial functions are calibrated to minimize RMSE. In the calibration process, Equation (10) is evaluated iteratively so as to determine the combination of coefficients ( η , γ for RTM and regression coefficients for empirical models) that obtains the minimal RMSE. To validate the prediction performance of different models, we use a leave-one-out approach, in which one observation is left out from the calibration sample and is later used to compute a mean square distance between SSC and SSCE based on this independent observation. By leaving out in succession, one element at a time from the available sample, and using this element to estimate the predictive error, an RMSE value can be computed that characterizes the predictive abilities of the model [21,70,71].

2.6. Spectral Band Selection

The use of hyperspectral data involves the adoption of a strategy for spectral band selection. Brando and Dekker [28] and Giardino et al. [73] used a semi-analytical retrieval approach to estimate water constituent concentrations through a direct inversion of the bio-optical model, given that the number of spectral bands equals the number of unknowns. Through trial and error, Brando and Dekker [28] selected three spectral bands (centered at 490 nm, 670 nm, and the average of five spectral bands from 700–740 nm) for estimating SSC, chlorophyll-a concentration (CC), and CDOM. Based on a first-derivative approach, Giardino et al. [73] first evaluated the sensitivity of spectral bands to one water constituent at a time, and then used the average of two groups of spectral bands (480–500 nm and 550–560 nm) to estimate CC and SSC. In both studies, the usefulness of other unselected hyperspectral bands, which could be beneficial, remained unknown. Santini et al. [27] estimated SSC and CC by minimizing the sum of square errors between the observed and modeled remote sensing reflectance evaluated at all hyperspectral bands (e.g., 22 Hyperion bands from 488 to 702 nm, and 41 spectral bands from 472 to 700 nm obtained from the compact airborne spectrographic imager, or CASI), weighted by the signal-to-noise ratio of each spectral band. Compared with the direct inversion method, this approach utilizes all available hyperspectral bands, which can potentially better constrain the model. However, data redundancy can cause convergence problems, and noise in any spectral band will propagate nonlinearly to the retrieval results [74]. Lee and Carder [75] first demonstrated that around 15 spectral bands in the visible spectrum are adequate for simultaneously retrieving SSC, CC, CDOM, water depth, and bottom albedo using hyperspectral data. Lee et al. [76] then identified the optimal spectral locations of the bands by applying first- and second- derivative analysis of the remote sensing reflectance. However, the optimal spectral band(s) for retrieval of individual water constituent (e.g., SSC) remains undetermined.
In summary, previous studies involving hyperspectral data explored the use of a number of spectral bands (e.g., 2 or 3) equal to the number of unknowns, all available spectral bands, and multiple (around 15) selected spectral bands for simultaneously retrieval of several water constituents. A systematic evaluation of the set of spectral bands that maximizes information utilization and minimizes redundancy for SSC retrieval is still lacking. Here we apply three types of band selection procedures to calibrate and validate both the RTM (with two unknown parameter γ and η in Equation (8)) and the empirical models (up to three fitting parameters in Equation (9)). First, we use all available spectral bands (24) similar to [27]. Then, we choose spectral bands centered at 560 nm and 660 nm following [28] and [73]. The spectral bands centered at 490 nm were not considered, because the blue spectral region is relatively noisier than other regions for Hyperion data [28,73]. Finally, given the model complexity (2–3 unknown parameters), we explore a subset of combinations of up to four spectral bands ( i = 1 4 ( 24 i ) , where i is the number of spectral bands). Ideally, all combinations of spectral bands should be tested since a large number of spectral bands could be beneficial for model calibration. However, we observed diminishing returns when exploring combinations beyond three spectral bands (see Section 3.3), suggesting that a further increase of spectral bands may provide little improvement. In addition, given the size of our dataset (24 candidate Hyperion bands), further increasing the number of spectral bands would be computationally demanding given the non-linearity of Equation (8). As a result, we tested the combinations of up to four spectral bands to contain the computational burden of the process.

3. Results

3.1. Atmospheric

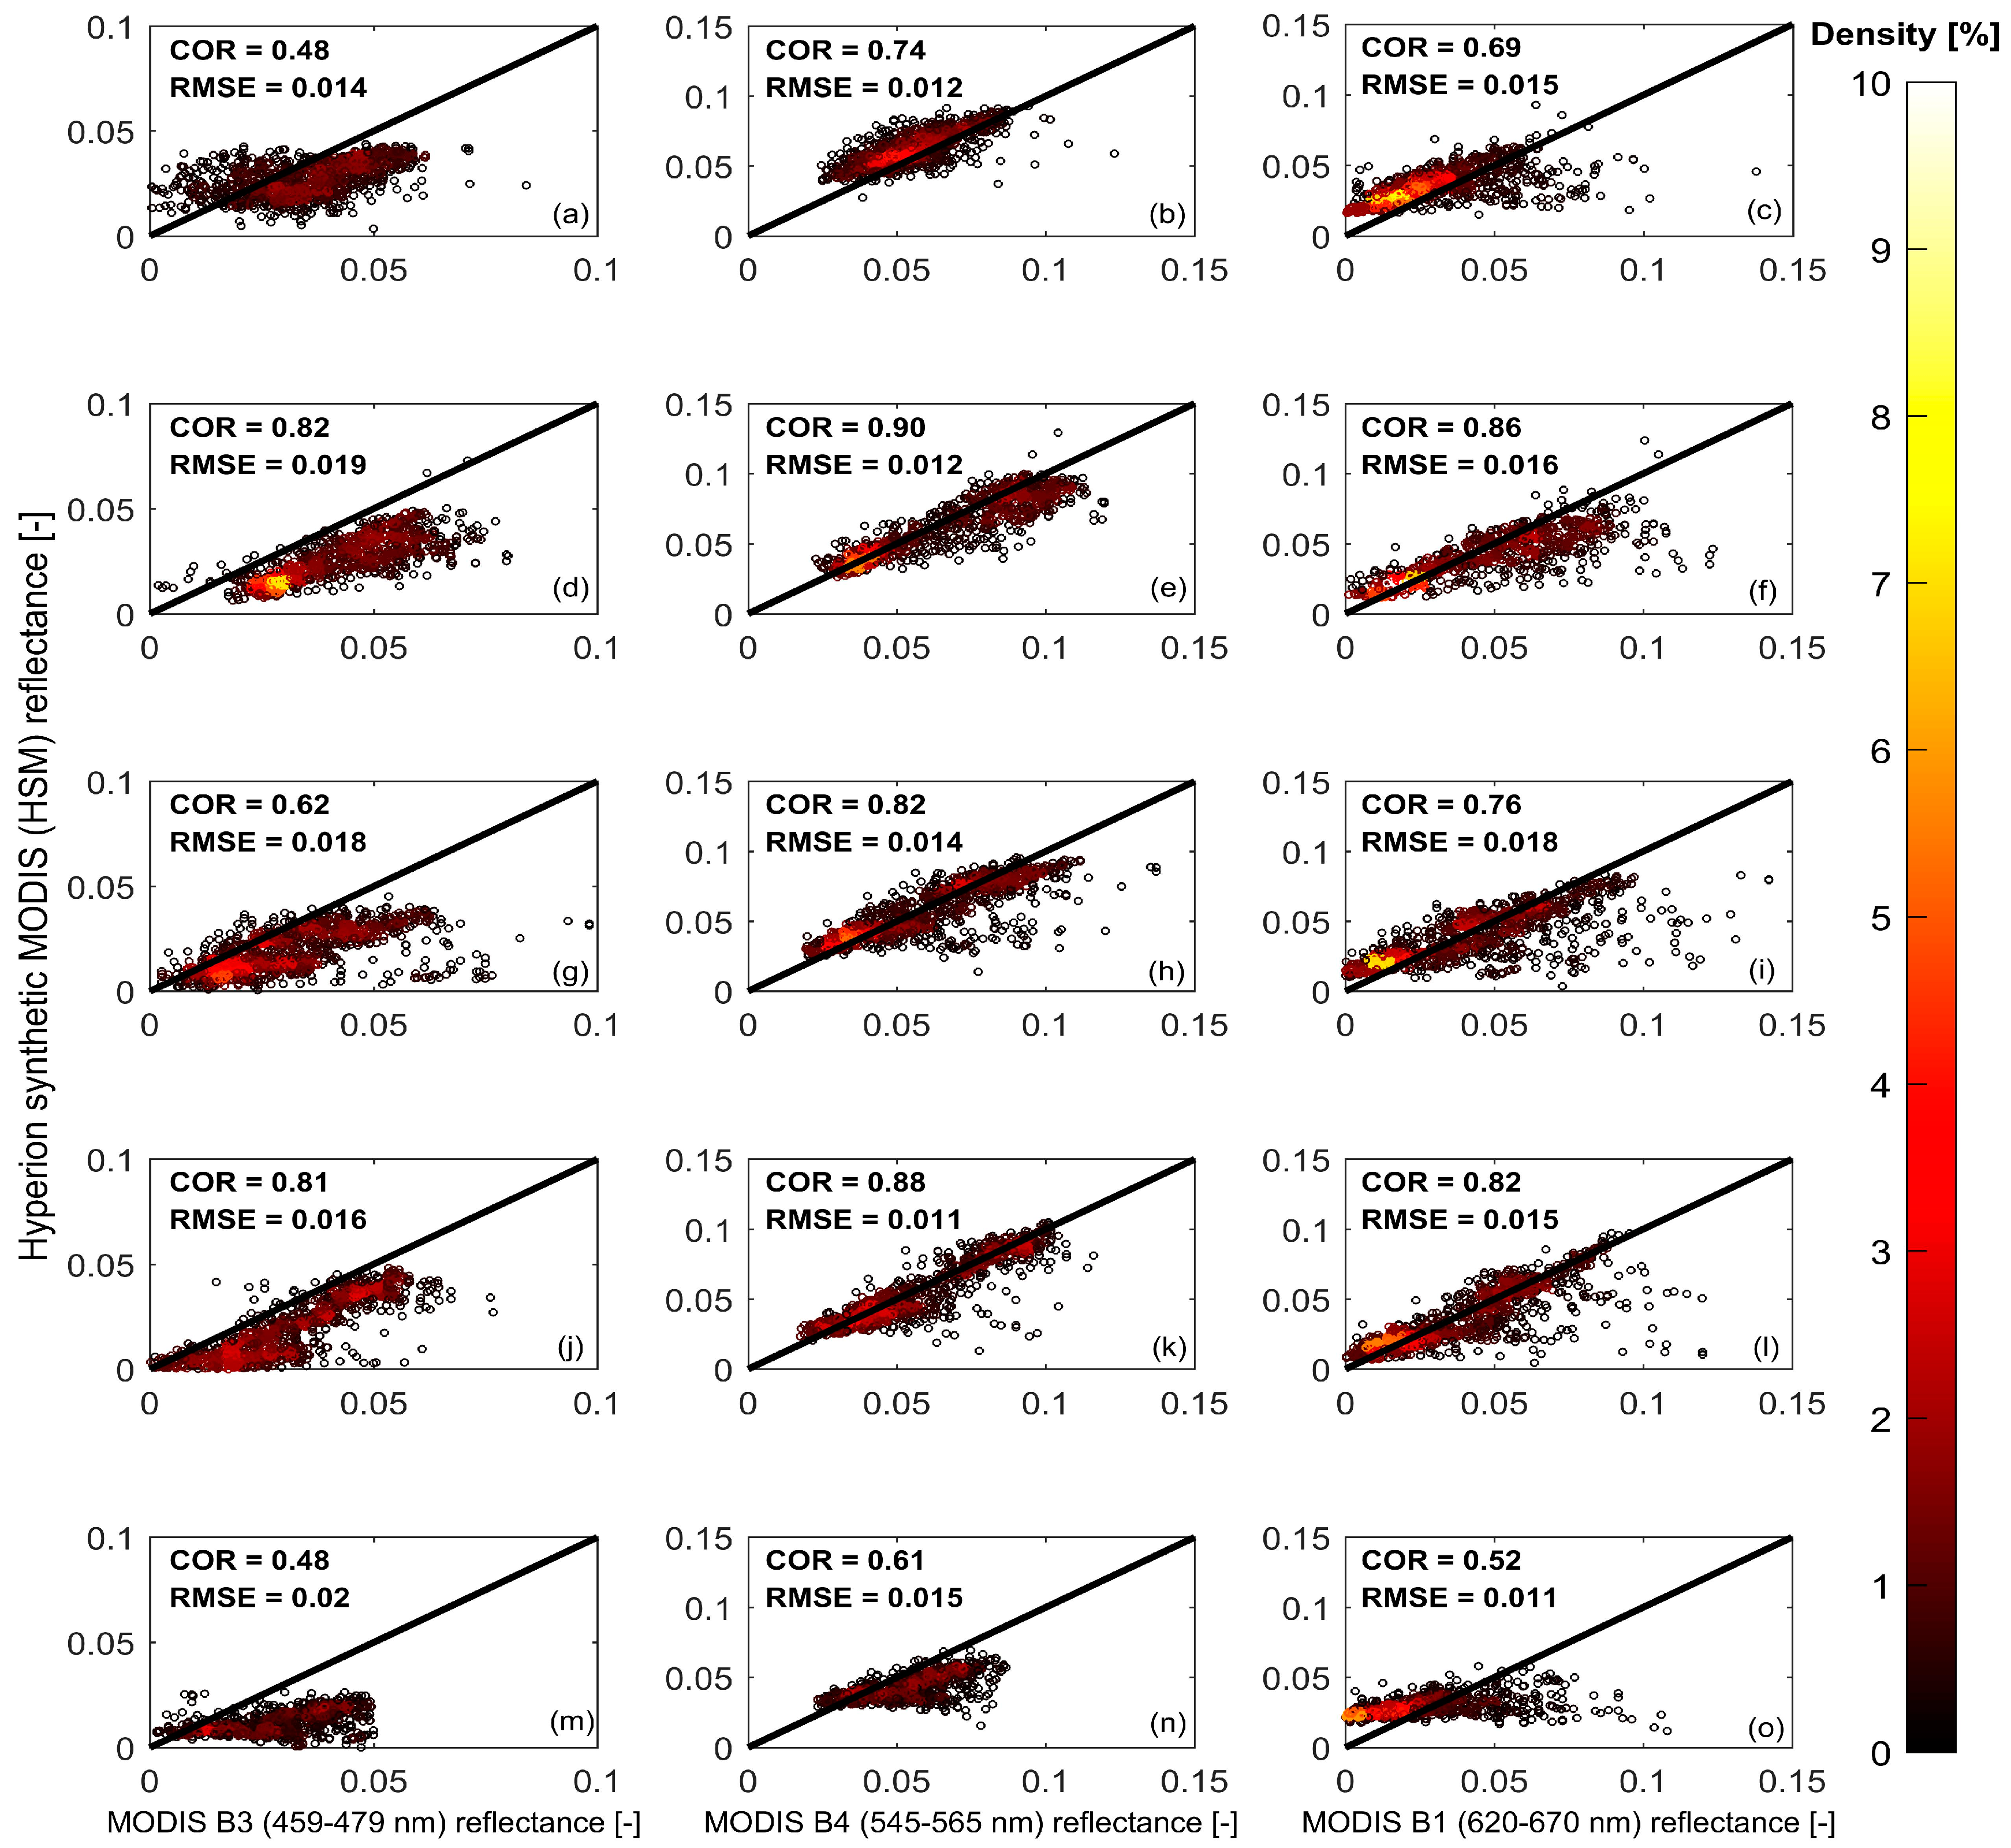
We first compared a set of above-surface Correction Validation reflectance spectra from MODIS pixels and the Hyperion pixels falling within the same MODIS pixels (not shown here). The comparison shows a good agreement, suggesting a successful atmospheric correction of the Hyperion scenes using ACORN. For a direct comparison, we plot the reflectance from a MODIS product (MOD09) against Hyperion Synthetic MODIS (HSM) in Figure 2. In this figure, each row of subplots represents different MODIS bands derived from a single Hyperion scene and each column of subplots represents different Hyperion scenes with an identical MODIS band. The Spearman’s rank correlation coefficient (COR) and root-mean-square-error (RMSE) are calculated for each subplot to quantify the agreement between the two datasets.
The values of the COR show that the HSM reflectance is positively correlated with MODIS reflectance for all data. A scene-to-scene comparison indicates that HSM and MODIS reflectance are less-correlated for data collected in winter seasons than summer seasons. In particular, the data collected on 7 January 2006 (Figure 2m–o) has the lowest reflectance and the smallest COR values compared with the remaining scenes. We suggest that the low reflectance on that specific day is related to a low SSC value (only 10.8 g/m3 averaged over all stations, about half of the winter seasonal mean 20.5 g/m3) that effectively reduced reflectance. Also, it has been shown that a low solar zenith angle (typical of winter time) will greatly attenuate the signal-to-noise ratio (SNR) of Hyperion, especially on a water surface [77,78,79]. As a result, the small COR is due to a combination of this low reflectance and a low SNR. A band-to-band comparison shows that RMSE values are generally smallest for band 4 (545–565 nm), medium for band 1 (620–670 nm) and largest for band 3 (459–479 nm). This can be attributed to the fact that the spectral reflectance of a water surface tends to be higher in the “Green” than both “Red” and “Blue” part of the spectrum. Also, the Hyperion data were found to be noisy in the “blue” part of the spectrum [28,73]. On the other hand, the accuracy of the MOD09 product has been evaluated against global AERONET measurement, with satisfactory performance except for band 3, which is mainly used for aerosol inversion [46]. When evaluated at the ISDGM-CNR site using 2000–2009 data, the mean bias (root-mean-square deviation) of the MOD09 product is 8.7% (9.4%), 37% (39%), and 12.8% (13.5%) for bands 1, 3, and 4 respectively [80]. Given the different spectral and spatial resolution, the difference in the acquisition times (around 30 min), the uncertainties associated with the atmospheric correction algorithm of both dataset, and the construction of the synthetic bands, the general agreement between MODIS and HSM reflectance in the “Green” and “Red” parts of the spectrum suggests that the correction applied to the Hyperion data was effective in removing atmospheric effects. In contrast, the utilization of the Hyperion data in the “blue” part of the spectrum will be considered critically since both the Hyperion and MOD09 products are problematic.

3.2. Evaluation of Bottom Reflectance

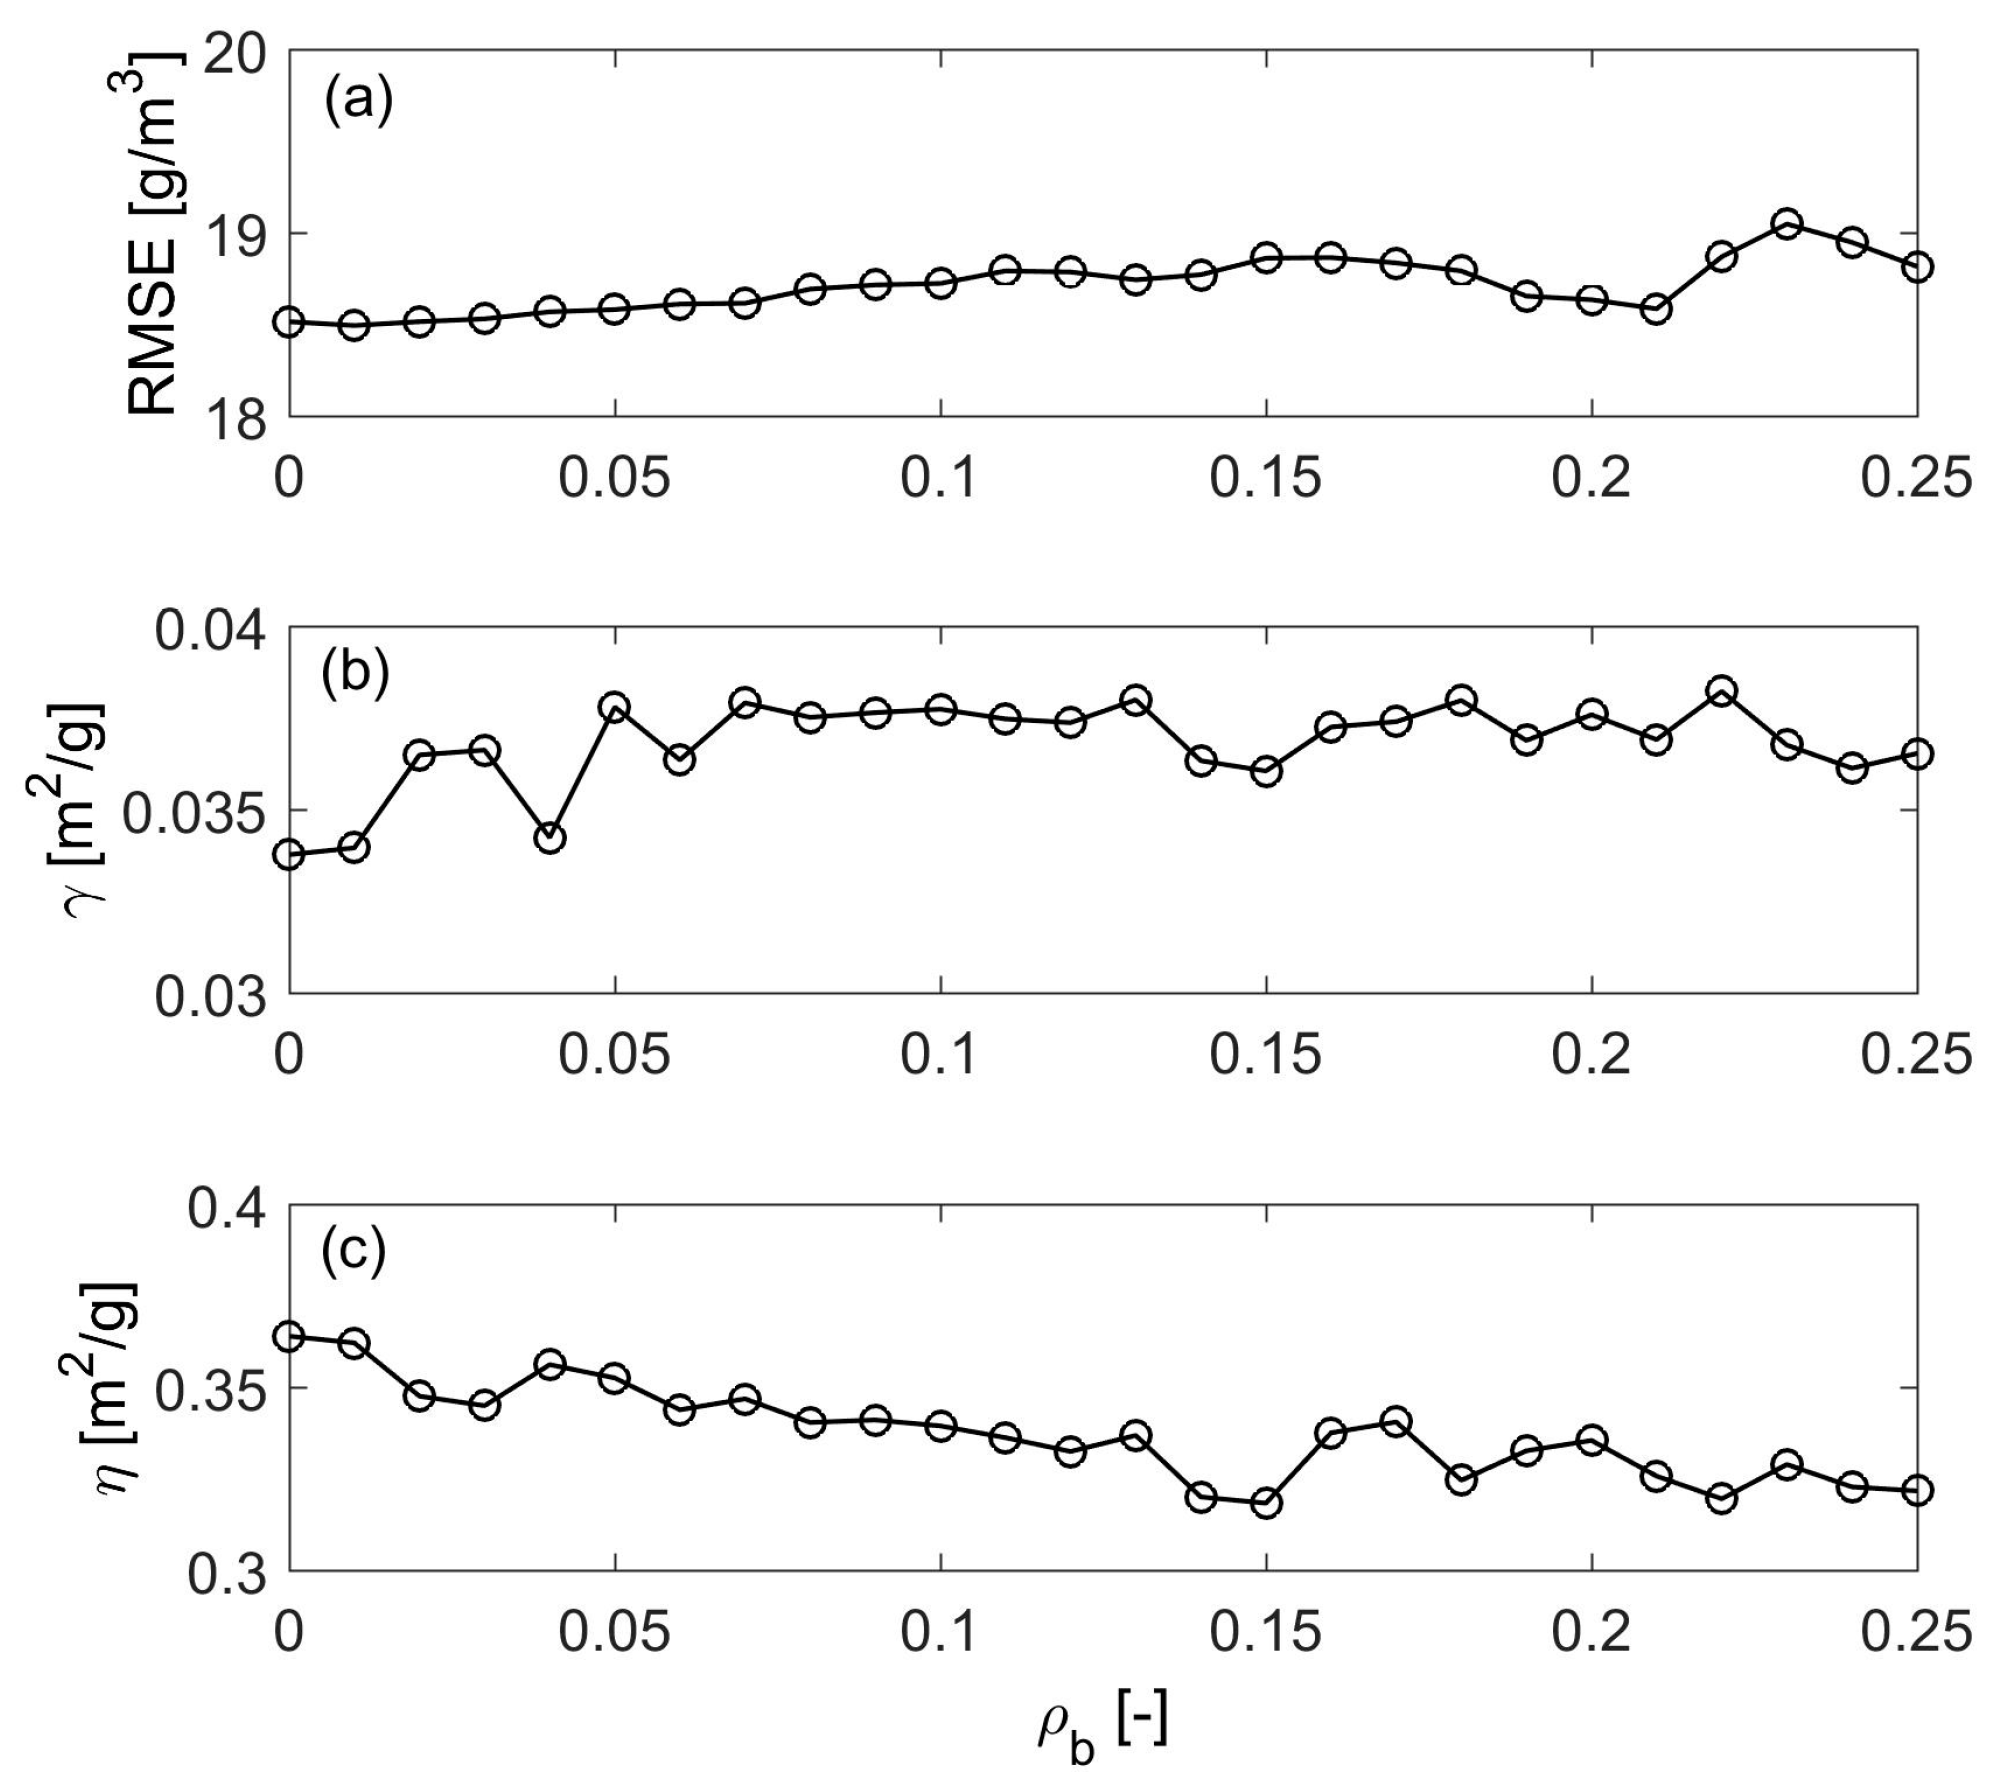
The contribution of bottom reflectance ( ρ b ) to the total amount of R r s is a function of water depth, bottom reflectance, and concentrations of water constituents, as described in Equation (2). Volpe et al. [21] tested typical values of ρ b observed in the Venice lagoon, and showed that the effect of ρ b to the total reflectance is less than 10%, with water depth greater than 1.3 m and turbidity greater than 20 g/m3. Given an averaged water depth of 1.6 m and an averaged turbidity of 22 g/m3, we expect the effect of ρ b to be minimal as suggested by [21]. In order to confirm this for the Hyperion dataset, we apply the inversion of the RTM (Equation (8)) to estimate SSC using all 24 Hyperion bands with a range of typical ρ b values and keep other parameters unchanged, except for the calibration parameters ( γ and η ). We compare the RMSE (Equation (10)), and the calibrated γ and η values given different ρ b inputs to evaluate the model’s sensitivity to ρ b parameterization.
Since the main bottom sediment type is silt in the Venice lagoon [21], we selected the range of ρ b from 0 to 0.25, based on literature values for the reflectance of silt sediments that ranges from 0.04 to 0.22 [81,82]. As shown in Figure 3, this sensitivity analysis shows that the RMSE is relatively unchanged with respect to the different ρ b values. Though the calibrated γ value is relatively unaffected, the calibrated η value decreases slightly when ρ b increases. In a previous field campaign conducted in the Venice lagoon, measured mean ρ b was between 0.017 to 0.029 sr-1 from 460 nm to 700 nm [21], which translates to a range of 0.05 to 0.09 if the bottom is assumed to be Lambertian (Table 2). Given the relative insensitivity of model results to ρ b within its measured range (Figure 3), and to minimize the number of parameters, we decide to use a single value of ρ b = 0.085 (measured 0.027 sr−1 at 644 nm) similar to [21] in the following analysis.

3.3. SSC Estimation Using Hyperion Data

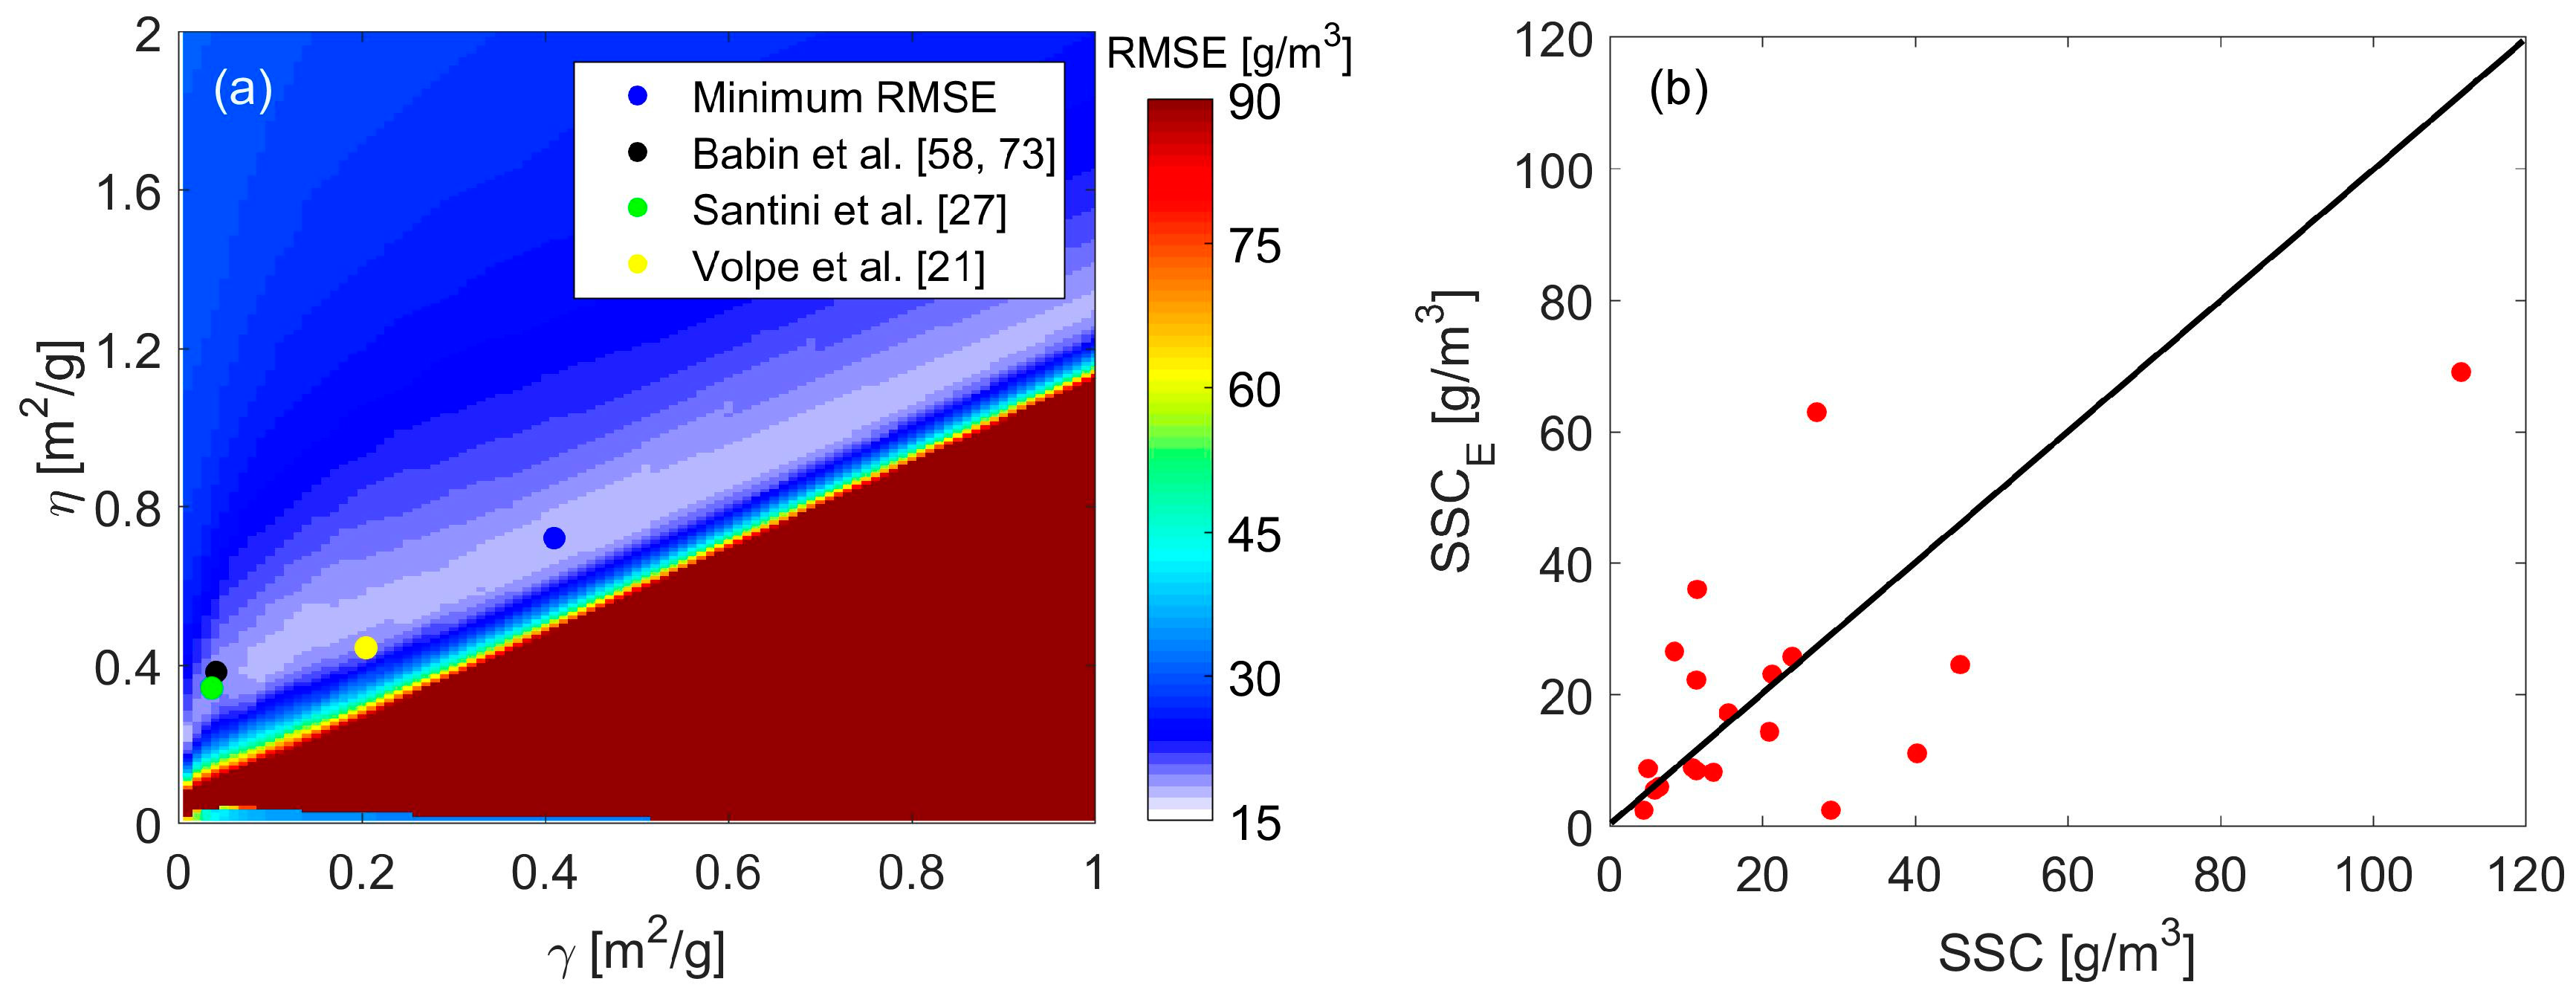
The atmospherically corrected Hyperion data are used to calibrate the parameters in the RTM and the empirical models. The results from solving the inversion of the RTM (Equation (8)) using all 24 Hyperion bands are plotted in Figure 4. The RMSE estimated from Equation (10) is plotted as a function of γ and η in Figure 4a. The RMSE plot can be roughly divided into two regions by a quasi-linear relationship between γ and η : η / γ = r . In the lower right part of the plot, where η / γ < r , the RMSE increases dramatically with relatively small changes of γ and η . In this part of the parameter space, the model fails completely. In the upper left part of the plot, where η / γ > r , the RMSE shows a concave shape. It decreases quickly moving away from the line of η / γ = r and reaches a region of local minima, and then increases gradually in the up and left direction. In between these regions, we find a cluster of γ , η pairs, which correspond to local RMSE minima and are roughly aligned parallel to the line η / γ = r . This observation further constrains the calibration of the parameters γ and η , identifying a small range of parameter values for which the model shows an approximately optimal performance (light blue/white in Figure 4a). Values of γ and η measured in situ in the Venice lagoon [27], in nearby regions [58,72], or from model calibration [21], tend to fall within this area of RMSE local minima, and within 10% of the global minimum. Figure 4b compares the values of estimated SSCE using Equation (8) (with γ and η corresponding to the minimum RMSE in Figure 4a) to measured SSC. There is a general agreement between retrieved and observed SSC values, even though the lack of an adequate number of large SSC values prevents a definitive validation of the hyperspectral retrievals.
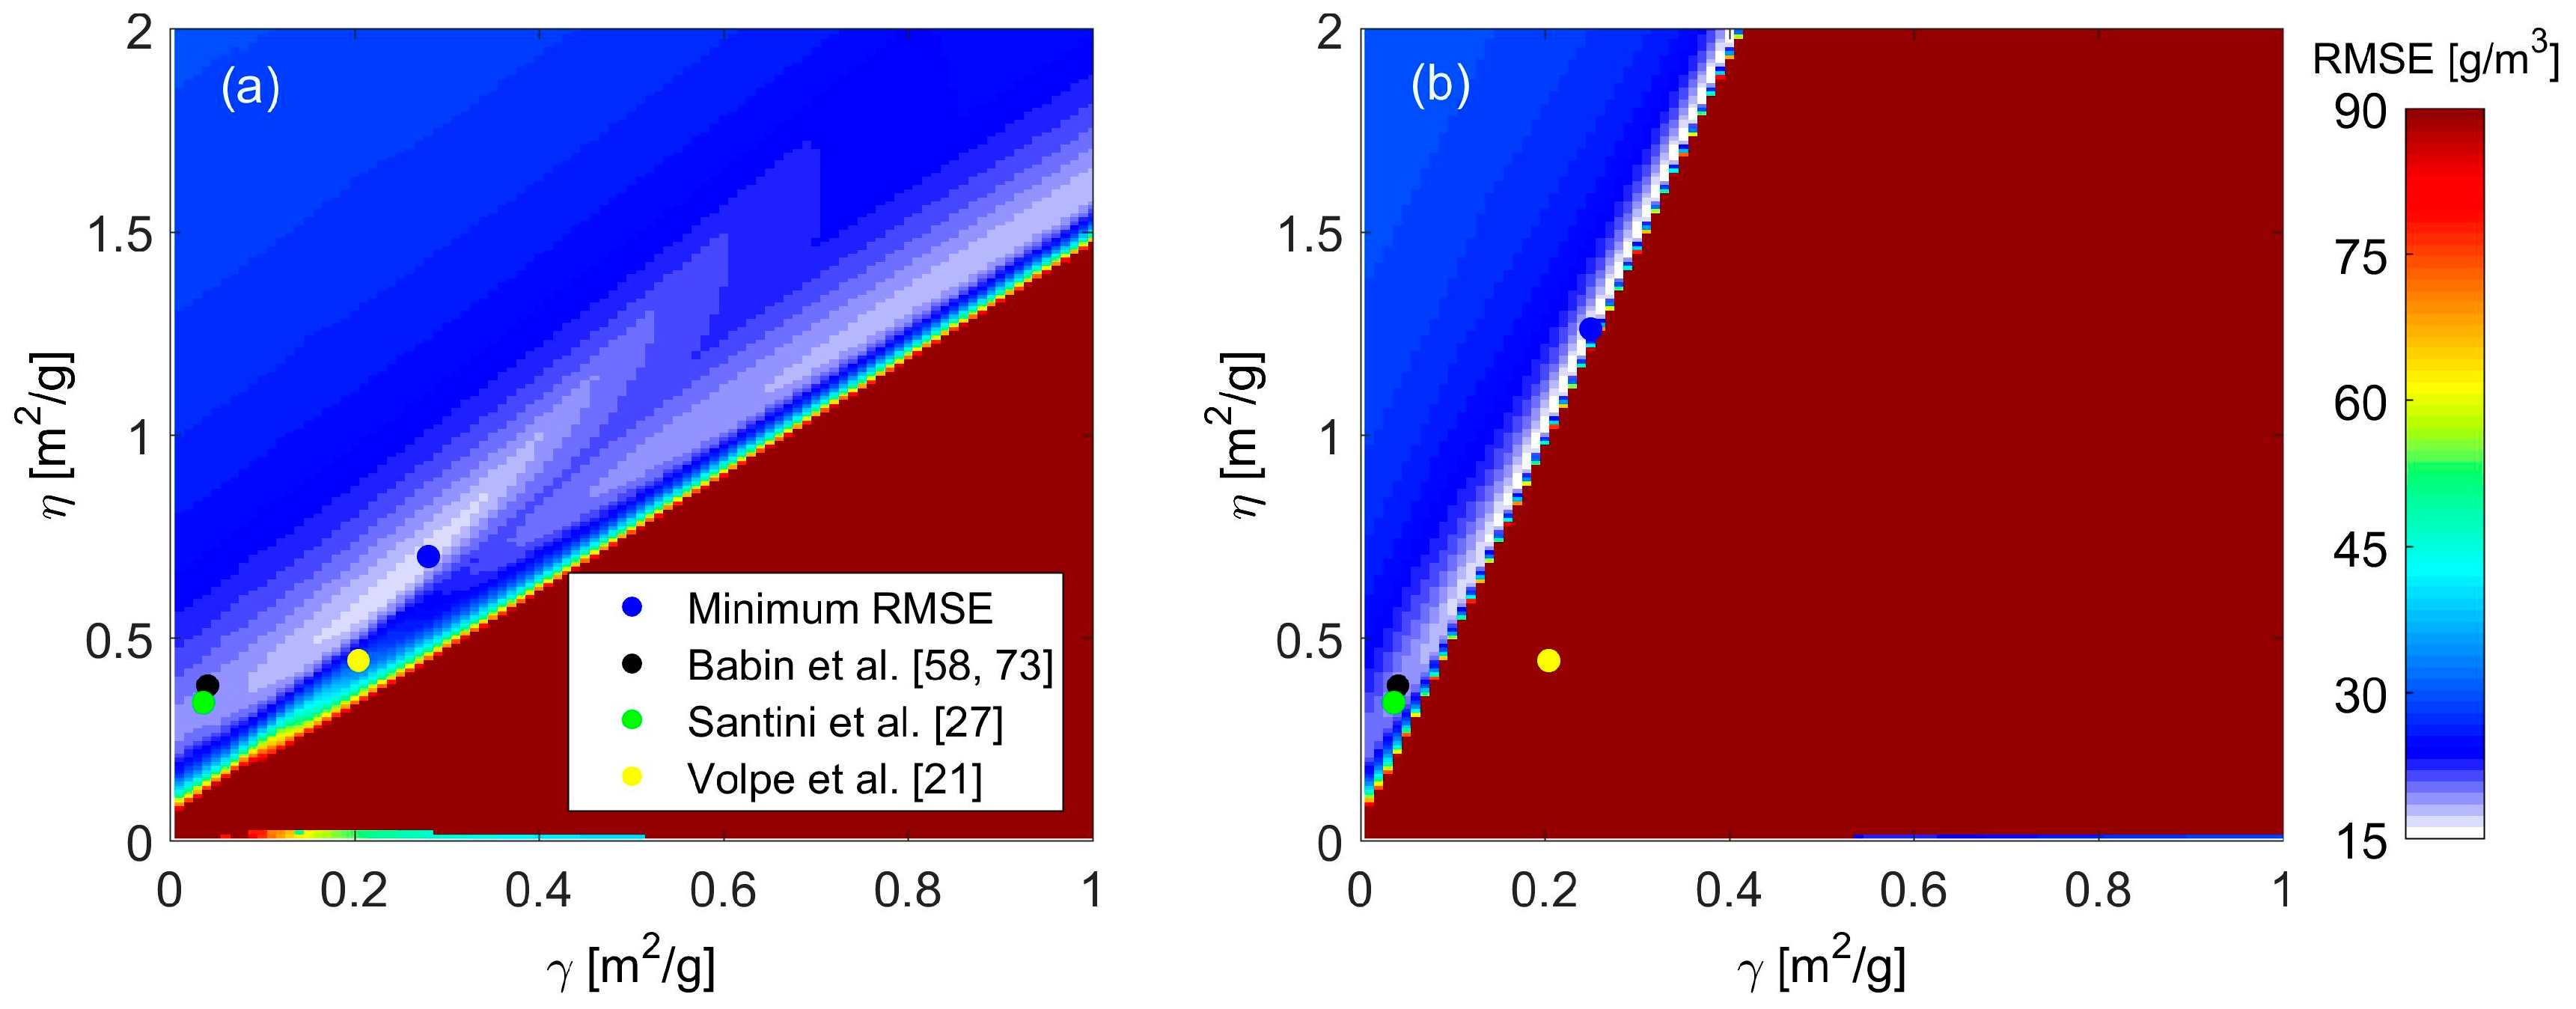
Following Brando and Dekker [28] and Giardino et al. [73], two groups of spectral bands centered at 560 and 660 nm are used to estimate SSCE using the RTM. Since we are interested in comparing the performance of hyperspectral data against multispectral data, we choose nine spectral bands from 520 nm to 600 nm and seven spectral bands from 630 nm to 690 nm, which correspond to typical multispectral sensor bands, such as those from Landsat ETM+ (Table 1). This choice of spectral bands allows a direct comparison between data obtained from different sensors (and times) with similar spectral ranges but different resolutions. Figure 5 shows the RMSE obtained from calibrating Equation (10) with different combinations of γ and η , using these two groups of spectral bands. Comparing Figure 5 with Figure 4a, we can clearly notice a similar pattern, with a shift of the cluster of the nearly-optimal γ and η pairs. Interestingly, we find that the in situ measurements of γ and η still correspond to a RMSE within 10% of global minimum. However, the model-calibrated γ and η values from Volpe et al. [21] deviate from the local minimum region. This discrepancy might be caused by the fact that the γ and η values from Volpe et al. [21] are based on multispectral remote sensing data, while this study uses different spectral bands (narrower than multispectral bands) from a different data set.
Here we validate Equation (8) using the leave-one-out method as detailed in Section 2.5. The values of RMSE minima obtained from the model calibration and validation are shown in Table 3, when considering all 24 Hyperion bands from 460 nm to 700 nm, and spectral bands near 660 nm and 560 nm. As expected, the RMSE calculated using the leave-one-out validation approach is higher than the values obtained from calibration. Spectral bands centered at 660 nm give the lowest RMSE for both calibration and validation. The spectral bands centered at 560 nm show a slightly larger RMSE for validation, and smaller difference of RMSE between model calibration and validation. The similar RMSE values obtained from very different band selections suggest that the semi-analytical model is relatively insensitive to the specific selection of spectral bands. However, use of a subset of spectral bands leads to a smaller RMSE compared to the use of all available spectral bands. This finding strongly suggests that many Hyperion bands are redundant or cross-correlated for the purpose of SSC retrieval. Therefore, the use of an excessive number of spectral bands will introduce additional noise, thus adversely affect SSC retrieval.
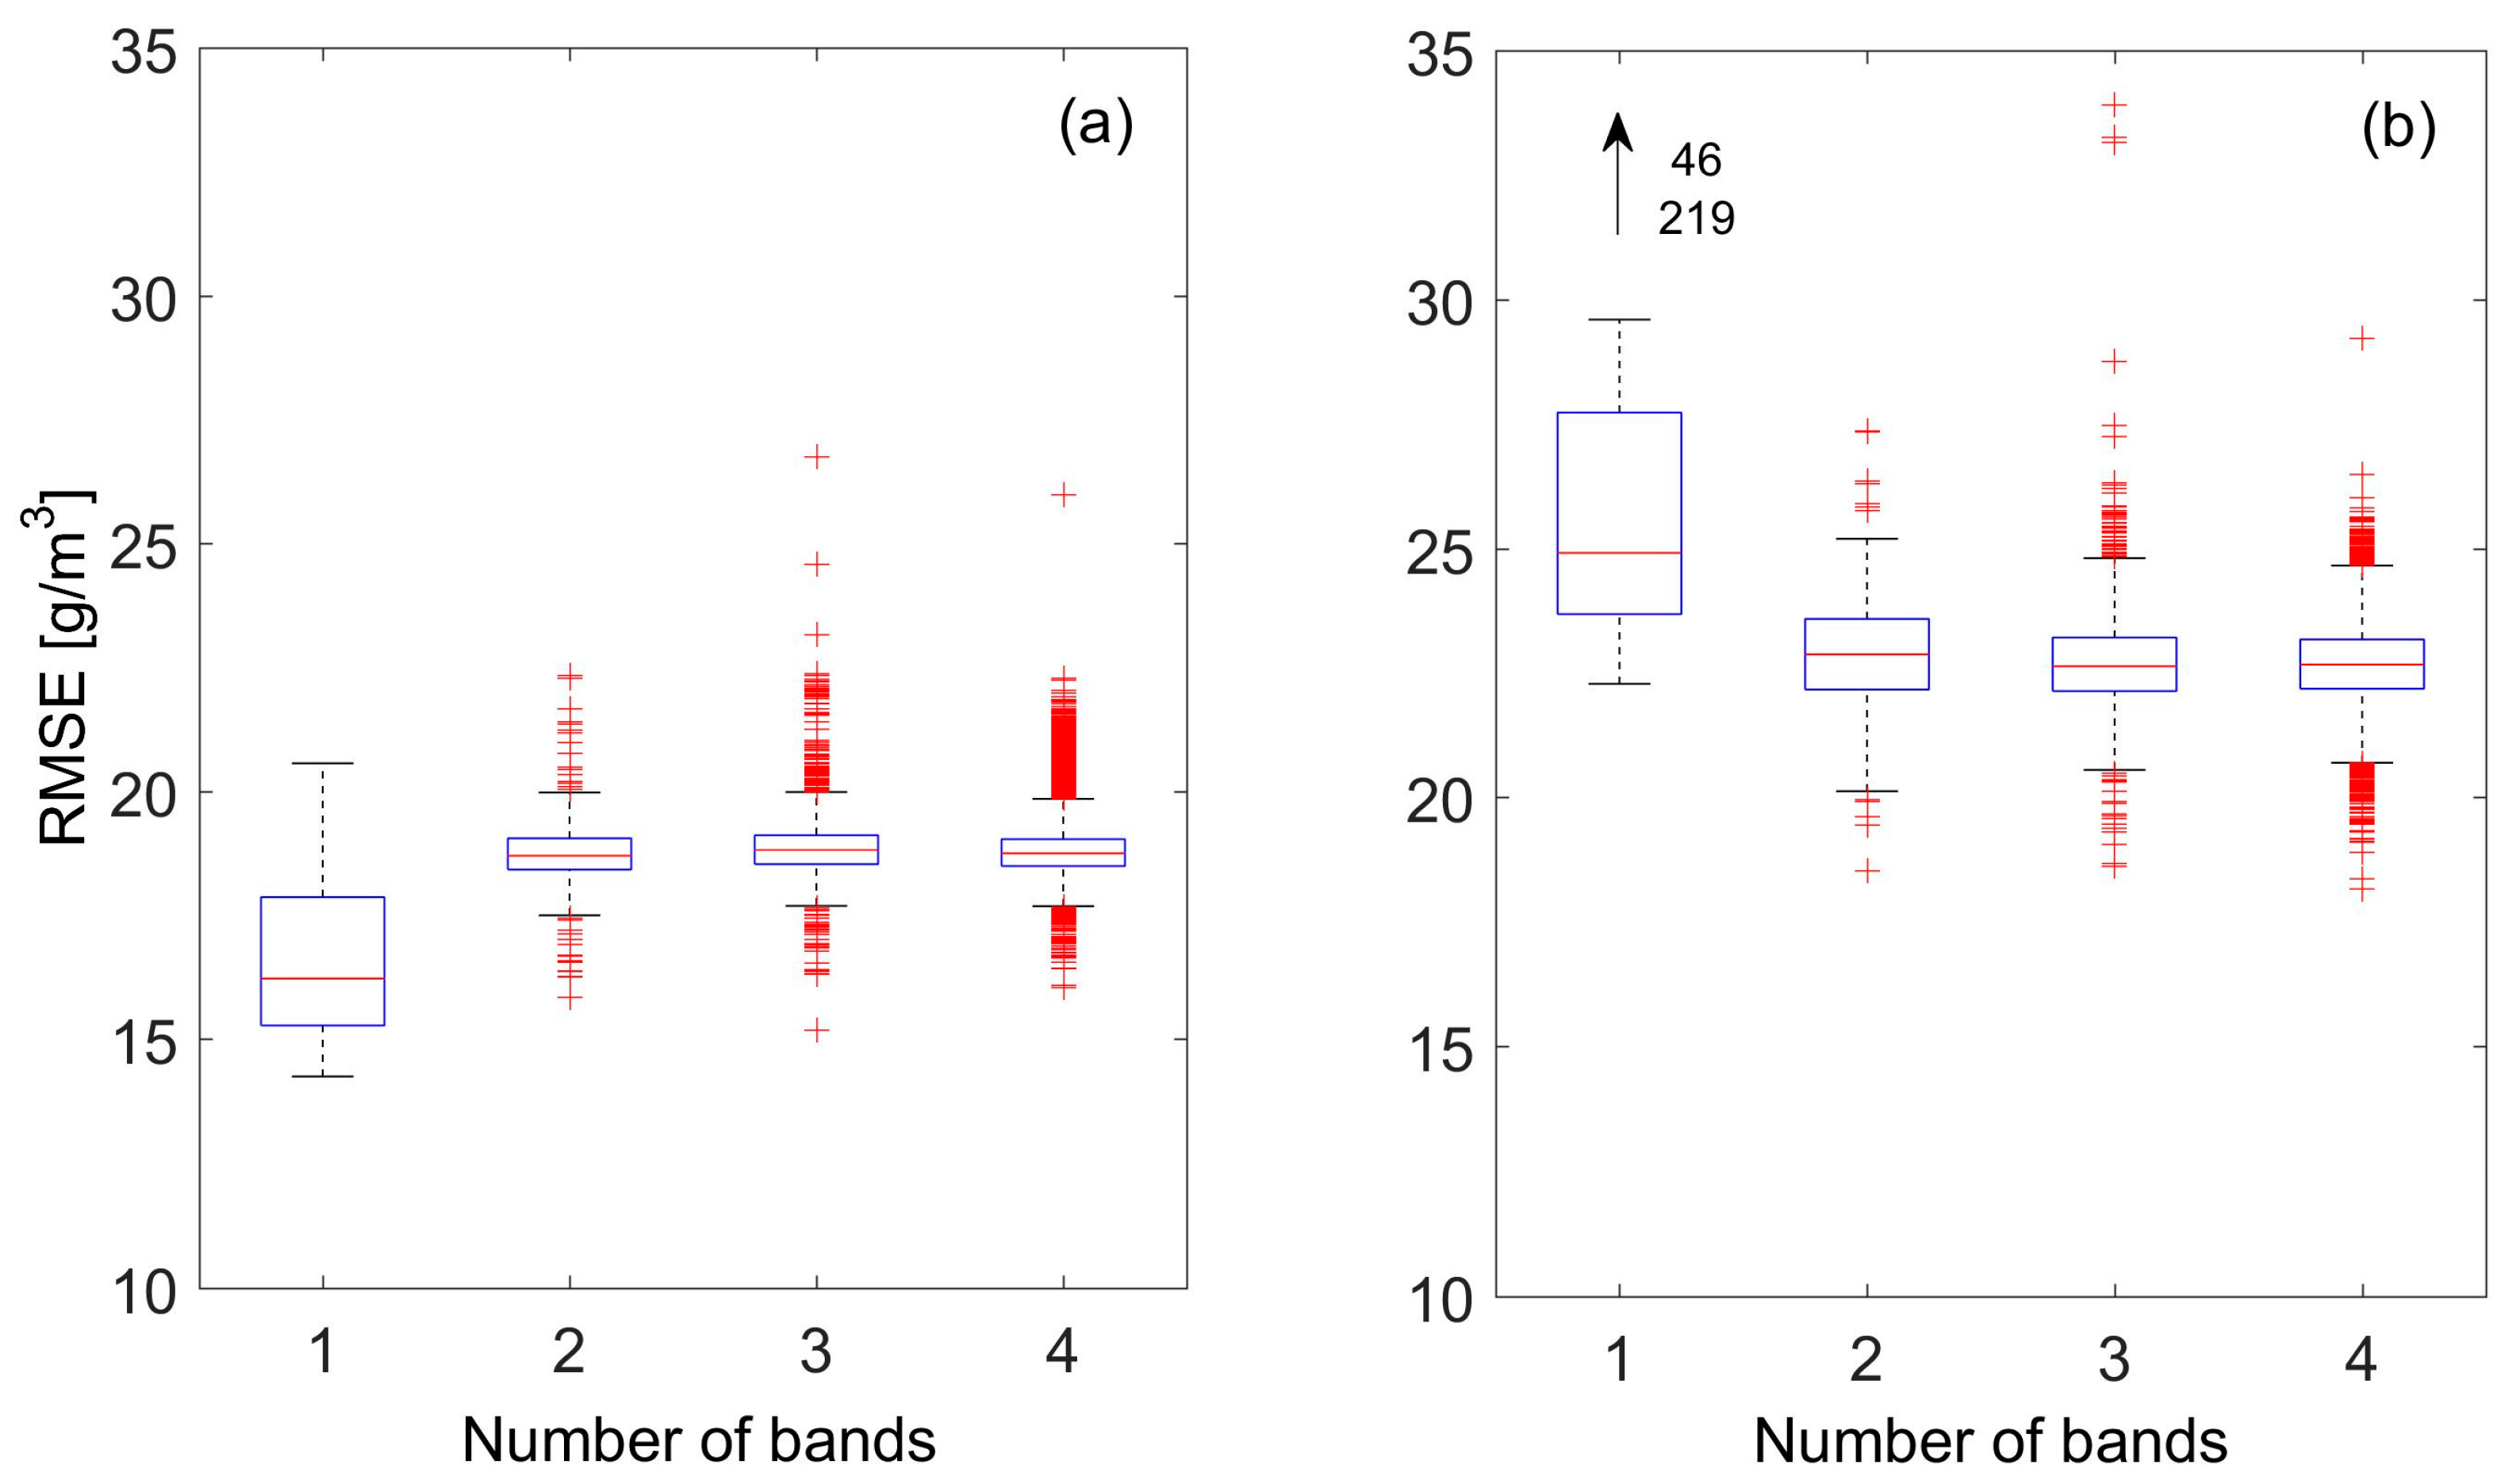
Finally, we explore the calibration and validation of inversion of the RTM (Equation (8)) using a subset of up to four spectral bands (the total number of such combinations being i = 1 4 ( 24 i ) , where i is the number of spectral bands). When i = 1 (single spectral band), we report the RMSE values when calibrating/validating the Equation (8) using each of the 24 spectral bands. When i > 1 (multiple spectral bands), we report the statistics (median and variance) of the RMSE with respect to all the combinations explored for that particular value of i. Figure 6 shows the modeled RMSE as a function of the number of spectral bands used for both model calibration (Figure 6a) and validation (Figure 6b). It should be noted that the combination of two spectral bands performs nearly as well as the combination of three or four spectral bands in terms of minimum and median RMSE for both model calibration and validation, and adding more spectral bands does not significantly improve the model performance. This can be further validated when comparing against the RMSE estimated using all available spectral bands and two groups of spectral bands recommended by other studies (Table 2). Compared with the cases of combinations of 2–4 spectral bands, the single spectral band method has higher data variability around the median. Though the single spectral band approach yields the smallest median and minimum RMSE for model calibration, its performance degrades dramatically in the model validation. In contrast, for both calibration and validation, combinations of 2–4 spectral bands show more robust and consistent performance than use of a single spectral band. These results can be interpreted by considering that the two parameters ( γ and η ) remain poorly constrained when just one spectral band is used in the calibration/validation process (even though the system is still over-determined, since as many conditions as observations, i.e., 20, are imposed in the calculation of the RMSE).
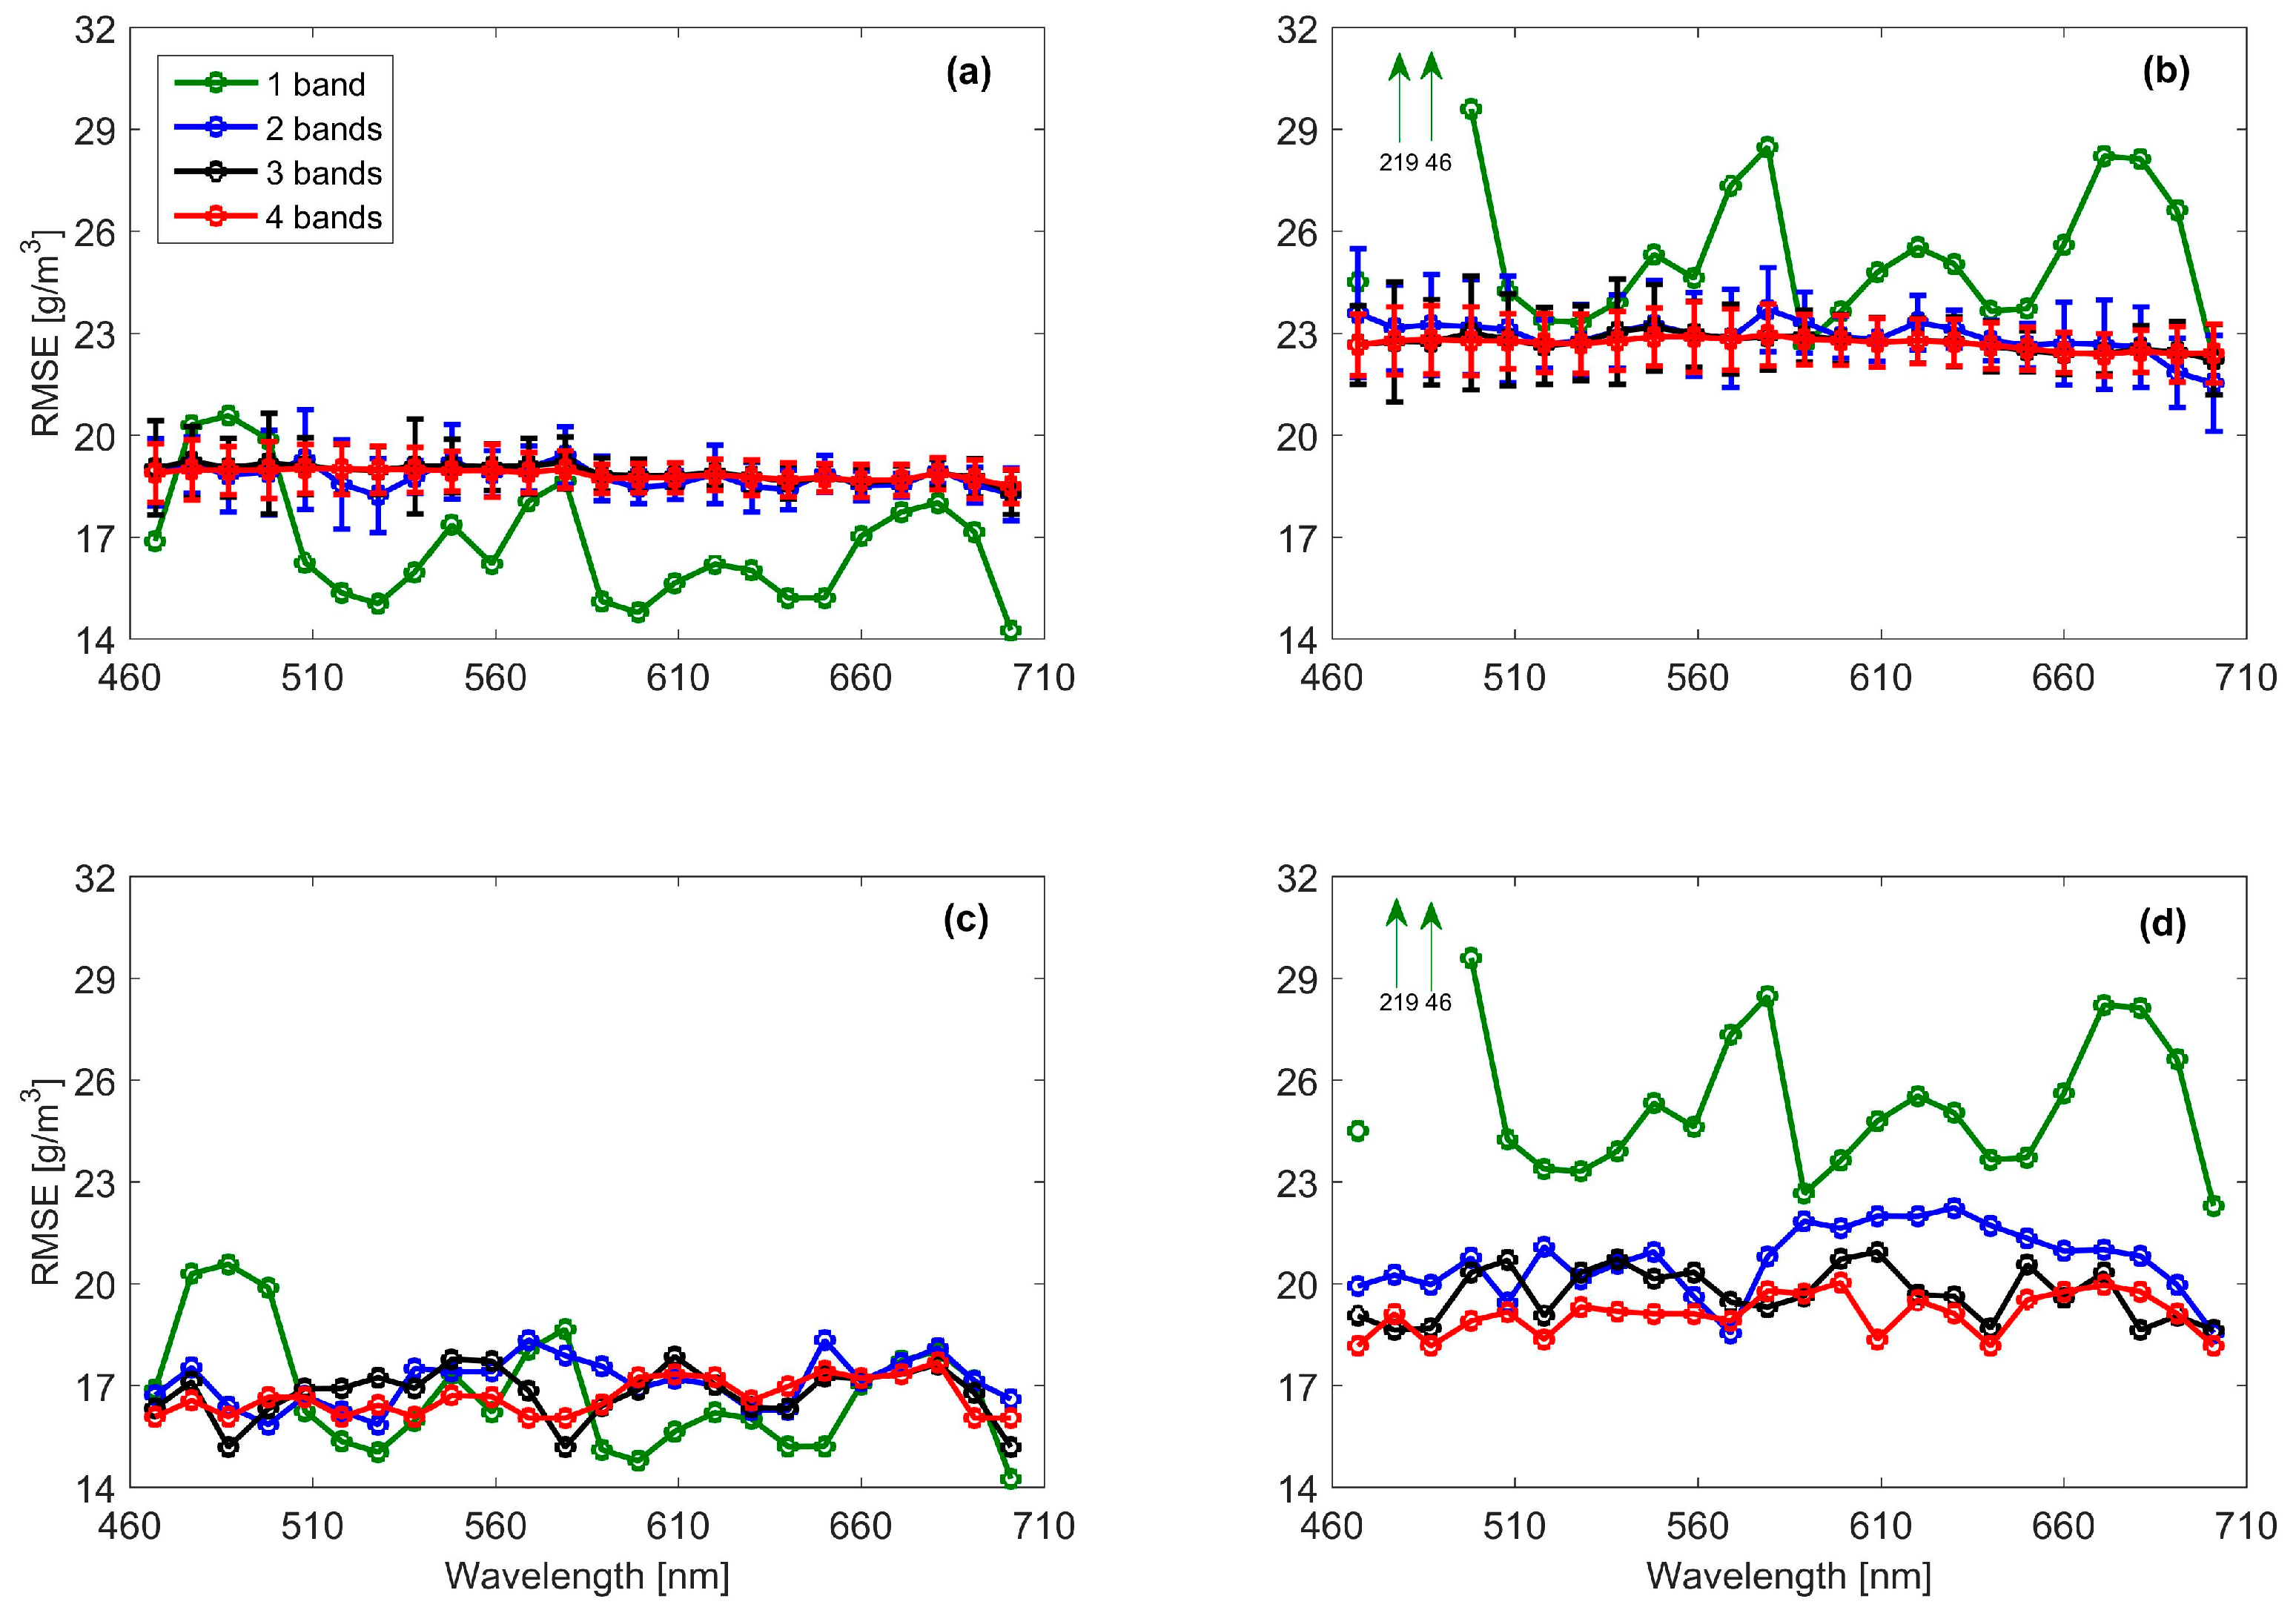
To explore the relative performance of each of the 24 spectral bands for calibrating and validating Equation (8), we calculate the RMSE for different spectral band combinations (Figure 7). In the case of combinations of 2–4 spectral bands, the statistics (mean, minimum, and standard deviation) of a spectral band centered at a specific wavelength is computed using all the possible combinations of that spectral band with the remaining ones. In general, the results confirm that even though the single spectral band method performs slightly better in calibration, it clearly performs worse in validation when compared with the combinations of multiple spectral band (Figure 7). For the single spectral band case, there are four spectral bands (528 nm, 589 nm, 640 nm, and 701 nm) that yield locally-optimal and consistent performance for both model calibration and validation. In the case of 2–4 spectral bands combinations, the differences between the minimum values of the RMSE across spectral bands are much less pronounced than in the single spectral band case (Figure 7c,d). Considering just model calibration, the values calculated for the optimal 2–4 spectral bands combinations are comparable with those calculated for the single spectral band method (Figure 7c). Moreover, the mean and standard deviation of the RMSE values are almost identical throughout the spectrum (Figure 7a), suggesting that all spectral bands perform almost equally well. A similar behavior is found in the model validation, confirming that as more spectral bands are used in the calibration of the Equation (8), the sensitivity of the result to the specific spectral bands chosen is reduced (Figure 7b). However, further addition of spectral bands progressively produces less marginal improvements in the minimum RMSE (Figure 7d).
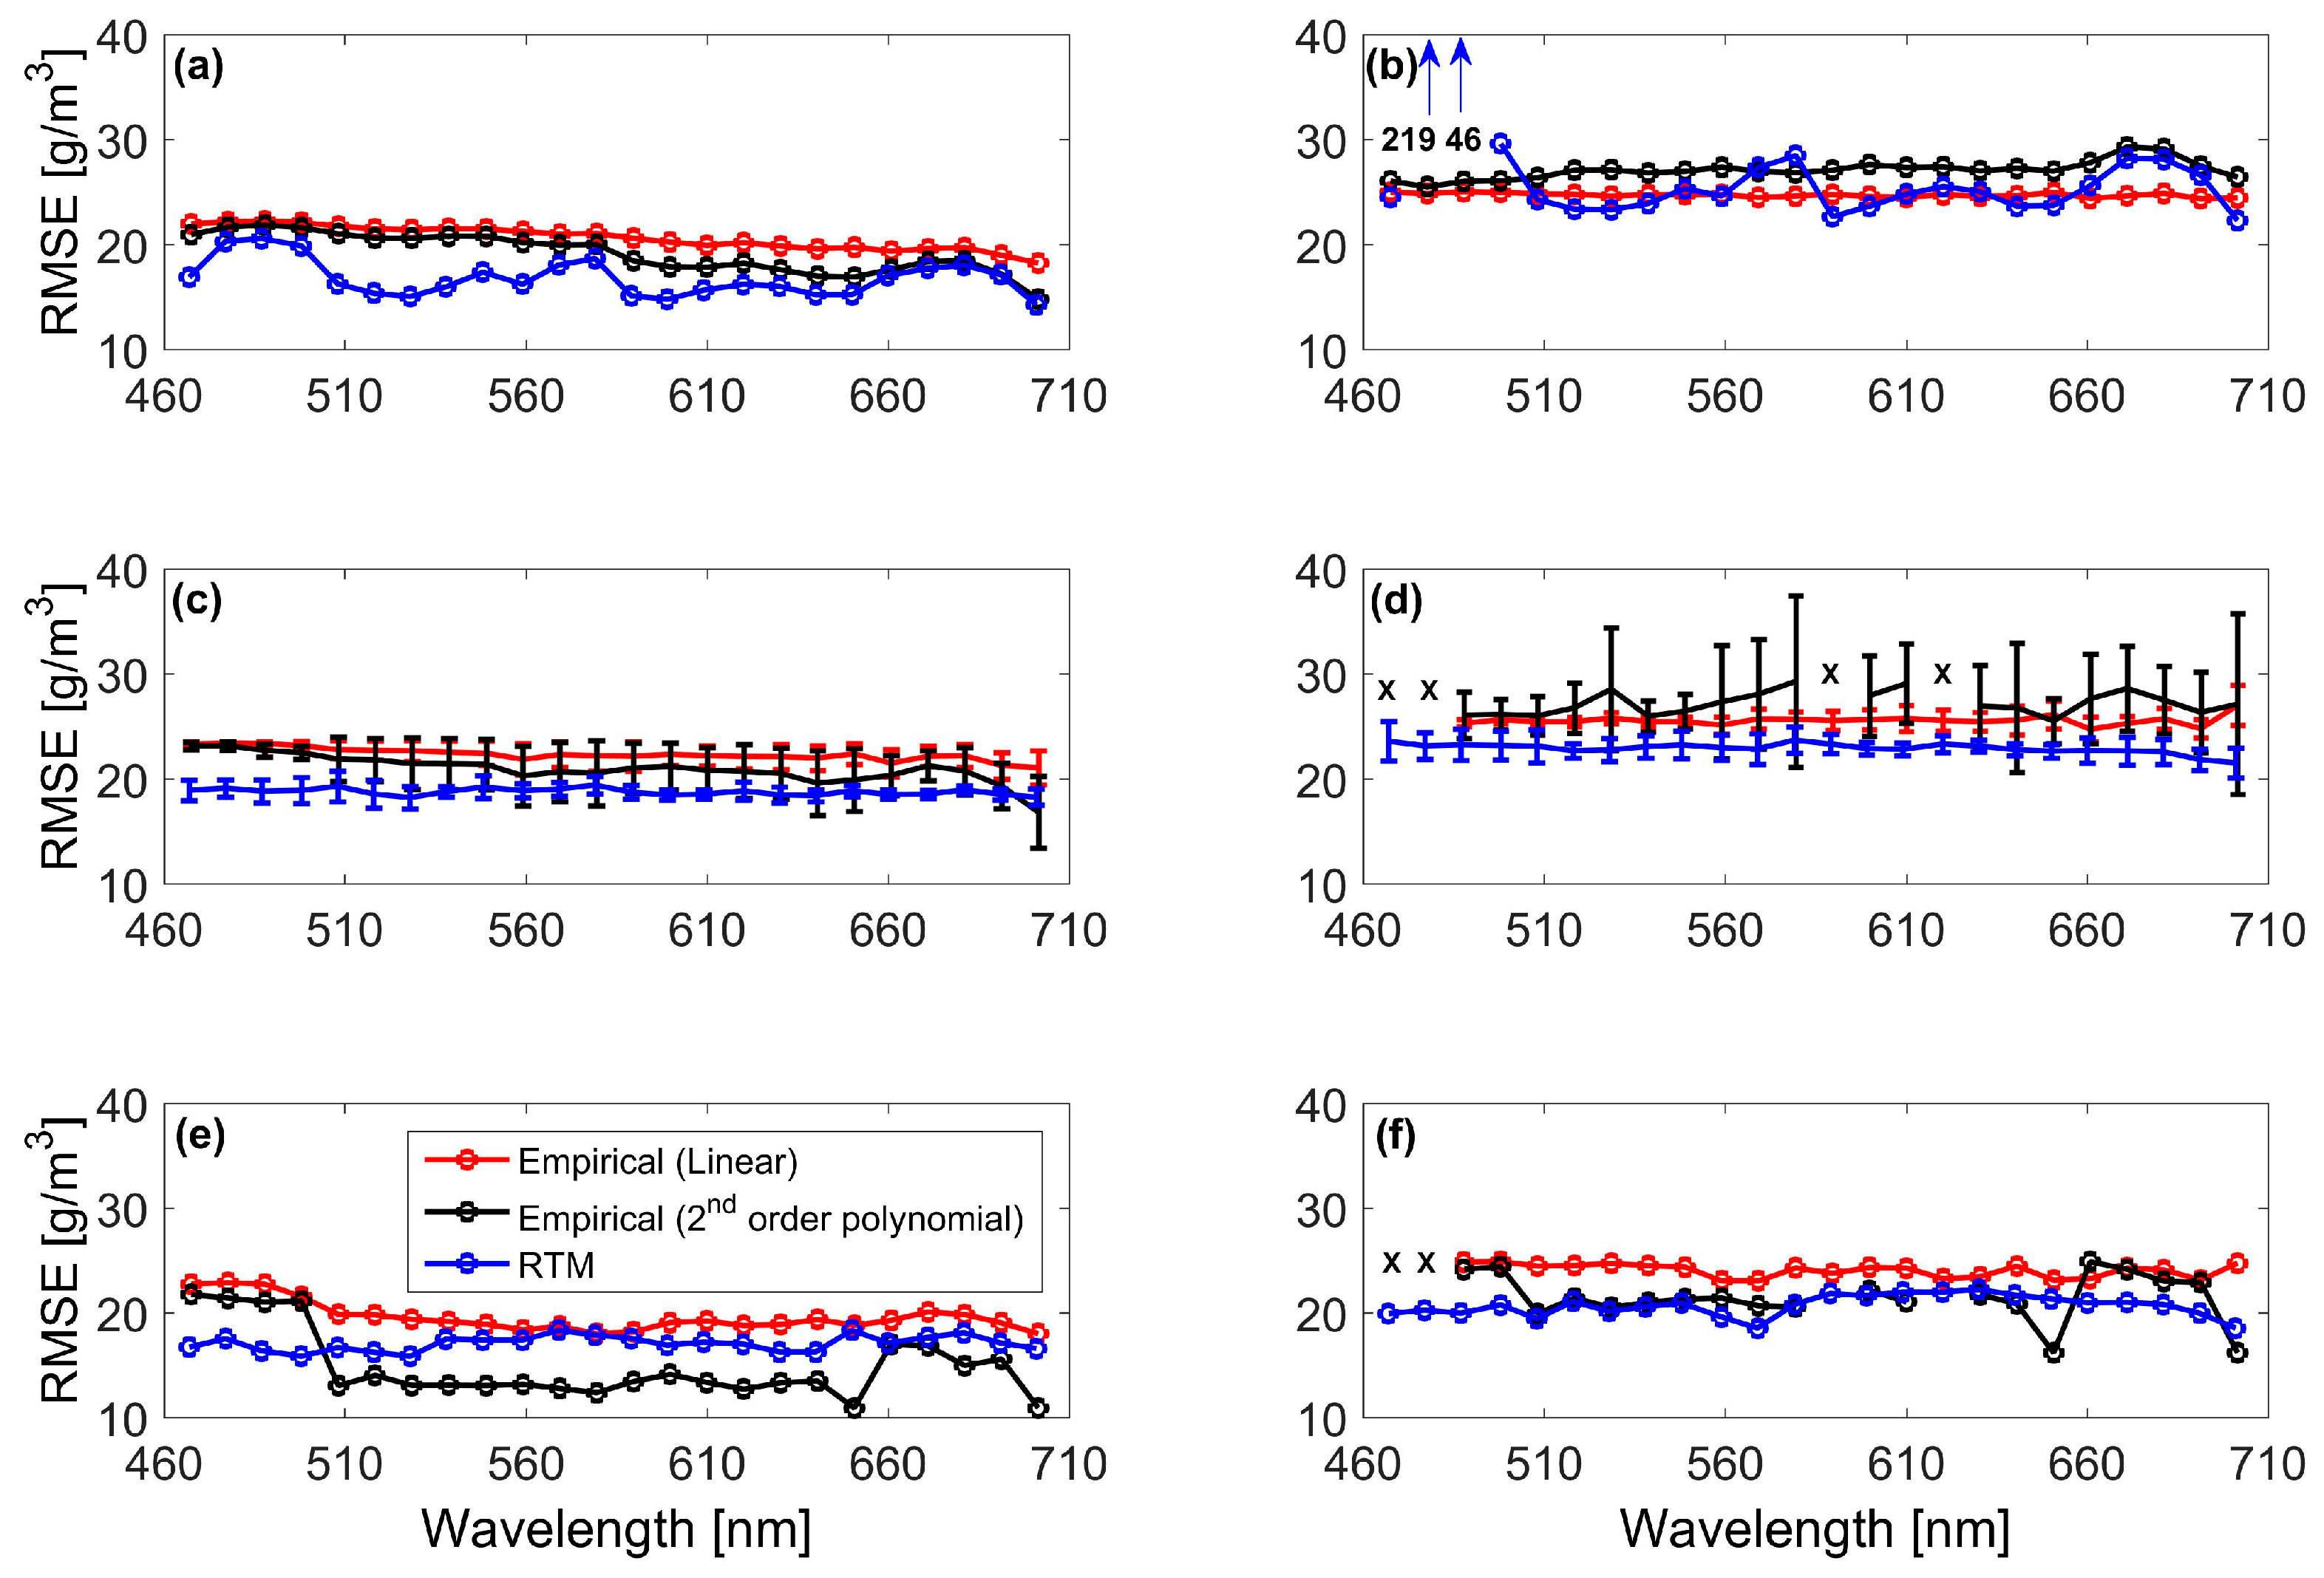
For the empirical models, we applied a linear and a second order polynomial regression method that relate single spectral band reflectance or the ratio of two spectral bands with SSC (Equation (9)). In this dataset, the reflectance in the NIR spectral range is small and not sensitive to changes in turbidity (not shown here). For a direct comparison, we use the same initial pool of spectral bands for the empirical models (Equation (9)) as for the RTM-inversion method (Equation (8)). Using the single spectral band method, the RMSE estimated from the empirical model and the RTM-inversion are plotted for the calibration (Figure 8a) and the validation (Figure 8b) procedures. For model calibration, the second order polynomial method shows smaller RMSE values than the linear regression, partly due to its additional degree of freedom. However, the linear regression gives smaller RMSE values than the second polynomial method in validation procedure. The RTM-inversion method using a single spectral band yields the smallest RMSE values for model calibration. In the model validation, similar RMSE values were obtained when comparing the use of RTM-inversion and the empirical models. Overall, when a single spectral band method is selected, the RTM-inversion method and the empirical models have similar performances.
Figure 8c,d shows that the linear regression of the spectral band ratio has slightly larger (smaller) mean RMSE compared with the second order polynomial regression method for calibration (validation). However, the linear regression method has much less variance and thus is more robust compared to the second order polynomial method. In addition, the optimal RMSE values obtained using the second order polynomial method are smaller than those obtained with the linear regression method for both calibration and validation (Figure 8e,f) across wavelengths. These results show that the second order polynomial regression of spectral band ratios has a better performance in terms of RMSE. However, this method is sensitive to the specific selection of spectral bands. The RTM-inversion method gives smaller mean RMSE and variance than the second order polynomial regression, for both model calibration and validation (Figure 8c,d). In terms of the optimal RMSE (Figure 8e,f), the RTN-inversion shows slightly higher (similar) than the second order polynomial method for calibration (validation). Therefore, the RTM-inversion method is considered to be superior to both linear and second polynomial regressions when using two spectral bands.
Based on these results, the linear and second order polynomial empirical models with either single spectral band or spectral band ratio cannot achieve equivalent performance (in terms of mean, minimum, and variance of RMSE for both calibration and leave-one-out validation) as the RTM-inversion with one or two spectral bands.

3.4. SSC Estimation Using Multispectral Data

With the purpose of comparing SSC retrievals using Hyperion dataset with that of multispectral data, we consider the multispectral dataset from a previous study [21]. Reflectance in the “Red” spectral band (centered around 650 nm) is used in the RTM-inversion and the linear and second order polynomial model for both calibration and leave-one-out validation. As shown in Table 4, the RTM-inversion shows 4.95 (1.37) g/m3 and 5.12 (1.93) g/m3 reduction in RMSE comparing to the linear (second order polynomial) regression for calibration and validation, respectively. The greater amount of RMSE improvement for validation than calibration suggests that the advantage of the RTM-inversion is more evident, suggesting that the RTM-inversion has a stronger predictability than empirical methods that are more rely on the calibration dataset. Meanwhile, the difference between calibration and validation of the RTM-inversion is only ~70% (50%) of that obtained from the linear (2nd order polynomial) regression, indicating a more robust performance for the RTM-inversion. Similar to the case with hyperspectral data, the RTM-inversion method out-performs both empirical methods in model calibration and validation with this multispectral dataset.
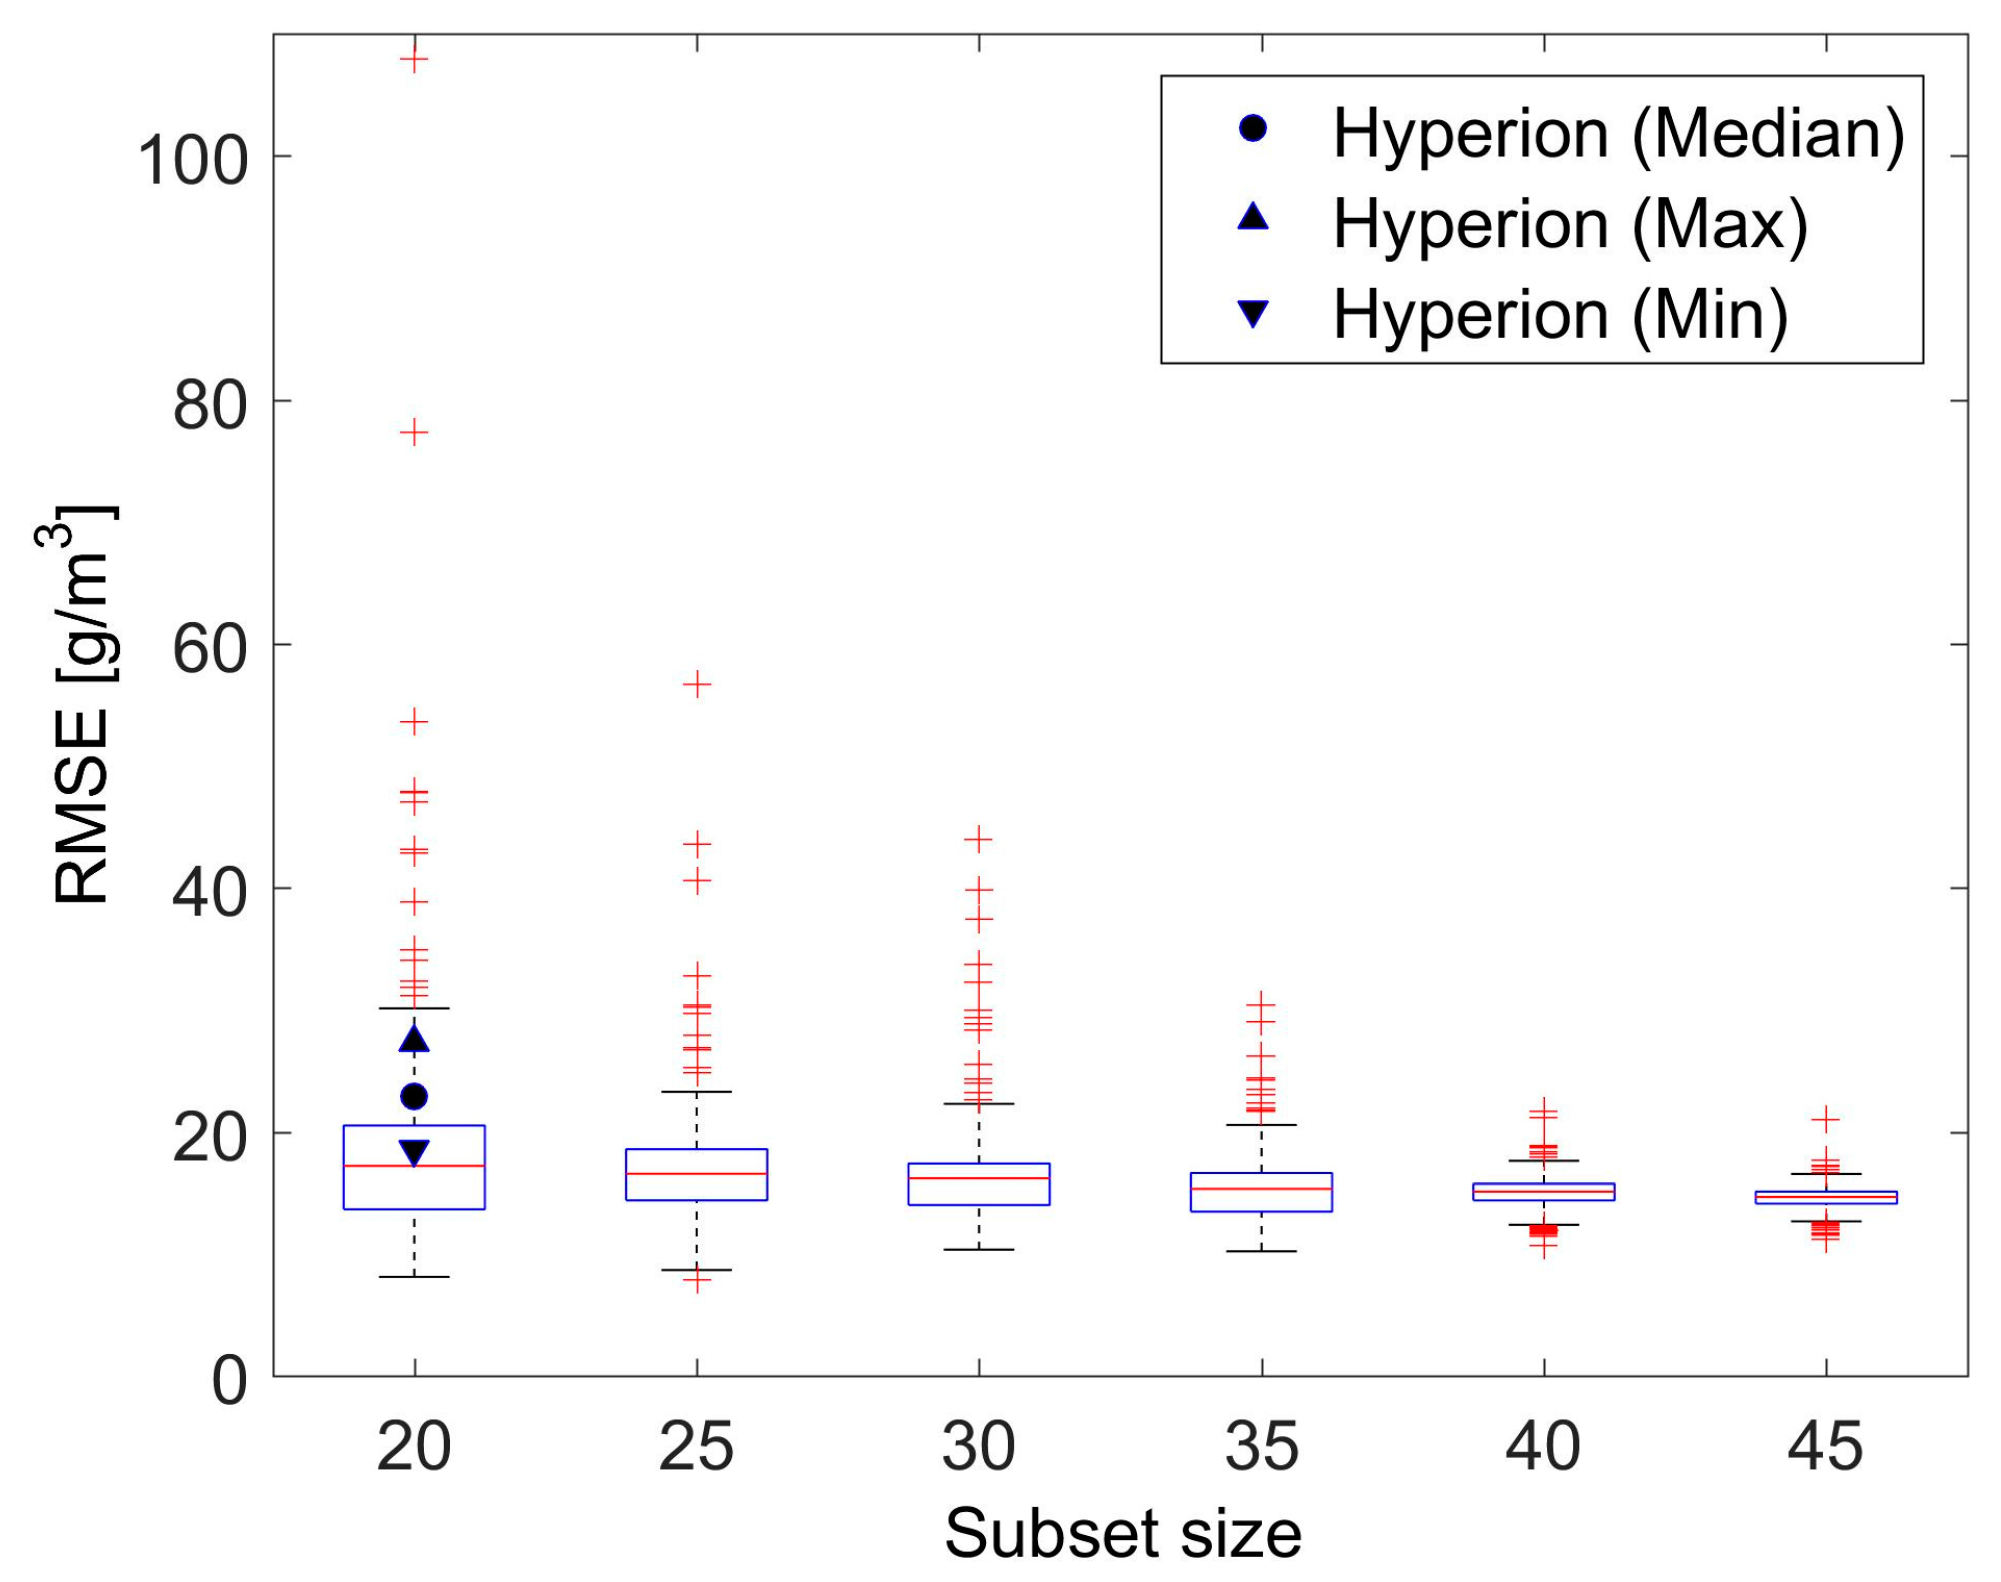
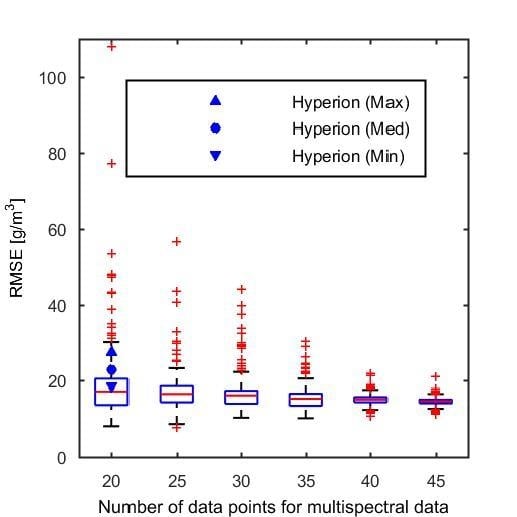
When comparing the difference between RMSE values derived from calibration and validation, the multispectral dataset (Table 4) shows a more robust performance than the hyperspectral dataset (Table 3), even though only one multispectral band is used in the analysis. This good performance might be due to a number of reasons, in primis the fact that the multispectral dataset includes 52 data points, which is a much larger dataset compared with the hyperspectral one that includes only 20 data points. To test the importance of the dataset size in determining model performance, a subset the multispectral data ( ( 52 k ) different subsets, where k is the subset size) is used for RTM-inversion. The subset size k ranges from 20 to 45 with an increment of 5, and for each k value, we randomly choose 300 different combinations and plot the statistics of results in Figure 9. For comparison, the median, max, and min RMSE estimated using the Hyperion data (20 data points) with 2 spectral bands are also plotted. Figure 9 shows that the standard deviation, as expected, decreases with an increasing subset size, so that the smallest subset size considered (k = 20) introduces the highest deviation (variance) from the median, indicating higher model uncertainty. However, if we compare the results obtained using the multispectral dataset with those obtained from the Hyperion data (same size with k = 20), we notice that the Hyperion dataset has slightly higher median RMSE. However, its range is still bounded within around 2.7 standard deviations from the median of the multispectral result, proving statistically similar results. The slightly better performance of the RTM-inversion based on the multispectral single-band dataset is probably related to the favorable weather conditions (for SSC retrieval purpose) of the entire multispectral dataset. In fact, given the long data archive, multispectral scenes with excellent visibility and high wind speed (causing sediment resuspension by wind-introduced waves) are available. In these cases, the atmospheric effect is minimal and the chance of observing large SSC values is high, which are critical for the calibration/validation of SSC retrievals models.
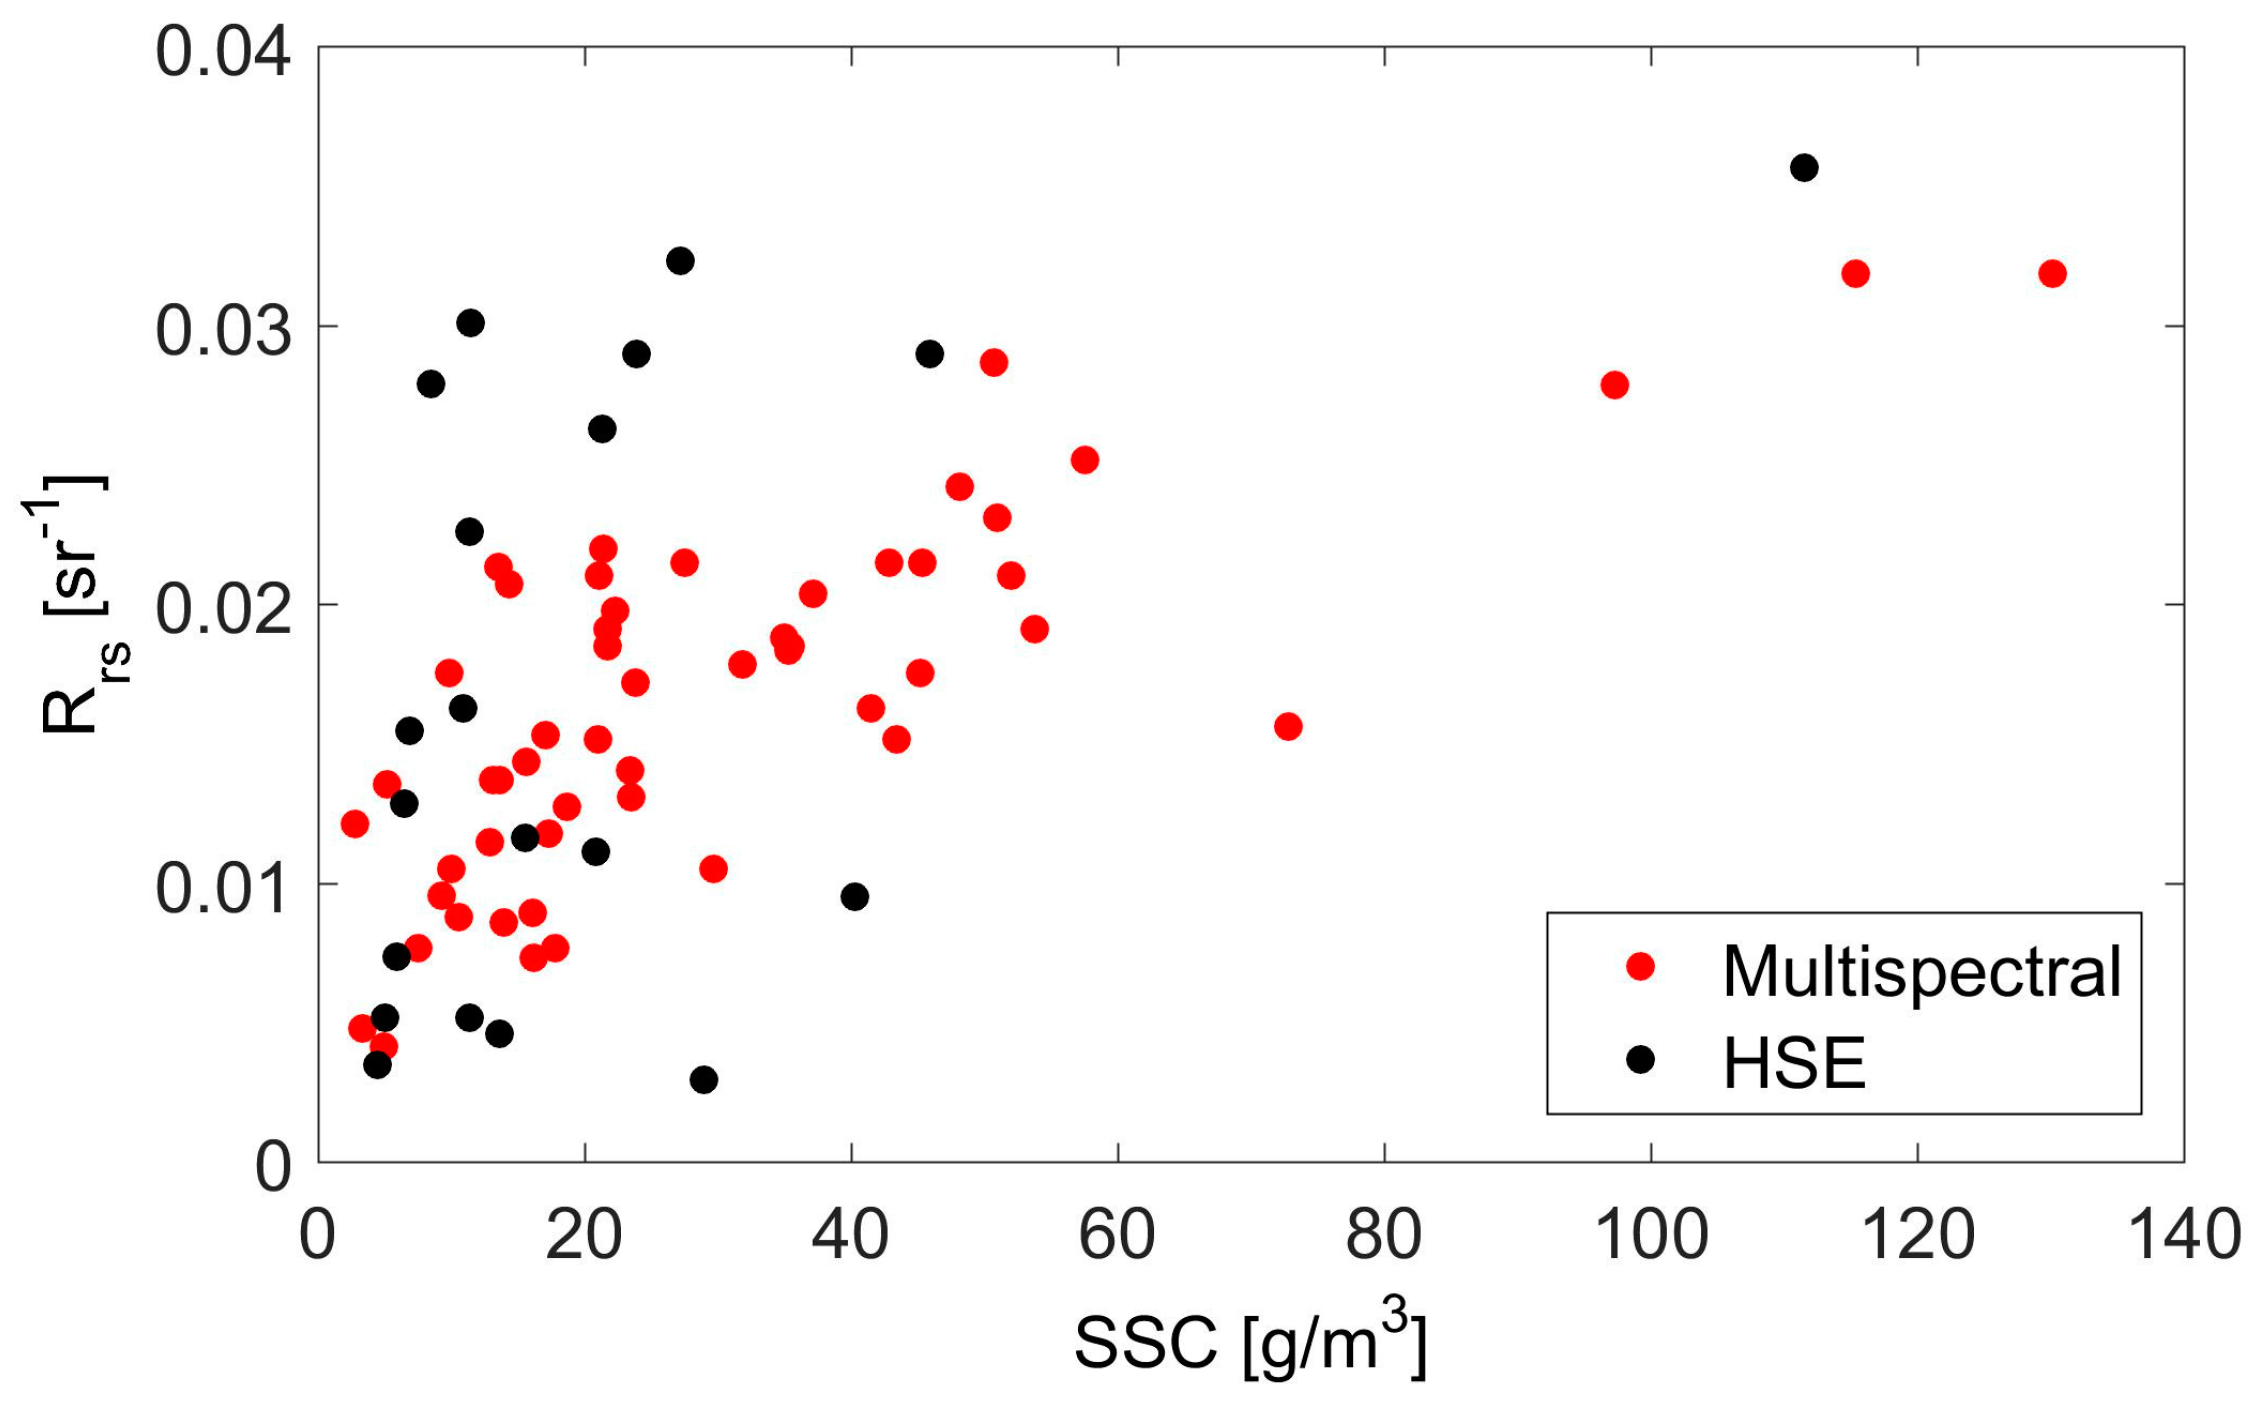
In contrast, the limited number of available hyperspectral scenes constrains our ability to choose suitable datasets for SSC retrieval. This is not a specific result of the present study, but can be generalized because of the much wider availability, and longer history, of multispectral data compared to hyperspectral data. The long history and extended spatial coverage of multispectral acquisitions allow to sample a larger number and wider range of SSC values, which is crucial for model calibration and validation, and eventually to create a dataset large enough to greatly decrease the error and its variability as shown in Figure 9. To confirm the key importance of having a large database to extract the most suitable dataset for the analyses, we estimate Hyperion Synthetic ETM+ (HSE) reflectance from the Hyperion data using the ETM+ relative spectral response functions. The SSC-reflectance relationship using HSE and the multispectral data are plotted together in Figure 10, where it is clearly that the HSE data is more scattered in the low SSC range, and has only one high SSC point. In contrast, the multispectral data more uniformly sample the SSC-reflectance space, with multiple high SSC data points. The saturation of changes in R r s with increasing SSC has been noted before, for example see Bowers et al. [83] with reference to the AVHRR (Advanced Very-High-Resolution Radiometer) data and Doxaran et al. [62] for SPOT (Satellite Pour l’Observation de la Terre or Earth-observing Satellites) data. This saturation phenomenon is mainly caused by the presence of b b a + b b in Equation (3), which asymptotic approaches to a constant with an increase in SSC. However, this saturation effect is only significant when SSC is higher than 250 g/m3 [62]. Thus, the retrievals are not severely affected in the modest range of SSC values observed in the present application (most below 60 g/m3 except for three values greater than 100 g/m3). We calibrated and validated both the RTM-inversion (Equation (8)) and empirical models (Equation (9)) with the combined HSE and multispectral data. As expected, the inclusion of the HSE data increases the model RMSE with respect to cases only using multispectral data (results not shown here). In conclusion, the hyperspectral data are highly scattered and provide a less robust SSC-reflectance correlation compared with multispectral data.

4. Discussion

This study used a systematic approach to assess the performance of several empirical methods and a semi-analytical radiative transfer model (RTM) for the retrieval of SSC in a shallow coastal environment using both hyperspectral and multispectral data. First, our results show an inter-dependence between the specific absorption and backscattering coefficients in calibrating the inversion of the RTM (Equation (8)), with values that are consistent with those found in the literature and derived from field measurements (Figure 4 and Figure 5). This result is of key importance to constrain the parameter space in the model calibration phase. More importantly, this is encouraging for the application of the semi-analytical model, whose parameter values can be inferred from direct observations in the same general region, or from the literature, without significantly affecting the retrieval performance. As shown in Figure 4 and Figure 5, the performance degradation when using literature values is less than 10% with respect to the performance obtained using locally calibrated parameters.
We then explored the effects of information redundancy and spectral band selection on SSC retrievals. Our results show that using the hyperspectral dataset and the RTM-inversion method with two calibration parameters, a two-band approach provides sufficient performance in terms of mean and minimum RMSE for both model calibration and validation. The two-band approach shows more robust performance and less sensitivity to spectral band selections compared with the use of a single spectral band, especially in the validation phase using the leave-one-out approach. Additional spectral bands (three or four) do not improve the model performance significantly. Though hyperspectral sensors offer the opportunity of selecting the optimal set of spectral bands, a set of only two spectral bands has been proven to be sufficient for the retrieval of SSC in the Venice lagoon. The availability of numerous spectral bands does not, per se, improve the performance of semi-analytical models in the SSC retrieval. In this sense, the two-band approach is the most effective choice as it uses less information. From a mathematical point of view, the RTM model contains two unknown parameters ( η and γ ), which can be properly constrained using two conditions specified by two spectral bands (e.g., also see [28,84]). Lee et al. [76] suggested use of 17 spectral bands to retrieve constituent concentrations using hyperspectral data, which were collected using an airborne spectroradiometer with high SNR (>1000 as reported in [85]). SNR values for satellite-based hyperspectral sensors are much lower: 140–160 for Hyperion in the visible range, evaluated at a surface with a 30% albedo [34]. For a water surface with low reflectance, the SNR is further reduced [86]. For example, the SNR for the HICO sensor (400 to 570 nm) is greater than 200 for a surface with a 5% albedo [87], and becomes about 100 for a surface with a 1% albedo [88]. Similar reductions in the SNR are to be expected for Hyperion data. Low SNR values reduce the advantage of using a large number of spectral bands, as a large amount of calibration data is needed to constrain large amounts of noise in a high-dimensional spectral space (also known as the Hughes Phenomenon, e.g., see [89,90]). Moreover, exploring all the Hyperion bands in the 460–700 nm spectral range and extracting the optimal pair of spectral bands, we find that the model performance is relatively independent of the specific selection of spectral bands (Figure 7d). Though some existing studies suggest that spectral bands at longer wavelength (e.g., in the “Red” part of spectrum) are more suitable for SSC retrieval (e.g., [91]), these spectral bands also suffer from lower SNR compared to spectral bands centered at shorter wavelength [86]. As a result, similar SSC retrieval performance, largely independent of the choice of wavelength, was observed in this study within the visible spectrum. This finding becomes relevant when the ideal set of spectral bands suffers from low SNR due to sensor characteristics or poor atmospheric conditions, and less preferable combinations of spectral bands can be used without introducing a significant error.
The RTM-based SSC retrieval based on multispectral data, yields a better accuracy than the estimates from the hyperspectral dataset using two optimal spectral bands. Initially we speculated that the better performance obtained from multispectral data solely comes from the availability of a larger dataset. By sub-sampling the original data set to reproduce a situation in which a reduced number of observations is available, we found that a larger dataset can better constrain the model with a reduced retrieval uncertainty (Figure 9). However, given an equal size of the multispectral and of the hyperspectral dataset (i.e., 20 measurements), the performance obtained with multispectral data is still slightly better than that obtained with hyperspectral observations. These findings suggest that multispectral data are intrinsically more suitable than the hyperspectral data examined here for SSC retrievals, despite its comparable/lower SNR [92], the lower spectral and radiometric resolutions [34], and the use of a single spectral band. The availability of long historical databases of multispectral scenes allows the selection of data spanning a wider range of wind speed scenarios, leading to a wide range of SSC values ([24,93]), which significantly improve retrieval performance. For hyperspectral sensors with sporadic sampling schedules, the lack of a long historical archive severely limits their utility in establishing a robust SSC monitoring scheme. In our study, for example, we have only five cloud-free Hyperion images, which include a total of 20 pixels coinciding with valid sensor measurement and even fewer high SCC data points. Consequently, the Hyperion Synthetic ETM+ (HSE) reflectance is more scattered compare to the multispectral data in the turbidity-reflectance plot (Figure 10). In summary, we find that the availability of numerous spectral bands offered by hyperspectral sensor does not provide significant improvements in the estimation of SSC.
When the results obtained using the RTM-inversion method with hyperspectral data are compared with those obtained with two empirical models (linear and second order polynomial regressions), we find that the RTM-inversion is more reliable in terms of minimum, median, and variance of the RMSE. We also find that the RTM-inversion method displays a more robust performance with respect to spectral band selection approaches (Figure 8). For multispectral data, the RTM-inversion model shows smaller RMSE, and thus a better performance, for both model calibration and validation compared to the two empirical models (Table 4). The advantage of the RTM-inversion over empirical models is more evident in model validation than calibration, suggesting that the RTM-inversion has a stronger predictability than empirical methods, which are more rely on the calibration dataset. Given the superior performances of the RTM-inversion compared with the linear and second polynomial regression methods using both hyperspectral and multispectral datasets, our findings suggest that RTM-inversion is a better approach for the retrieval of SSC in estuaries and lagoons. The success of the RTM-inversion method has been shown in other studies as well. For example, RTM-inversion was showed to be more accurate than empirical methods for bathymetric retrieval [94] and chlorophyll-a estimation [95].
The averaged CC and SSC are around 1.5 mg/m3 and 22 g/m3 during the period of RM data acquisition. The contribution of chlorophyll-a to the remote sensing reflectance, mainly the absorption coefficient, is less than 10% of that from SSC in most of the visible spectrum. The ratio raised to around 35% from 660 nm to 690 nm, which corresponds to three hyperspectral bands (out of the total of 24 considered here). As a result, the uncertainty of the chlorophyll-a concentration measurement could only slightly affects the estimation of SSC. Also, the lack of in situ CDOM measurements will contribute to uncertainties in the evaluation of the absorption coefficient, thus affecting SSC retrieval. Volpe et al. [21] showed that the uncertainty introduced by CDOM is relatively small when a range of a c d o m * value are tested in the same study area. Consequently, it is expected that in situ CDOM measurements may improve SSC retrieval only slightly. Finally, we note that the main source of uncertainty arguably comes from the atmospheric correction process, which is more stringent and subtle in complex and shallow waters than open ocean for water constituent retrievals [19]. Atmospheric correction has been validated using MODIS products, due to a lack of ground measurements to constrain the correction process. However, the remaining uncertainty could still be significant especially for winter scenes. The new generation satellite sensors, for example the Landsat OLI, provide improved radiometric resolution and SNR, and a new coastal blue band, enabling it to provide an improved surface reflectance product over the use of Landsat TM/ETM+ [96].
Overall, the best RTM RMSE is 13 g/m3 (or about 10% of the maximum observed turbidity value). This level of uncertainty is not uncommon. For example, Härmä et al. [97] obtained a relative RMSE (normalized by the maximum turbidity value) between 12 and 25% using simulated Landsat TM data (from an airborne spectrometer, implying little uncertainty in the atmospheric correction). Doxaran et al. [62] obtained a relative RMSE of about 25% using SPOT data in Gironde estuary (France). We interpret the RMSE value obtained in this study is affected by the optical complexity of the shallow water environment, characterized by high spatial and temporal variability. The uncertainty is such that multispectral-based SSC retrievals obtained through the approach proposed here can be practically useful. The approach provides a moderate estimation uncertainty and a large-scale coverage that cannot be achieved through field measurements, and is difficult to obtain even from airborne sensors.
Hyperspectral data have been used with considerable success in the evaluation of the concentrations of water constituents in coastal regions and lagoons [27,28,73,98]. However, this study finds that larger archives of hyperspectral data are needed to possibly implement a solid retrieval of suspended sediment. Currently, multispectral data with longer data archive exist, and are more valuable for long-term monitoring of SSC in shallow coastal areas, compared with hyperspectral images. However, it is possible that the upcoming NASA HyspIRI mission, which will provide frequent acquisitions (5 or 19 days revisitation times depending on sensors) and improved SNR over Hyperion [99], will gradually increase the availability of hyperspectral data and improve hyperspectral-based SSC retrievals in coastal zones.

5. Conclusions

Our systematic evaluations of hyperspectral versus multispectral data and of a radiative transfer model versus empirical regressions to retrieve SSC in a shallow coastal area allow a few relevant conclusions. We find that the use of multiple hyperspectral bands does not significantly improve remote sensing SSC retrievals using the radiative transfer model. A two-band approach is shown to provide an optimal tradeoff in terms of accuracy versus complexity. We also find that estimation uncertainty is relatively independent of the spectral bands selected for the radiative transfer model.
Furthermore, we note that the sporadic sampling of hyperspectral sensors severely limits the extent of available data archives and the chance of observing high turbidity events. These events are relatively rare, but critical for calibrating and validating retrieval methodologies over a representative range of SSC values. Such wider range is, on the contrary, likely to be captured in the large historical archives available from multispectral sensors. As a result, multispectral data are better suited for SSC retrieval than hyperspectral data, due to lower information redundancy, lower signal-to-noise ratio, and longer time series of observations.
Finally, we find that the radiative transfer model-based SSC retrieval method used here is more robust and accurate than the commonly-used empirical approaches when applied to either hyperspectral or multispectral data. The sensitivity to the specific spectral bands selections is also reduced. The general conclusion is that the RTM-based method should be used for SSC retrieval in shallow estuaries and lagoons, particularly as they show a greater ability to estimate SSC values under conditions not included in the calibration dataset.

Acknowledgments

M.M. acknowledges support from the SOLVe Project funded by the Italian National Council for Research (CNR). We thank Zibordi and Alberotanza for their effort in establishing and maintaining the ISDGM-CNR and Venice sites as part of the NASA AERONET Project. We thank the Italian “Ministero delle Infrastrutture e dei Trasporti—Provveditorato Interregionale alle OO. PP. del Veneto—Trentino Alto Adige—Friuli Venezia Giulia” for providing the data from the network of multi-parametric sensors in the Venice lagoon. We would also thank Valerie Volpe for providing the multispectral dataset over the Venice Lagoon.

Author Contributions

Xiaochi Zhou processed the remote sensing data, performed the analysis, and drafted the article. Sonia Silvestri and Marco Marani designed and guided the research, and contributed to manuscript writing. Sonia Silvestri also provided most of the remote sensing data and contributed to data analysis. John Albertson provided critical discussions and revisions of the article.

Conflicts of Interest

The authors declare no conflict of interest.

References

  1. Carr, J.; D’Odorico, P.; McGlathery, K.; Wiberg, P. Stability and bistability of seagrass ecosystems in shallow coastal lagoons: Role of feedbacks with sediment resuspension and light attenuation. J. Geophys. Res. Biogeosci. 2010, 115, G03011. [Google Scholar] [CrossRef]
  2. Blum, M.D.; Roberts, H.H. Drowning of the mississippi delta due to insufficient sediment supply and global sea-level rise. Nat. Geosci. 2009, 2, 488–491. [Google Scholar] [CrossRef]
  3. Carniello, L.; Defina, A.; D’Alpaos, L. Morphological evolution of the venice lagoon: Evidence from the past and trend for the future. J. Geophys. Res. Earth 2009, 114, F04002. [Google Scholar] [CrossRef]
  4. D’Alpaos, A.; Mudd, S.M.; Carniello, L. Dynamic response of marshes to perturbations in suspended sediment concentrations and rates of relative sea level rise. J. Geophys. Res. Earth 2011, 116, F04020. [Google Scholar] [CrossRef]
  5. Kirwan, M.L.; Megonigal, J.P. Tidal wetland stability in the face of human impacts and sea-level rise. Nature 2013, 504, 53–60. [Google Scholar] [CrossRef] [PubMed]
  6. Marani, M.; D’Alpaos, A.; Lanzoni, S.; Carniello, L.; Rinaldo, A. Biologically-controlled multiple equilibria of tidal landforms and the fate of the venice lagoon. Geophys Res. Lett. 2007, 34, L11402. [Google Scholar] [CrossRef]
  7. Morris, J.T.; Sundareshwar, P.V.; Nietch, C.T.; Kjerfve, B.; Cahoon, D.R. Responses of coastal wetlands to rising sea level. Ecology 2002, 83, 2869–2877. [Google Scholar] [CrossRef]
  8. Marani, M.; Da Lio, C.; D’Alpaos, A. Vegetation engineers marsh morphology through multiple competing stable states. Proc. Natl. Acad. Sci. USA 2013, 110, 3259–3263. [Google Scholar] [CrossRef] [PubMed]
  9. Ericson, J.P.; Vorosmarty, C.J.; Dingman, S.L.; Ward, L.G.; Meybeck, M. Effective sea-level rise and deltas: Causes of change and human dimension implications. Glob. Planet. Chang. 2006, 50, 63–82. [Google Scholar] [CrossRef]
  10. Syvitski, J.P.M.; Kettner, A.J.; Overeem, I.; Hutton, E.W.H.; Hannon, M.T.; Brakenridge, G.R.; Day, J.; Vorosmarty, C.; Saito, Y.; Giosan, L.; et al. Sinking deltas due to human activities. Nat. Geosci. 2009, 2, 681–686. [Google Scholar] [CrossRef]
  11. Wang, H.J.; Saito, Y.; Zhang, Y.; Bi, N.S.; Sun, X.X.; Yang, Z.S. Recent changes of sediment flux to the western pacific ocean from major rivers in east and southeast asia. Earth-Sci. Rev. 2011, 108, 80–100. [Google Scholar] [CrossRef]
  12. Yang, S.L.; Milliman, J.D.; Li, P.; Xu, K. 50,000 dams later: Erosion of the yangtze river and its delta. Glob. Planet. Chang. 2011, 75, 14–20. [Google Scholar] [CrossRef]
  13. Ratliff, K.M.; Braswell, A.E.; Marani, M. Spatial response of coastal marshes to increased atmospheric co2. Proc. Natl. Acad. Sci. USA 2015, 112, 15580–15584. [Google Scholar] [CrossRef] [PubMed]
  14. Ritchie, J.C.; Zimba, P.V.; Everitt, J.H. Remote sensing techniques to assess water quality. Photogramm. Eng. Remote Sens. 2003, 69, 695–704. [Google Scholar] [CrossRef]
  15. Petus, C.; Chust, G.; Gohin, F.; Doxaran, D.; Froidefond, J.-M.; Sagarminaga, Y. Estimating turbidity and total suspended matter in the adour river plume (south bay of biscay) using modis 250-m imagery. Cont. Shelf Res. 2010, 30, 379–392. [Google Scholar] [CrossRef]
  16. Mélin, F.; Zibordi, G.; Berthon, J.-F. Assessment of satellite ocean color products at a coastal site. Remote Sens. Environ. 2007, 110, 192–215. [Google Scholar] [CrossRef]
  17. Wang, W.; Jiang, W. Study on the seasonal variation of the suspended sediment distribution and transportation in the east china seas based on seawifs data. J. Ocean Univ. China 2008, 7, 385–392. [Google Scholar] [CrossRef]
  18. Mouw, C.B.; Greb, S.; Aurin, D.; DiGiacomo, P.M.; Lee, Z.; Twardowski, M.; Binding, C.; Hu, C.; Ma, R.; Moore, T. Aquatic color radiometry remote sensing of coastal and inland waters: Challenges and recommendations for future satellite missions. Remote Sens. Environ. 2015, 160, 15–30. [Google Scholar] [CrossRef]
  19. Matthews, M.W. A current review of empirical procedures of remote sensing in inland and near-coastal transitional waters. Int. J. Remote Sens. 2011, 32, 6855–6899. [Google Scholar] [CrossRef]
  20. Bissett, W.P.; Arnone, R.A.; Davis, C.O.; Dickey, T.D.; Dye, D.; Kohler, D.D.; Gould, R. From meters to kilometers: A look at ocean-color scales of variability, spatial coherence, and the need for fine-scale remote sensing in coastal ocean optics. Oceanography 2004, 17, 32–43. [Google Scholar] [CrossRef]
  21. Volpe, V.; Silvestri, S.; Marani, M. Remote sensing retrieval of suspended sediment concentration in shallow waters. Remote Sens. Environ. 2011, 115, 44–54. [Google Scholar] [CrossRef]
  22. Hellweger, F.; Schlosser, P.; Lall, U.; Weissel, J. Use of satellite imagery for water quality studies in new york harbor. Estuar. Coast. Shelf Sci. 2004, 61, 437–448. [Google Scholar] [CrossRef]
  23. Baban, S.M. Environmental monitoring of estuaries; estimating and mapping various environmental indicators in breydon water estuary, u. K., using landsat tm imagery. Estuar. Coast. Shelf Sci. 1997, 44, 589–598. [Google Scholar] [CrossRef]
  24. Carniello, L.; Silvestri, S.; Marani, M.; D’Alpaos, A.; Volpe, V.; Defina, A. Sediment dynamics in shallow tidal basins: In situ observations, satellite retrievals, and numerical modeling in the venice lagoon. J. Geophys. Res. Earth 2014, 119, 802–815. [Google Scholar] [CrossRef]
  25. Lee, Z.P.; Carder, K.L.; Mobley, C.D.; Steward, R.G.; Patch, J.S. Hyperspectral remote sensing for shallow waters. I. A semianalytical model. Appl. Opt. 1998, 37, 6329–6338. [Google Scholar] [CrossRef] [PubMed]
  26. Lee, Z.P.; Carder, K.L.; Mobley, C.D.; Steward, R.G.; Patch, J.S. Hyperspectral remote sensing for shallow waters: 2. Deriving bottom depths and water properties by optimization. Appl. Opt. 1999, 38, 3831–3843. [Google Scholar] [CrossRef] [PubMed]
  27. Santini, F.; Alberotanza, L.; Cavalli, R.M.; Pignatti, S. A two-step optimization procedure for assessing water constituent concentrations by hyperspectral remote sensing techniques: An application to the highly turbid venice lagoon waters. Remote Sens. Environ. 2010, 114, 887–898. [Google Scholar] [CrossRef]
  28. Brando, V.E.; Dekker, A.G. Satellite hyperspectral remote sensing for estimating estuarine and coastal water quality. IEEE Trans. Geosci. Remote Sens. 2003, 41, 1378–1387. [Google Scholar] [CrossRef]
  29. Koponen, S.; Attila, J.; Pulliainen, J.; Kallio, K.; Pyhälahti, T.; Lindfors, A.; Rasmus, K.; Hallikainen, M. A case study of airborne and satellite remote sensing of a spring bloom event in the gulf of finland. Cont. Shelf Res. 2007, 27, 228–244. [Google Scholar] [CrossRef]
  30. Neukermans, G.; Ruddick, K.; Bernard, E.; Ramon, D.; Nechad, B.; Deschamps, P.-Y. Mapping total suspended matter from geostationary satellites: A feasibility study with seviri in the southern north sea. Opt. Express 2009, 17, 14029–14052. [Google Scholar] [CrossRef] [PubMed]
  31. Odermatt, D.; Gitelson, A.; Brando, V.E.; Schaepman, M. Review of constituent retrieval in optically deep and complex waters from satellite imagery. Remote Sens. Environ. 2012, 118, 116–126. [Google Scholar] [CrossRef]
  32. Long, C.M.; Pavelsky, T.M. Remote sensing of suspended sediment concentration and hydrologic connectivity in a complex wetland environment. Remote Sens. Environ. 2013, 129, 197–209. [Google Scholar] [CrossRef]
  33. Binding, C.; Jerome, J.; Bukata, R.; Booty, W. Suspended particulate matter in lake erie derived from modis aquatic colour imagery. Int. J. Remote Sens. 2010, 31, 5239–5255. [Google Scholar] [CrossRef]
  34. Pearlman, J.S.; Barry, P.S.; Segal, C.C.; Shepanski, J.; Beiso, D.; Carman, S.L. Hyperion, a space-based imaging spectrometer. IEEE Trans. Geosci. Remote Sens. 2003, 41, 1160–1173. [Google Scholar] [CrossRef]
  35. Seapoint Turbidity Meter: User Manual. Available online: http://www.seapoint.com/pdf/stm_um.pdf (accessed on 18 April 2017).
  36. Venier, C.; D’Alpaos, A.; Marani, M. Evaluation of sediment properties using wind and turbidity observations in the shallow tidal areas of the venice lagoon. J. Geophys. Res. Earth 2014, 119, 1604–1616. [Google Scholar] [CrossRef]
  37. Datt, B.; McVicar, T.R.; Van Niel, T.G.; Jupp, D.L.B.; Pearlman, J.S. Preprocessing eo-1 hyperion hyperspectral data to support the application of agricultural indexes. IEEE Trans. Geosci. Remote Sens. 2003, 41, 1246–1259. [Google Scholar] [CrossRef]
  38. Acharya, P.K.; Berk, A.; Bernstein, L.S.; Matthew, M.W.; Adler-Golden, S.M.; Robertson, D.C.; Anderson, G.P.; Chetwynd, J.H.; Kneizys, F.X.; Shettle, E.P. Modtran User’s Manual; Versions 3.7 and 4.0; Air Force Research Laboratory, Space Vehicles Directorate, Hanscom Air Force Base: Hanscom, MA, USA, 1998. [Google Scholar]
  39. Analytical Imaging and Geophysics LLC, ACORN 4.0 User’s Guide ENVI Plug-in Version. Available online: http://www.aigllc.com/pdf/acorn4_ume.pdf (accessed 19 April 2017).
  40. Gao, B.C.; Goetz, A.F.H. Column atmospheric water-vapor and vegetation liquid water retrievals from airborne imaging spectrometer data. J. Geophys. Res. Atmos. 1990, 95, 3549–3564. [Google Scholar] [CrossRef]
  41. Holben, B.N.; Eck, T.F.; Slutsker, I.; Tanre, D.; Buis, J.P.; Setzer, A.; Vermote, E.; Reagan, J.A.; Kaufman, Y.J.; Nakajima, T.; et al. Aeronet—A federated instrument network and data archive for aerosol characterization. Remote Sens. Environ. 1998, 66, 1–16. [Google Scholar] [CrossRef]
  42. Shi, W.; Wang, M.H. An assessment of the black ocean pixel assumption for modis swir bands. Remote Sens. Environ. 2009, 113, 1587–1597. [Google Scholar] [CrossRef]
  43. Knaeps, E.; Dogliotti, A.I.; Raymaekers, D.; Ruddick, K.; Sterckx, S. In situ evidence of non-zero reflectance in the olci 1020 nm band for a turbid estuary. Remote Sens. Environ. 2012, 120, 133–144. [Google Scholar] [CrossRef]
  44. Richter, R.; Schläpfer, D. Atcor-2/3 User Guide. Available online: http://www.rese.ch/pdf/atcor3_manual.pdf (accessed on 19 April 2017).
  45. Moses, W.J.; Gitelson, A.A.; Berdnikov, S.; Povazhnyy, V. Estimation of chlorophyll-a concentration in case II waters using modis and meris data-successes and challenges. Environ. Res. Lett. 2009, 4, 045005. [Google Scholar] [CrossRef]
  46. Vermote, E.F.; Kotchenova, S. Atmospheric correction for the monitoring of land surfaces. J. Geophys. Res. Atmos. 2008, 113, D23S90. [Google Scholar] [CrossRef]
  47. Kotchenova, S.Y.; Vermote, E.F.; Matarrese, R.; Klemm Jr, F.J. Validation of a vector version of the 6s radiative transfer code for atmospheric correction of satellite data. Part i: Path radiance. Appl. Opt. 2006, 45, 6762–6774. [Google Scholar] [CrossRef] [PubMed]
  48. Doxaran, D.; Froidefond, J.-M.; Castaing, P.; Babin, M. Dynamics of the turbidity maximum zone in a macrotidal estuary (the gironde, france): Observations from field and modis satellite data. Estuar. Coast. Shelf Sci. 2009, 81, 321–332. [Google Scholar] [CrossRef]
  49. Miller, R.L.; McKee, B.A. Using modis terra 250 m imagery to map concentrations of total suspended matter in coastal waters. Remote Sens. Environ. 2004, 93, 259–266. [Google Scholar] [CrossRef]
  50. Petzold, T.J. Volume Scattering Functions for Selected Ocean Waters; Scripps Institution of Oceanography: San Diego, CA, USA, 1972. [Google Scholar]
  51. Binding, C.E.; Bowers, D.G.; Mitchelson-Jacob, E.G. Estimating suspended sediment concentrations from ocean colour measurements in moderately turbid waters; the impact of variable particle scattering properties. Remote Sens. Environ. 2005, 94, 373–383. [Google Scholar] [CrossRef]
  52. Ulloa, O.; Sathyendranath, S.; Platt, T. Effect of the particle-size distribution on the backscattering ratio in seawater. Appl. Opt. 1994, 33, 7070–7077. [Google Scholar] [CrossRef] [PubMed]
  53. Bowers, D.; Binding, C. The optical properties of mineral suspended particles: A review and synthesis. Estuar. Coast. Shelf Sci. 2006, 67, 219–230. [Google Scholar] [CrossRef]
  54. McKee, D.; Chami, M.; Brown, I.; Calzado, V.S.; Doxaran, D.; Cunningham, A. Role of measurement uncertainties in observed variability in the spectral backscattering ratio: A case study in mineral-rich coastal waters. Appl. Opt. 2009, 48, 4663–4675. [Google Scholar] [CrossRef] [PubMed]
  55. Zhang, M.; Tang, J.; Song, Q.; Dong, Q. Backscattering ratio variation and its implications for studying particle composition: A case study in yellow and east china seas. J. Geophys. Res. Oceans 2010, 115, C12014. [Google Scholar] [CrossRef]
  56. Bowers, D.; Braithwaite, K.; Nimmo-Smith, W.; Graham, G. The optical efficiency of flocs in shelf seas and estuaries. Estuar. Coast. Shelf Sci. 2011, 91, 341–350. [Google Scholar] [CrossRef]
  57. Pope, R.M.; Fry, E.S. Absorption spectrum (380-700 nm) of pure water. 2. Integrating cavity measurements. Appl. Opt. 1997, 36, 8710–8723. [Google Scholar] [CrossRef] [PubMed]
  58. Babin, M.; Stramski, D.; Ferrari, G.M.; Claustre, H.; Bricaud, A.; Obolensky, G.; Hoepffner, N. Variations in the light absorption coefficients of phytoplankton, nonalgal particles, and dissolved organic matter in coastal waters around europe. J. Geophys. Res. Oceans 2003, 108, 3211. [Google Scholar] [CrossRef]
  59. Ferrari, G.M.; Tassan, S. On the accuracy of determining light-absorption by yellow substance through measurements of induced fluorescence. Limnol. Oceanogr. 1991, 36, 777–786. [Google Scholar] [CrossRef]
  60. Haltrin, V.I. One-parameter model of seawater optical properties. In Proceedings of the Ocean Optics XIV CD-ROM, Kailua, HI, USA, 10–13 November 1998. [Google Scholar]
  61. Doxaran, D.; Cherukuru, R.C.N.; Lavender, S.J. Use of reflectance band ratios to estimate suspended and dissolved matter concentrations in estuarine waters. Int. J. Remote Sens. 2005, 26, 1763–1769. [Google Scholar] [CrossRef]
  62. Doxaran, D.; Froidefond, J.M.; Lavender, S.; Castaing, P. Spectral signature of highly turbid waters—Application with spot data to quantify suspended particulate matter concentrations. Remote Sens. Environ. 2002, 81, 149–161. [Google Scholar] [CrossRef]
  63. Lathrop, R.G.; Lillesand, T.M. Monitoring water-quality and river plume transport in green bay, lake-michigan with spot-1 imagery. Photogramm. Eng. Remote Sens. 1989, 55, 349–354. [Google Scholar]
  64. Nechad, B.; Ruddick, K.G.; Park, Y. Calibration and validation of a generic multisensor algorithm for mapping of total suspended matter in turbid waters. Remote Sens. Environ. 2010, 114, 854–866. [Google Scholar] [CrossRef]
  65. Tyler, A.N.; Svab, E.; Preston, T.; Presing, M.; Kovacs, W.A. Remote sensing of the water quality of shallow lakes: A mixture modelling approach to quantifying phytoplankton in water characterized by high-suspended sediment. Int. J. Remote Sens. 2006, 27, 1521–1537. [Google Scholar] [CrossRef]
  66. Chen, Z.M.; Hanson, J.D.; Curran, P.J. The form of the relationship between suspended sediment concentration and spectral reflectance—Its implications for the use of daedalus 1268 data. Int. J. Remote Sens. 1991, 12, 215–222. [Google Scholar] [CrossRef]
  67. Harrington, J.A.; Schiebe, F.R.; Nix, J.F. Remote-sensing of lake chicot, arkansas—Monitoring suspended sediments, turbidity, and secchi depth with landsat mss data. Remote Sens. Environ. 1992, 39, 15–27. [Google Scholar] [CrossRef]
  68. Wang, F.; Han, L.; Kung, H.T.; van Arsdale, R.B. Applications of landsat-5 tm imagery in assessing and mapping water quality in reelfoot lake, tennessee. Int. J. Remote Sens. 2006, 27, 5269–5283. [Google Scholar] [CrossRef]
  69. Wang, X.J.; Ma, T. Application of remote sensing techniques in monitoring and assessing the water quality of taihu lake. Bull. Environ. Contam. Toxicol. 2001, 67, 863–870. [Google Scholar] [CrossRef] [PubMed]
  70. Wilks, D.S. Statistical Methods in the Atmospheric Sciences, 2nd ed.; Academic Press: Amsterdam, The Netherlands; Boston, MA, USA, 2006. [Google Scholar]
  71. Sterckx, S.; Knaeps, E.; Bollen, M.; Trouw, K.; Houthuys, R. Retrieval of suspended sediment from advanced hyperspectral sensor data in the scheldt estuary at different stages in the tidal cycle. Mar. Geod. 2007, 30, 97–108. [Google Scholar] [CrossRef]
  72. Babin, M.; Morel, A.; Fournier-Sicre, V.; Fell, F.; Stramski, D. Light scattering properties of marine particles in coastal and open ocean waters as related to the particle mass concentration. Limnol. Oceanogr. 2003, 48, 843–859. [Google Scholar] [CrossRef]
  73. Giardino, C.; Brando, V.E.; Dekker, A.G.; Strombeck, N.; Candiani, G. Assessment of water quality in lake garda (Italy) using hyperion. Remote Sens. Environ. 2007, 109, 183–195. [Google Scholar] [CrossRef]
  74. Bajcsy, P.; Groves, P. Methodology for hyperspectral band selection. Photogramm. Eng. Remote Sens. 2004, 70, 793–802. [Google Scholar] [CrossRef]
  75. Lee, Z.; Carder, K.L. Effect of spectral band numbers on the retrieval of water column and bottom properties from ocean color data. Appl. Opt. 2002, 41, 2191–2201. [Google Scholar] [CrossRef] [PubMed]
  76. Lee, Z.; Carder, K.; Arnone, R.; He, M. Determination of primary spectral bands for remote sensing of aquatic environments. Sensors 2007, 7, 3428–3441. [Google Scholar] [CrossRef]
  77. Kruse, F.A.; Boardman, J.W.; Huntington, J.F. Comparison of airborne hyperspectral data and eo-1 hyperion for mineral mapping. IEEE Trans. Geosci. Remote Sens. 2003, 41, 1388–1400. [Google Scholar] [CrossRef]
  78. Kruse, F.A.; Boardman, J.W.; Huntington, J.F. Comparison of eo-1 hyperion and airborne hyperspectral remote sensing data for geologic applications. In Proceedings of the IEEE Aerospace Conference, Big Sky, MT, USA, 9–16 March 2002. [Google Scholar]
  79. Marion, R.; Michel, R.; Faye, C. Atmospheric correction of hyperspectral data over dark surfaces via simulated annealing. IEEE Trans. Geosci. Remote Sens. 2006, 44, 1566–1574. [Google Scholar] [CrossRef]
  80. Vermote, E.F. Modis Land Reflectance Science Computing Facility. Available online: http://modis-sr.ltdri.org (accessed on 19 April 2017).
  81. Durand, D.; Bijaoui, J.; Cauneau, F. Optical remote sensing of shallow-water environmental parameters: A feasibility study. Remote Sens. Environ. 2000, 73, 152–161. [Google Scholar] [CrossRef]
  82. Mobley, C.D. Light and Water: Radiative Transfer in Natural Waters; Academic Press: San Diego, CA, USA, 1994. [Google Scholar]
  83. Bowers, D.G.; Boudjelas, S.; Harker, G.E.L. The distribution of fine suspended sediments in the surface waters of the irish sea and its relation to tidal stirring. Int. J. Remote Sens. 1998, 19, 2789–2805. [Google Scholar] [CrossRef]
  84. Hoogenboom, H.J.; Dekker, A.G.; De Haan, J.F. Retrieval of chlorophyll and suspended matter from imaging spectrometry data by matrix inversion. Can. J. Remote Sens. 1998, 24, 144–152. [Google Scholar] [CrossRef]
  85. Mueller, J.L.; Davis, C.; Arnone, R.; Frouin, R.; Carder, K.; Lee, Z.; Steward, R.; Hooker, S.; Mobley, C.D.; McLean, S. Above-Water Radiance and Remote Sensing Reflectance Measurements and Analysis Protocols; National Aeronautical and Space Administration: Greenbelt, MA, USA, 2000. [Google Scholar]
  86. Moses, W.J.; Bowles, J.H.; Lucke, R.L.; Corson, M.R. Impact of signal-to-noise ratio in a hyperspectral sensor on the accuracy of biophysical parameter estimation in case ii waters. Opt. Express 2012, 20, 4309–4330. [Google Scholar] [CrossRef] [PubMed]
  87. Lucke, R.L.; Corson, M.; McGlothlin, N.R.; Butcher, S.D.; Wood, D.L.; Korwan, D.R.; Li, R.R.; Snyder, W.a.; Davis, C.O.; Chen, D.T. Hyperspectral imager for the coastal ocean: Instrument description and first images. Appl. Opt. 2011, 50, 1501–1516. [Google Scholar] [CrossRef] [PubMed]
  88. Braga, F.; Giardino, C.; Bassani, C.; Matta, E.; Candiani, G.; Strombeck, N.; Adamo, M.; Bresciani, M. Assessing water quality in the northern adriatic sea from hico (tm) data. Remote Sens. Lett. 2013, 4, 1028–1037. [Google Scholar] [CrossRef]
  89. Shahshahani, B.M.; Landgrebe, D.A. The effect of unlabeled samples in reducing the small sample size problem and mitigating the hughes phenomenon. IEEE Trans. Geosci. Remote Sens. 1994, 32, 1087–1095. [Google Scholar] [CrossRef]
  90. Landgrebe, D. Information extraction principles and methods for multispectral and hyperspectral image data. Inf. Process. Remote Sens. 1999, 82, 3–38. [Google Scholar]
  91. Doxaran, D.; Ehn, J.; Bélanger, S.; Matsuoka, A.; Hooker, S.; Babin, M. Optical characterisation of suspended particles in the mackenzie river plume (canadian arctic ocean) and implications for ocean colour remote sensing. Biogeosciences 2012, 9, 3213–3229. [Google Scholar] [CrossRef]
  92. Hu, C.; Feng, L.; Lee, Z.; Davis, C.O.; Mannino, A.; McClain, C.R.; Franz, B.A. Dynamic range and sensitivity requirements of satellite ocean color sensors: Learning from the past. Appl. Opt. 2012, 51, 6045–6062. [Google Scholar] [CrossRef] [PubMed]
  93. Carniello, L.; Defina, A.; D’Alpaos, L. Modeling sand-mud transport induced by tidal currents and wind waves in shallow microtidal basins: Application to the venice lagoon (italy). Estuar. Coast. Shelf Sci. 2012, 102, 105–115. [Google Scholar] [CrossRef]
  94. Dekker, A.G.; Phinn, S.R.; Anstee, J.; Bissett, P.; Brando, V.E.; Casey, B.; Fearns, P.; Hedley, J.; Klonowski, W.; Lee, Z.P. Intercomparison of shallow water bathymetry, hydro-optics, and benthos mapping techniques in australian and caribbean coastal environments. Limnol. Oceanogr. Methods 2011, 9, 396–425. [Google Scholar] [CrossRef]
  95. Ali, K.; Witter, D.; Ortiz, J. Application of empirical and semi-analytical algorithms to meris data for estimating chlorophyll a in case 2 waters of lake erie. Environ. Earth Sci. 2014, 71, 4209–4220. [Google Scholar] [CrossRef]
  96. Vermote, E.; Justice, C.; Claverie, M.; Franch, B. Preliminary analysis of the performance of the landsat 8/oli land surface reflectance product. Remote Sens. Environ. 2016, 185, 46–56. [Google Scholar] [CrossRef]
  97. Härmä, P.; Vepsäläinen, J.; Hannonen, T.; Pyhälahti, T.; Kämäri, J.; Kallio, K.; Eloheimo, K.; Koponen, S. Detection of water quality using simulated satellite data and semi-empirical algorithms in finland. Sci. Total Environ. 2001, 268, 107–121. [Google Scholar] [CrossRef]
  98. Lee, Z.; Casey, B.; Arnone, R.; Weidemann, A.; Parsons, R.; Montes, M.J.; Gao, B.C.; Goode, W.; Davis, C.O.; Dye, J. Water and bottom properties of a coastal environment derived from hyperion data measured from the eo-1 spacecraft platform. J. Appl. Remote Sens. 2007, 1, 011502. [Google Scholar] [CrossRef]
  99. Devred, E.; Turpie, K.R.; Moses, W.; Klemas, V.V.; Moisan, T.; Babin, M.; Toro-Farmer, G.; Forget, M.H.; Jo, Y.H. Future retrievals of water column bio-optical properties using the hyperspectral infrared imager (hyspiri). Remote Sens. 2013, 5, 6812–6837. [Google Scholar] [CrossRef]
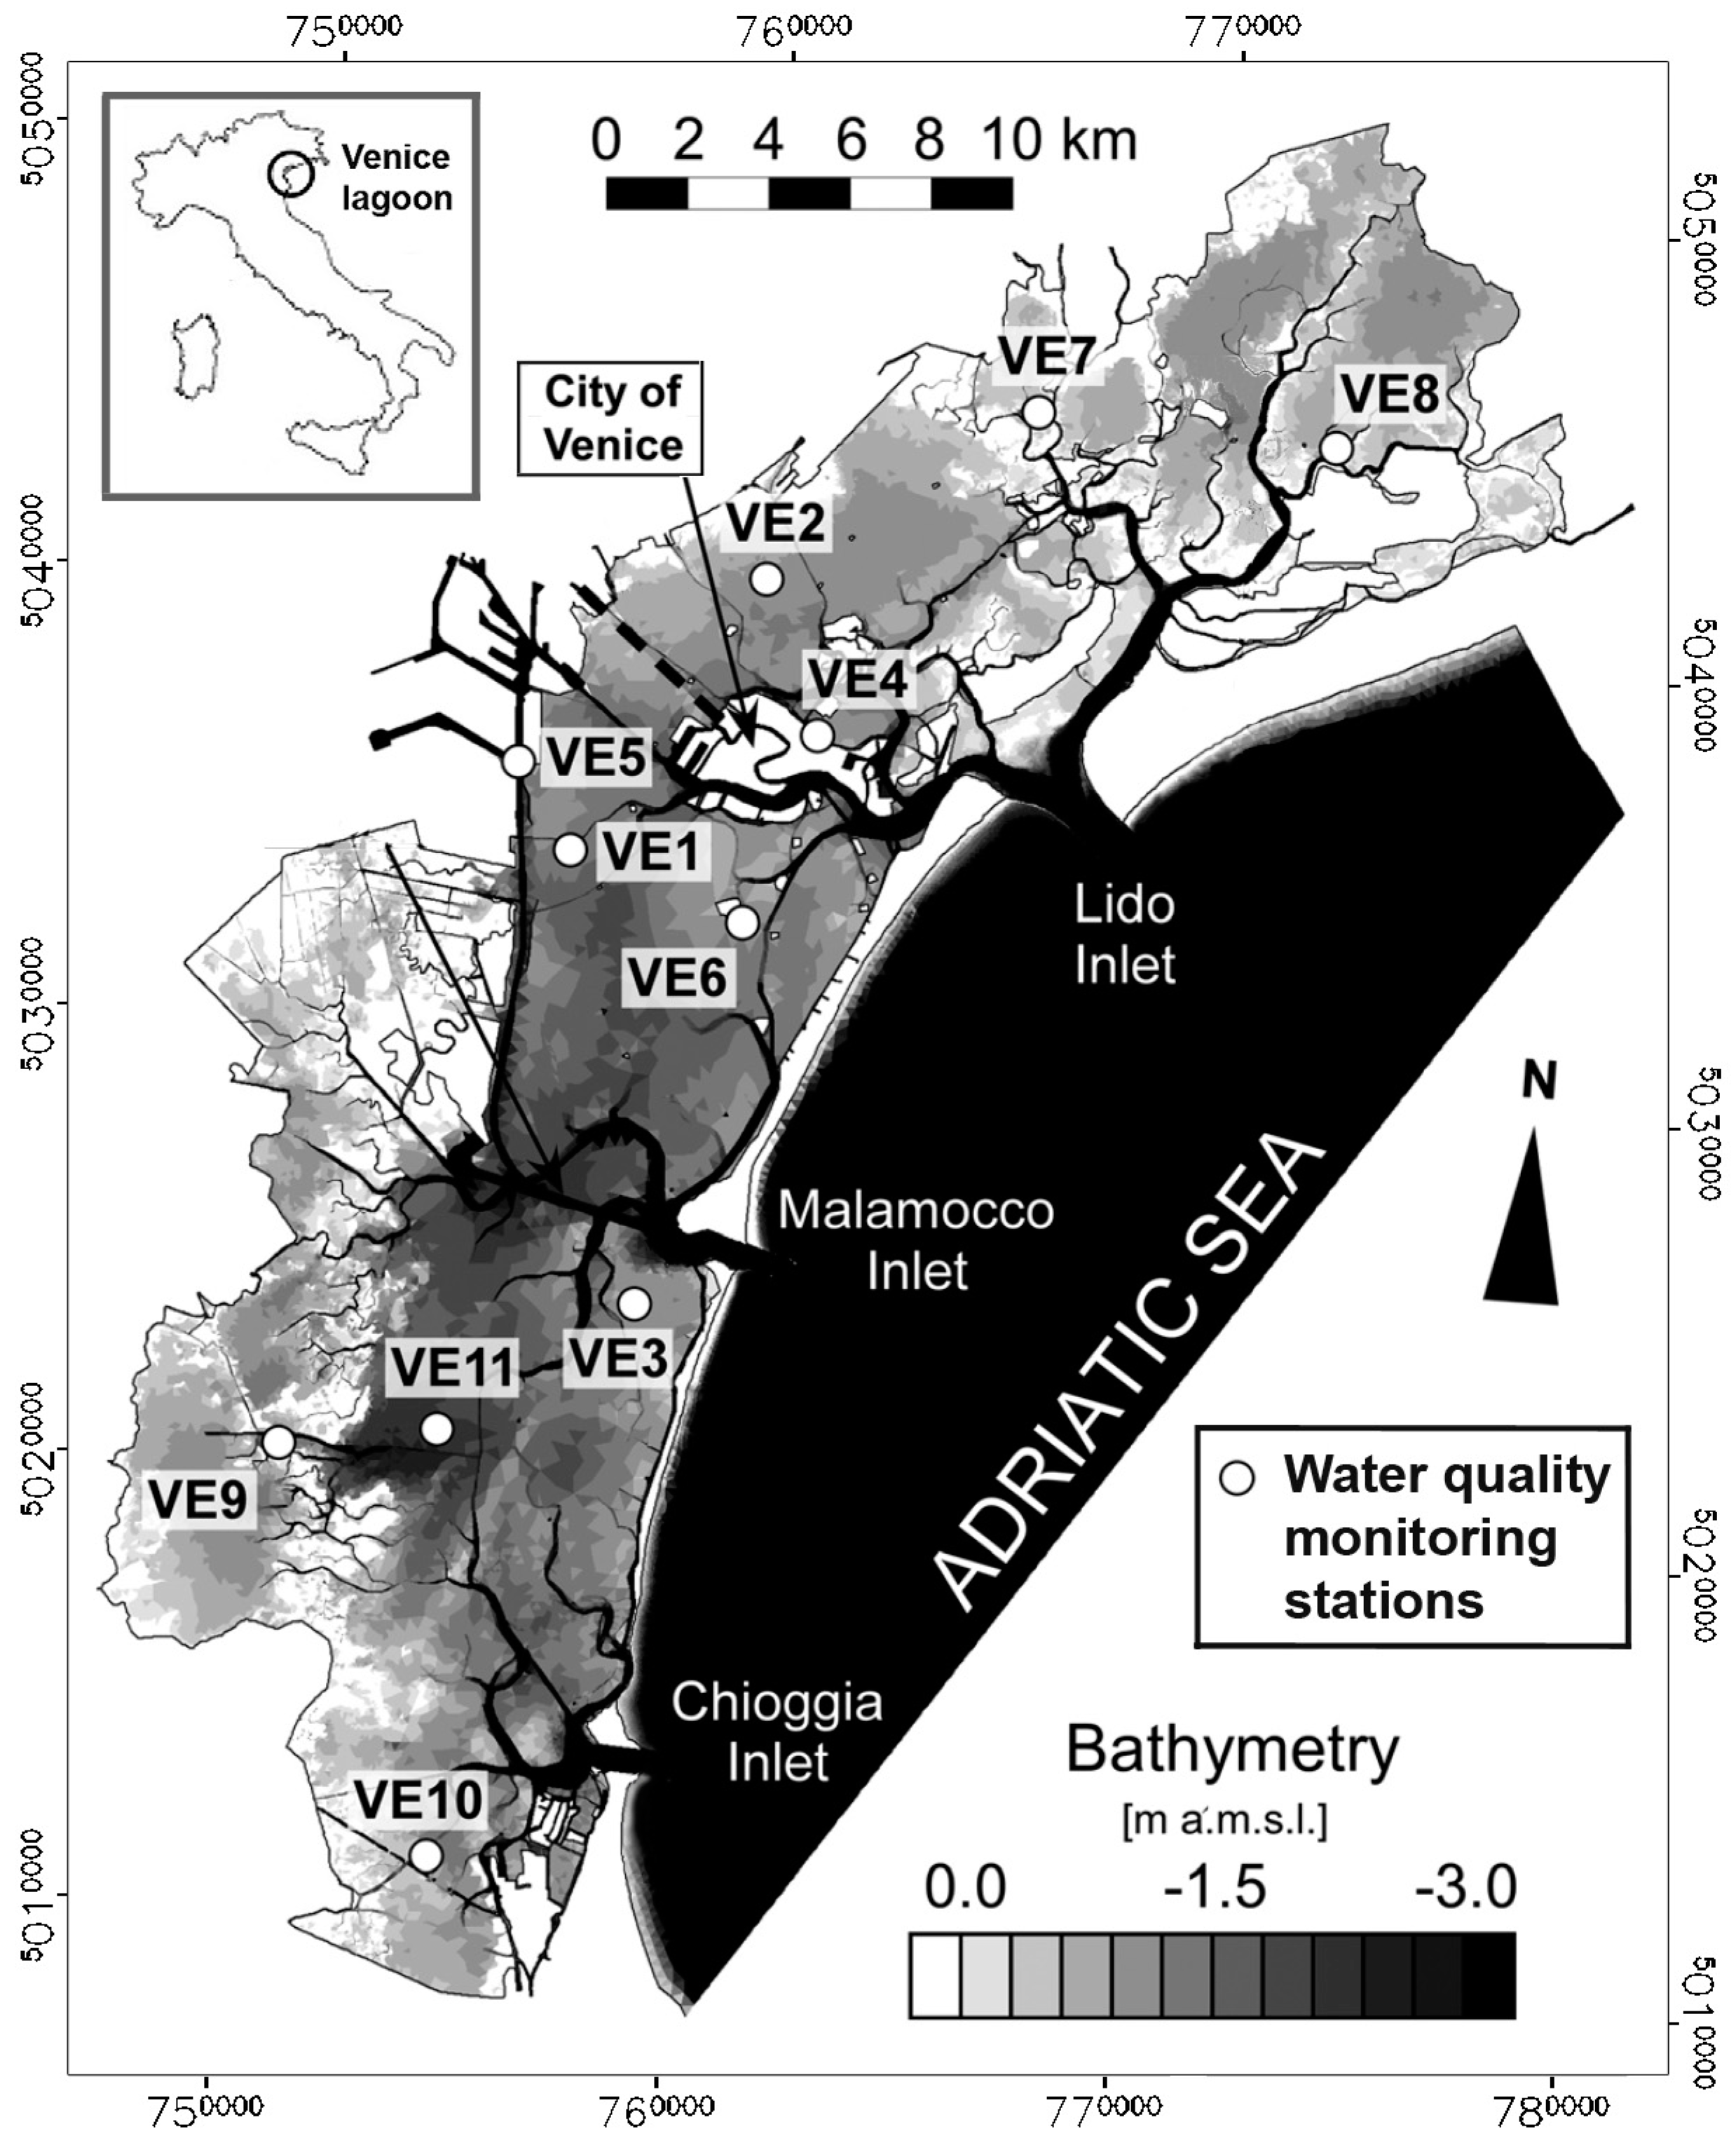
Figure 1. Bathymetric map of the Venice lagoon showing the location of the 10 measurement stations (white circles, VE1 to VE10), modified after [24]. The Venice lagoon is located within the black circle on the map of Italy on the upper left.
Remotesensing 09 00393 g001
Figure 2. Comparison of reflectance estimated from the moderate-resolution imaging spectroradiometer (MODIS) against the Hyperion Synthetic MODIS (HSM), with data collected on 10 February 2005 (ac), 18 June 2005 (df), 4 July 2005 (gi), 20 July 2005 (jl), and 7 January 2006 (mo). Colors denote the density (in percentage) of the points, which is estimated as a 2 dimensional histogram using 20 equally spaced bins in both x and y directions. Yellow (black) means a high (low) density of points in a given area of the plot. The Spearman’s rank correlation coefficient (COR) and root-mean-square-error (RMSE) are indicated in each subplot. The p-values for testing the null hypothesis that there is no correlation between the reflectance estimated from MODIS and HSM are all <0.001, suggesting a significant correlation.
Remotesensing 09 00393 g002
Figure 3. Sensitivity of the (a) root-mean-square-error (RMSE), and the suspended sediment specific (b) absorption ( γ ) and (c) backscattering ( η ) coefficients at around 400 nm to the input bottom reflectance ( ρ b ) values using all Hyperion bands.
Remotesensing 09 00393 g003
Figure 4. (a) Root-mean-square-error (RMSE) of the SSC calibration as a function of the suspended sediment specific absorption ( γ ) and backscattering ( η ) coefficients at around 400 nm using all Hyperion bands (RMSE values are color-coded based on the color bar legend), and (b) estimated SSCE versus measured SSC using optimal γ and η in (a).
Remotesensing 09 00393 g004
Figure 5. Root-mean-square-error (RMSE) of the SSC calibration as a function of the suspended sediment specific absorption ( γ ) and backscattering ( η ) coefficients at around 400 nm using Hyperion bands centered at (a) 660 nm (seven spectral bands from 630 nm to 690 nm), and (b) 560 nm (nine spectral bands ranging from 520 nm to 600 nm). RMSE values are color-coded based on the color bar legend.
Remotesensing 09 00393 g005
Figure 6. Root-mean-square error (RMSE) obtained from calibration (a) and validation (b) of the inversion of the radiative transfer model (Equation (8)) using combinations of different number of Hyperion bands. In the box-whisker plots, the red central line is the median, the edges of the box are the 25th and 75th percentiles, the whiskers extend to the extreme data points within approximately ±2.7 standard deviation from the mean (covering 99.3% data), and outliers are plotted as red crosses. Out of range data (indicate complete model failure) are represented with an arrow and the corresponding RMSE values are reported next to it.
Remotesensing 09 00393 g006
Figure 7. Root-mean-square error (RMSE) obtained from calibration left (a,c) and validation right (b,d) of the inversion of the radiative transfer model (Equation (8)) using different number of Hyperion bands combinations: mean and one standard deviation, which is denoted as error bar (a,b), and minimum (c,d), computed at a spectral band using all the possible pairs of that spectral band with the others. Out of range data (indicate complete model failure) are represented with an arrow and the corresponding RMSE values are reported next to it.
Remotesensing 09 00393 g007
Figure 8. Root-mean-square error (RMSE) obtained from calibration (a,c,e) and validation (b,d,f) of the inversion of the radiative transfer model (Equation (8)) using: single Hyperion band (a,b); two Hyperion bands with mean and one standard deviation that is denoted as error bar (c,d) and minimum (e,f), computed at a spectral band using all the possible pairs of that spectral band with the other. Out of range data (indicate complete model failure) are represented with an arrow and the corresponding RMSE values are reported next to it, spectral bands fail with empirical models are marked as a black cross.
Remotesensing 09 00393 g008
Figure 9. Validation of RTM-inversion method (Equation (8)) using different subset size of multispectral data (total of 52). In the box-whisker plots, the red central line is the median, the edges of the box are the 25th and 75th percentiles, the whiskers extend to the extreme data points within approximately ±2.7 standard deviation from the mean (covering 99.3% data), and outliers are plotted as red crosses. For comparison, the median, max, and min RMSE estimated using the Hyperion data (total of 20) with two spectral bands are also plotted (black dot and arrows).
Remotesensing 09 00393 g009
Figure 10. Hyperion Synthetic ETM+ (HSE) reflectance plotted as a function of SSC along with the multispectral data.
Remotesensing 09 00393 g010
Table 1. Satellite data used in this study.
Product (Preprocessing Level)Spectral Band and Range (μm)Spatial Resolution (m)Number of ImagesDate of AcquisitionSolar Azimuth (Degree)Solar Zenith (Degree)Satellite Zenith (Degree)Aerosol Optical Thickness at 550 nm 1
Hyperion (1R)B12–B35: 0.467–0.701 B141–B160: 1.56–1.7530510 Februar2005153.863.43.20.21
18 June 2005135.227.63.00.40
4 July 2005135.528.53.10.40
20 July 2005136.130.63.30.34
7 Januar 2006157.770.8−0.30.23
Landsat TM (1R)B3: 0.63–0.693028 December 2001159.171.5Nadir0.05
25 June 2007134.227.30.24
Landsat ETM+ (1R)B3: 0.63–0.6930214 September 2002151.246.2Nadir0.35
11 December 2005161.271.30.10
ASTER (1B)B2: 0.63–0.6915826 May 2005148.827.1Nadir0.11
11 June 2005145.625.60.31
13 July 2005144.727.30.20
29 July 2005146.730.40.37
14 June 2006145.325.50.17
24 June 2007148.525.10.14
10 July 2007147.826.10.04
5 September 2007157.440.60.02
ALOS (1B1)B3: 0.61–0.691018 July 2007145.926.1Nadir0.08
1 Data obtained from the aerosol robotic network (AERONET).
Table 2. List of variables used in Equations (1)–(8).
NameDescription (Unit)Value (Range)Source
Rrs(λ)Above surface remote sensing reflectance (460 to 700 nm) (sr−1)0.01–0.041
ρ b Bottom reflectance (460 to 700 nm)0.05–0.092
HWater depth (m)1.2–2.53
θ Subsurface solar zenith angle (rad)0.35–0.781
a w ( λ ) Absorption coefficient of pure water (460 to 700 nm) (m−1)0.01–0.64 4
a p h * ( λ ) Phytoplankton-specific absorption coefficient (460 to 700 nm) (m2/mg)0.001–0.0275
a C D O M * Colored dissolved organic matter (CDOM)-specific absorption coefficient at 375 nm (m−1)1.252
η Suspended sediment specific backscattering coefficient at 400 nm (m2/g)0.34, 0.385, 6
γ Suspended sediment specific absorption coefficient at 443 nm (m2/g)0.033–0.0677
CCChlorophyll-a concentration (mg/m3)0.2–6.83
SSCSuspended sediment concentration (g/m3)4–1003
Sources: 1: Satellite sensor data, 2: Volpe et al. [21], 3: In-situ measurement, 4: Pope and Fry [57], 5: Santin et al. [27], 6: Babin et al. [72], 7: Babin et al. [58].
Table 3. Least root-mean-square-error (RMSE) obtained from the inversion of radiative transfer model (Equation (8)) with calibration and validation (see Section 2.5 for detail) using Hyperion data.
Calibration RMSE (g/m3)Validation RMSE (g/m3)Difference between Calibration and Validation (g/m3)
Spectral bands from 460 nm to 700 nm17.5627.009.44
Spectral bands centered at 660 nm15.5622.486.92
Spectral bands centered at 560 nm17.6823.816.13
Table 4. Root-mean-square-error (RMSE) estimated using multispectral data with the “Red” spectral band (centered around 650 nm).
Calibration RMSE (g/m3)Validation RMSE (g/m3)Difference between Calibration and Validation (g/m3)
RTM-inversion13.5714.120.55
Linear regression18.5219.240.72
Second-order polynomial regression14.9416.051.11