Abstract
Accurate and consistent rainfall observations are vital for climatological studies in support of better agricultural and water management decision-making and planning. In East Africa, accurate rainfall estimation with an adequate spatial distribution is limited due to sparse rain gauge networks. Satellite rainfall products can potentially play a role in increasing the spatial coverage of rainfall estimates; however, their performance needs to be understood across space–time scales and factors relating to their errors. This study assesses the performance of seven satellite products: Tropical Applications of Meteorology using Satellite and ground-based observations (TAMSAT), African Rainfall Climatology And Time series (TARCAT), Climate Hazards Group InfraRed Precipitation with Station data (CHIRPS), Tropical Rainfall Measuring Mission (TRMM-3B43), Climate Prediction Centre (CPC) Morphing technique (CMORPH), Precipitation Estimation from Remotely Sensed Information using Artificial Neural Networks Climate Data Record (PERSIANN-CDR), CPC Merged Analysis of Precipitation (CMAP), and Global Precipitation Climatology Project (GPCP), using locally developed gridded (0.05°) rainfall data for 15 years (1998–2012) over East Africa. The products’ assessments were done at monthly and yearly timescales and were remapped to the gridded rain gauge data spatial scale during the March to May (MAM) and October to December (OND) rainy seasons. A grid-based statistical comparison between the two datasets was used, but only pixel values located at the rainfall stations were considered for validation. Additionally, the impact of topography on the performance of the products was assessed by analyzing the pixels in areas of highest negative bias. All the products could substantially replicate rainfall patterns, but their differences are mainly based on retrieving high rainfall amounts, especially of localized orographic types. The products exhibited systematic errors, which decreased with an increase in temporal resolution from a monthly to yearly scale. Challenges in retrieving orographic rainfall, especially during the OND season, were identified as the main cause of high underestimations. Underestimation was observed when elevation was <2500 m and above this threshold; overestimation was evident in mountainous areas. CMORPH, CHIRPS, and TRMM showed consistently high performance during both seasons, and this was attributed to their ability to retrieve rainfall of different rainfall regimes.
1. Introduction
Accurate rainfall measurements are very important for many applications, such as hydrological modelling, agricultural practices, and climate studies. Rain gauge measurements provide the most direct measurement of rainfall, but over East Africa their networks are often spatially and temporally limited. Satellite-derived rainfall products may complement the sparse rain gauge data as they have an advantage of wide and consistent coverage [1,2,3]. Their estimates are mainly derived from thermal infrared (IR) sensors on board geostationary satellites, and passive and active microwave (MW) sensors on board low Earth-orbiting satellites. Some products combine IR- and MW-based estimates, thus taking advantage of the high temporal resolution of IR platforms and the better accuracy in rainfall estimation of MW sensors. Most of these satellite-derived rainfall products have been validated globally and regionally [4,5] but there are still large discrepancies with ground-based observations at the sub-regional level, where these data are applied [6]. Furthermore, the uncertainties of these products depend on the season and climate [7,8]. Maggioni et al. [9], who studied the uncertainties of high-resolution satellite rainfall products, found that the systematic and random errors presented in these products were responsible for the inaccuracies in the retrieval of high rainfall rates.
Diem et al. [10] assessed three high-resolution satellite products over Western Uganda on daily, monthly, and seasonal timescales against ground-based observations. The results show good rainfall detection, but challenges in retrieving orographic rainfall were experienced. The products underestimated the amount of rainfall in high-altitude areas [11] over Northeastern Tanzania. Dinku et al. [3] studied the East Africa region and explored the effect of mountains and arid climates on the performance of four satellite rainfall products. Their study attributed the low performance to the use of infrared sensors, as they considered warm cloud ‘not precipitating.’ For example, single infrared sensor products showed the lowest performance over high-altitude areas, due to their limitations in retrieving different rainfall regimes. Satellite rainfall products that included rain gauge data in their bias correction tended to outperform those that did not [12,13,14].
Asadullah et al. [15] evaluated monthly rainfall estimates of satellite rainfall products, revealing that they reproduced spatial and seasonal rainfall patterns, but had shortcomings in accurately retrieving the amount of rainfall. Historical rain gauge measurements were also used to determine the suitability of these products for hydrological and climatological applications over the region. Maidment et al. [16] evaluated model-based and satellite-derived rainfall estimates, and found that satellite-derived products produced rainfall patterns that were similar to ground-based observations. However, evaluating these products was challenging due to the inclusion of Global Telecommunication Network (GTS) rain gauge data, which also are included in the validation data. It is important to include updated rain gauge networks to increase the independence of the evaluation.
While satellite products are updated from time to time, improved independent climatological data would improve the assessment of these products. This necessitates the continual comparison between products, especially before their application.
Although the Global Precipitation Climatology Centre (GPCC) gauge network is widely used to validate satellite products and shows good performance, its coarse resolution (0.5) requires local corrections before the data can be used in applications [17]. Recent comparisons between the Centennial Trends precipitation dataset (CTPD) over the greater horn of Africa have indicated a great decline in rain gauges used by GPCC [18]. As a result, GPCC shows a higher absolute error (31%) than the CTPD (21%), which has more rain gauges. The decline in rain gauge distributions is a global problem that needs to be addressed so that societal needs that depend on information from such data is not compromised. The Intergovernmental Authority on Development (IGAD) Climate Prediction and Applications Centre (ICPAC) [19] in collaboration with regional meteorological organizations have developed gridded rain gauge data (0.05°). These data include all available rain gauge measurements for the region that have been quality controlled. An upgrade of climatological data has filled some of the data gaps, which was the intention in creating the new dataset, thus making it preferable for use in sub-regional applications.
This study aims to assess the spatial and temporal performance of seven satellite precipitation products: Tropical Applications of Meteorology using Satellite and ground-based observations (TAMSAT), African Rainfall Climatology And Time series (TARCAT), Climate Hazards Group InfraRed Precipitation with Station data (CHIRPS), Tropical Rainfall Measuring Mission (TRMM-3B43), Climate Prediction Centre (CPC) Morphing technique (CMORPH), Precipitation Estimation from Remotely Sensed Information using Artificial Neural Networks Climate Data Record (PERSIANN-CDR), CPC Merged Analysis of Precipitation (CMAP), and Global Precipitation Climatology Project (GPCP), and the influences of elevation variability and seasonality of rainfall types in relation to their errors. The East Africa region was chosen for its high rainfall variability and the complexity of the terrain. Monthly and yearly assessments of the products were carried out over the period of 1998–2012. Rain gauge observations from the ICPAC gauge network were exploited as reference data for assessment during the main rainy seasons.
2. Study Region and Data
Study Region
The study area is East Africa, situated between 29°E and 42°E, and 12°S and 5°N, and comprises five countries: Kenya, Uganda, Tanzania, Burundi, and Rwanda (Figure 1). The topography is very diverse, ranging from mountains of over 5000 m to −24 m mean sea level on the Indian coast.
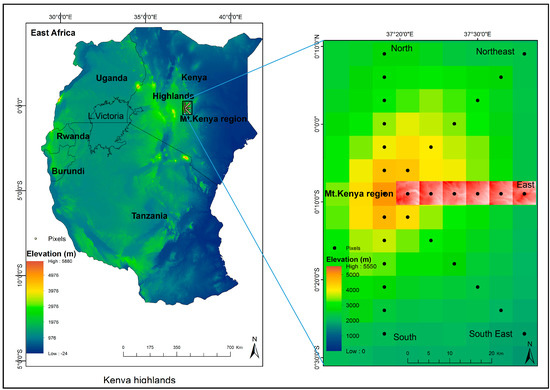
Figure 1.
Map of East Africa, with Shuttle Radar Topography Mission (SRTM) 90 m digital elevation model and embedded rain gauge rainfall stations used in interpolation over the region. The highlighted pixels (red) were pixels used to analyze the elevation variabilities within each pixel. Mount Kenya region elevation map is zoomed over the selected pixels within areas of high negative bias.
East Africa experiences two main rainy seasons. The first occurs during the months of March, April, and May (MAM), referred to locally as the ‘long’ rainy season, and the second occurs during the months of October, November, and December (OND). The MAM rainy season has more rainy days and more intense rainfall, hence the name ‘long rains.’ Conversely, the OND rainy season has fewer rainy days than the MAM and rainfall is less intense. The rainy seasons are driven by the seasonal cycle of the Inter-Tropical Convergence Zone (ITCZ). The ITCZ migrates from 15°S to 15°N between January and July. This low-pressure zone is characterized by convective activities that lead to increased precipitation [20]. The rising air descends over the subtropical high-pressure zones, while the cold air of those highs replaces the warm ascending air, forming a circulation referred to as the Hadley circulation. Convergence in the ITCZ is enhanced by a moisture influx from easterly and westerly flows during the MAM and OND seasons. The easterly winds occur mainly during the transition between the northern and southern hemisphere summer monsoons and are enhanced by local topographic effects. Nicholson [21] studied the Turkana Jet climatology and showed that the direction and force of tropospheric winds may enhance wetness or dryness over the region. The study associated the Turkana jet stream with aridity over Northeastern Kenya, Somalia, and Southern Ethiopia. Furthermore, the study revealed that the seasonality of the low-level (850 mb) winds influenced convective and orographic rainfall occurrences. This means that wind flow can enhance or minimize the uncertainties of the satellite-derived rainfall estimates depending on the type of rainfall regime.
Monthly gridded (0.05° × 0.05°) rain gauge data were obtained from the ICPAC regional office in Nairobi, through the Kenya Meteorological Department (KMD). This dataset was created using interpolated, quality controlled rain gauge measurements from 284 rainfall stations over East Africa. The GeoCLIM tool with the inverse distance weighting (IDW) interpolation was used to grid the rain gauge data. The GeoCLIM tool developed by Tamuka Magadzire of the United States Geological Survey (USGS) Famine Early Warning Systems Network (FEWSNET) is a climatological tool for rainfall, temperature, and evapotranspiration analysis. It was aimed at supporting the US Agency for International Development’s (USAID) Planning for Resilience in East Africa through Policy, Adaptation, Research, and Economic Development (PREPARED) Project and Global Climate Change activities. It is user-friendly and has been used with success in East Africa [22]. The IDW is widely known for its robustness in computing ability [23]. Overall, the approach was found suitable over East Africa. Stations within the study region are shown in Figure 1.
TAMSAT, African Rainfall Climatology and Time series (TARCAT v 2.0) is a 30+ year gridded product. It is an updated product from TAMSAT, which is derived from Meteosat thermal infrared cold cloud duration (CCD) fields and recalibrated using available climatological datasets over African countries. The data have a spatial resolution of 0.0375° and a daily/decadal/monthly temporal resolution. TARCAT covers the African continent, and data are available from January 1983 to the near present. Further data details can be found in Maidment et al. [24] and Tarnavsky et al. [25].
CHIRPS is a 35+ year quasi-global dataset developed by the United States Geological Survey (USGS) Earth Resources Observations and Science Centre and the University of California Santa Barbara Climate Hazards Group. CHIRPS is an upgrade of the original CHIRP product, and now also includes data from rain gauge stations. It has a spatial resolution of 0.05°, and a daily/pentad/monthly temporal resolution. It uses TRMM multi-satellite precipitation analysis version 7 to calibrate the CCD rainfall estimates. The product covers the area between 50°N and 50°S, and data are available from January 1981 to the near present. CHIRPS v.1.8 data were used. Further details can be found in a study by Funk et al. [17], and an assessment of its performance relative to other products is provided in research by Tote et al. [26].
The TRMM-3B43 product consists of the monthly accumulations of three-hourly TRMM-3B42 and monthly GPCC data. The data have a spatial resolution of 0.25°, cover 50°N to 50°S, and are available from January 1998 to mid-April 2015. Although this algorithm no longer provides observations, its climatological records are useful for climate studies that require historical data to understand the rainfall variability over the region, and can also be used as background information in bias corrections for better planning. Further details can be found in a study by Huffman et al. [27].
The CMORPH is a global precipitation dataset with high spatial and temporal resolution. It uses microwave sensors for rainfall measurements and geostationary satellite infrared imageries to transport estimates between two successive microwave images. The missed estimates result from temporal gaps in microwave imageries. The CMORPH daily temporal resolution Version 1.0 (v1.0/crt), which blends rain gauge and satellite precipitation products, was used in this study. It covers 60°N to 60°S, and data are available from January 1998 to the near present. The data have a spatial resolution of 0.25°. Further details can be found in Reference [1].
PERSIANN-CDR is a National Climatic Data Centre (NCDC) Climate Data Record (CDR) of the National Oceanic and Atmospheric Administration (NOAA). It contains daily rainfall estimates that were derived using the PERSIANN algorithm at a spatial resolution of 0.25°. It covers 60°N to 60°S over the period between 1 January 1983 and 31 December 2012. It is generated from the PERSIANN-CDR algorithm using the Gridded Satellite Infrared data (GribSat-B1) infrared data as input, and the rainfall estimates are bias corrected using the GPCP monthly data. Monthly accumulations were used. Further details can be found in Reference [28].
The CMAP dataset was derived from several satellite products, the National Centre for Atmospheric Research (NCEP/NCAR) reanalysis precipitation estimates, and GPCC rain gauge data. The satellite estimates included the GOES Precipitation Index (GPI), the Outgoing Longwave Radiation (OLR)-based Precipitation Index (OPI), estimates from the Special Sensor Microwave/Imager (SSM/I) and those based on the Microwave Sounding Unit (MSU). The combined products from these sources are used to produce pentad and monthly CMAP data. The spatial resolution is 2.5°, and data are available from January 1979 to the near present. The area between 90°N and 90°S is covered by the product. Further details can be found in Reference [29].
The GPCP algorithm provides a global precipitation product at a monthly and daily temporal resolution. It was developed by the World Climate Research Program (WCRP) and the Global Energy and Water Cycle Experiment (GEWEX). It combines precipitation products from infrared, passive microwave sources and rain gauge observations. It is sensitive to low rain gauge distribution, especially in high-altitude areas if the gauges used are not adequate to characterize the spatial rainfall variability [30]. Version 2, which was used in this study, has a spatial resolution of 2.5°, a monthly temporal resolution, covers 90°N to 90°S, and data are available from January 1979 to the near present. Further details can be found in Reference [4].
Wind data were derived from the monthly means of daily means of low-level (850 mb) zonal (U), and meridional (V) wind component model outputs, from the ERA-Interim reanalysis data obtained from of the European Centre for Medium-Range Weather Forecasts (ECMWF). The months of March, April, May, October, November, and December, were used. The data have a spatial resolution of 0.75° and are available from January 1979 to the present.
Elevation data were downloaded from the Shuttle Radar Topography Mission (SRTM) 90-m DEM (Digital Elevation Model) website (www.cgiar-csi.org/data/srtm-90m-digital-elevation-database-v4-1). The 5° spatial resolution tiles were mosaicked over the East Africa region through Geographical Information System (GIS) functionality.
3. Methodology
3.1. Assessments of Spatial and Temporal Characteristics
Both the gridded rain gauge data and corresponding satellite-derived rainfall estimates were averaged over 15 years (1998–2012), for each of the months of the ‘long’ and ‘short’ rainy seasons. To allow for the comparison of all seven satellite rainfall estimates with the gridded rain gauge scales, they were converted to monthly temporal resolution. For the spatial scale, two approaches were tested: resampling by use of the nearest neighbor, and bilinear interpolations to 0.05° gridded rain gauge scales. For the study area, the nearest neighbor showed the highest accuracy with a root mean square difference (RMSD) within 200 mm/month, while that of the bilinear approach was approximately up to 1000 mm/month. The nearest neighbor minimizes the loss of pixel values from the original image when downscaled to finer scales [31]. This is an important aspect in retaining the originality of the satellite rainfall values. Validation was accomplished by considering point-to-point comparisons of the extracted satellite-derived rainfall estimates and corresponding gridded rain gauge data from the 284 rainfall stations distributed over the region. The comparison was done monthly and yearly. Continuous statistics of correlation (cc), centered RMSD, standard deviations (σ), and mean bias were used to quantify the relationships. Taylor diagrams [32] were used for pattern analysis (Equations (1)–(4)).
where are the satellite rainfall estimates, is the gridded rain gauge data, over bar is the mean, are the respective standard deviations of the satellite (s) and gridded rain gauge datasets (g), and N is the number of samples considered. The mean squared error (MSE) criterion was used to evaluate the overall accuracy of the monthly satellite rainfall products for each month of the rainy season. The MSE was decomposed into three terms: error in the mean, variance, and correlation, as shown in Equation (5) [33].
where are the respective means of the satellite (s) and gridded rain gauge (g) data.
The relative contribution of each of these components to the overall MSE can be computed as shown in Equation (6).
where Fi represents the error component terms given in Equation (5); correlation (F1), variance (F2), and mean (F3), respectively. The three components contribute to the total MSE for the specific month and the largest value of the three would, therefore, be the dominant contributor to the total error.
Furthermore, the quality of each of the satellite products was temporally assessed using corresponding gridded rain gauge data on a yearly basis by use of the mean bias (Equation (7)). Similar to monthly assessments, only the rainfall values of pixels collocated at the 284 rainfall stations were considered.
3.2. Assessments of Seasonal Influences
Although East Africa can be dominated by convective rainfall, the presence of mountains induces orographic rainfall and the two coexist with one type being more dominant than the other during the rainy seasons. In this study, the seasonality of the dominant rainfall type for each season was established with the aid of mean low (850 mb) wind flow. Since moisture influx to the high elevated areas is induced by winds, the direction of wind flow during the rainy months is important. The peak rainfall months of April and November for the MAM and OND seasons, respectively, were used to establish these links. Equations (8)–(10) provide the description of the wind analysis.
where u and v are the east-west (zonal) and north-south (meridional) wind components of model out put in ms−1, and Wr is the wind magnitude. Wind magnitude is converted to wind direction (Wtrig) in radians and then to degrees (Wdeg).
3.3. Assessments of Topographic Impacts
The presence of different landscapes that include mountains, low lands, and inland water bodies in East Africa can greatly affect rainfall variability at a small distance. Assessments of the elevation variations within the pixels were done to the original 90-m spatial scale corresponding to selected pixels on the eastern side of Mount Kenya, which was identified as having a large bias. Further, assessments were made of the effects of the elevation variability on the performance of the satellite rainfall products. For compatibility of the two data sets, the elevation map was resampled using the nearest neighbor to a 0.05° spatial scale of the satellite rainfall mean bias. The effect of resampling on the elevation values was minimal and the relationship between elevation and bias was similar in resampled and non-resampled elevations. Pixels were selected from the point of the highest negative bias (Mount Kenya) to the north, south, east, northeast, and southeast. The mean bias derived from the rainfall averages (1998–2012) were extracted for the peak rainfall months of April and November. These two months have the highest rainfall amount during the MAM and OND rainfall seasons. For each product, changes in mean bias from one elevation range to another, as represented by different pixels, were determined.
4. Results
4.1. Performance of Monthly Satellite Rainfall Products
In this section, the patterns of monthly rainfall averages from the gridded (0.05°) rain gauge data and corresponding satellite rainfall product (TARCAT, CHIRPS, TRMM, CMORPH, PERSIANN-CDR CMAP, and GPCP) were compared. Grid-based statistical comparison between the two datasets was used, while a point-based comparison between the rain gauges and the satellite pixels that contain the rain gauges were used for validation.
Figure 2 shows the Taylor diagrams that describe the monthly performance of satellite-derived rainfall estimates in relation to the gridded rain gauge data across East Africa, for the MAM and OND rainy seasons. During the MAM season, the performance of all satellite products is lower when rainfall intensity is high. CHIRPS, CMORPH, and TRMM show the highest correlation coefficient (cc) (>0.7) and lowest RMSD. Conversely, TARCAT, PERSIANN-CDR, CMAP, and GPCP showed poor performance. TARCAT has been developed primarily for drought monitoring applications. This optimization for low rainfall intensities could explain the poor performance during months with heavy rain. Moreover, TARCAT’s single (IR) sensor algorithm is not conducive to achieving high accuracy rainfall estimates.
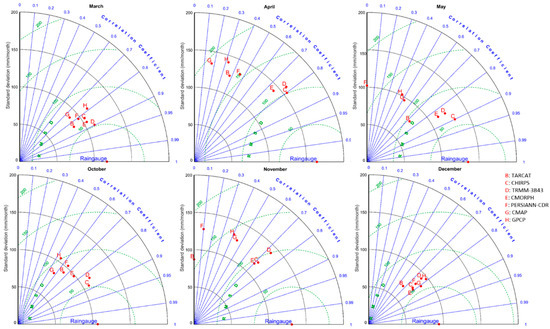
Figure 2.
Taylor diagrams displaying a statistical comparison between gridded rain gauge data and seven satellite-derived rainfall products per month for the wet months from March to May and October to December over a period of 15 years (1998–2012).
During the OND rainy season, rainfall amounts decreased compared to MAM, but the products showed a general decrease in performance. The decrease in the performance of the products was an indication that their performance was not only influenced by the rainfall intensity per se, but also by the rainfall regimes. The lowest performance was, however, observed during the peak rainfall month of November. This was demonstrated by the decreased cc and increased RMSD. CHIRPS, CMORPH, and TRMM-3B43 similarly had the highest performance for the MAM season.
Figure 3 shows the correlation, variance, and mean error contributions to MSE for each satellite product with respect to the 284 rainfall stations considered for validation. It clearly shows that nearly all the satellite rainfall products showed large correlation and mean error contributions. This is an indication of discrepancies between the two datasets in detection and retrieval capability. The products showed varying detection and retrieval potentials for the six months considered. It is remarkable that all products showed a high ability to represent spatial rainfall variability, as indicated by the lowest variance errors (<0.2).
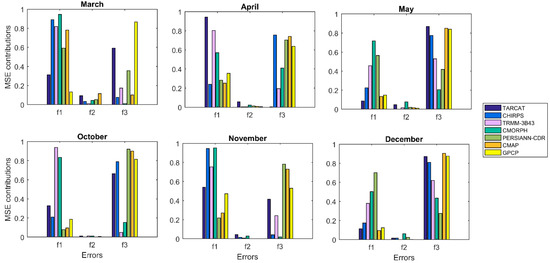
Figure 3.
Mean squared error (MSE) contributions by the correlation (f1), variance (f2), and the mean (f3) components derived from the satellite averages of the rainfall estimates (1998–2012) with respect to the rain gauge data.
Figure 4 shows bias variations for each product per year during the peak rainfall month (April) of the MAM season. All products apart from CHIRPS and TRMM-3B43 have varying large biases. TARCAT and CMORPH also have a low bias, but with remarkable underestimations around the year 2001 which was one of the driest year over the region [34]. This reflects the fact that TARCAT was optimized for accurate rainfall estimation during drier periods. Although CMAP has a slightly higher bias, it shows consistency. PERSIANN-CDR and GPCP show the highest bias variations. Furthermore, the two products show similar trends, which is expected, as GPCP data are used for the calibration of PERSIANN-CDR. Their similar patterns of bias are an indication of a systematic bias which may be attributed to the input rain gauge. The GPCP is sensitive to rain gauge distributions [35] as is PERSIANN-CDR [36].
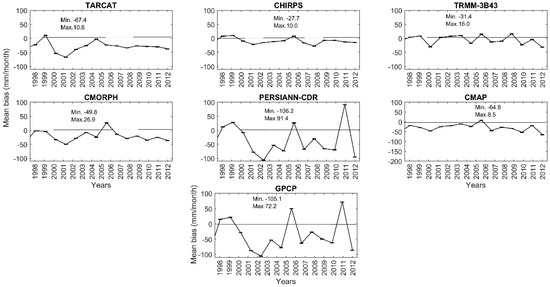
Figure 4.
Monthly mean bias (mm/month) of satellite rainfall products in April (1998–2012).
Figure 5 shows the bias variations for each product per year during the peak rainfall month (November) of the OND season. During this season, the bias of the satellite products were more uniform, with a general underestimation by TARCAT in 2006, a year in which East Africa received heavy rainfall [37]. It is remarkable that CMAP shows a general uniform low bias throughout the years. TRMM shows overestimation from 2003–2004, which were among the driest years observed over the region. From the two peak months (April and November) a significant observation is the reduction of the mean bias in November compared with April, and, in general, systematic underestimation is observed for most products with the reduction of rainfall concurring with previous results.
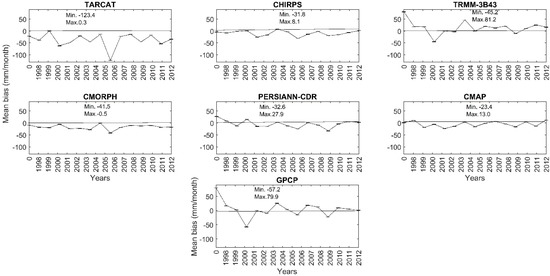
Figure 5.
Monthly mean bias (mm/month) of satellite rainfall products in November (1998–2012).
4.2. Seasonal Influences on the Performance of Satellite Products
The link between the performance of satellite rainfall products and different rainfall regimes (convective and orographic processes) in retrieving rainfall over East Africa was assessed by analyzing wind patterns. It is worth noting the role of the wind direction in determining the dominant rainfall regime over the region. Figure 6 shows the low (850 mb) mean wind direction patterns. During the season of MAM (as represented by the month of April) rainfall is both convective and orographic. Wind convergence (westerlies and easterlies) along Lake Victoria and Uganda, on the Kenyan border enhances convective systems, while orographic rainfalls occur over the highlands. Satellite rainfall products can detect more convective rainfall due to the use of infrared sensors in retrieval. This is observable in the spatial maps of less mean bias for the month of April in Figure 7 in areas of wind convergence. Negative bias was more dominant and corresponded to areas of higher rainfall amounts, particularly around Mount Kenya, which is within the Kenyan highlands (Figure 1). It is worthy noting that spatial maps include Pemba and Zanzibar, which are Tanzania’s islands, and in this analysis Zanzibar is the area with the largest negative bias (<−300 mm/month) because there was no rain gauge data over this area.
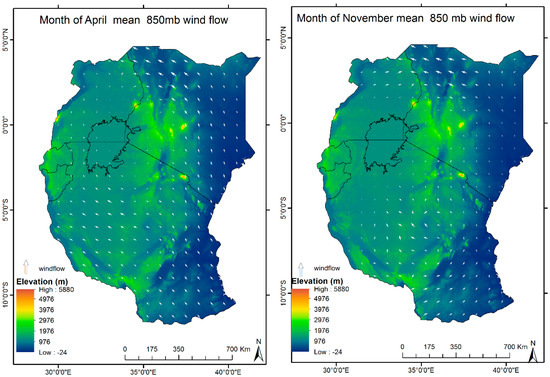
Figure 6.
Mean low level (850 mb) wind direction flow during the months of April and November (1998–2012) over the region of East Africa. The size of the wind arrow indicates the wind magnitude strength (the larger the arrow head, the higher the wind speed).
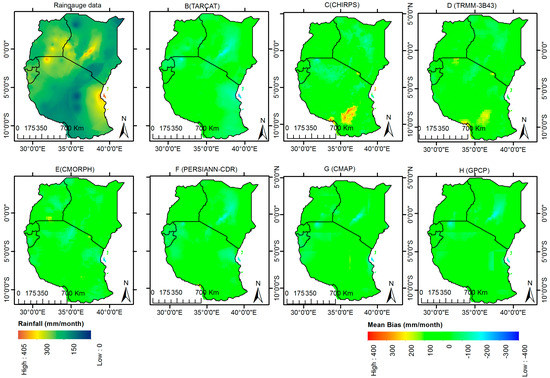
Figure 7.
Mean bias derived from averages in April (1998–2012) between satellite rainfall estimates and corresponding gridded rain gauge data for East Africa.
When considering inland areas, the largest negative biases are found in the Kenyan highlands. All products except CHIRPS, TRMM-3B43, and CMORPH showed large underestimations over this area. This can be attributed to their ability to retrieve the rainfall of different regimes that coexist during this season. TARCAT showed the highest underestimation, which can be attributed to its single infrared sensor that failed to capture warm orographic rainfall. The coarse resolution of CMAP and GPCP could have contributed to them missing the localized high rainfall in high ground areas, while PERSSIAN-CDR (which is calibrated with GPCP) shows similar patterns. Other areas of high bias are the Lake Victoria region, which all products seemed to underestimate, except CMORPH and TRMM-3B43, which both showed overestimation. Over Southern and Central Tanzania (in the high-altitude areas), CHIRPS and TRMM-3B43 showed overestimation of high rainfall amounts.
The month of November (Figure 8) was marked with a decreased rainfall amount in most parts of the region except for the Kenyan highlands and the Lake Victoria areas. During the OND season (as represented by the month of November), orographic rainfall dominated. Figure 6 shows this seasonality as a change in the mean direction of the low (850 mb) level wind flow. In the month of April, southeasterly winds from the Indian Ocean dominate and import moisture influx to the region. However, in the month of November, the winds become diffluent as they enter inland, reducing the influx of moisture inland. This reduces inland rainfall in November, as it is shown that most rain occurs over the central highlands of Kenya. This results from the trapped moisture on the elevated areas, which is inhibited further inland by the highlands. Furthermore, the southeasterly winds cut off moisture over Northeast and East Kenya. Consequently, the negative bias of the satellite products seems to increase over the Kenyan highlands. Unlike the month of April, where CHIRPS, TRMM-3B43, and CMORPH showed low biases, in the month of November during the OND season, the negative bias was evident. This is an indication that although they differ in rain rate retrieval performance, all products have difficulties in accurately retrieving orographic rainfall. A positive bias over Lake Victoria by TRMM, CMORPH, and PERSIANN-CDR was evident. However, the overestimation observed over Central Tanzania in April was reduced (except for TARCAT) as it was observed mainly during MAM season It can be understood that TARCAT is sensitive to low rainfall amounts as it is designed for drought monitoring.
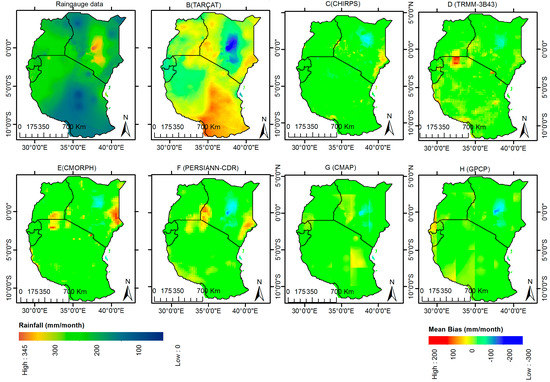
Figure 8.
Mean bias derived from averages in November (1998–2012) between satellite rainfall estimates and corresponding gridded rain gauge data for East Africa.
Quantification of the spatial mean bias was done using correlation maps. Figure 9 and Figure 10 show spatial maps of the correlation coefficients of satellite rainfall products with respect to the corresponding rain gauge data for the months of April and November. In April (Figure 9), it is clearly shown that low (0.1) correlation coefficients (insignificant at a 95% confidence level) by the products were in high rainfall areas, especially around Lake Victoria. In November (Figure 10), rainfall amounts reduced, and the performance of the products also improved, which is particularly visible in the increase of the correlation coefficients. This is in agreement with earlier findings during the MAM season, where increased rainfall amounts resulted in decreasing the satellite product’s performance.
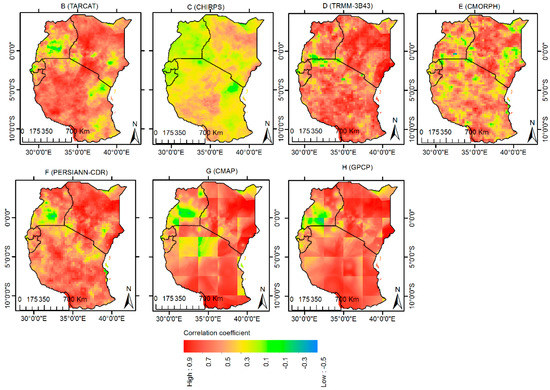
Figure 9.
Correlation coefficients derived from rainfall averages in April (1998–2012) between satellite rainfall estimates and corresponding gridded rain gauge data for East Africa.
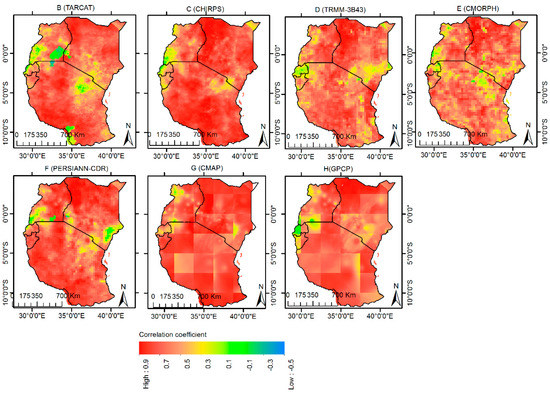
Figure 10.
Correlation coefficients derived from rainfall averages in November (1998–2012) between satellite rainfall estimates and corresponding gridded rain gauge data for East Africa.
4.3. Topographic Influence on the Performance of Satellite Products
Topographic impacts on the performance of each product were investigated by analyzing elevation variations where large underestimations were identified in satellite rainfall products in high ground areas within the Mount Kenya region. Figure 11 shows the elevation variations within selected pixels (Figure 1) which are to the eastern side of Mount Kenya, part of the area with the largest negative bias. The elevation was extracted from the 90-m DEM values that corresponds to the 0.05° area. As can be observed from this figure, elevation variations within the pixels decrease as the elevation increases from 1500 m to 4500 m. This is observable by the number of pixels with different elevation values in one pixel. It is therefore evident that at the pixel scale (0.05°), elevation variation impact is minimal. Further, assessments of the cause of the large bias were done by considering each product's mean bias in the peak months of April and November of the MAM and OND seasons, respectively. Pixels for analysis were selected from five directions which are the north, south, east, northeast, and southeast of Mount Kenya. The western side was omitted, as a lower bias was observed on that side. Bias values for each product for the two rainy months were extracted, as was the corresponding elevation for a number of the pixels. The mean bias variability for each product relative to changes in elevation from pixel to pixel was determined. Figure 12 and Figure 13 show the scatter plots of bias variations for each month to the respective pixel’s mean elevation value. It is evident during the month of April (Figure 9) that CHIRPS and TRMM-3B43 showed overestimation mainly above 2500 m. This is attributed to high rainfall amounts in high ground areas during the MAM season. It is good to note that the two showed overestimations around Lake Victoria in previous findings, and this can be understood by the trend that these two areas receive the highest rainfall over the region. Conversely, TARCAT, PERSIANN-CDR, CMAP, and GPCP show underestimations. It can be understood that both convective and orographic rainfall coexist during this season of MAM. The underestimation is more evident to the southeast and the south, which corresponds to the mean wind flow directions. In addition, during this season there is an increase of negative bias with an increase in height, which can be attributed to increased stratifications in deep convections during the MAM season. Elevation impacts related to orographic rainfall occur at low levels compared to convective systems, and this is clearly observed below 2500 m. Microwave-based products like TRMM-3B43 show the least topographic effect as they are able to retrieve different rainfall regimes, unlike infrared-based products, which consider warm orographic clouds as non-precipitating. During this season, the wind is southerly, parallel to the Kenyan highlands, and stronger. Consequently, the negative bias is more evident to the southern and southeastern part of Mount Kenya in all the products and varies with elevation changes.
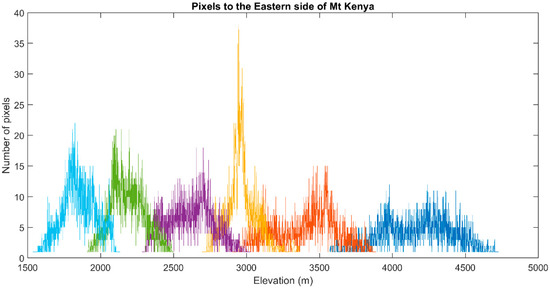
Figure 11.
Elevation (m) variations of selected pixels from near Mount Kenya eastward, which are among the areas identified with a high negative bias of varying magnitudes by all satellite rainfall products. Different colors represent the elevation variabilities from one satellite pixel to another.
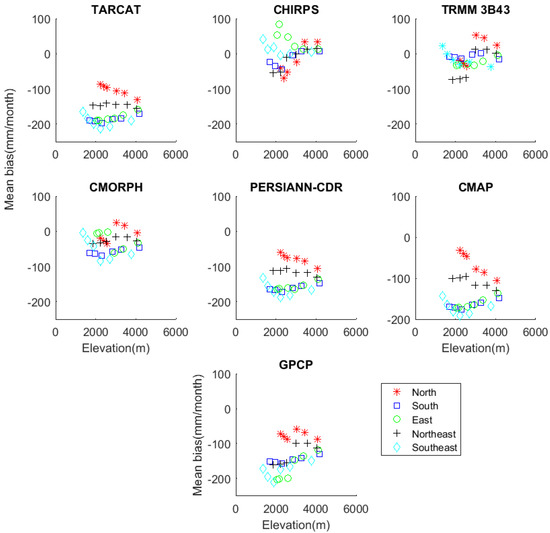
Figure 12.
Scatter plots of the mean bias of satellite rainfall estimates in relation to the elevation variations derived from the rainfall averages (1998–2012) with respect to the rain gauge data during the peak rainfall month of April of the MAM season, over the Kenyan highlands where Mount Kenya is located. The five directions from Mount Kenya to the north, south, east, northeast, and southeast are shown for each product.
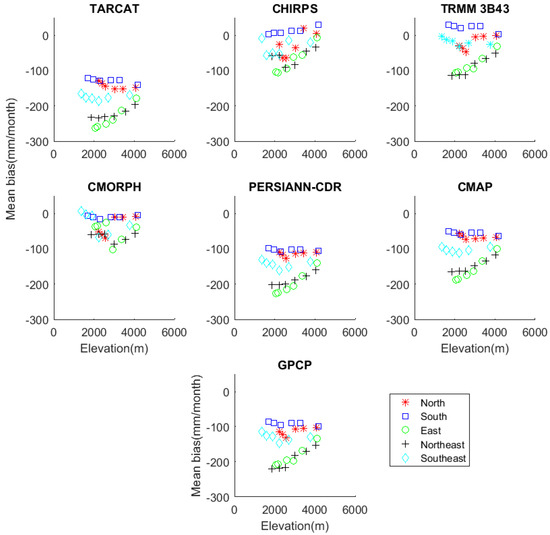
Figure 13.
Mean bias of satellite rainfall estimates in relation to the elevation variations derived from the rainfall averages (1998–2012) with respect to the rain gauge data during the peak rainfall month of November in the OND season, over the Kenyan highlands where Mount Kenya is located. The five directions from Mount Kenya to the north, south, east, northeast, and southeast are shown for each product.
As shown in Section 4.2, orographic rainfall is more dominant during the OND season, as less convergence is experienced over the region. It is evident from Figure 12 that all the products show underestimations that correspond with elevation variations to the eastern and northeastern side of Mount Kenya. This follows the wind patterns, as in November the wind is on the northeasterly side of Mount Kenya and low in speed. Further, the decrease in deep convective systems during this season is shown by fewer overestimations observed by the same products (CHIRPS and TRMM-3B43). In addition, it can be shown that an increase in negative bias, which was evident during the MAM season, is minimal and is only evident near the transition level (2500 m). Again, similar to the analysis for April, below about 2500 m the effects of elevation are evident on all products.
Overall, during the two months, CHIRPS, CMORPH, and TRMM-3B43 showed the lowest negative bias in both rainfall regimes, which is similar to a study that shows they perform well in high elevated areas [8].
5. Discussion
This study assessed the spatial and temporal performance of seven satellite-derived rainfall products: TARCAT, CHIRPS, TRMM (3B43), CMORPH, PERSIANN-CDR, CMAP, and GPCP, in relation to the gridded rain gauge data over East Africa. These evaluations are essential in promoting the use of satellite-derived rainfall estimates in water resource management applications and agricultural practices. Additionally, the inter-comparison between these products in relation to the gridded rain gauge data will enable end users to select the appropriate products for a given season and application. The products were converted to monthly spatial scales and resampled using nearest neighbor resampling to the spatial scale (0.05°) of the rain gauge data. The evaluation was conducted at two temporal scales, monthly and yearly.
The monthly satellite rainfall products showed close agreement with the gridded rain gauge data in the spatial representation of rainfall in most areas. Error metrics revealed that only about 10% of the total mean squared errors is contributed by the variance of the satellite rainfall products. The discrepancies of the satellite rainfall products and rain gauge data showed an increase with an increase in the rainfall amount. This was evident during the peak rainfall months of April and November. These results concurred with a recent study [9] that indicated that satellite rainfall products have both systematic and random errors, and that these increase with an increase in rainfall amounts. The products differed in their performances, with TRMM-3B43 and CMORPH showing the highest performance in both monthly and yearly evaluations. In high elevated areas, all products except for CHIRPS, TRMM-3B43, and CMORPH showed significant underestimations.
A yearly analysis of bias showed a reduction in mean bias. It was also observed that PERSIANN-CDR and GPCP had a similar bias trend, which was attributed to their high sensitivity to rain gauge distributions [36,38] over the region, which are also included in these algorithms. The two products also showed high fluctuating bias, which indicated that their errors are random. In yearly analysis of bias, TARCAT showed the highest underestimation (−123.4 mm month−1) in November 2006. During this month, heavy rainfall was experienced over East Africa causing floods [37], and these findings clearly confirm that TARCAT can underestimate heavy rainfall.
In addition, seasonality corresponded with the existence of different rainfall regimes. This aspect was well captured by the seasonal low-level (850 mb) winds’ mean direction. This study showed that during the MAM seasons, convective systems were dominated by the low-level wind convergence between the westerlies and easterlies, which mainly occurred around Lake Victoria and in Western Kenya (the Kenya/Uganda border). Furthermore, the southeasterlies enhanced rainfall in relation to the orientation of high-altitude areas. All products showed low performance in retrieving high rainfall amounts during the peak rainfall month of April; however, CHIRPS, TRMM-3B43, and CMORPH showed less bias over high ground areas. During the OND season, the wind diffluence divided into southeasterly and northeasterly directions as it entered inland from the Indian Ocean. Moisture influx inland was then reduced and, consequently, convergence activities became minimal.
The differences in product performance were attributable to their input data, hence their limitation in capturing different rainfall regimes. Rainfall retrieval derived from infrared imageries relate cold clouds to high rainfall rates [24], but over mountainous areas, warm cloud orographic processes drive most of the rainfall over East Africa. Consequently, IR-based satellite products underestimate rainfall over high-altitude areas. PERSIANN-CDR uses infrared only data as an input, and as such it underestimates warm orographic processes. This is particularly the case during the OND season when rainfall is dominantly orographically induced. However, the products could detect areas of rainfall occurrence, indicated by the significant correlation coefficient of >0.5 during this season by all the products. TARCAT is an example of a single infrared sensor product [10], and showed the lowest performance in retrieving orographic rainfall; it uses gauge data for calibration from a climatological dataset—not real-time—which is a completely different approach adopted to solve the low density of gauge observations for this area. In areas where elevation is >2500 m (such as over the Kenyan highlands, where Mount Kenya is located), the products showed large underestimation. The remarkable performance by CHIRPS and TRMM-3B43 can be attributed to the direct inclusion of rain gauge data and microwave images during calibration. However, for CMORPH, interpolated microwave rainfall retrieval using infrared imageries may have affected its performance.
Error characteristics of satellite rainfall products in mountainous areas reveal topographic impacts, which are associated with systematic errors. The cause of the low negative bias over the high ground areas around the Mount Kenya region was then investigated in the peak rainfall months of April and November during the MAM and OND seasons, respectively. Use was made of spatial mean bias maps (Figure 7 and Figure 8) to extract the mean bias of selected pixels. Variations of elevation within individual satellite products’ pixels relative to their mean biases were investigated. This was to determine how elevation changes within each pixel could be related to the variability in the products’ bias. Results showed minimal elevation variations within individual pixels. Further, assessments were done on the effects of the elevation variability from pixel to pixel related to the performance of each satellite rainfall product. Pixels were selected from areas of the highest negative bias to the north, south, east, northeast and southeast of Mount Kenya, and these orientations were chosen to establish which sides of Mount Kenya have the largest impact. For each product, changes in the mean bias from one month to another, which represent the MAM and OND rainfall seasons respectively, were determined. For the pixels considered, elevation variations from pixel to pixel are related to the satellite rainfall products’ performance. The impact is both seasonal and varies from one product to another. During the MAM season, as represented by the peak rainfall month of April, when both convective and orographic rainfall coexisted, both overestimation and underestimation were observed. CHIRPS and TRMM-3B43 showed slight overestimation when the elevation was above 2500 m and underestimations when elevation was below this, while others show underestimations. The overestimations are associated with high rainfall amounts common in the mountainous areas and similar to what was observed over the Lake Victoria region. The elevation impact is similar to a study [39] whose findings revealed 3100 m to be the level above which overestimation occurs and below which underestimation is observed for (TRMM)3B42 V7. The difference in the cut-off elevation shows the dependence on geographical location and season, and varies from product to product. The deep convective systems during the MAM season coexist with stratified clouds which are warmer and at a lower level, and this was associated with a negative bias at high levels. During the OND season, orographic rainfall becomes more dominant as less convergence is experienced over the region. This is evident by the slight reductions in overestimations by both CHIRPS and TRMM-3B43. Similar to the MAM season, underestimations by all products when elevation was <2500 m was observed, mainly to the windward side to the east and northeast of Mount Kenya. The windward side receives more orographic rainfall than the leeward side (southern to southeast). CHIRPS, CMORPH, and TRMM-3B43 showed the lowest negative bias, while TARCAT, PERSIANN-CDR, CMAP, and GPCP showed the highest (similar to the MAM season).
However, the elevation variations relative to bias are more evident in the retrieval of different rainfall regimes. The presence of orographic rainfall induced by differences in elevation to the windward side of Mount Kenya is the main cause of the large negative bias of the products. Generally, CHIRPS, CMORPH, and TRMM-3B43 showed the lowest negative bias in both rainfall regimes, which is similar to a study [8] that shows they perform well in high elevated areas. However, the elevation variations relative to bias are more evident in the retrieval of different rainfall regimes. The low negative bias shown by CHIRPS, CMORPH, and TRMM-3B43 in both rainfall regimes is similar to the study [8], in which assessments of these products at high temporal resolutions on elevated areas was successful. Over Southern Tanzania and Northeastern Kenya, large sparse rain gauge data were used during the interpolation. As a result, the overestimations observed by all products at varying magnitudes were not satisfactorily explained. This leaves a gap that can be resolved by an increased rain gauge network.
6. Conclusions
Although satellite-derived rainfall products have been evaluated globally and to some extent also regionally, there are significant variations in their performance levels, especially due to the geographical location, climate, and rainfall regime. Certain products have advantages over others in some regions or climates, while other products may be more appropriate for different climates or regions. There is, therefore, a need to quantify any uncertainties before selecting the appropriate product for a specific region. Although studies have indicated topography as one factor that contributes to the uncertainties of these products over East Africa, the relationship of seasonality to elevation impacts has not been addressed. In this study, seven satellite rainfall products (TARCAT; CHIRPS; TRMM-3B43; CMORPH; PERSIANN-CDR; CMAP; and GPCP) of different spatial scales were assessed spatially and temporally, using gridded (0.05°) rainfall data over East Africa over a period of 15 years (1998–2012). Assessments were made on the impacts of elevation variability and seasonality to the products’ errors. All products were converted to monthly spatial scales and resampled using the nearest neighbor approach of 0.05° geo-reference. The assessments were done for both monthly and yearly scales, and pixels collocated at the 284 rainfall stations were used for validation.
The findings of this study are as follows:
- All the products were able to replicate rainfall patterns in space and time, but showed systematic errors in rainfall retrieval that decreased with an increase in rainfall amounts (>100 mm/month). The systematic errors were mainly in underestimations and showed seasonality as they were larger during the OND rainy season than during the MAM rainy season. The errors were more evident in a monthly timescale but decreased in a yearly timescale.
- The large underestimations were caused by the products’ inability to retrieve orographic rainfall, that is more dominant during the OND season on the windward (east and northeast) side of the Mount Kenya region due to moisture influx from the Indian Ocean. Although the use of IR satellite data offers certain advantages, notably in terms of temporal and spatial resolution, they showed the largest errors in retrieving this rainfall regime. This mainly affected TARCAT and PERSIANN-CDR, but TARCAT was affected more due to its use of a single sensor that limits its capabilities of retrieving the rainfall of different rainfall regimes. It can be understood that orographic clouds are relatively warm as they are caused primarily by kinetic turbulence, rather than convection. The study revealed that products using microwave imageries for rainfall retrieval showed fewer errors in the retrieval of orographic based rainfall. TRMM-3B43, which is microwave-based, showed the fewest errors in retrieving this rainfall type. Likewise, CMORPH utilizes passive microwave data to generate rainfall and had good performance. Although CHIRPS uses Cold Cloud Duration (CCD) for rainfall retrieval, the estimates are calibrated using the Tropical Rainfall Measuring Mission Multi-satellite Precipitation Analysis version 7 (TMPA 3B42 v7) and this is attributed to its good performance. However, CHIRPS and TRMM-3B43 overestimated high rainfall amounts.
- Elevation variation is closely related to orographic rainfall developments and hence to the satellite rainfall products’ performance. This effect is more evident during the OND season, as low-level wind enhances rainfall on the windward side, particularly over the Mount Kenya region. The study revealed that when elevation was <2500 m, the products showed underestimations. The overestimations were mainly observed during the MAM season, which is associated with increased rainfall amounts enhanced by deep convective systems, and CHIRPS and TRMM-3B43 were more affected. Possible cirrus cloud effects are also attributed to these errors.
- Products’ input data affected their performances in rainfall retrieval. Products using multiple sensors performed better than those with single sensors, especially if the sensors were on different platforms. This increased their ability to retrieve different types of rainfall over East Africa. This mainly affected TARCAT and PERSIANN-CDR, which use only infrared sensors. In addition, TARCAT showed greater impact because it uses a single sensor (infrared) that limits the retrieval of different rainfall regimes. The distribution of the rain gauges used in calibration also affects their performance, and thus there is a need to regularly update the algorithms with denser rain gauge data where applicable. This affects the way each product varies in performance from region to region. This was attributed to the underperformance of GPCP over the region.
- The satellite products considered are therefore applicable over East Africa, but errors in high ground areas need to be considered during the OND season, especially for products using only infrared sensors. To reduce orographic effects, elevation and wind direction data are recommended to be included as input data in the development of algorithms to improve the accuracy of orographic rainfall retrieval.
Ongoing work will focus on improving satellite rainfall estimates by locally correcting systematic biases that may not have been effectively removed during global validation. This will enhance their applicability in climate predictions over the region and their possible application to other areas.
Acknowledgments
This work was made possible through the funding provided by the Netherlands Fellowship Programmes (NFP), and we greatly appreciate their support. The University provided funds for open access.
Author Contributions
All three authors contributed in concept building and manuscript preparation. Kimani analyzed the data and drafted the manuscript. Su and Hoedjes provided conceptual advice and contributed to the overall writing and approval of the final manuscript.
Conflicts of Interest
The authors declare no conflict of interest.
References
- Joyce, R.J.; Janowiak, J.E.; Arkin, P.A.; Xie, P.P. Cmorph: A method that produces global precipitation estimates from passive microwave and infrared data at high spatial and temporal resolution. J. Hydrometeorol. 2004, 5, 487–503. [Google Scholar] [CrossRef]
- Sorooshian, S.; Hsu, K.L.; Gao, X.; Gupta, H.V.; Imam, B.; Braithwaite, D. Evaluation of PERSIANN system satellite-based estimates of tropical rainfall. Bull. Am. Meteorol. Soc. 2000, 81, 2035–2046. [Google Scholar] [CrossRef]
- Dinku, T.; Ceccato, P.; Connor, S.J. Challenges of satellite rainfall estimation over mountainous and arid parts of East Africa. Int. J. Remote Sens. 2011, 32, 5965–5979. [Google Scholar] [CrossRef]
- Adler, R.F.; Huffman, G.J.; Chang, A.; Ferraro, R.; Xie, P.; Janowiak, J.; Arkin, P. The version 2 global precipitation climatology project (GPCP) monthly precipitation analysis. J. Hydrometeorol. 2003, 4, 1147–1167. [Google Scholar] [CrossRef]
- Feidas, H.; Lagouvardos, K.; Kotroni, V.; Cartalis, C. Application of three satellite techniques in support of precipitation forecasts of a NWP model. Int. J. Remote Sens. 2005, 26, 5393–5417. [Google Scholar] [CrossRef]
- Dinku, T.; Ceccato, P.; Grover-Kopec, E.; Lemma, M.; Connor, S.J.; Ropelewski, C.F. Validation of satellite rainfall products over East Africa’s complex topography. Int. J. Remote Sens. 2007, 28, 1503–1526. [Google Scholar] [CrossRef]
- Adeyewa, Z.D.; Nakamura, K. Validation of TRMM radar rainfall data over major climatic regions in Africa. J. Appl. Meteorol. 2003, 42, 331–347. [Google Scholar] [CrossRef]
- Duan, Z.; Liu, J.Z.; Tuo, Y.; Chiogna, G.; Disse, M. Evaluation of eight high spatial resolution gridded precipitation products in Adige Basin (Italy) at multiple temporal and spatial scales. Sci. Total Environ. 2016, 573, 1536–1553. [Google Scholar] [CrossRef] [PubMed]
- Maggioni, V.; Sapiano, M.R.P.; Adler, R.F. Estimating uncertainties in high-resolution satellite precipitation products: Systematic or random error? J. Hydrometeorol. 2016, 17, 1119–1129. [Google Scholar] [CrossRef]
- Diem, J.E.; Hartter, J.; Ryan, S.J.; Palace, M.W. Validation of satellite rainfall products for Western Uganda. J. Hydrometeorol. 2014, 15, 2030–2038. [Google Scholar] [CrossRef]
- Mashingia, F.; Mtalo, F.; Bruen, M. Validation of remotely sensed rainfall over major climatic regions in Northeast Tanzania. Phys. Chem. Earth 2014, 67–69, 55–63. [Google Scholar] [CrossRef]
- Cattani, E.; Merino, A.; Levizzani, V. Evaluation of monthly satellite-derived precipitation products over East Africa. J. Hydrometeorol. 2016, 17, 2555–2573. [Google Scholar] [CrossRef]
- Thiemig, V.; Rojas, R.; Zambrano-Bigiarini, M.; Levizzani, V.; de Roo, A. Validation of satellite-based precipitation products over sparsely gauged African river basins. J. Hydrometeorol. 2012, 13, 1760–1783. [Google Scholar] [CrossRef]
- Hirpa, F.A.; Gebremichael, M.; Hopson, T. Evaluation of high-resolution satellite precipitation products over very complex terrain in Ethiopia. J. Appl. Meteorol. Climatol. 2010, 49, 1044–1051. [Google Scholar] [CrossRef]
- Asadullah, A.; McIntyre, N.; Kigobe, M. Evaluation of five satellite products for estimation of rainfall over Uganda. Hydrol. Sci. J. 2008, 53, 1137–1150. [Google Scholar] [CrossRef]
- Maidment, R.I.; Grimes, D.I.F.; Allan, R.P.; Greatrex, H.; Rojas, O.; Leo, O. Evaluation of satellite-based and model re-analysis rainfall estimates for Uganda. Meteorol. Appl. 2013, 20, 308–317. [Google Scholar] [CrossRef]
- Funk, C.C.; Peterson, P.J.; Landsfeld, M.F.; Pedreros, D.H.; Verdin, J.P.; Rowland, J.D.; Romero, B.E.; Husak, G.J.; Michaelsen, J.C.; Verdin, A.P. A Quasi-Global Precipitation Time Series for Drought Monitoring; U.S. Geological Survey Data Series 832; US Geological Survey: Reston, VA, USA, 2014; 4p. [Google Scholar]
- Funk, C.; Verdin, A.; Michaelsen, J.; Peterson, P.; Pedreros, D.; Husak, G. A global satellite-assisted precipitation climatology. Earth System Science Data 2015, 7, 275–287. [Google Scholar] [CrossRef]
- The Intergovernmental Authority on Development (IGAD) Climate Prediction and Applications Centre (ICPAC). Available online: http://www.Icpac.Net/ (accessed on 11 June 2015).
- Schneider, T.; Bischoff, T.; Haug, G.H. Migrations and dynamics of the intertropical convergence zone. Nature 2014, 513, 45–53. [Google Scholar] [CrossRef] [PubMed]
- Nicholson, S. The turkana low-level jet: Mean climatology and association with regional aridity. Int. J. Climatol. 2016, 36, 2598–2614. [Google Scholar] [CrossRef]
- Geoclim. Available online: http://chg-wiki.Geog.Ucsb.Edu/wiki/geoclim (accessed on 11 June 2015).
- Zhang, J.; Qi, Y.C.; Langston, C.; Kaney, B.; Howard, K. A real-time algorithm for merging radar QPES with rain gauge observations and orographic precipitation climatology. J. Hydrometeorol. 2014, 15, 1794–1809. [Google Scholar] [CrossRef]
- Maidment, R.I.; Grimes, D.; Allan, R.P.; Tarnavsky, E.; Stringer, M.; Hewison, T.; Roebeling, R.; Black, E. The 30 year TAMSAT African rainfall climatology and time series (TARCAT) data set. J. Geophys. Res. Atmos. 2014, 119, 10619–10644. [Google Scholar] [CrossRef]
- Tarnavsky, E.; Grimes, D.; Maidment, R.; Black, E.; Allan, R.P.; Stringer, M.; Chadwick, R.; Kayitakire, F. Extension of the TAMSAT satellite-based rainfall monitoring over Africa and from 1983 to present. J. Appl. Meteorol. Climatol. 2014, 53, 2805–2822. [Google Scholar] [CrossRef]
- Tote, C.; Patricio, D.; Boogaard, H.; van der Wijngaart, R.; Tarnavsky, E.; Funk, C. Evaluation of satellite rainfall estimates for drought and flood monitoring in Mozambique. Remote Sens. 2015, 7, 1758–1776. [Google Scholar] [CrossRef]
- Huffman, G.J.; Adler, R.F.; Bolvin, D.T.; Gu, G.J.; Nelkin, E.J.; Bowman, K.P.; Hong, Y.; Stocker, E.F.; Wolff, D.B. The trmm multisatellite precipitation analysis (TMPA): Quasi-global, multiyear, combined-sensor precipitation estimates at fine scales. J. Hydrometeorol. 2007, 8, 38–55. [Google Scholar] [CrossRef]
- Ashouri, H.; Hsu, K.L.; Sorooshian, S.; Braithwaite, D.K.; Knapp, K.R.; Cecil, L.D.; Nelson, B.R.; Prat, O.P. PERSIANN-CDR daily precipitation climate data record from multisatellite observations for hydrological and climate studies. Bull. Am. Meteorol. Soc. 2015, 96, 69–83. [Google Scholar] [CrossRef]
- Xie, P.; Arkin, P.A. Global monthly precipitation estimates from satellite-observed outgoing longwave radiation. J. Clim. 1997, 11, 137–164. [Google Scholar] [CrossRef]
- Nijssen, B.; O’Donnell, G.M.; Lettenmaier, D.P.; Lohmann, D.; Wood, E.F. Predicting the discharge of global rivers. J. Clim. 2001, 14, 3307–3323. [Google Scholar] [CrossRef]
- Suwendi, A.; Allebach, J.P. Nearest-neighbor and bilinear resampling factor estimation to detect blockiness or blurriness of an image. J. Electron. Imaging 2008, 17, 023005. [Google Scholar]
- Taylor, K.E. Summarizing multiple aspects of model performance in a single diagram. J. Geophys. Res. Atmos. 2001, 106, 7183–7192. [Google Scholar] [CrossRef]
- Gupta, H.V.; Kling, H.; Yilmaz, K.K.; Martinez, G.F. Decomposition of the mean squared error and NSE performance criteria: Implications for improving hydrological modelling. J. Hydrol. 2009, 377, 80–91. [Google Scholar] [CrossRef]
- Funk, C.; Hoell, A.; Shukla, S.; Blade, I.; Liebmann, B.; Roberts, J.B.; Robertson, F.R.; Husak, G. Predicting East African spring droughts using pacific and Indian ocean sea surface temperature indices. Hydrol. Earth Syst. Sci. 2014, 18, 4965–4978. [Google Scholar] [CrossRef]
- Li, R.; Fu, Y.F. Tropical precipitation estimated by GPCP and TRMM PR observations. Adv. Atmos. Sci. 2005, 22, 852–864. [Google Scholar]
- Miao, C.Y.; Ashouri, H.; Hsu, K.L.; Sorooshian, S.; Duan, Q.Y. Evaluation of the PERSIANN-CDR daily rainfall estimates in capturing the behavior of extreme precipitation events over China. J. Hydrometeorol. 2015, 16, 1387–1396. [Google Scholar] [CrossRef]
- Gamoyo, M.; Reason, C.; Obura, D. Rainfall variability over the East African coast. Theor. Appl. Climatol. 2015, 120, 311–322. [Google Scholar] [CrossRef]
- Gebremichael, M.; Krajewski, W.F.; Morrissey, M.; Langerud, D.; Huffman, G.J.; Adler, R. Error uncertainty analysis of GPCP monthly rainfall products: A data-based simulation study. J. Appl. Meteorol. 2003, 42, 1837–1848. [Google Scholar] [CrossRef]
- Bharti, V.; Singh, C. Evaluation of error in TRMM 3B42V7 precipitation estimates over the Himalayan region. J. Geophys. Res. Atmos. 2015, 120, 12458–12473. [Google Scholar] [CrossRef]
© 2017 by the authors. Licensee MDPI, Basel, Switzerland. This article is an open access article distributed under the terms and conditions of the Creative Commons Attribution (CC BY) license (http://creativecommons.org/licenses/by/4.0/).