Irrigation-Induced Environmental Changes around the Aral Sea: An Integrated View from Multiple Satellite Observations


1
Jackson School of Geosciences, The University of Texas at Austin, Austin, TX 78712, USA
2
Now at Center for Global Change Science, Massachusetts Institute of Technology, Cambridge, MA 02139, USA
3
Now at Collaborative Innovation Center on Forecast and Evaluation of Meteorological Disasters/Key Laboratory of Meteorological Disaster, Ministry of Education/International Joint Research Laboratory on Climate and Environment Change, Nanjing University of Information Science and Technology, Nanjing 210044, China
4
CAS Key Laboratory of Regional Climate-Environment Research for Temperate East Asia, Institute of Atmospheric Physics, Chinese Academy of Sciences, Beijing 100029, China
*
Author to whom correspondence should be addressed.
Remote Sens. 2017, 9(9), 900; https://doi.org/10.3390/rs9090900
Submission received: 15 August 2017
/
Revised: 26 August 2017
/
Accepted: 29 August 2017
/
Published: 31 August 2017
(This article belongs to the Special Issue Remote Sensing of Land-Atmosphere Interactions)
Abstract
:The Aral Sea basin (ASB) is one of the most environmentally vulnerable regions to climate change and human activities. During the past 60 years, irrigation has greatly changed the water distribution and caused severe environmental issues in the ASB. Using remote sensing data, this study investigated the environmental changes induced by irrigation activities in this region. The results show that, in the past decade, land water storage has significantly increased in the irrigated upstream regions (13 km3 year−1) but decreased in the downstream regions (−27 km3 year−1) of the Amu Darya River basin, causing a water storage decrease in the whole basin (−20 km3 year−1). As a result, the water surface area of the Aral Sea has decreased from 32,000 in 2000 to 10,000 km2 in 2015. The shrinking Aral Sea exposed a large portion of the lake bottom to the air, increasing (decreasing) the daytime (nighttime) temperatures by about 1 °C year−1 (0.5 °C year−1). Moreover, there were other potential environmental changes, including drier soil, less vegetation, decreasing cloud and precipitation, and more severe and frequent dust storms. Possible biases in the remote sensing data due to the neglect of the shrinking water surface area of the Aral Sea were identified. These findings highlight the severe environmental threats caused by irrigation in Central Asia and call attention to sustainable water use in such dryland regions.

1. Introduction
Human activities influence the natural environment on both global and regional scales. This influence has the greatest potential to cause severe natural resource degradation and food security issues in environmentally vulnerable regions, such as drylands [1]. Characterized by a lack of water, drylands ecosystems are mainly supported by irrigation, therefore are highly sensitive and fragile to human activities, climate changes, and their interactions [2]. Due to the rapid growth of population and climate change, rain-fed agriculture meets a new challenge to increase the world’s food production [3]. Consequently, irrigated agriculture field, particularly in drylands has been expanded dramatically during the past several decades [4]. The intense irrigation activities result in a number of unexpected environmental issues, such as droughts, desertification, dust storms, and salinization of soil [5]. Moreover, the predicted accelerating expansion of dryland under climate change is likely to drive more irrigation activities and aggravate the irrigation-induced environmental issues [6].
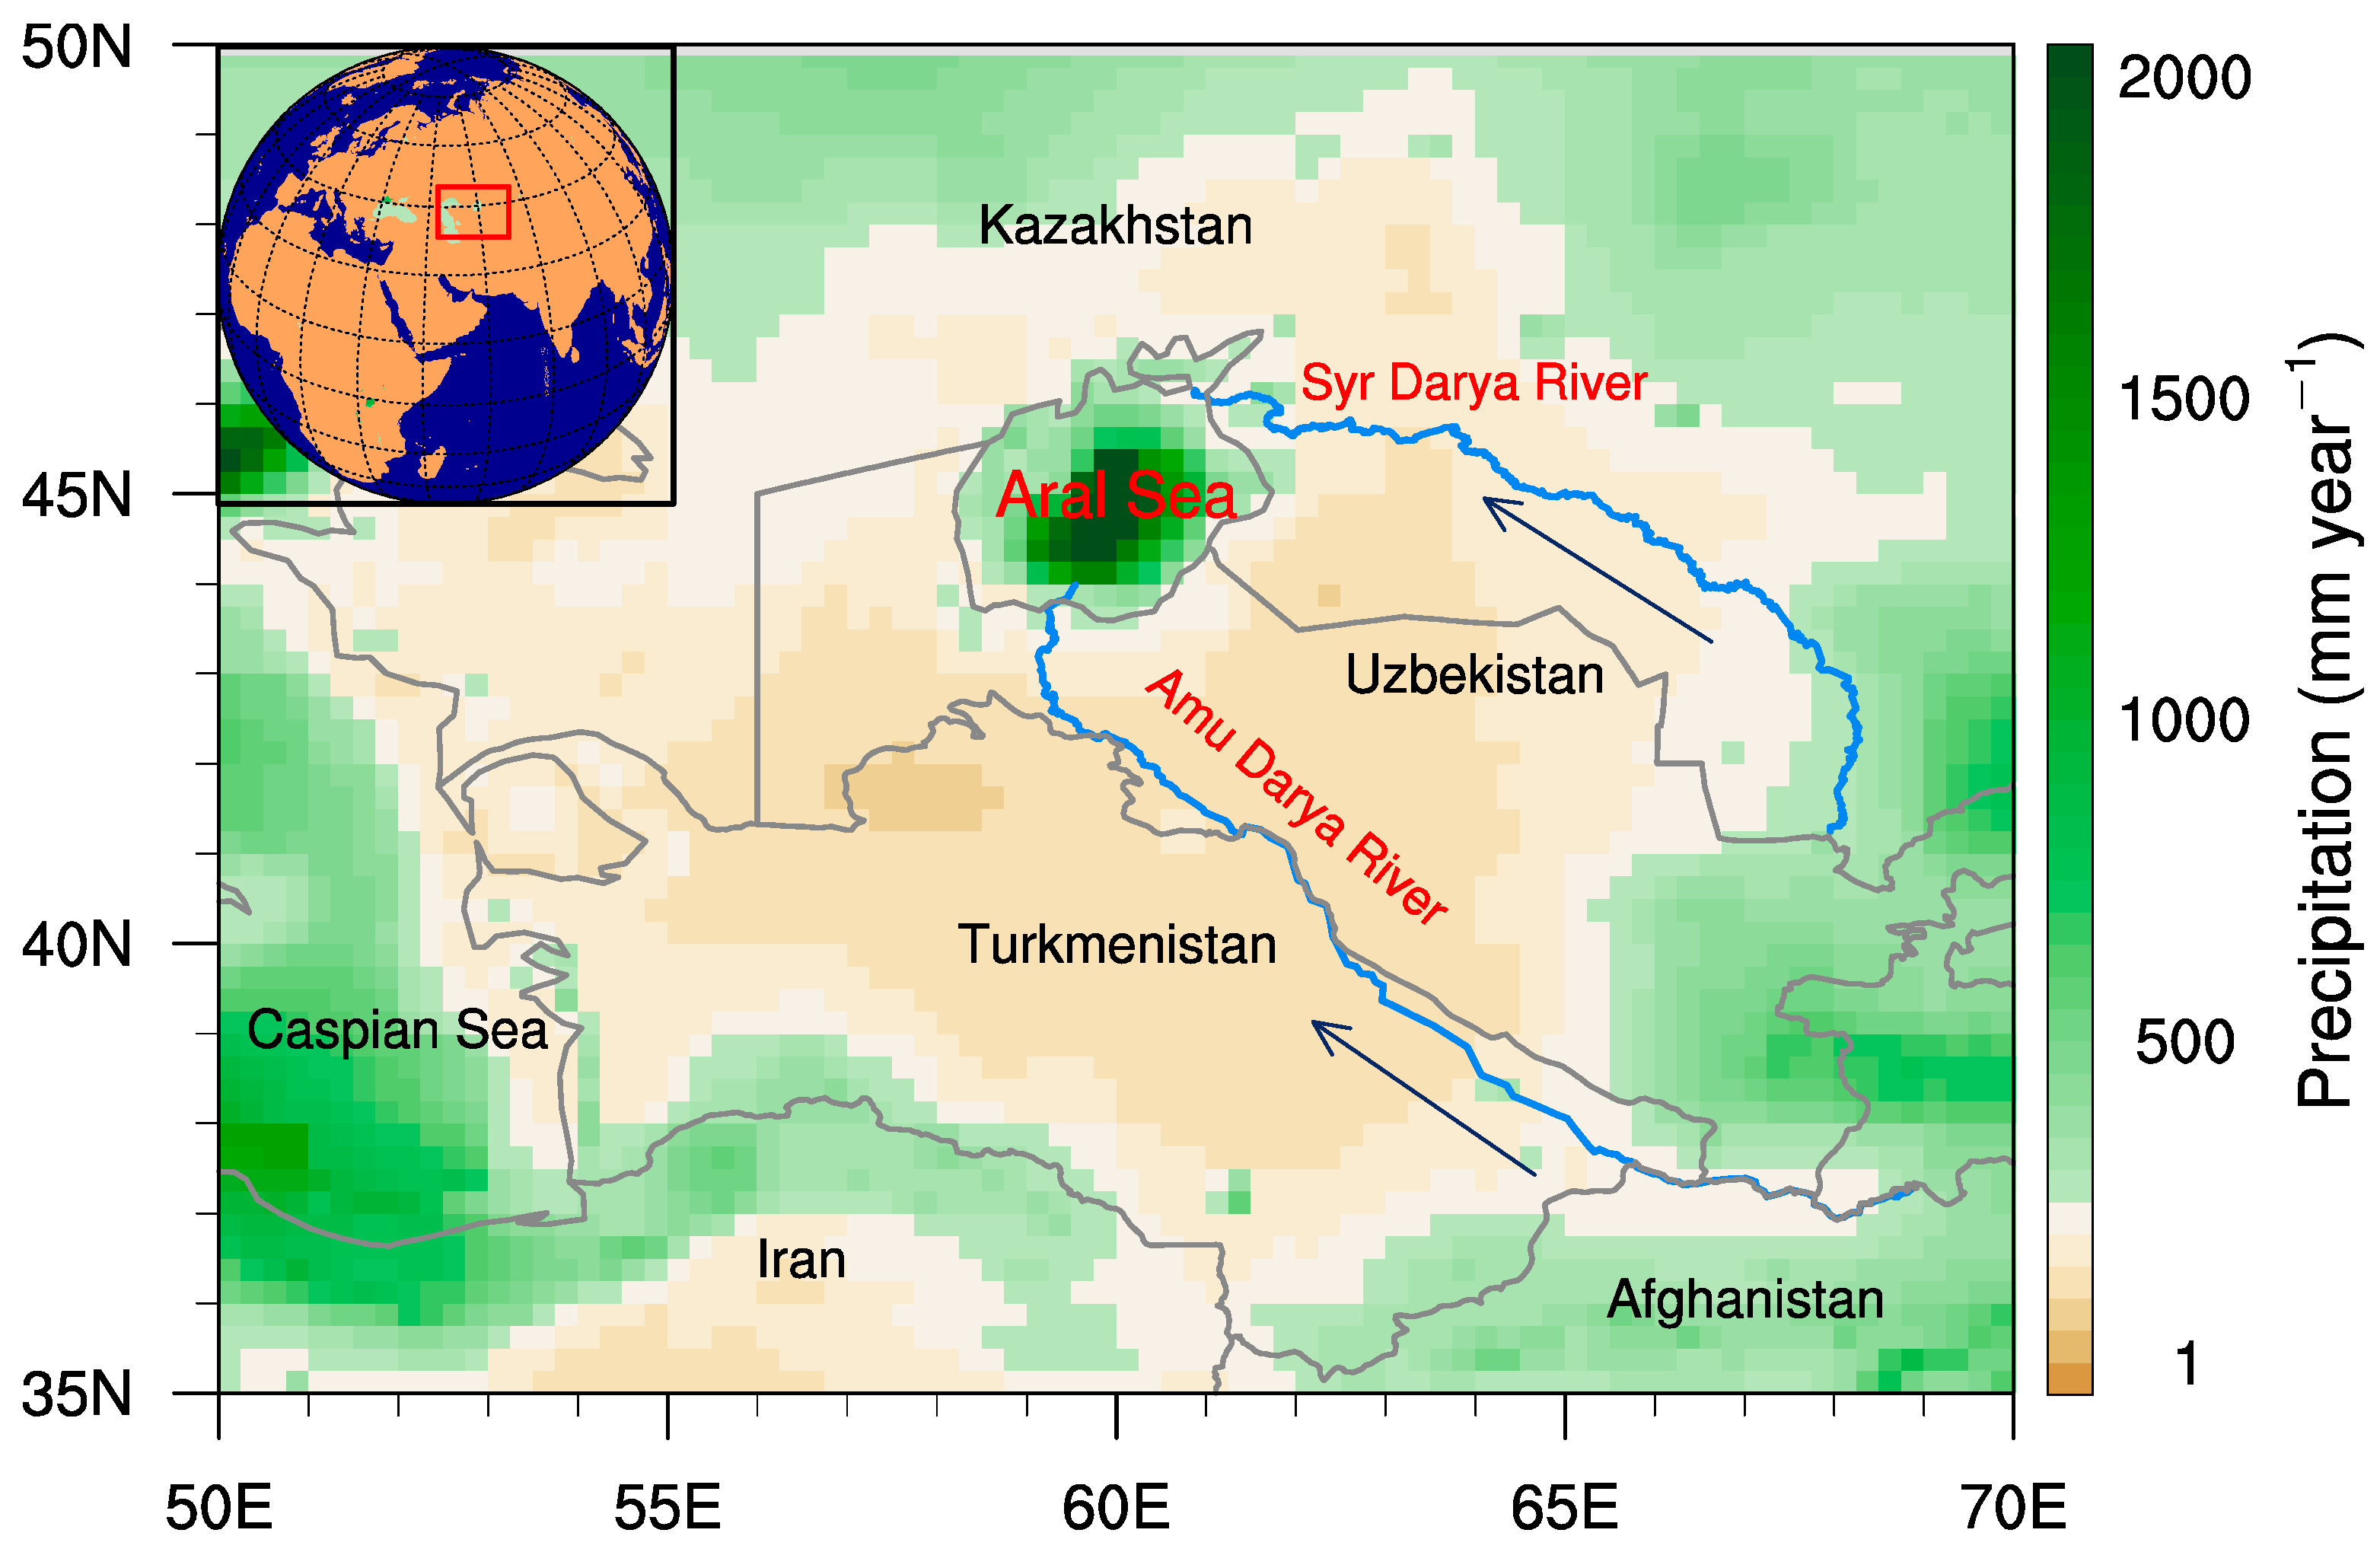
The Aral Sea basin (ASB) (Figure 1) is covered by a large area of drylands, which have been greatly changed to irrigated agriculture land since the 1960s. The ASB accounts for 80–90% of the world’s temperate deserts [7]. The southern part of the ASB has annual precipitation less than 250 mm (Figure 1). Therefore, until 1960, the main agriculture land was rain-fed. In the 1950s, the former Soviet Union created a number of large irrigation systems, diverting water from the Amu Darya River and the Syr Darya River into deserts to promote agriculture production, especially that of cotton [8]. Consequently, the irrigated area expanded, respectively, by 150% and 130% from 1970 to 1989 in the Amu Darya and the Syr Darya river basins [9]; these irrigated areas were still expanding in recent decades [10].
The long-lasting and intense irrigation activities in the ASB caused severe ecological and socioeconomic issues. The runoff of the Amu Darya and the Syr Darya decreased by about 90% largely due to irrigation activities from 1960 to 2010 [10]. The dramatic decrease in runoff resulted in an environmental disaster—the desertification of the Aral Sea [5]. The Aral Sea is an inland lake and fed by the Amu Darya and Syr Darya, which used to be the world’s fourth largest saline lake in 1960. However, due to irrigation activities, its surface area decreased from 68,000 to 11,000 km2, volume decreased from 1093 to 73 km3, and salinity increased from 10 to around 130 g L−1 during 1960 to 2015 [10].
The desertification of the Aral Sea caused loose sand particles to accumulate on the lake bed and expose to the air and favors dust storms. These dust storms not only degraded air quality, visibility, and human health, but also resulted in the salinization of soil when sand particles deposit onto land in the downwind areas because of the high content of salt [8]. The decreasing water storage in the Aral Sea and consequent increasing salinity caused loss of fishery and endanger wild animals [11].
Given the widespread impacts of irrigation activities in the ASB, isolated and sparse surface station observations can hardly monitor the irrigation-induced environmental changes. On the other hand, satellites provide long-term (i.e., decadal) and continuous observations of the atmosphere and land on the global scale, which can be used to analyze the long-term trends of irrigation-induced environmental changes in the ASB. This is particularly true after year 2000, when the launch of GRACE (Gravity Recovery and Climate Experiment) and MODIS (MODerate resolution Imaging Spectroradiometers) made it possible to investigate the changes in land water, land use, and dust storms [12]. Most of previous studies addressed the changes in water storage or water surface area of the Aral Sea using limited surface observations (e.g., [10,13]) or investigated the hydrological and environmental changes separately using single satellite observations (e.g., [14,15,16,17]). This study quantified the long-term trends of hydrological changes of the Aral Sea based on multiple satellite observations and comprehensively analyzed the coupled spatial patterns among the human irrigation-induced hydrological, environmental, and climatic changes. Moreover, possible biases in satellite retrievals due to the neglect of the shrinking Aral Sea-induced surface albedo changes were also identified.
2. Data and Methods
2.1. MODIS NDVI
MODIS aboard the Terra and Aqua satellites measures Earth reflectance in 36 spectral bands between 0.405 and 14.385 μm wavelength, with a swath of about 2330 km wide. The wide swath enables MODIS cover the entire globe within one day. Based on the measured reflectance, many features of the atmosphere and Earth surface can be retrieved. MODIS products used in this study include: The Normalized Difference Vegetation Index (NDVI), Aerosol Optical Depth (AOD), and land surface temperature. NDVI was employed to differentiate water body from land surface as well as represent the vegetation status. In this study, MODIS collection 6 NDVI data at the spatial resolution of 250 m (MOD13Q1) and 0.05° (MOD13C2) were used. The threshold of NDVI for distinguishing between land and water varies from −0.18 to 0.0 [16], which was determined by two peaks in the histogram of NDVI over the Aral Sea and its surrounding land area. The grid points with NDVI less than the threshold were considered as “inland water bodies” and taken into the calculation of the surface area of the Aral Sea. The surface area of the Aral Sea was calculated using the two thresholds to take into account the uncertainties (Figure 3b). Additionally, the surface area of the Aral Sea was only calculated in summer due to the contamination of NDVI from ice and snow during the other seasons. The data period was from 2000 to 2015.
2.2. MODIS AOD
AOD is widely used to represent aerosol concentrations. MODIS has two AOD datasets: MODIS-Terra (MOD04) since 2000 and MODIS-Aqua (MYD04) since 2002. Previous studies have shown that MODIS-Aqua performs better than MODIS-Terra in retrieving AOD over land because MODIS-Terra is older and has degraded more strongly than MODIS-Aqua [18,19]. MODIS AOD data have three spatial resolutions: 1° × 1° (L3), 10 × 10 km (L2), and 3 × 3 km (3K). Generally, the data with a higher spatial resolution are noisier than those with a lower resolution. Given the relatively small domain of interest in this study, AOD data with the resolution of 10 km were used as a compromise between resolution and noise. Recently, a new collection (C6) of MODIS AOD dataset is released, which has a larger global coverage and higher accuracy than C5, as a result of implementing dynamic surface reflectance, including changes in vegetation, and improved cloud screening scheme [20]. Based on the above facts, MODIS-Aqua AOD dataset of collection 6 with 10 km spatial resolution (MYD04-L2) was used in this study. The data were from 2003 to 2015.
2.3. MODIS Surface Temperature and Cloud
MODIS-Terra land surface temperature of collection 5 (MOD11C3) was employed. Both day and night temperatures were analyzed to get the diurnal features. The data period spanned from 2000 to 2015 at a spatial resolution of 0.05° × 0.05°. Cloud cover fraction is from the Clouds and the Earth's radiant Energy System (CERES) synoptic satellite product [21] (1° × 1°) during 2000 and 2015. It should be noted that the CERES cloud properties are partially determined by MODIS measurements.
2.4. GRACE
GRACE measures the variations in Earth’s gravity field [22], which can represent the changes in terrestrial water storage, ocean currents, and so on. Here the variation in GRACE liquid water equivalent thickness (LWET) was used to indicate the changes in surface and ground water due to irrigation activities. The GRACE data of version release-05 were retrieved based on the Mascon solutions from the Center for Space Research [23] spanning from 2002 to 2014 at a spatial resolution of 0.5° × 0.5°. Note that GRACE can only retrieve the anomaly of LWET instead of its absolute value.
2.5. Other Satellite Retrievals
The Tropical Rain-fall Measuring Mission (TRMM) (0.25° × 0.25°) monthly 3B43 (version 7) precipitation datasets were employed [24]. This product combines multiple independent satellite precipitation estimates and Global Precipitation Climatology Centre rain gauge analysis. The European Space Agency (ESA) Climate Change Initiative (CCI) soil moisture data were also used to characterize the soil status in the depth of 0.5 to 2.0 cm. The ESA CCI soil moisture data were retrieved based on active and passive microwave sensors [25,26]. In this study, monthly soil moisture of version 2.2 at a spatial resolution of 0.25° × 0.25° were employed during 2003–2014.
2.6. Statistical Method
The least squares linear trends were calculated and the significance of trends were evaluated using the two-tailed Student’s t-test. All the linear trends in Figures 2, 4, and 5 are calculated using annual mean values without considering the seasonal variations. One exception is the linear trends in Supplementary Figure 1, which used seasonal averaged values to show the seasonality of AOD trends. The NCAR (the National Center for Atmospheric Research) Command Language was used to calculate the linear trends and significance level as well as make all the plots.
3. Results
3.1. The Shrinking Aral Sea
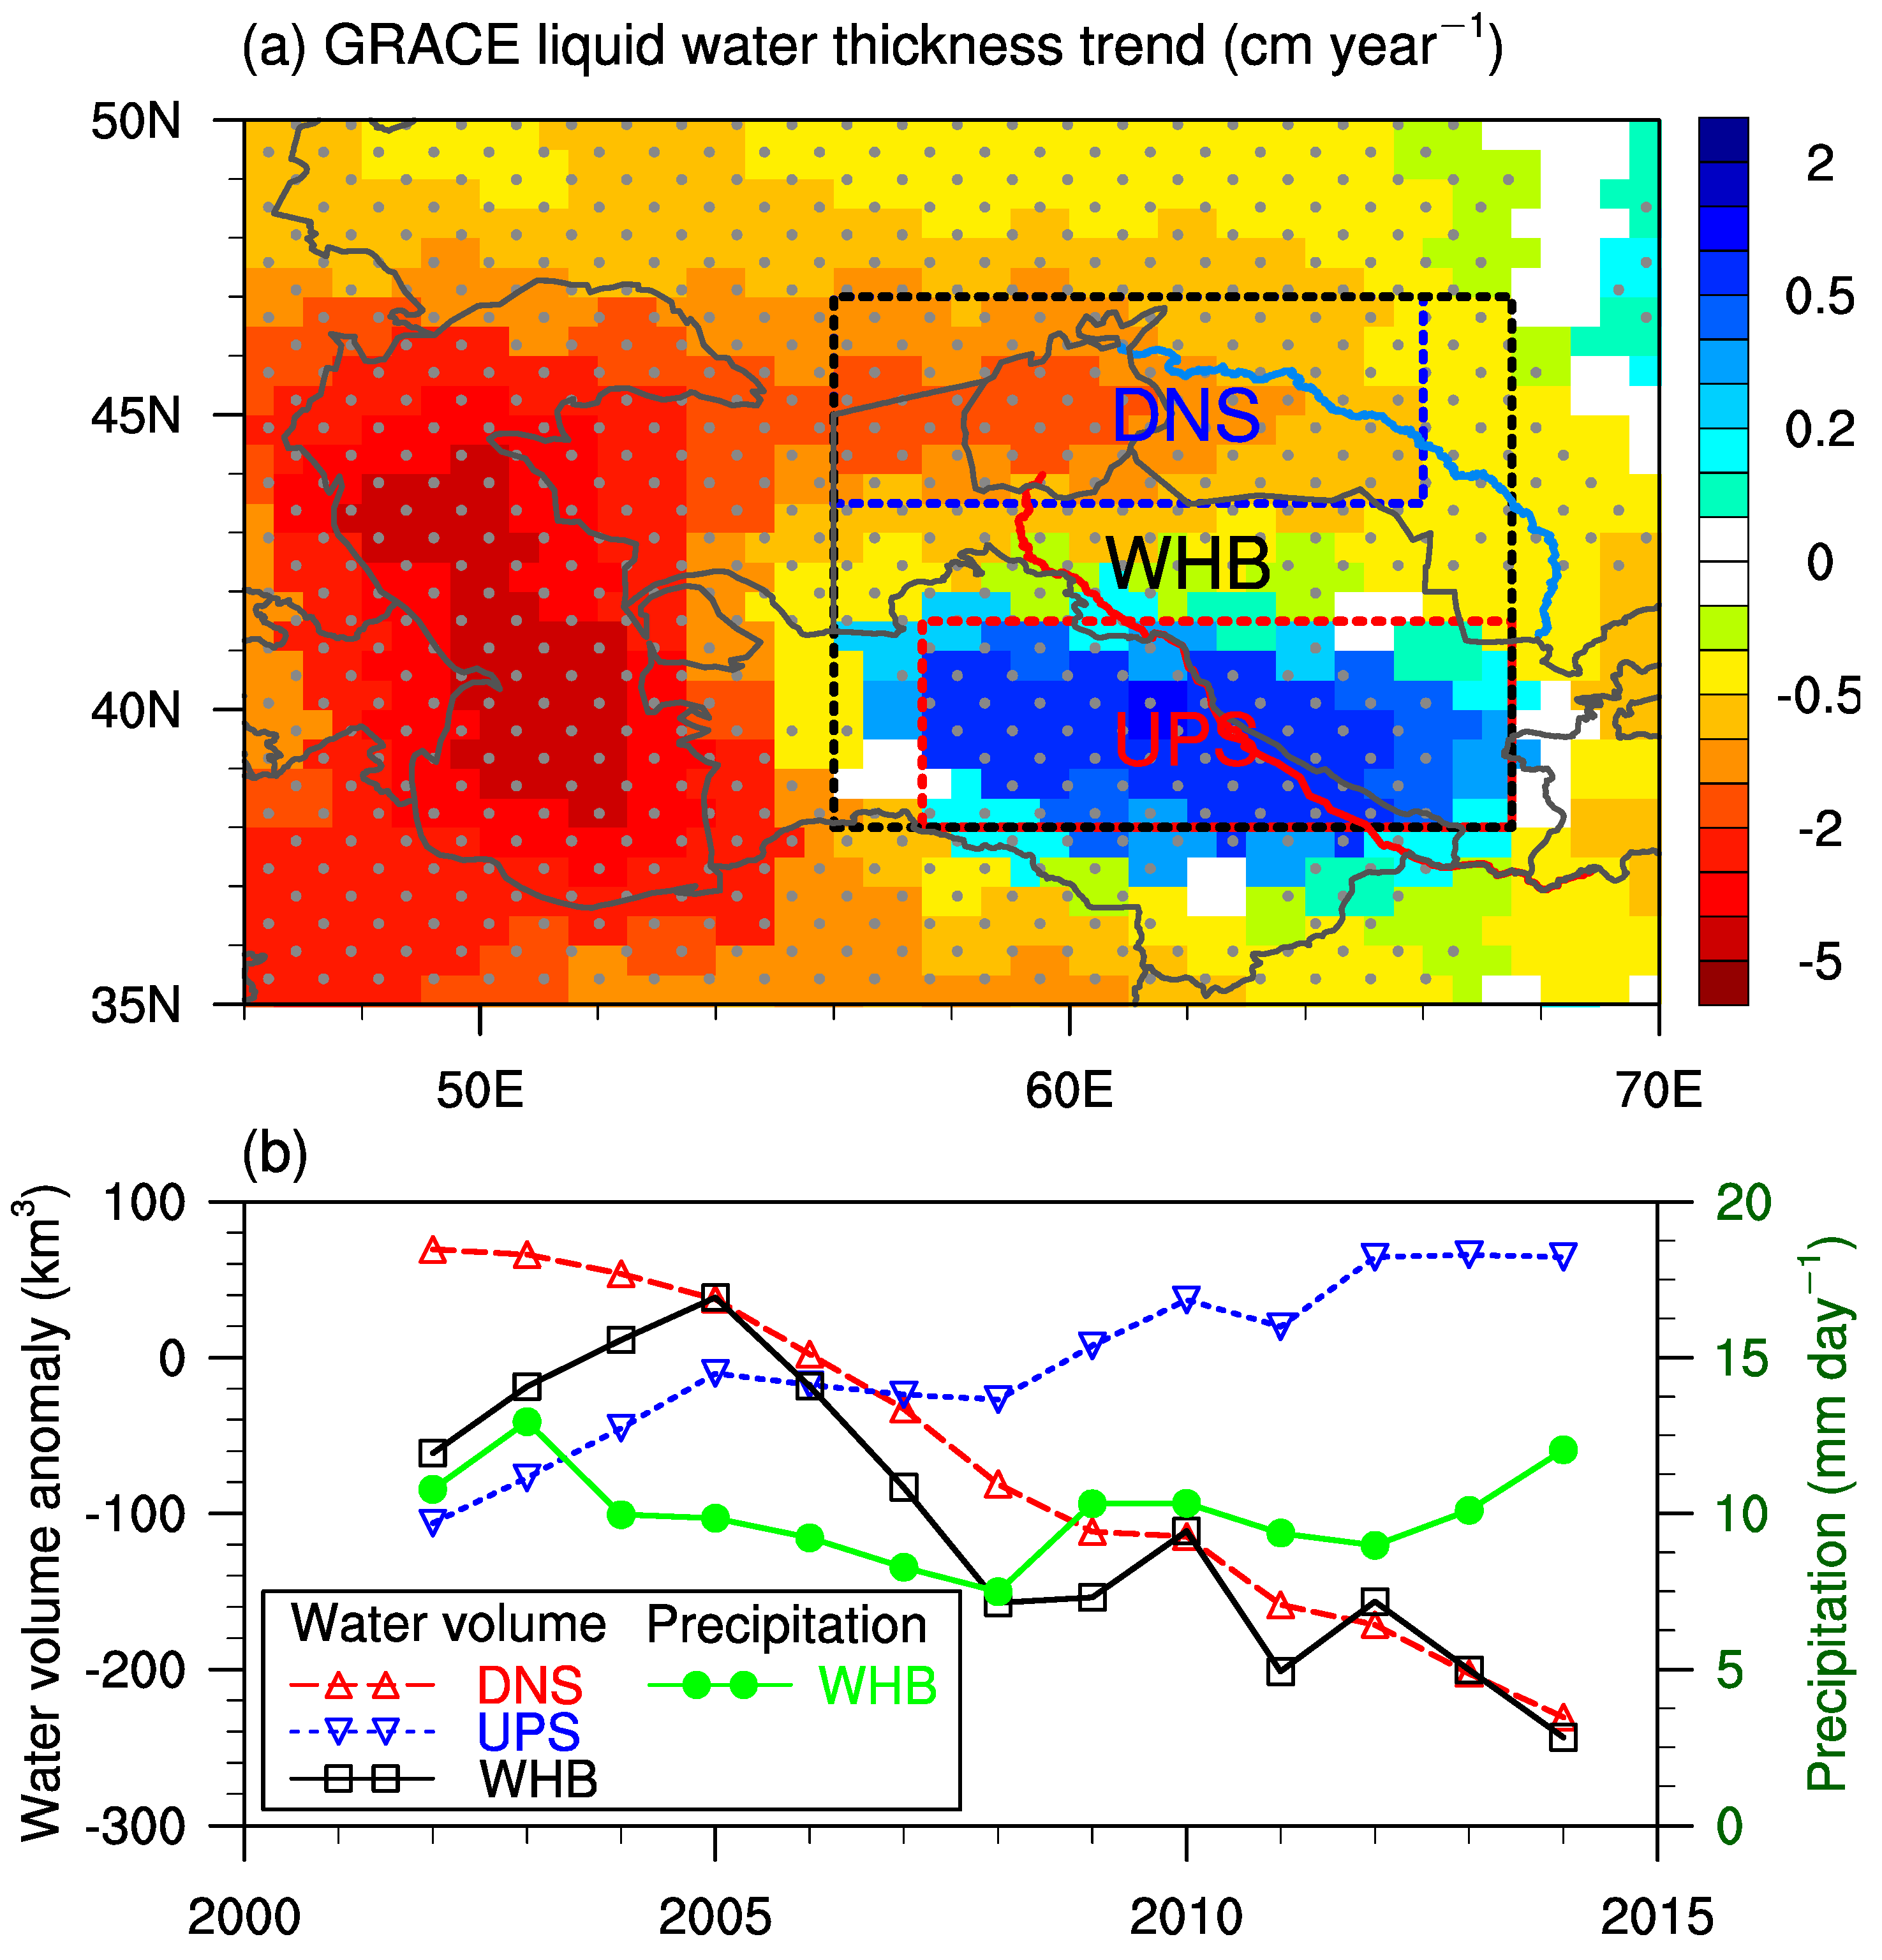
The hydrological impacts of irrigation on the redistribution of surface and ground water in the ASB were evaluated using GRACE data. Figure 2a shows the spatial patterns of the linear trends of LWET based on yearly GRACE data from 2003 to 2014. Decreasing trends of LWET were observed in most areas of the study domain except the upstream region of the Amu Darya River basin and a small area in the northeast of the domain. The significant increasing trends of LWET in the upstream of the Amu Darya River basin can be mainly attributed to diverting water from the Amu Darya River into cotton fields in northeast Turkmenistan and southeast Uzbekistan. On the contrary, decreasing trends of LWET were seen in downstream of the Amu Darya River, especially in the Aral Sea, which was largely attributed to a reduced inflow from its largest feeding river—the Amu Darya River [8].
Figure 2b shows the inter-annual variability of area-averaged water volume anomaly from GRACE and precipitation from TRMM over various regions. The water volume anomaly increased from −100 km3 to about 60 km3 in the upstream regions from 2002 to 2014, while, in the downstream region, it decreased monotonically from around 60 to −230 km3. In the whole region, the water volume anomaly displayed a large inter-annual variability, but overall it showed a significant decreasing trend. The decreasing trend in the whole region cannot be attributed to precipitation changes because precipitation did not display a significant trend in this region (green line in Figure 2b). Possible reasons for the decreasing water volume were the increasing evapotranspiration due to inefficient irrigation system in the upstream region [17] and decreasing snowfall fraction and retreating glaciers from the Tian Shan Mountains [27]. Wei and Dirmeyer [28] also showed that, in such a dry region, the irrigation caused water loss through evapotranspiration is usually much larger than irrigation caused precipitation increase, resulting in net water deficit in the region.
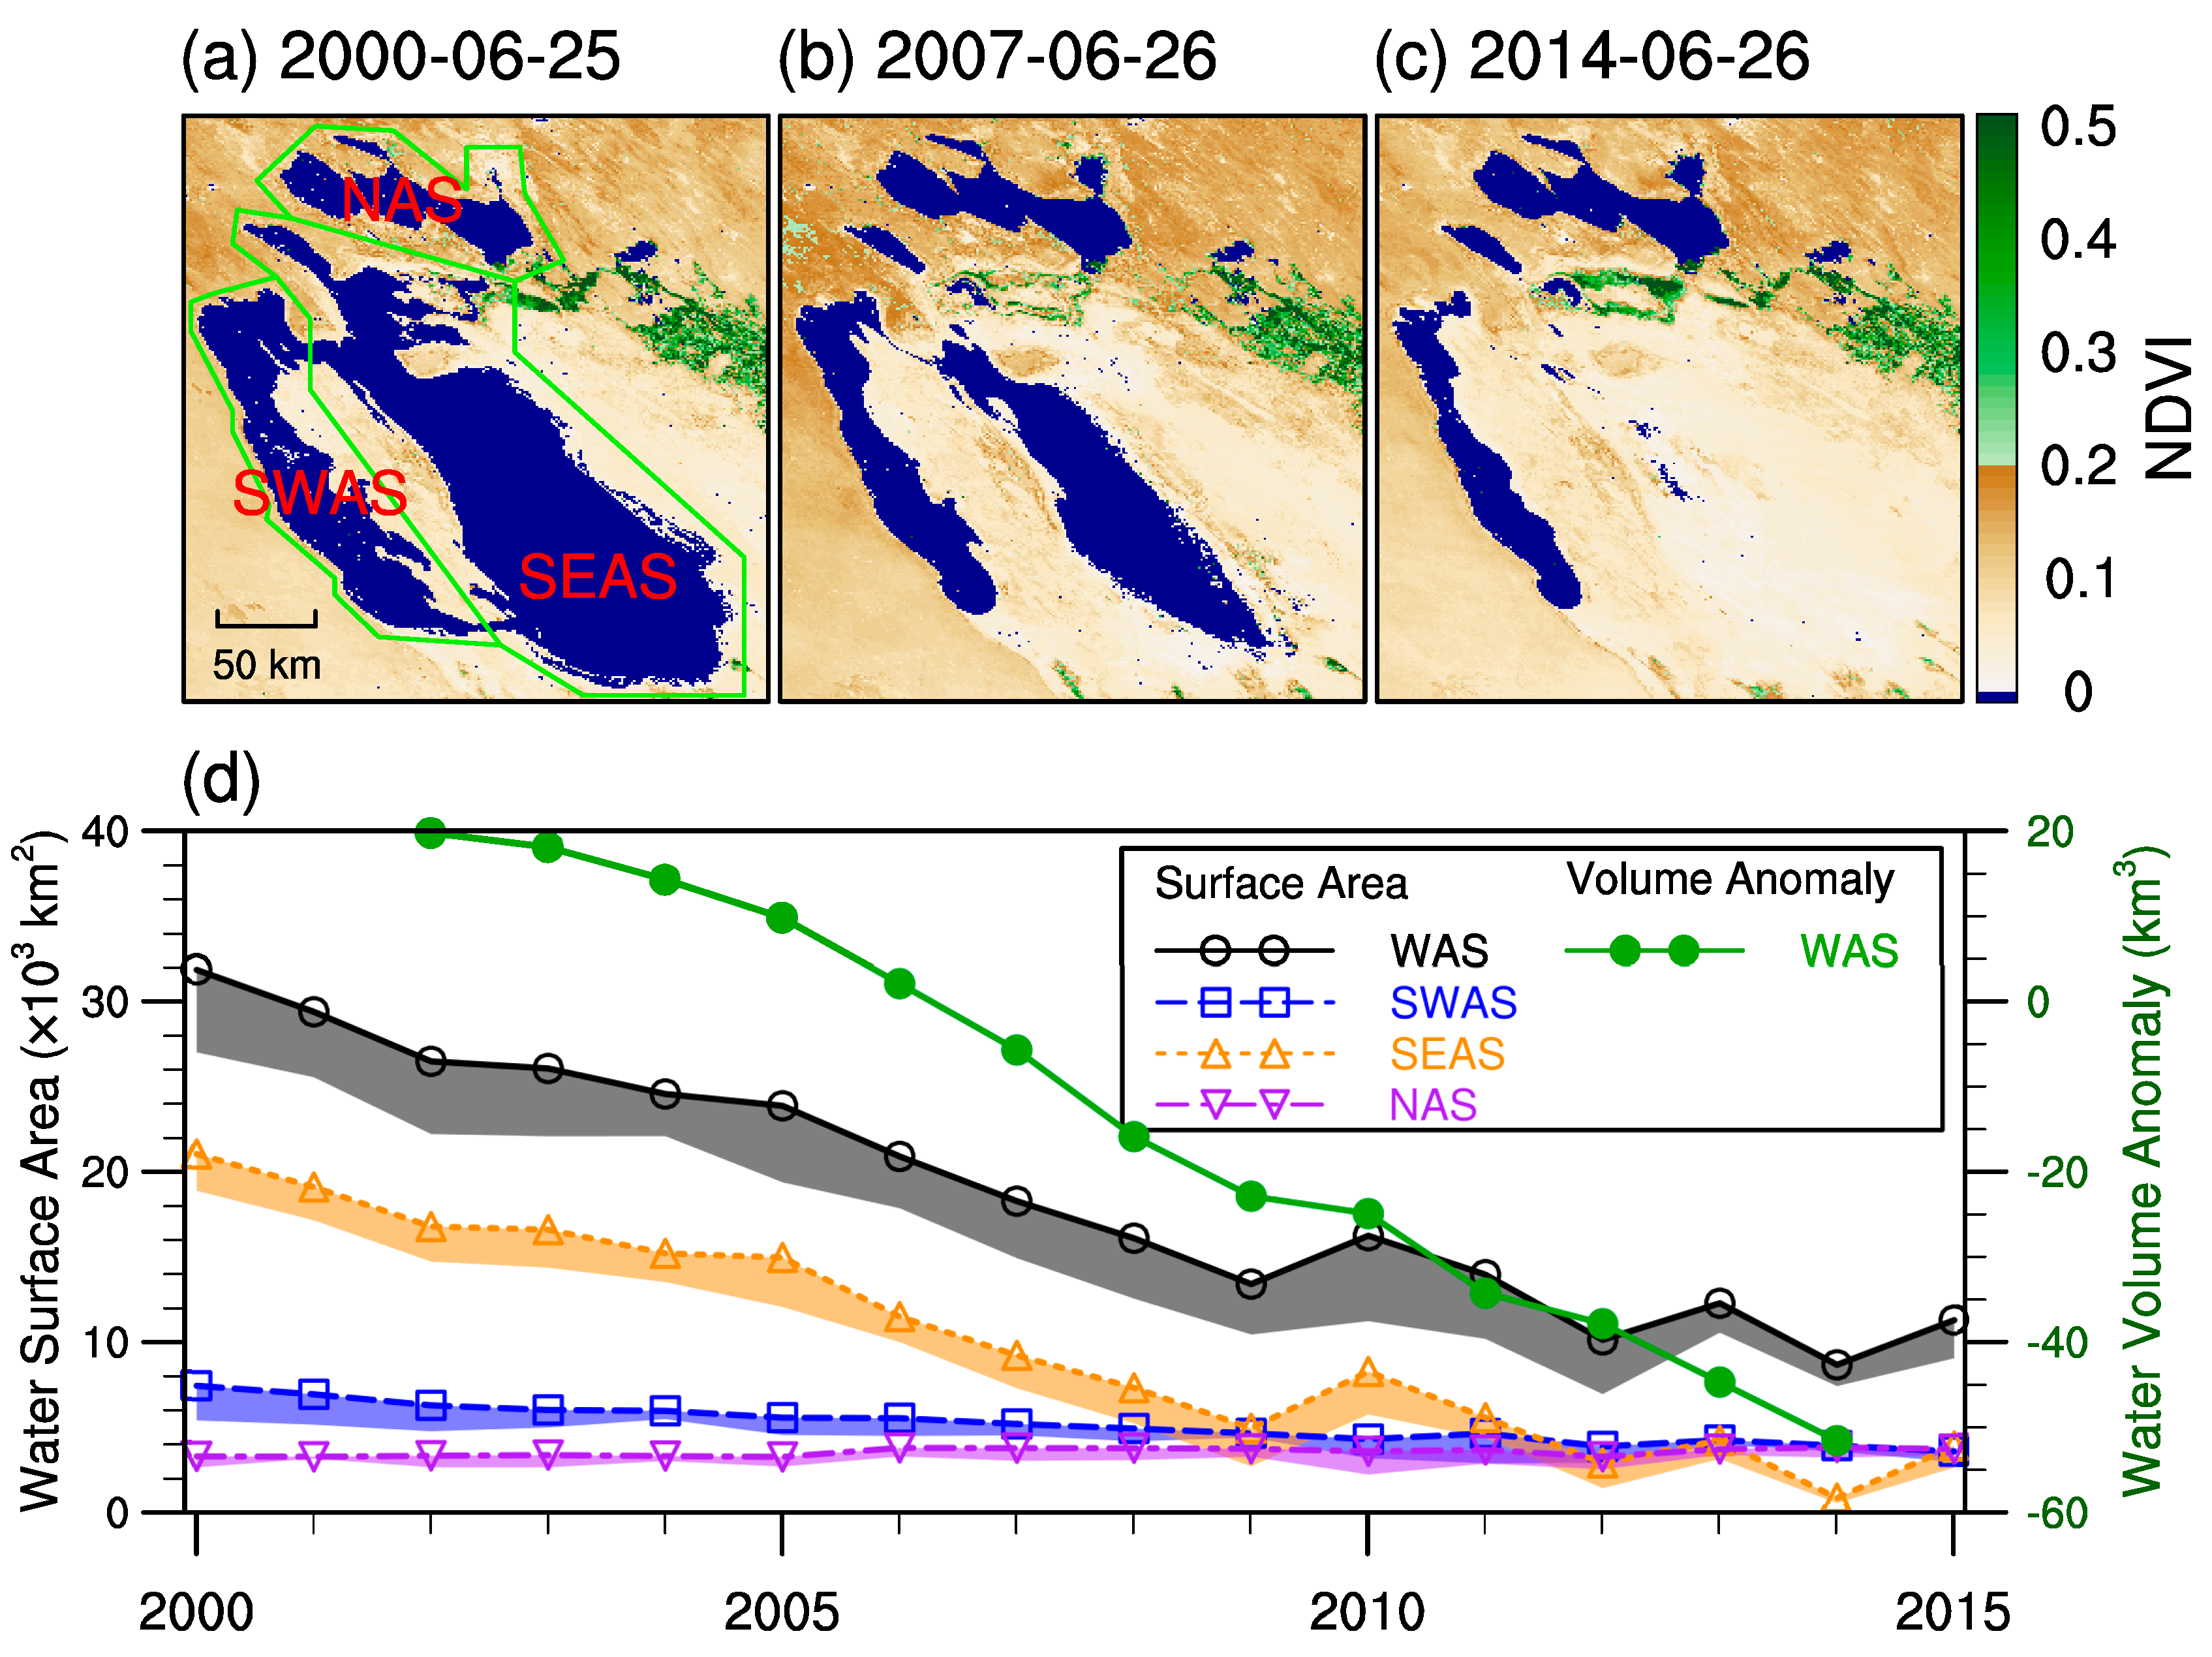
The most important consequence of irrigation activity in the upstream of the Amu Darya River was the shrinking of the Aral Sea. The Amu Darya River is the largest feeding river of the Aral Sea, contributing two thirds of annual inflow. Diverting water from the Amu Darya River for irrigation purpose had great impacts on the Aral Sea. Figure 3a–c illustrates the evolution of NDVI around the Aral Sea in summer from 2000 to 2015. The blue color indicates NDVI equal to or less than zero, representing inland water body. It is obvious that the Aral Sea surface has been shrinking during the past decade, especially the southeast part of the Aral Sea, which was almost dried up in the summer of 2014. The surface area of the whole Aral Sea in summer decreased from 32,000 in 2000 to 11,000 km2 in 2015, mainly attributed to the shrinking of SEAS. The surface of SWAS also showed a decreasing trend, but with a much smaller magnitude than that of SEAS because it was deeper than SEAS. The NAS showed an increase in surface area in 2006, and remained almost constant until 2015 because the Dike Kokaral dam (red star in Figure 4b), which was built in 2005, attempted to conserve diminishing water in the Syr Darya river and to revive the water storage and the damaged ecology in the NAS [29]. Unlike surface area with inter-annual fluctuations from 2009 to 2015, water volume anomaly kept decreasing in each year from 20 km3 to around −50 km3 during the 16-year period. This decreasing rate of water volume was much slower than that between 1960 and 1987 (decreasing from 1090 to 374 km3) [5]. The different inter-annual variabilities of water surface area and water volume anomaly of the Aral Sea (Figure 3d) could be attributed to: (1) different time scales—water surface area was observed on a specific day (either June 25th or 26th in each year); however, water volume anomaly was averaged during an entire year; (2) the nonlinear relationship between water surface area and water volume due to the topography of the lake; (3) the relatively coarse spatial resolution (0.5° × 0.5°) of GRACE data, because of which GRACE cannot distinguish water and land within such a small area.
3.2. LST Trend
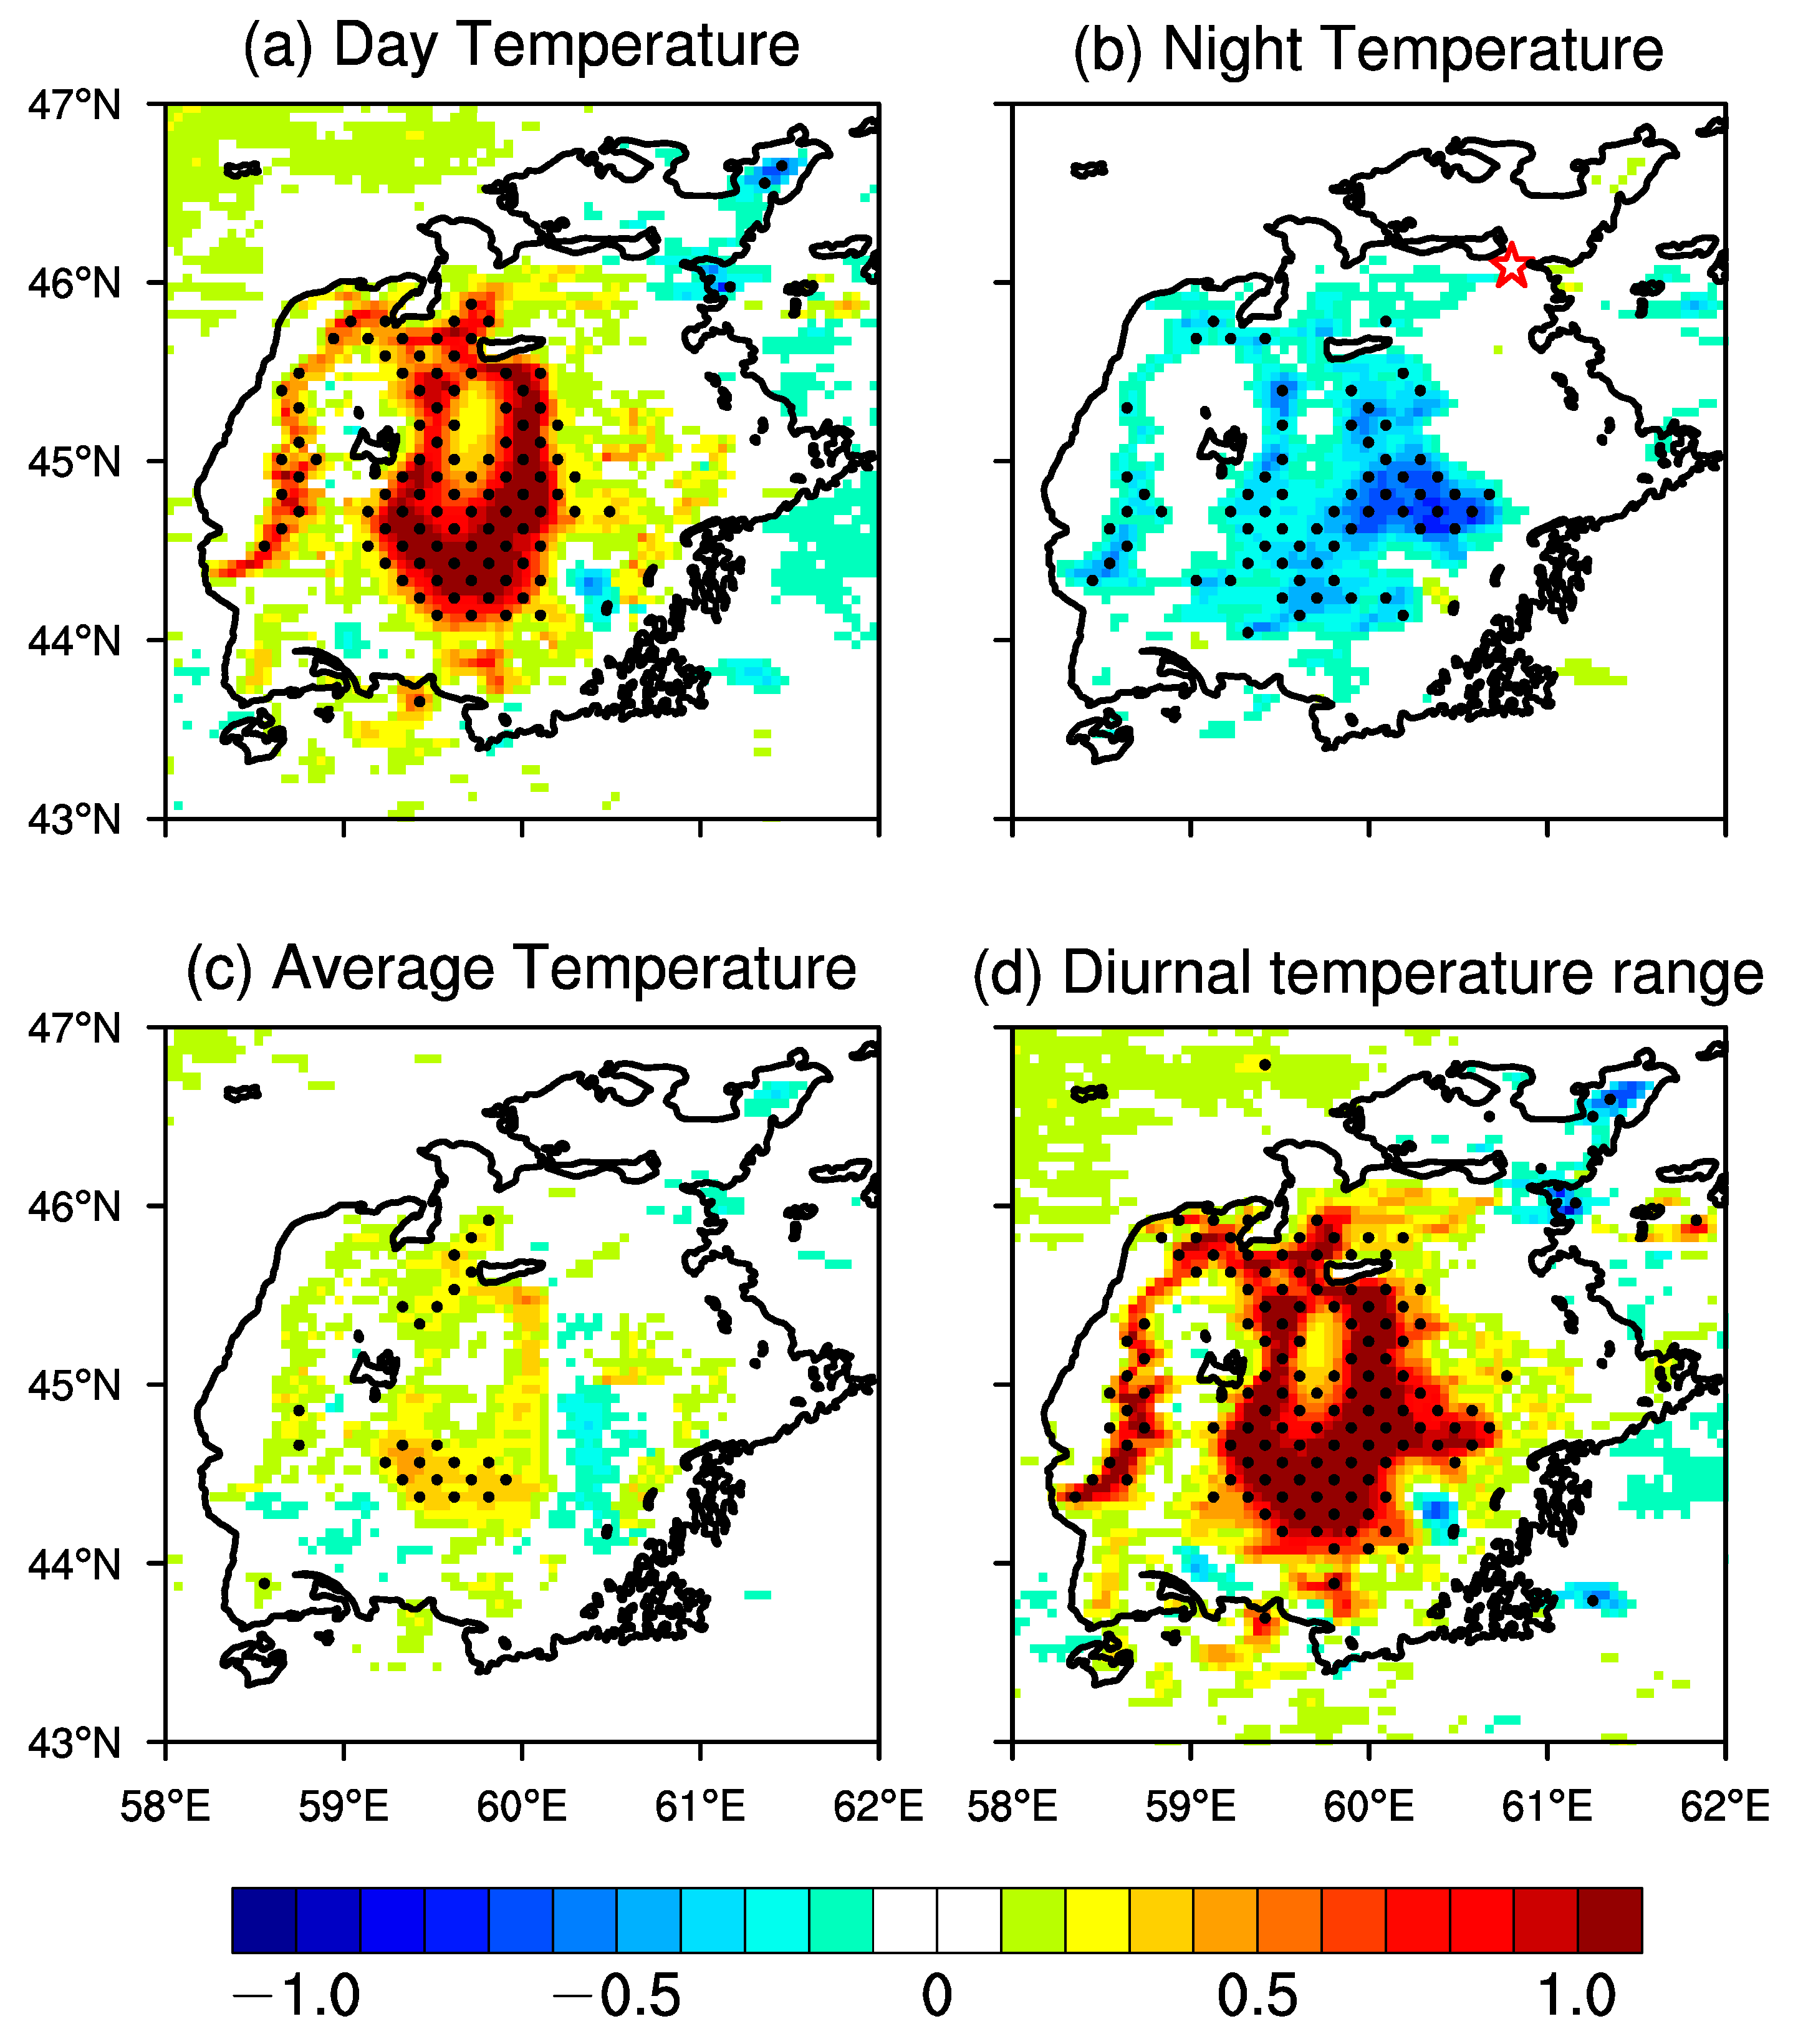
The irrigation-induced desertification of the Aral Sea has great impacts on LST. Figure 4 shows the linear trends of LST from 2003 to 2015. The daytime LST increased with a magnitude of about 1 °C year–1 (Figure 4a), which is consistent with previous studies [30]. The area with increasing LST in SEAS overlapped with the desertification area of the Aral Sea. The physical mechanism responsible for the increasing daytime LST is that land surface has a smaller heat capacity and less evaporative cooling than water body during the day. On the contrary, the nighttime LST displayed decreasing trends due to the smaller heat capacity of land than water, with a magnitude of about 0.5° year–1 (Figure 4b). The daily LST (i.e., arithmetic mean of daytime and nighttime LST) showed net increasing trends with a magnitude of 0.3° to 0.5° year–1 (Figure 4c). As a result, the diurnal temperature range (DTR; daytime minus nighttime LST) increased by more than 1 °C year–1 (Figure 4d). It is worth noting that the warming in the Aral Sea was not observed in its surrounding regions, indicating that greenhouse gases-induced climate change had little contribution to this warming in the Aral Sea. The increase in daytime LST can strengthen the vertical diffusion in the lower boundary layer, which benefits the vertical transport of particular matter, such as mineral dust particles as discussed in the following paragraph.
3.3. AOD Trend
One direct consequence of desertification of the Aral Sea is the formation of dust storms. Figure 5a demonstrates the linear trends of AOD from 2003 to 2015. Increasing trends of AOD were detected in most areas of the study domain. The largest magnitude of the increasing trends was over the Aral Sea with a value of 0.04 AOD year–1, followed by a trend of 0.03 AOD year in the areas between the Aral Sea and the Caspian Sea. The increasing AOD trends can be attributed to two factors: (1) the exposure of the loose sand at the bottom of the Aral Sea to the air can cause severe dust storms under strong wind conditions; and (2) the surface warming during the daytime tends to increase the instability of the planetary boundary layer, which in turn benefited the formation of dust storms and the vertical transport of dust particles. One interesting phenomenon in Figure 5a is that increasing AOD trends were mainly in the downstream of the Amu Darya River basin and no significant AOD trend was found in the upstream region. This feature of the spatial pattern of AOD trends was very similar to the pattern of LWET trends in Figure 2a. One possible reason is that irrigation can result in the greening of the upstream region of the Amu Darya River basin (Figure 5d), which in turn prevents the dust emission. The AOD trends showed strong seasonal variations, as seen in Figure S1. The strongest AOD trends were observed in summer, followed by spring and fall, and the trends were weaker and less widespread in winter.
3.4. Other Climate Trends
Besides the changes in land cover, other changes in climate can also influence mineral dust emissions. Figure 5b–e shows the trends of precipitation, cloud area fraction, soil moisture, and NDVI from 2003 to 2015 except for soil moisture that spans 2002 to 2014. The precipitation displayed significant drying trends with magnitudes from 0.02 to 0.05 mm day−1 year−1 in most parts of the domain (Figure 5b). The spatial patterns of the decreasing precipitation trends were similar to AOD patterns, indicating that precipitation played an important role in modulating dust concentrations. Precipitation can prevent dust emissions by changing land surface properties (e.g., soil moisture and NDVI) and reduce dust concentrations by wet scavenging. The cloud area fraction showed consistent pattern of decreasing trends to the precipitation to the west and northwest of the Aral Sea but increasing trends in the Aral Sea (Figure 5c). It should be pointed out that the increasing trends of both precipitation and cloud area fraction over the Aral Sea in TRMM and CERES data were opposite to surface observed decreasing trends of precipitation [10] and clouds (Figure S2). One reason for the opposite trends is the possible biases in satellite retrievals due the neglect of the shrinking Aral Sea-induced surface albedo changes, which was fixed instead of using dynamic values in the retrieval methods of TRMM precipitation and CERES cloud fraction. If this is true, the decreasing cloud fraction should have some impact on the increasing daytime and decreasing nighttime temperature over the Aral Sea (Figure 4).
Figure 5d,e illustrates the trends of soil moisture and NDVI. Soil moisture decreased in most parts of the domain with a maximum magnitude of 5 × 10⁻³ m3 m−3 year−1 in the area between the Aral Sea and the Caspian Sea (Figure 5d). Similar to the pattern of soil moisture trends, NDVI showed decreasing trends from 2 × 10⁻³ to 5 × 10⁻³ NDVI year−1 (Figure 5e), but the significant area was smaller than that of soil moisture. One interesting phenomena is that the significant decreasing trends of precipitation collocated with the significant increasing trends of NDVI in a small area of 58.5°E–60°E and 42.5°N–43.5°N. The increasing NDVI in this area was dominated by very intense irrigation activities [14], therefore was not correlated with precipitation. The spatial patterns in Figure 5b–e showed very high similarities, indicating a strong coupled relationship among precipitation, clouds, soil moisture, and NDVI in the ASB, which together strengthened dust emissions.
4. Discussion
The Aral Sea crisis is a serious threaten to both environment and human lives in the ASB. The aforementioned studies mainly focused on the hydrological impacts of the shrinking Aral Sea. Here we highlight the associated climatic and environmental impacts, such as changes in surface temperature, precipitation, cloud, soil moisture, vegetation, and so on. One of the most critical environmental issue is the increasing sand storms in this region, which is characterized by satellite retrieved aerosol optical depth. The salts, sands, and dust originated from the Aralkum Desert contain poisoned pollutants due to excessive use of pesticides and fertilizers from farming [31] and heavy metals from weapon tests in the former Soviet Union [32,33]. Tons of these pollutants can be transported thousands of kilometers away from the Aralkum Desert and the surrounding regions in the ASB to Himalayan, the Antarctic continent, Greenland’s glaciers, Norway’s forests, and Byelorussia’s fields [11,34] and thus adversely influence the vegetation growth and health of human beings [35,36]. Therefore, in the future, it is important to monitor the dust and sand storm activities in the ASB using satellite retrievals, given the large spatial and frequent time coverage of satellite data. Moreover, high-resolution climate model simulation is another efficient way to study the genesis, transport, and deposition of dust and sand storms and to improve our understanding of their climatic impacts [37,38,39,40]. It is worth mentioning that the Silk Road Economic Belt and the 21st Century Maritime Silk Road program proposed by China in 2013 will increase human activities and may result in more environmental challenges in the ASB [41,42]. Overall, the ASB has been experiencing substantial environmental changes and facing severe environmental crisis, thus warranting urgent and greater efforts to address these issues.
5. Conclusions
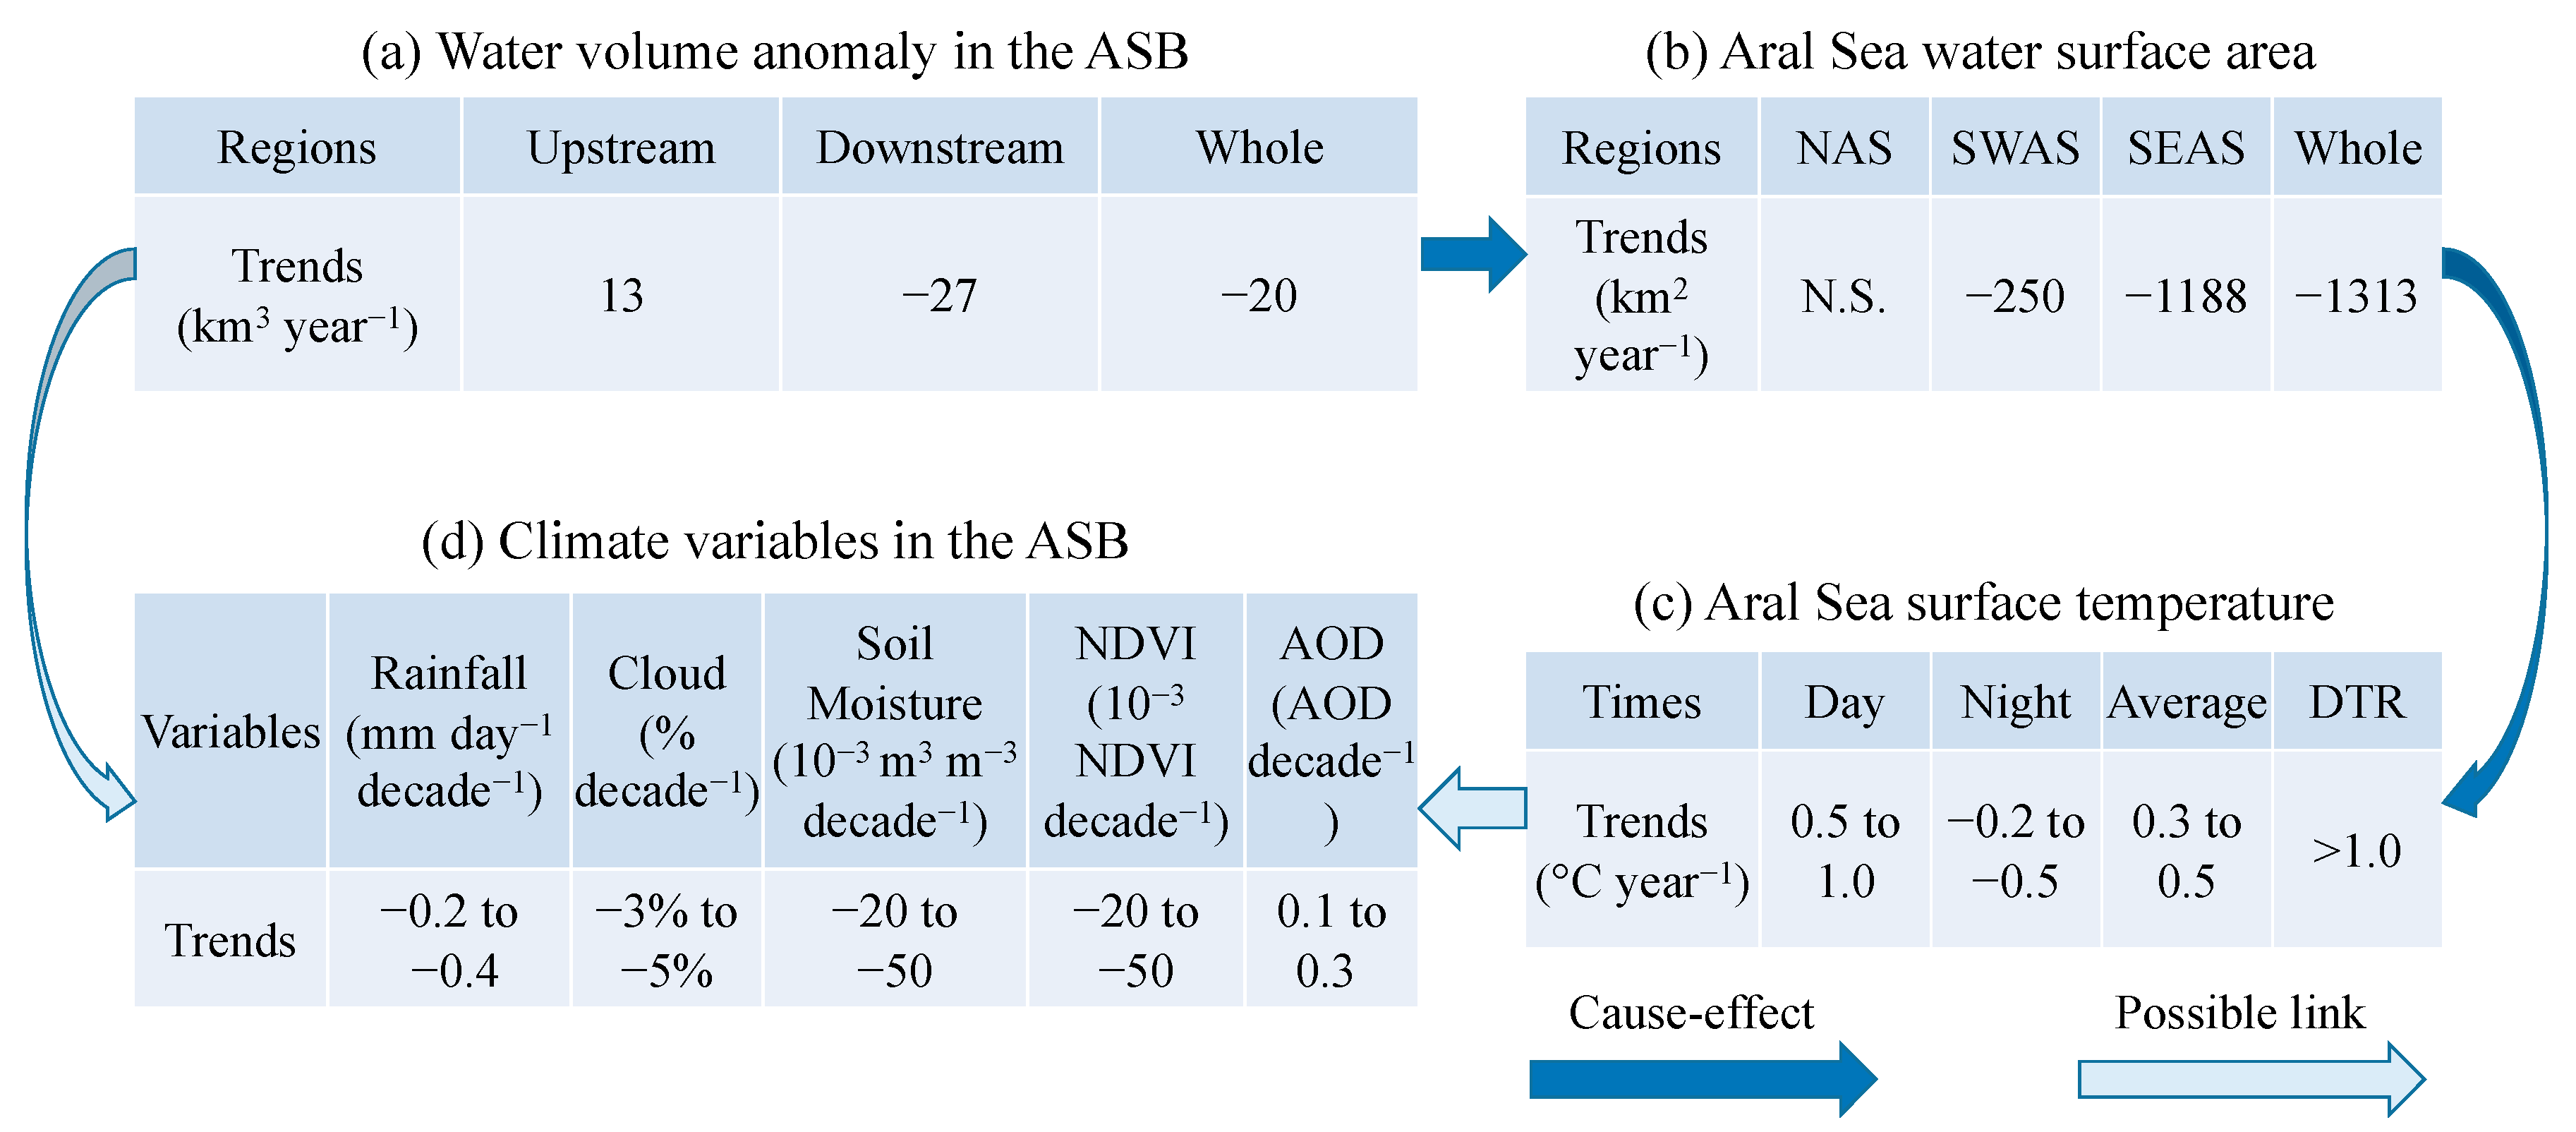
Based on multiple satellite datasets, this study addressed human irrigation-induced hydrological changes in the ASB with a special focus on the resultant shrinking of the Aral Sea. Moreover, the trends of land surface properties (soil moisture and NDVI) and aerosol concentrations were studied. We found that the anomaly of land water storage has been increasing at a rate of 13 km3 year−1 in the upstream region of the Amu Darya River, but decreasing at a rate of 27 km3 year−1 in the downstream region due to irrigation that diverted water from the upstream of the Amu Darya River to crop land in desert, which substantially reduced the inflow of the Aral Sea [8]. As a result, the area of the Aral Sea has decreased by two thirds and the anomaly of water volume of the Aral Sea decreased from 20 to −50 km3 during the past decade. Even worse, in recent years, the eastern part of the South Aral Sea has dried up, exposing the lake bottom of sand and dust to the air and forming a new desert—the Aralkum Desert. Due to land surface change, the surface temperature of the Aralkum Desert increased by up to 1 °C in daytime and decreased by 0.5 °C in nighttime compared to the original Aral Sea surface, which consequently enlarged the diurnal temperature range. All the trends computed in this study and the associated relationship among them are summarized in Figure 6.
Besides human-induced surface temperature changes in the Aral Sea, there were significant changes in AOD, precipitation, soil moisture, and NDVI in a larger domain in the ASB. Generally, drier soil, less vegetation, and higher aerosol concentration were observed in the central and northern parts of the domain of interest during the past decade, which demonstrated consistent spatial patterns with decreased precipitation. The opposite trends of precipitation in the Aral Sea in TRMM satellite retrievals (Figure 5b) to those in surface observations might come from the satellite precipitation retrieval algorithm, in which the surface albedo was fixed using the value of water surface rather than applying the dynamic surface albedo. This is a critical issue that needs to be solved in the future because: (1) over water bodies, satellite remote sensing is the only method to retrieve precipitation given that no in situ measurements exist at a regular time interval; and (2) several inland water bodies have dried up in the past [43] or are shrinking in recent years [8,44] due to either human activities or natural variability.
Supplementary Materials
The following are available online at www.mdpi.com/2072-4292/9/9/900/s1, Figure S1. Seasonal trends of AOD (AOD year−1) for (a) spring, (b) summer, (c) fall, and (d) winter from 2003 to 2015. Dots represent the grids that are confident at 95% level. Gray colors in missing values. Figure S2. Spatial patterns of (a) cloud fraction (%) climatology and (b) yearly linear trends of cloud fraction (% decade) from 2003 to 2015. CRU data was used. Dots represent the grids that are confident at 95% level. Gray colors in missing values.
Acknowledgments
This study was supported by the National Key Research and Development Program of China (Grant No. 2016YFA0600403) and funds from the Jackson School of Geosciences at the University of Texas at Austin.
Author Contributions
Q.J. and Z.Y. designed the analysis method; Q.J. and J.W. analyzed the data; P.L. contributed to data collection and analysis; and Q.J. wrote the paper.
Conflicts of Interest
The authors declare no conflict of interest. The founding sponsors had no role in the design of the study; in the collection, analyses, or interpretation of data; in the writing of the manuscript, and in the decision to publish the results.
References
- Huang, J.P.; Yu, H.P.; Dai, A.G.; Wei, Y.; Kang, L.T. Drylands face potential threat under 2 °C global warming target. Nat. Clim. Chang. 2017, 7, 417–422. [Google Scholar] [CrossRef]
- Reynolds, J.F.; Smith, D.M.; Lambin, E.F.; Turner, B.L.; Mortimore, M.; Batterbury, S.P.; Downing, T.E.; Dowlatabadi, H.; Fernández, R.J.; Herrick, J.E.; et al. Global desertification: Building a science for dryland development. Science 2007, 316, 847–851. [Google Scholar] [CrossRef] [PubMed]
- Kang, Y.H.; Khan, S.; Ma, X.Y. Climate change impacts on crop yield, crop water productivity and food security—A review. Prog. Nat. Sci. Mater. 2009, 19, 1665–1674. [Google Scholar] [CrossRef]
- Higgins, G.M.; Dieleman, P.J.; Abernethy, C.L. Trends in Irrigation Development, and Their Implications for Hydrologists and Water-Resources Engineers. Hydrol. Sci. J. 1988, 33, 43–59. [Google Scholar] [CrossRef]
- Micklin, P.P. Desiccation of the Aral Sea—A Water Management Disaster in the Soviet-Union. Science 1988, 241, 1170–1175. [Google Scholar] [CrossRef] [PubMed]
- Huang, J.P.; Yu, H.P.; Guan, X.D.; Wang, G.Y.; Guo, R.X. Accelerated dryland expansion under climate change. Nat. Clim. Chang. 2016, 6, 166–171. [Google Scholar] [CrossRef]
- Li, C.; Zhang, C.; Luo, G.; Chen, X.; Maisupova, B.; Madaminov, A.A.; Han, Q.; Djenbaev, B.M. Carbon stock and its responses to climate change in Central Asia. Glob. Chang. Biol. 2015, 21, 1951–1967. [Google Scholar] [CrossRef] [PubMed]
- Micklin, P. The Aral Sea disaster. Annu. Rev. Earth Planet. Sci. 2007, 35, 47–72. [Google Scholar] [CrossRef]
- The World Bank. Irrigation in Central Asia. 2003. Available online: http://siteresources.worldbank.org/ECAEXT/Resources/publications/Irrigation-in-Central-Asia/Irrigation_in_Central_Asia-Full_Document-English.pdf (accessed on 15 August 2017).
- Gaybullaev, B.; Chen, S.C.; Gaybullaev, D. Changes in water volume of the Aral Sea after 1960. Appl. Water Sci. 2012, 2, 285–291. [Google Scholar] [CrossRef]
- Nurushev, A. Crisis of the Aral Sea. Himal. Cent. Asian Stud. 1999, 3, 50–58. [Google Scholar]
- Parajuli, S.P.; Yang, Z.L. Understanding dust emission in the Bodele region by extracting locally mobilized dust aerosols from satellite Aerosol Optical Depth data using principal component analysis. Aeolian Res. 2017, 24, 105–113. [Google Scholar] [CrossRef]
- Small, E.E.; Sloan, L.C.; Nychka, D. Changes in surface air temperature caused by desiccation of the Aral Sea. J. Clim. 2001, 14, 284–299. [Google Scholar] [CrossRef]
- Conrad, C.; Schonbrodt-Stitt, S.; Low, F.; Sorokin, D.; Paeth, H. Cropping Intensity in the Aral Sea Basin and Its Dependency from the Runoff Formation 2000–2012. Remote Sens. 2016, 8, 630. [Google Scholar] [CrossRef]
- Pekel, J.F.; Cottam, A.; Gorelick, N.; Belward, A.S. High-resolution mapping of global surface water and its long-term changes. Nature 2016, 540, 418–422. [Google Scholar] [CrossRef] [PubMed]
- Shi, W.; Wang, M.; Guo, W. Long-term hydrological changes of the Aral Sea observed by satellites. J. Geophys. Res. Oceans 2014, 119, 3313–3326. [Google Scholar] [CrossRef]
- Zmijewski, K.; Becker, R. Estimating the Effects of Anthropogenic Modification on Water Balance in the Aral Sea Watershed Using GRACE: 2003–12. Earth Interact. 2014, 18, 1–16. [Google Scholar] [CrossRef]
- Hsu, N.C.; Jeong, M.J.; Bettenhausen, C.; Sayer, A.M.; Hansell, R.; Seftor, C.S.; Huang, J.; Tsay, S.C. Enhanced Deep Blue aerosol retrieval algorithm: The second generation. J. Geophys. Res. Atmos. 2013, 118, 9296–9315. [Google Scholar] [CrossRef]
- Hsu, N.C.; Tsay, S.C.; King, M.D.; Herman, J.R. Aerosol properties over bright-reflecting source regions. IEEE Trans. Geosci. Remote Sens. 2004, 42, 557–569. [Google Scholar] [CrossRef]
- Levy, R.C.; Mattoo, S.; Munchak, L.A.; Remer, L.A.; Sayer, A.M.; Patadia, F.; Hsu, N.C. The Collection 6 MODIS aerosol products over land and ocean. Atmos. Meas. Tech. 2013, 6, 2989–3034. [Google Scholar] [CrossRef]
- Wielicki, B.A. Clouds and the Earth’s radiant energy system (CERES): An earth observing system experiment. Bull. Am. Meteorol. Soc. 1996, 77, 853–868. [Google Scholar] [CrossRef]
- Tapley, B.D.; Bettadpur, S.; Watkins, M.; Reigber, C. The gravity recovery and climate experiment: Mission overview and early results. Geophys. Res. Lett. 2004, 31, L09607. [Google Scholar] [CrossRef]
- Save, H.; Bettadpur, S.; Tapley, B.D. High-resolution CSR GRACE RL05 mascons. J. Geophys. Res. Sol. Earth 2016, 121, 7547–7569. [Google Scholar] [CrossRef]
- Huffman, G.J.; Bolvin, D.T.; Nelkin, E.J.; Wolff, D.B.; Adler, R.F.; Gu, G.; Hong, Y.; Bowman, K.P.; Stocker, E.F. The TRMM Multisatellite Precipitation Analysis (TMPA): Quasi-Global, Multiyear, Combined-Sensor Precipitation Estimates at Fine Scales. J. Hydrometeorol. 2007, 8, 38–55. [Google Scholar] [CrossRef]
- Liu, Y.Y.; Dorigo, W.A.; Parinussa, R.M.; de Jeu, R.A.M.; Wagner, W.; McCabe, M.F.; Evans, J.P.; van Dijk, A.I.J.M. Trend-preserving blending of passive and active microwave soil moisture retrievals. Remote Sens. Environ. 2012, 123, 280–297. [Google Scholar] [CrossRef]
- Liu, Y.Y.; Parinussa, R.M.; Dorigo, W.A.; de Jeu, R.A.M.; Wagner, W.; van Dijk, A.I.J.M.; McCabe, M.F.; Evans, J.P. Developing an improved soil moisture dataset by blending passive and active microwave satellite-based retrievals. Hydrol. Earth Syst. Sci. 2011, 15, 425–436. [Google Scholar] [CrossRef] [Green Version]
- Chen, Y.N.; Li, W.H.; Deng, H.J.; Fang, G.H.; Li, Z. Changes in Central Asia's Water Tower: Past, Present and Future. Sci. Rep. 2016, 6, 35458. [Google Scholar] [CrossRef] [PubMed]
- Wei, J.F.; Dirmeyer, P.A.; Wisser, D.; Bosilovich, M.G.; Mocko, D.M. Where Does the Irrigation Water Go? An Estimate of the Contribution of Irrigation to Precipitation Using MERRA. J. Hydrometeorol. 2013, 14, 275–289. [Google Scholar] [CrossRef]
- Bank TW. Saving a Corner of the Aral Sea. 2005. Available online: http://www.worldbank.org/en/results/2005/09/01/saving-a-corner-of-the-aral-sea (accessed on 15 August 2017).
- Baidya Roy, S.; Smith, M.; Morris, L.; Orlovsky, N.; Khalilov, A. Impact of the desiccation of the Aral Sea on summertime surface air temperatures. J. Arid Environ. 2014, 110, 79–85. [Google Scholar] [CrossRef]
- O’Hara, S.L.; Wiggs, G.F.S.; Mamedov, B.; Davidson, G.; Hubbard, R.B. Exposure to airborne dust contaminated with pesticide in the Aral Sea region. Lancet 2000, 355, 627–628. [Google Scholar] [CrossRef]
- Bozheyeva, G.; Kunakbayev, Y.; Yeleukenov, D. Former Soviet Biological Weapons Facilities in Kazakhstan. Past Present and Future. Available online: http://nsarchive2.gwu.edu//NunnLugar/2015/49.%201999-06-00%20Former%20Soviet%20Biological%20Weapons%20Facilities%20in%20Kazakhstan.Past%20Present%20and%20Future%20%28from%20Web%29.pdf (accessed on 15 August 2017).
- ScienceScope. Bioweapons cleanup. Science 2002, 295, 603. [Google Scholar]
- Pandey, A.C.; Jha, N.K. Central Asia: Democratic deficit and challenges of sustainable development. J. Environ. Res. Dev. 2007, 1, 403–411. [Google Scholar]
- Anand, R.K. The Aral Sea Disaster and Health Crisis. IOSR J. Humanit. Soc. Sci. 2015, 20, 32–37. [Google Scholar]
- Phillip, W.W. The Aral Sea environmental health crisis. J. Rural Remote Environ. Health 2002, 1, 29–34. [Google Scholar]
- Jin, Q.; Wei, J.; Yang, Z.L.; Pu, B.; Huang, J. Consistent response of Indian summer monsoon to Middle East dust in observations and simulations. Atmos. Chem. Phys. 2015, 15, 9897–9915. [Google Scholar] [CrossRef]
- Jin, Q.; Yang, Z.L.; Wei, J. Seasonal Responses of Indian Summer Monsoon to Dust Aerosols in the Middle East, India, and China. J. Clim. 2016, 29, 6329–6349. [Google Scholar] [CrossRef]
- Parajuli, S.P.; Yang, Z.L.; Lawrence, D.M. Diagnostic evaluation of the Community Earth System Model in simulating mineral dust emission with insight into large-scale dust storm mobilization in the Middle East and North Africa (MENA). Aeolian Res. 2016, 21, 21–35. [Google Scholar] [CrossRef]
- Xi, X.; Sokolik, I.N. Seasonal dynamics of threshold friction velocity and dust emission in Central Asia. J. Geophys. Res. Atmos. 2015, 120, 1536–1564. [Google Scholar] [CrossRef] [PubMed]
- Li, P.Y.; Qian, H.; Howard, K.W.F.; Wu, J.H. Building a new and sustainable “Silk Road economic belt”. Environ. Earth Sci. 2015, 74, 7267–7270. [Google Scholar] [CrossRef]
- Normile, D. China’s Belt and Road Infrastructure Plan Also Includes Science. Available online: http://www.sciencemag.org/news/2017/05/china-s-belt-and-road-infrastructure-plan-also-includes-science (accessed on 30 August 2017).
- Mischke, S.; Liu, C.; Zhang, J.; Zhang, C.; Zhang, H.; Jiao, P.; Plessen, B. The world’s earliest Aral-Sea type disaster: the decline of the Loulan Kingdom in the Tarim Basin. Sci. Rep. 2017, 7, 43102. [Google Scholar] [CrossRef] [PubMed]
- Gao, H.; Bohn, T.J.; Podest, E.; McDonald, K.C.; Lettenmaier, D.P. On the causes of the shrinking of Lake Chad. Environ. Res. Lett. 2011, 6, 034021. [Google Scholar] [CrossRef]
Figure 1.
Study domain. The spatial pattern of climatological (1998–2015) precipitation (mm year−1). The data are from TRMM monthly retrievals (version 3B43; 0.25° × 0.25°). Two of the blue lines represent two major rivers in the ASB, which generally includes the area to the east of 56°E in the study domain. Light-yellow color indicates the desert areas, defined as areas where annual precipitation is less than 250 mm. The two black arrows denote the direction of the river flow.

Figure 2.
(a) Spatial patterns of linear trends (cm year−1) of liquid water equivalent thickness. The data are retrieved by GRACE from 2003 to 2014. The dots represent the grids that are confident at the 95% level based on the two-tailed Student’s t-test. The boxes of blue, red, and black marked by “DNS”, “UPS”, and “WHB” represent the down-stream, up-stream, and the whole basin region, respectively. (b) The yearly time series of water volume anomaly (km3) in the three regions and TRMM precipitation (mm day−1) in the WHB.

Figure 3.
(a–c) The spatial patterns of NDVI. The data are from MODIS 16-day retrievals (version MOD13Q1; 250 × 250 m). The blue color denotes water body area. The Aral Sea is divided into three regions (NAS: north Aral Sea; SWAS: southwest Aral Sea; and SEAS: southeast Aral Sea) for further analysis. (d) Water surface area (left y-axis; km2) of the whole Aral Sea and three sub-regions and the water volume anomaly (right y-axis; km3) of the whole Aral Sea (defined within 44°N—46.5°N, 58.5°E—61°E) in the past decade. Water surface area is based on MODIS NDVI data on 25 or 26 June of each year and water volume anomaly is from GRACE yearly data. The shadings are the ranges of the water surface area based on two different NDVI thresholds of 0 and −0.18.

Figure 4.
Trends of temperature (°C year−1) for: (a) daytime; (b) nighttime; (c) daily average; and (d) diurnal temperature range (daytime minus nighttime temperature) from 2003 to 2015. Dots represent the grids that are confident at the 95% level. The red star in panel b represents the location of the Dike Kokaral dam.

Figure 5.
Trends of: (a) MODIS AOD (AOD decade−1); (b) TRMM precipitation (mm day−1 decade−1); (c) CERES cloud cover fraction (% decade−1); (d) ESA CCI soil moisture (10−3 m3 m−3 decade−1); and (e) MODIS NDVI (10−3 NDVI decade−1) during 2003 to 2015 except for soil moisture which spans from 2003 to 2014. Dots represent the grids that are confident at the 95% level. Gray colors in (c,d) indicate water bodies.
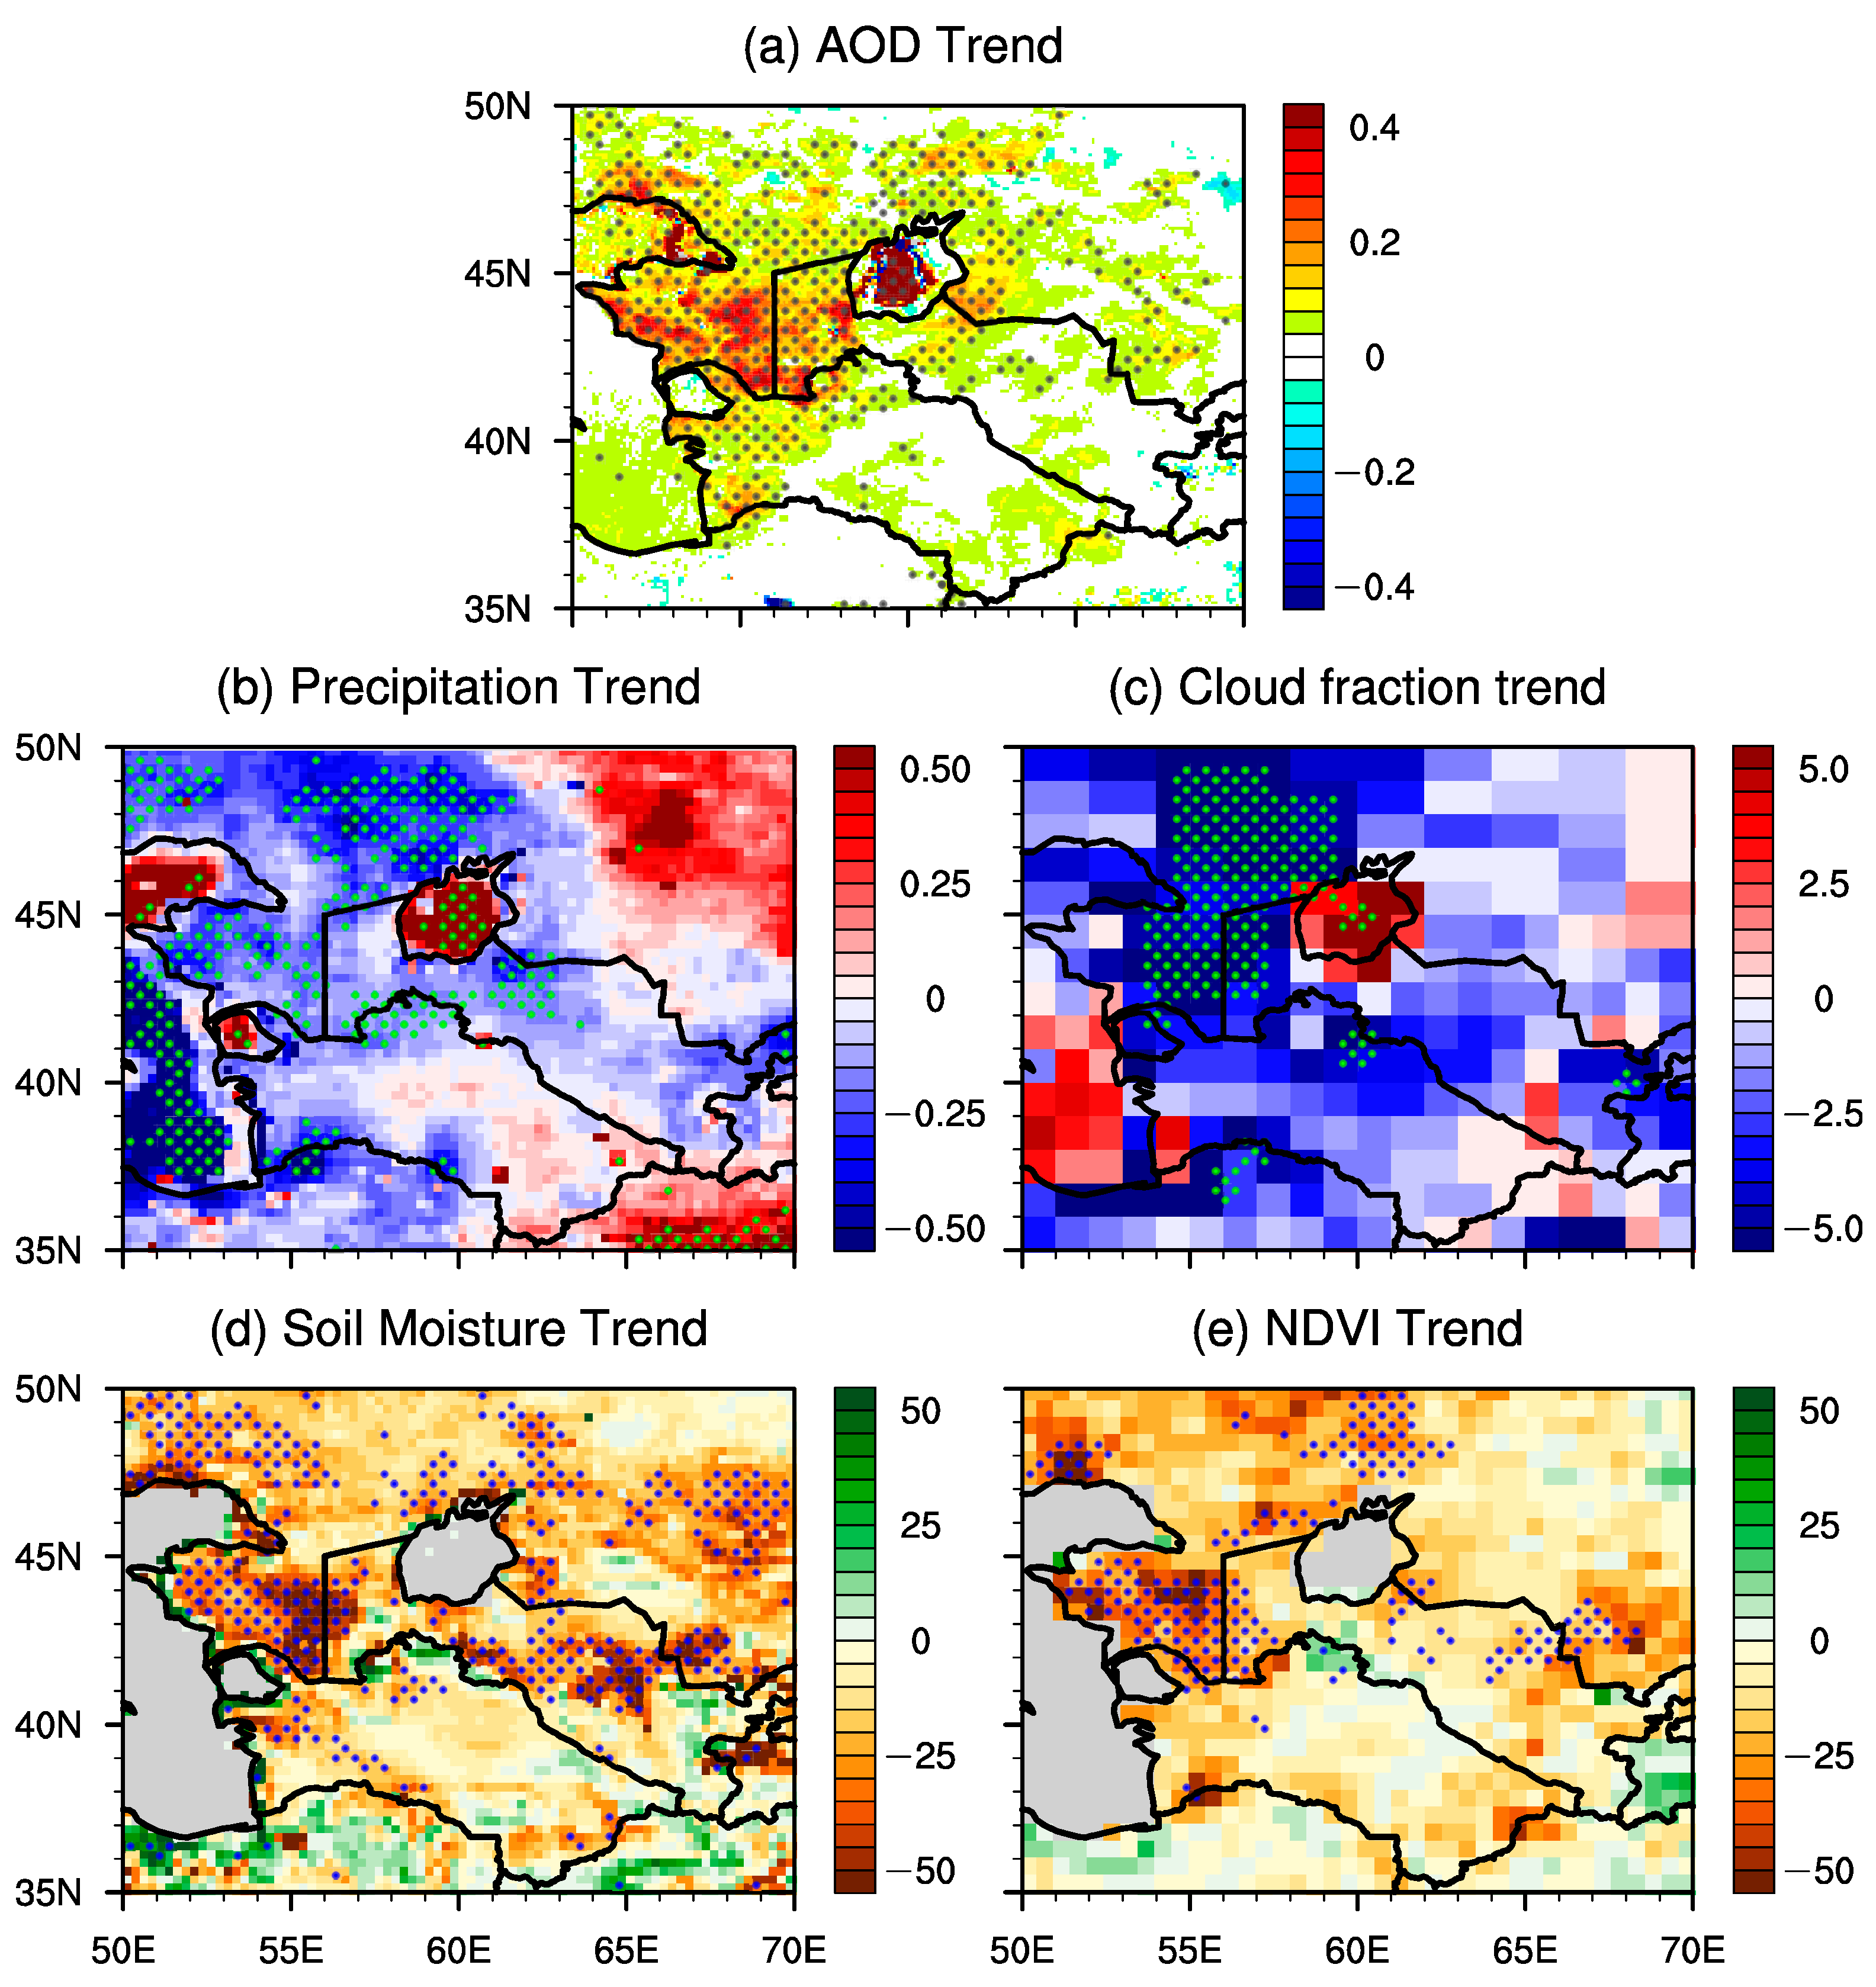
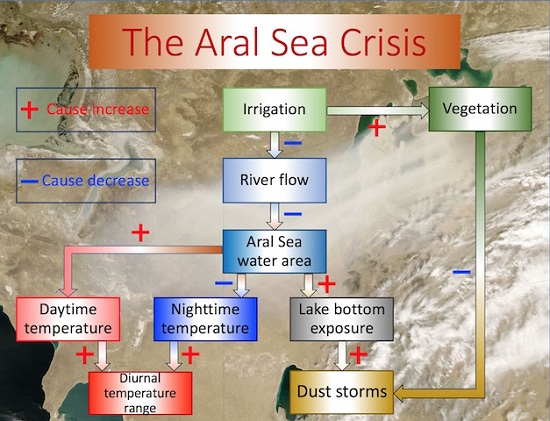
Figure 6.
Summary of all trends computed in this study and the relationship between these trends. Trends of (a) water volume anomaly in the ASB, (b) water surface area of the Aral Sea, (c) surface temperature of the Aral Sea, and (d) related climate variables in the ASB. All trends are significant at 95% confidence level. The dark and light blue arrows respectively represent the cause-effect relationship and possible linkage between various trends. N.S. means no significant trends was detected.

© 2017 by the authors. Licensee MDPI, Basel, Switzerland. This article is an open access article distributed under the terms and conditions of the Creative Commons Attribution (CC BY) license (http://creativecommons.org/licenses/by/4.0/).
Share and Cite
MDPI and ACS Style
Jin, Q.; Wei, J.; Yang, Z.-L.; Lin, P. Irrigation-Induced Environmental Changes around the Aral Sea: An Integrated View from Multiple Satellite Observations. Remote Sens. 2017, 9, 900. https://doi.org/10.3390/rs9090900
AMA Style
Jin Q, Wei J, Yang Z-L, Lin P. Irrigation-Induced Environmental Changes around the Aral Sea: An Integrated View from Multiple Satellite Observations. Remote Sensing. 2017; 9(9):900. https://doi.org/10.3390/rs9090900
Chicago/Turabian StyleJin, Qinjian, Jiangfeng Wei, Zong-Liang Yang, and Peirong Lin. 2017. "Irrigation-Induced Environmental Changes around the Aral Sea: An Integrated View from Multiple Satellite Observations" Remote Sensing 9, no. 9: 900. https://doi.org/10.3390/rs9090900
Note that from the first issue of 2016, this journal uses article numbers instead of page numbers. See further details here.