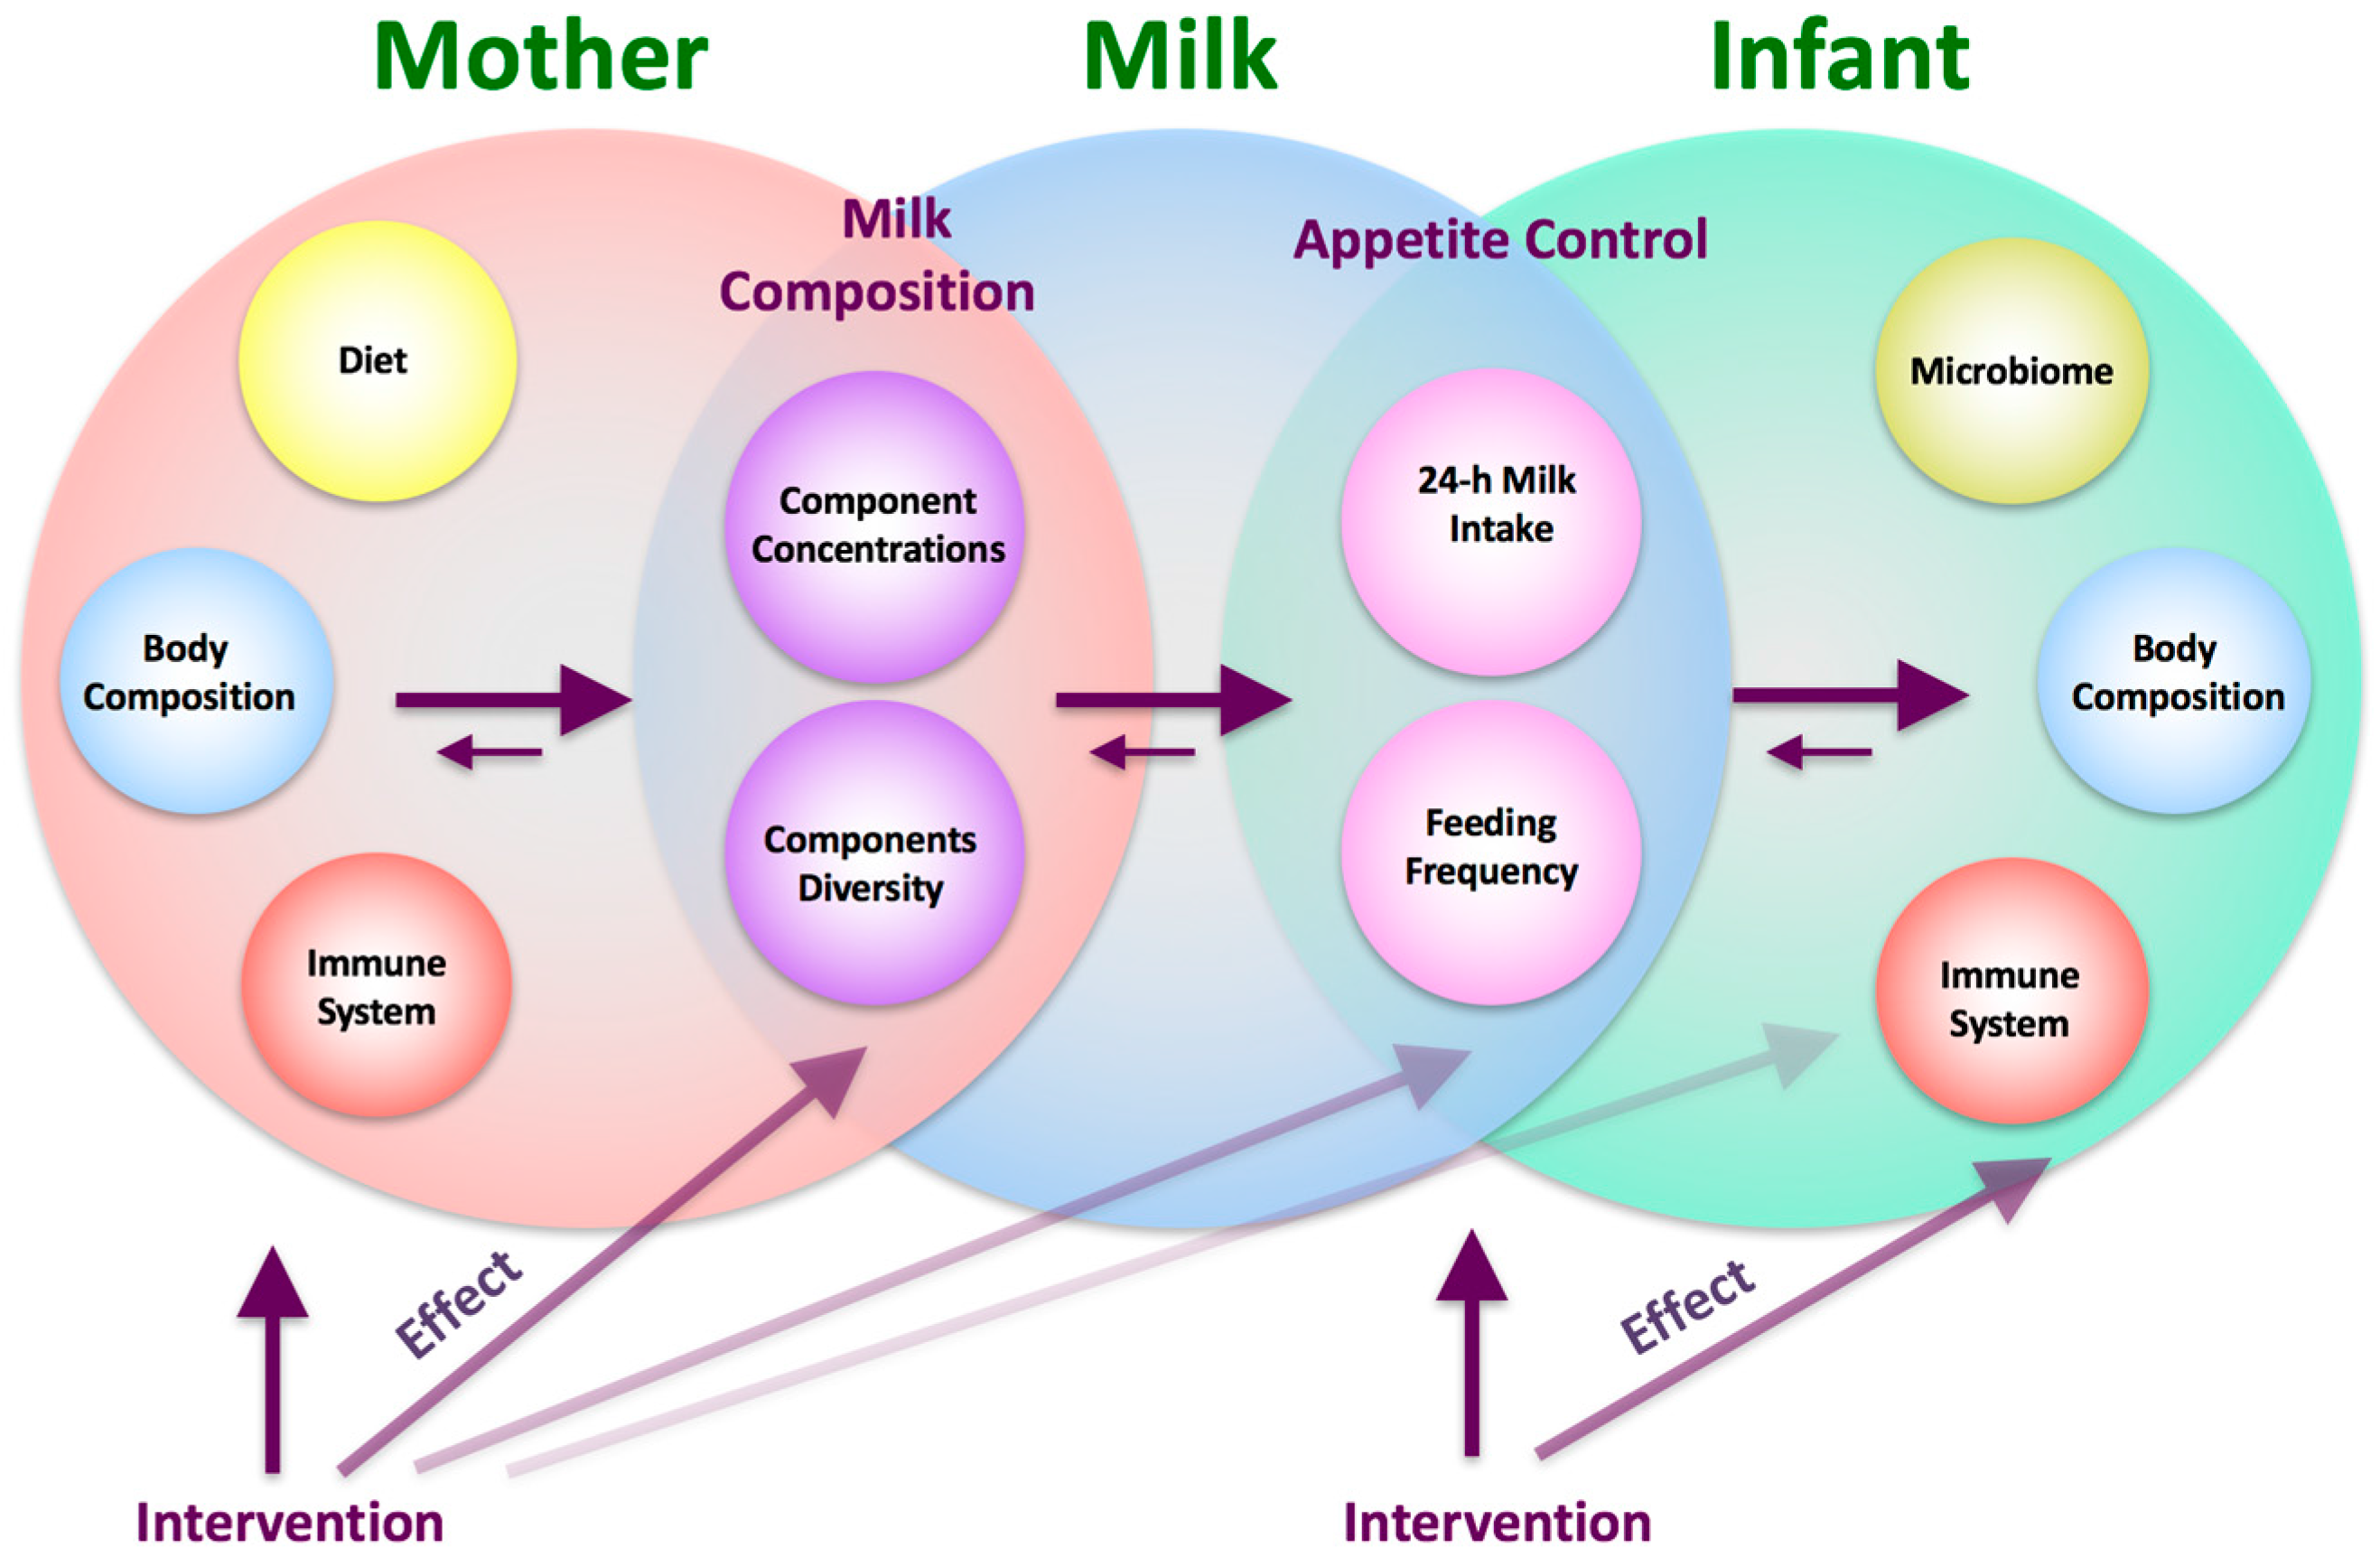
Relationships between Breastfeeding Patterns and Maternal and Infant Body Composition over the First 12 Months of Lactation

 , , , ,
Abstract
:
1. Introduction
2. Materials and Methods
2.1. Study Participants
2.2. Study Session
2.3. Anthropometric Measurements
2.4. Body Composition with Bioelectrical Impedance Spectroscopy
2.5. Ultrasound Skinfold Measurements
2.6. Body Composition Indices
2.7. 24-H Milk Intake and Feeding Frequency
2.8. Statistical Analyses
3. Results
3.1. Subjects
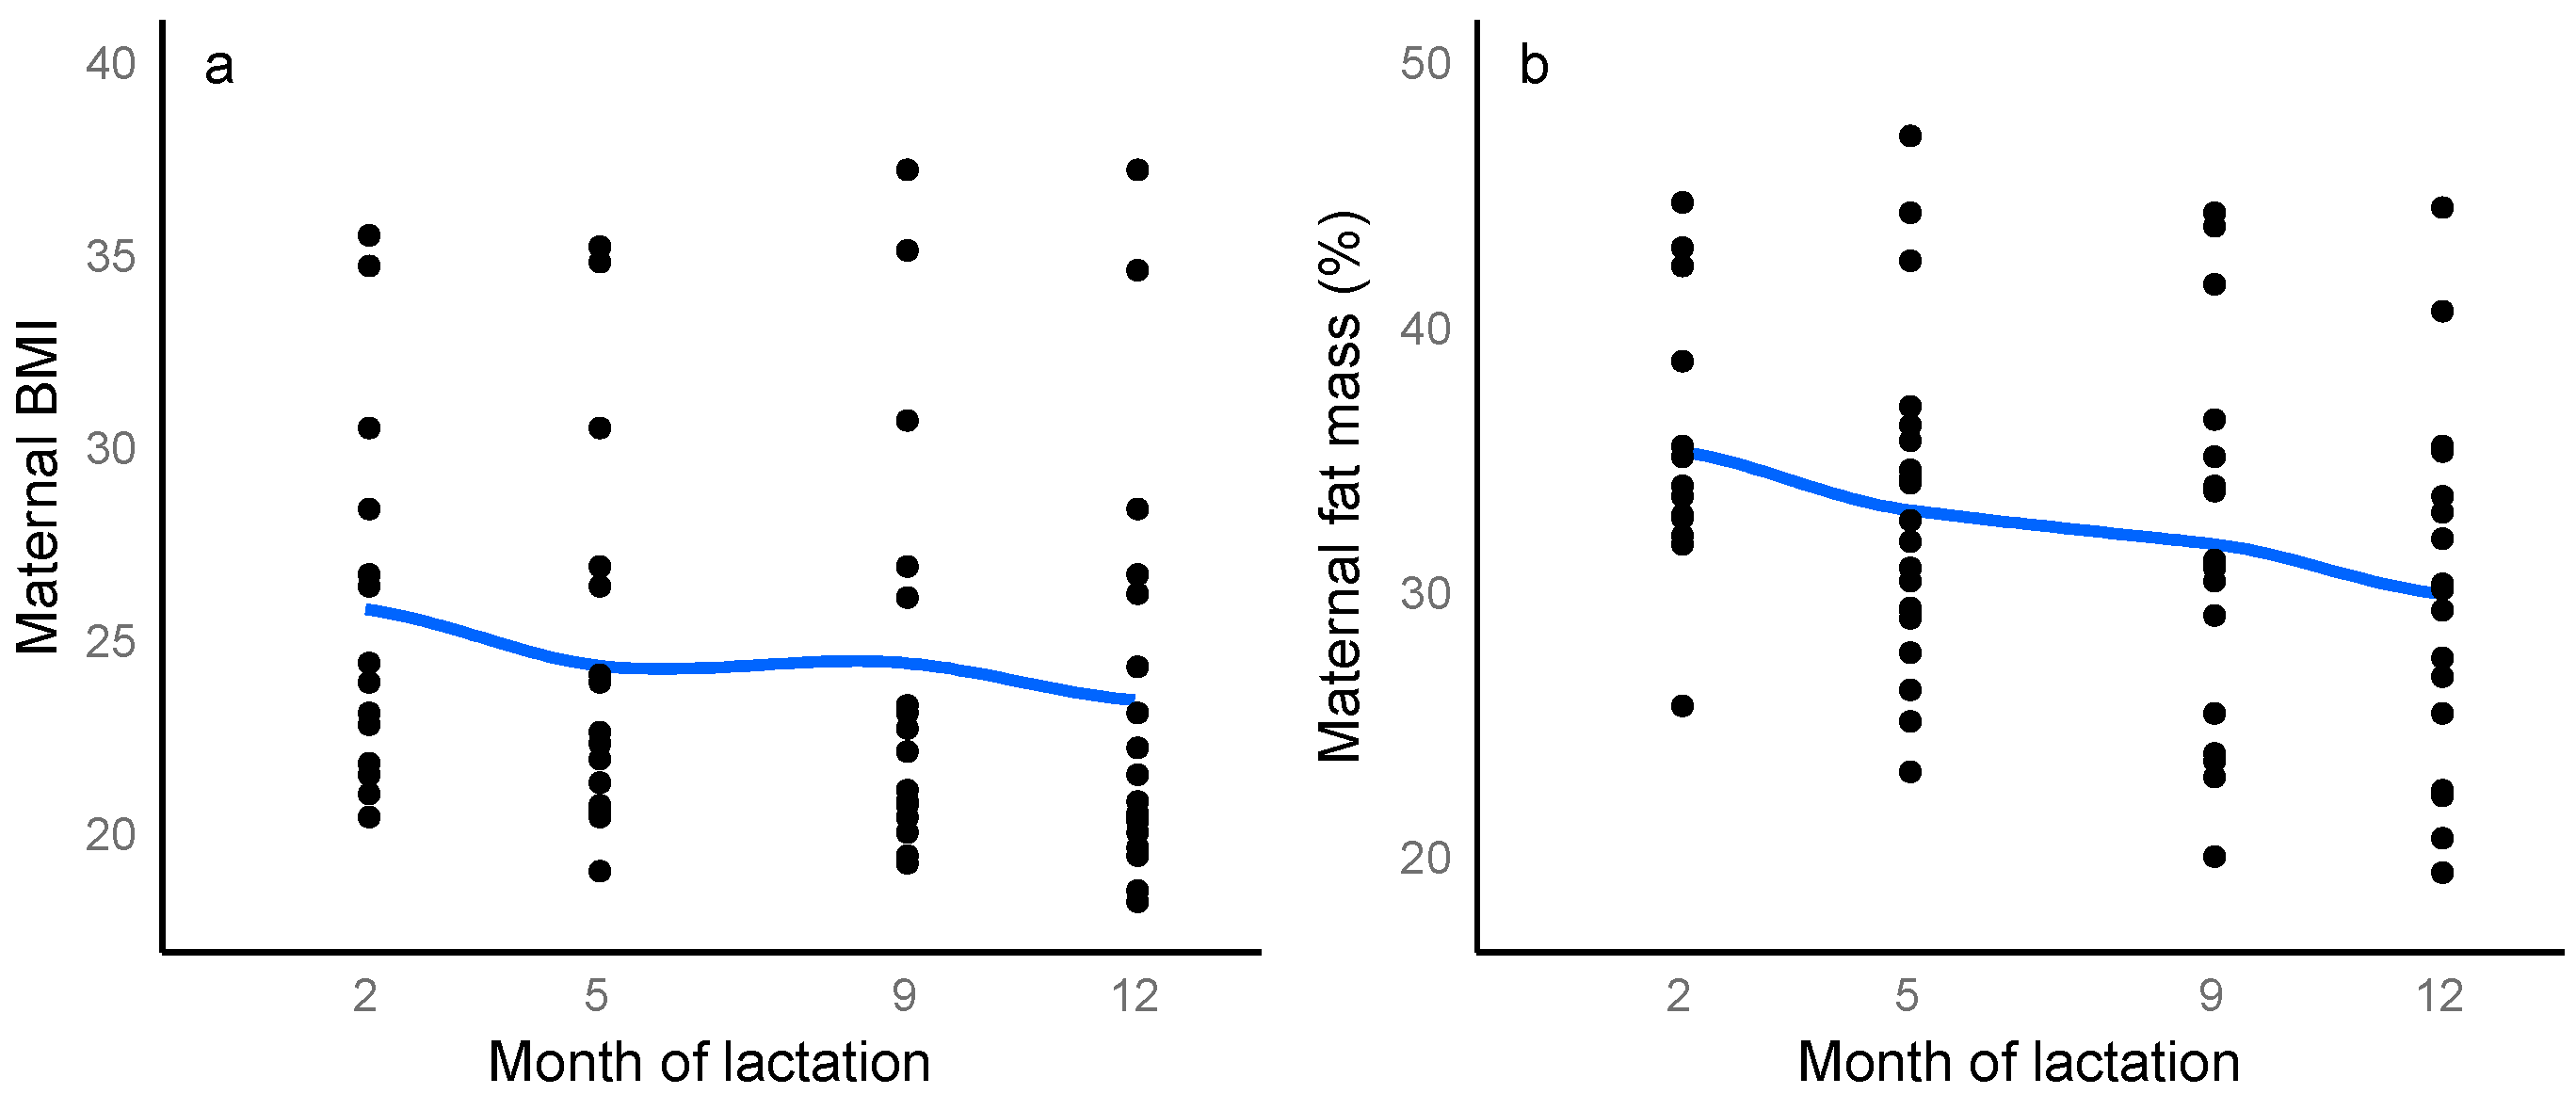
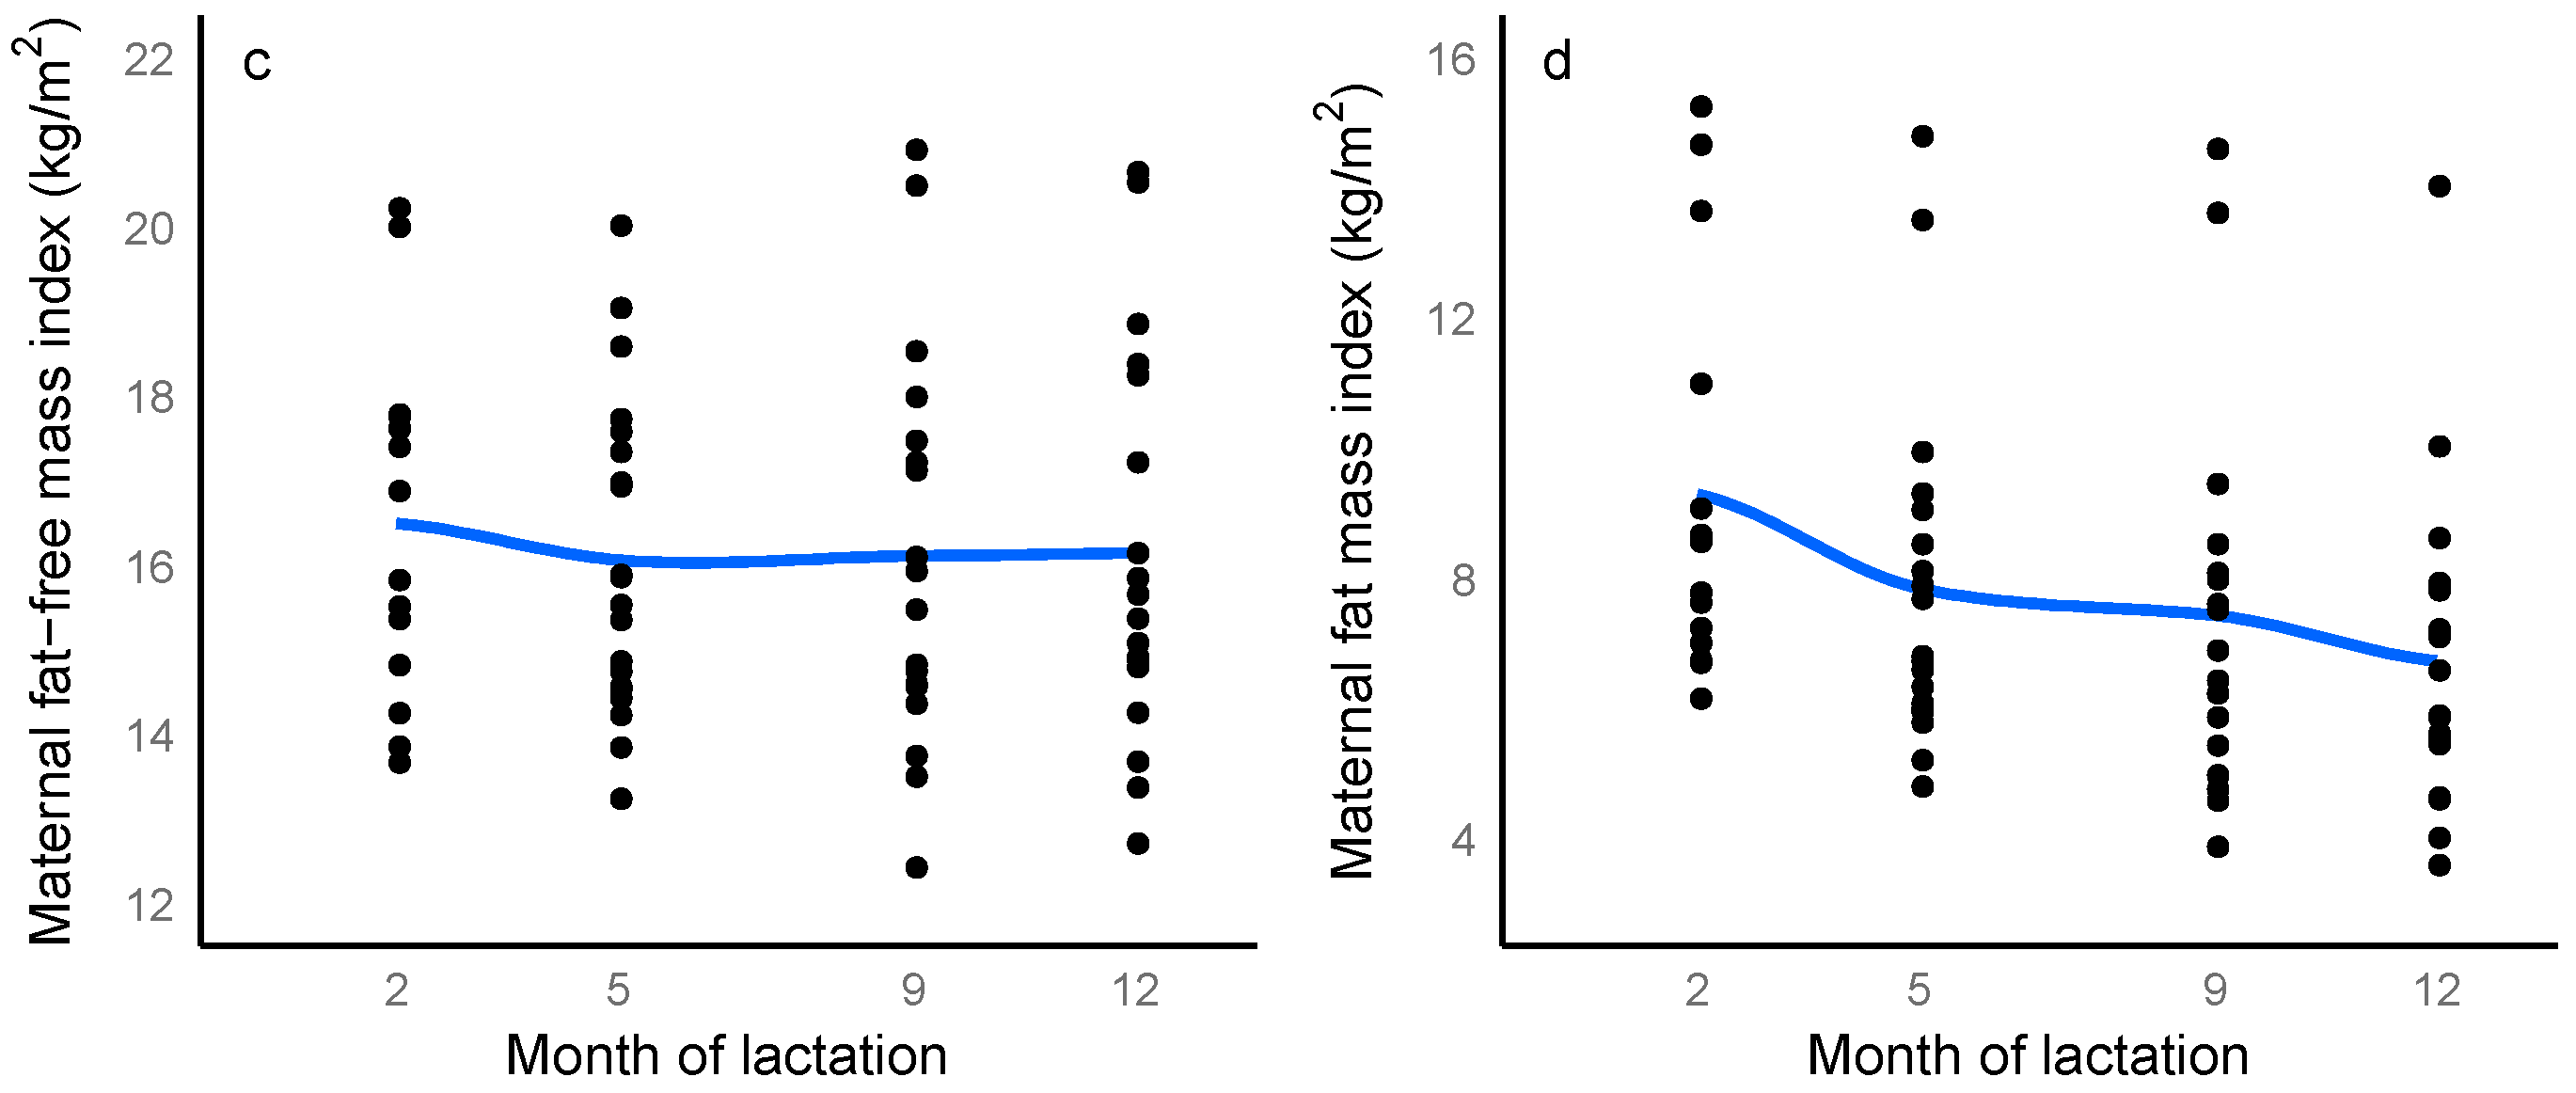
3.2. Maternal Body Composition
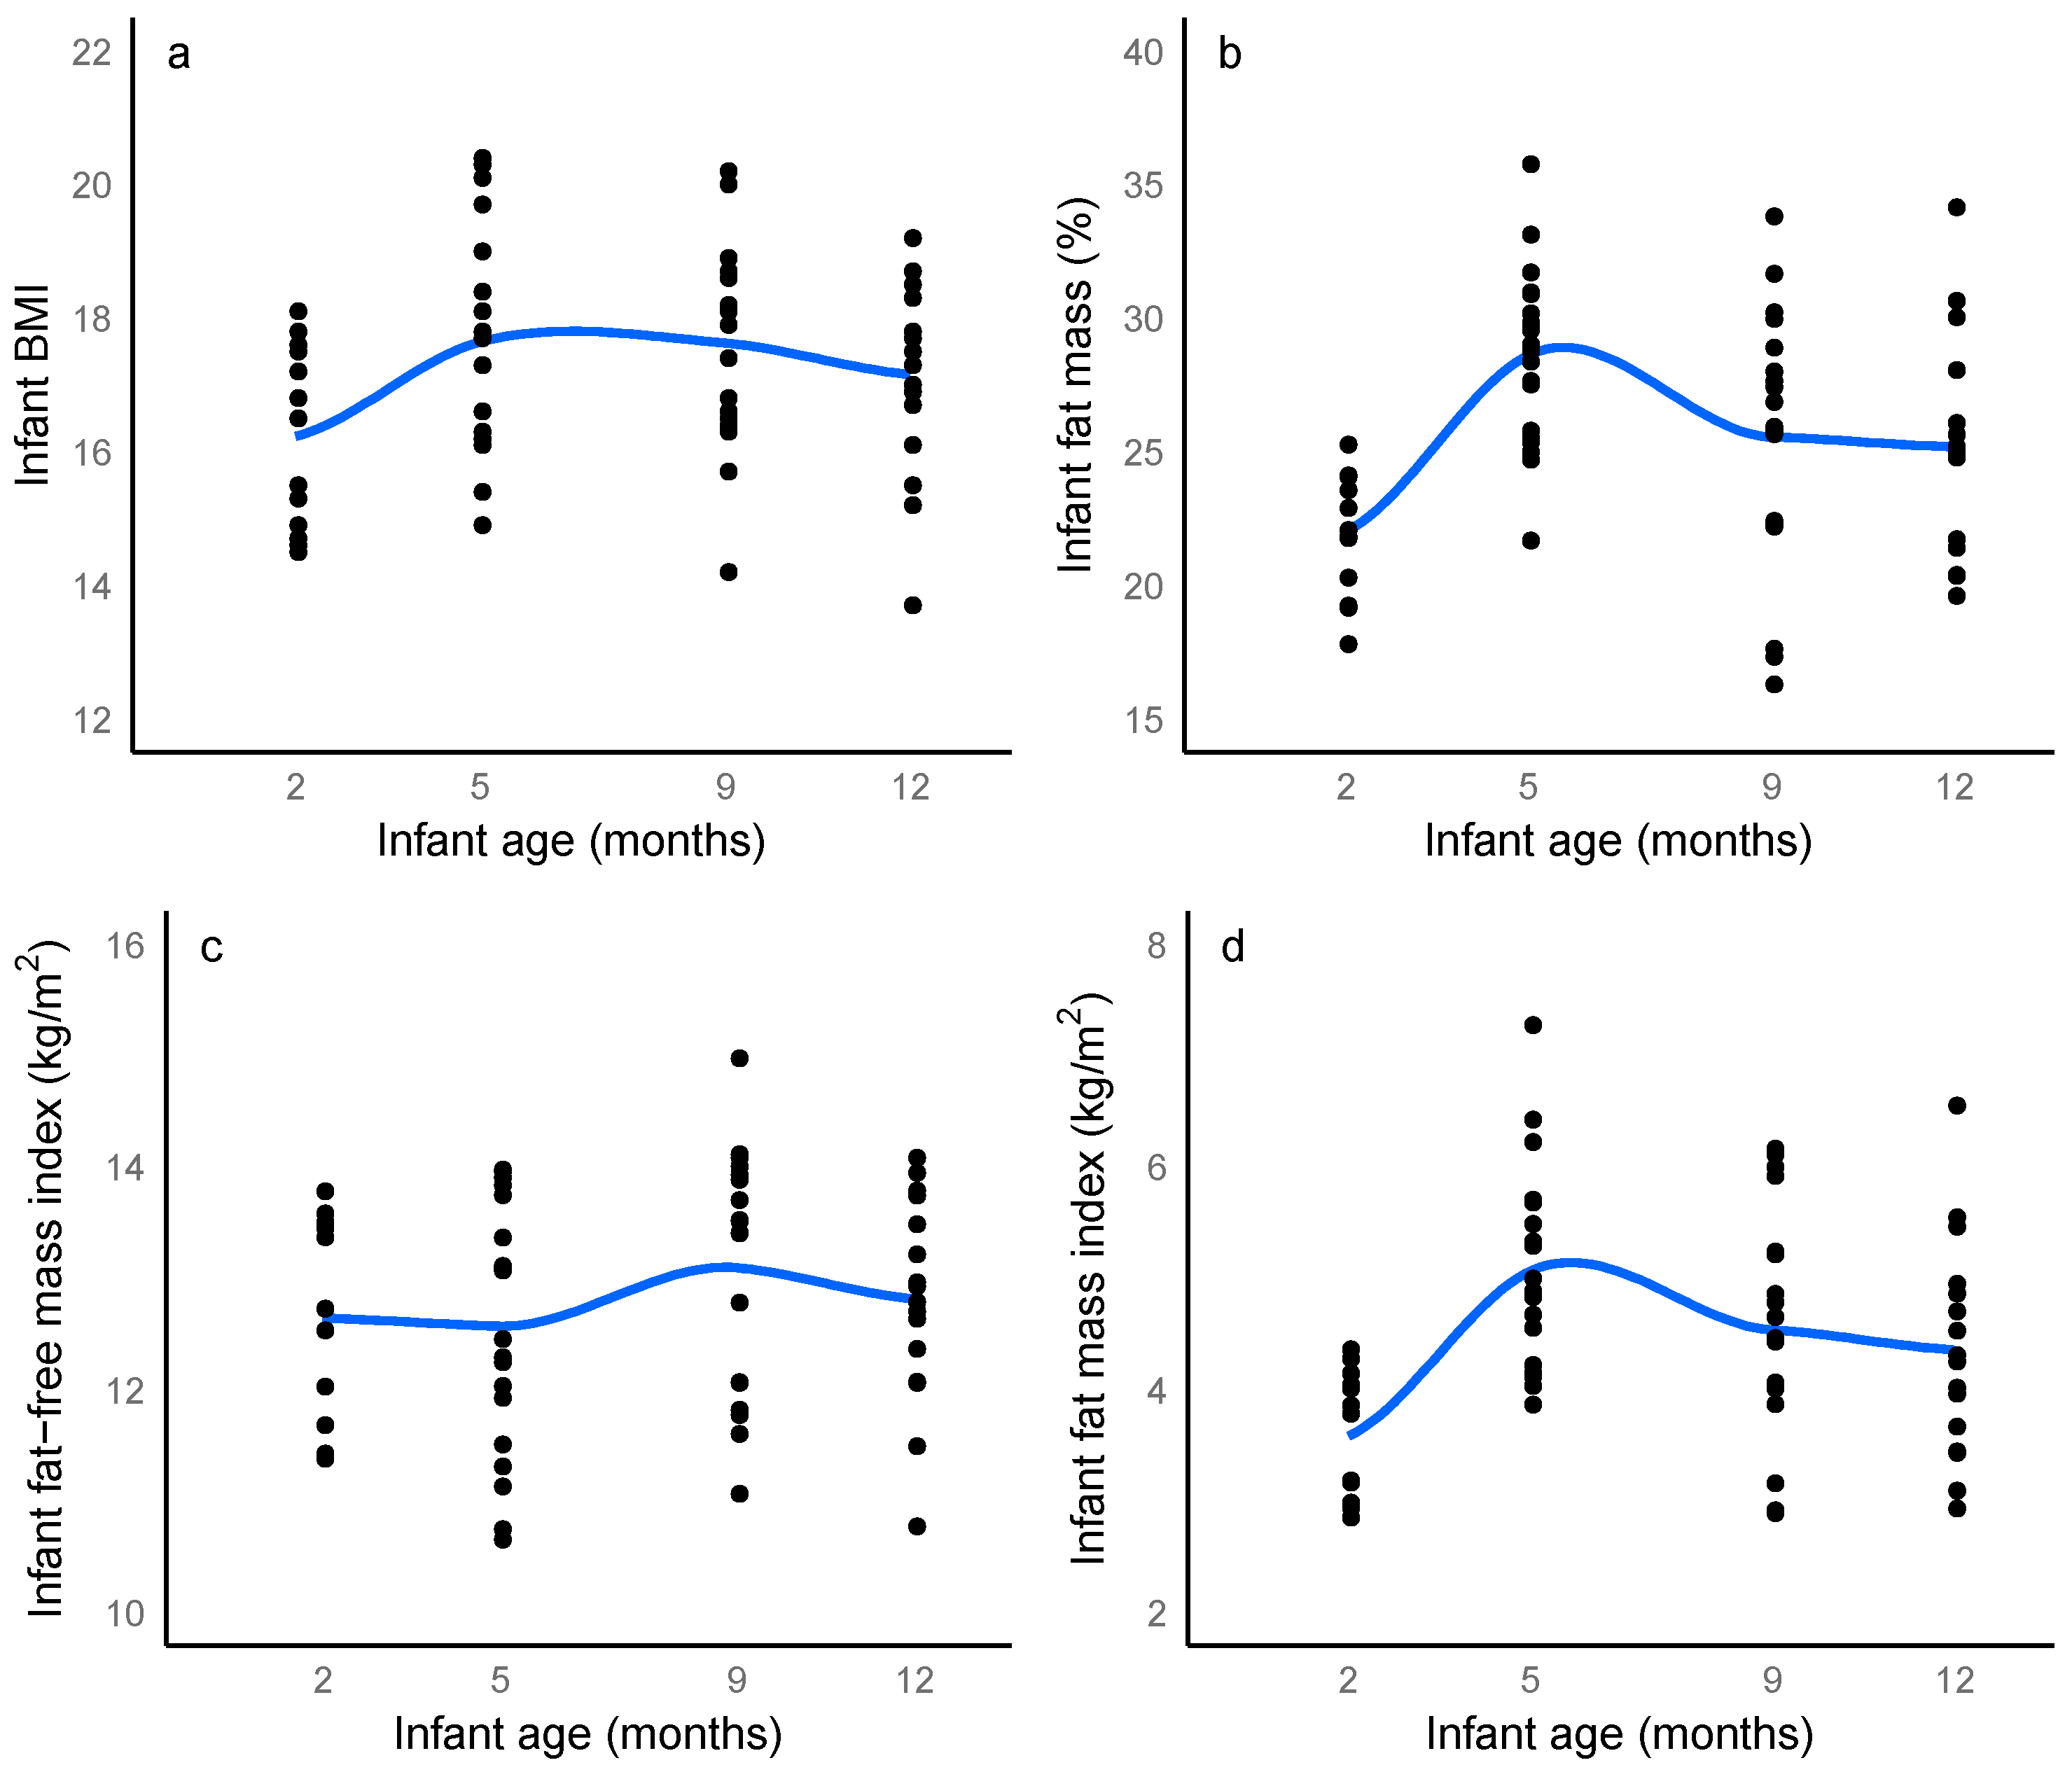
3.3. Infant Body Composition
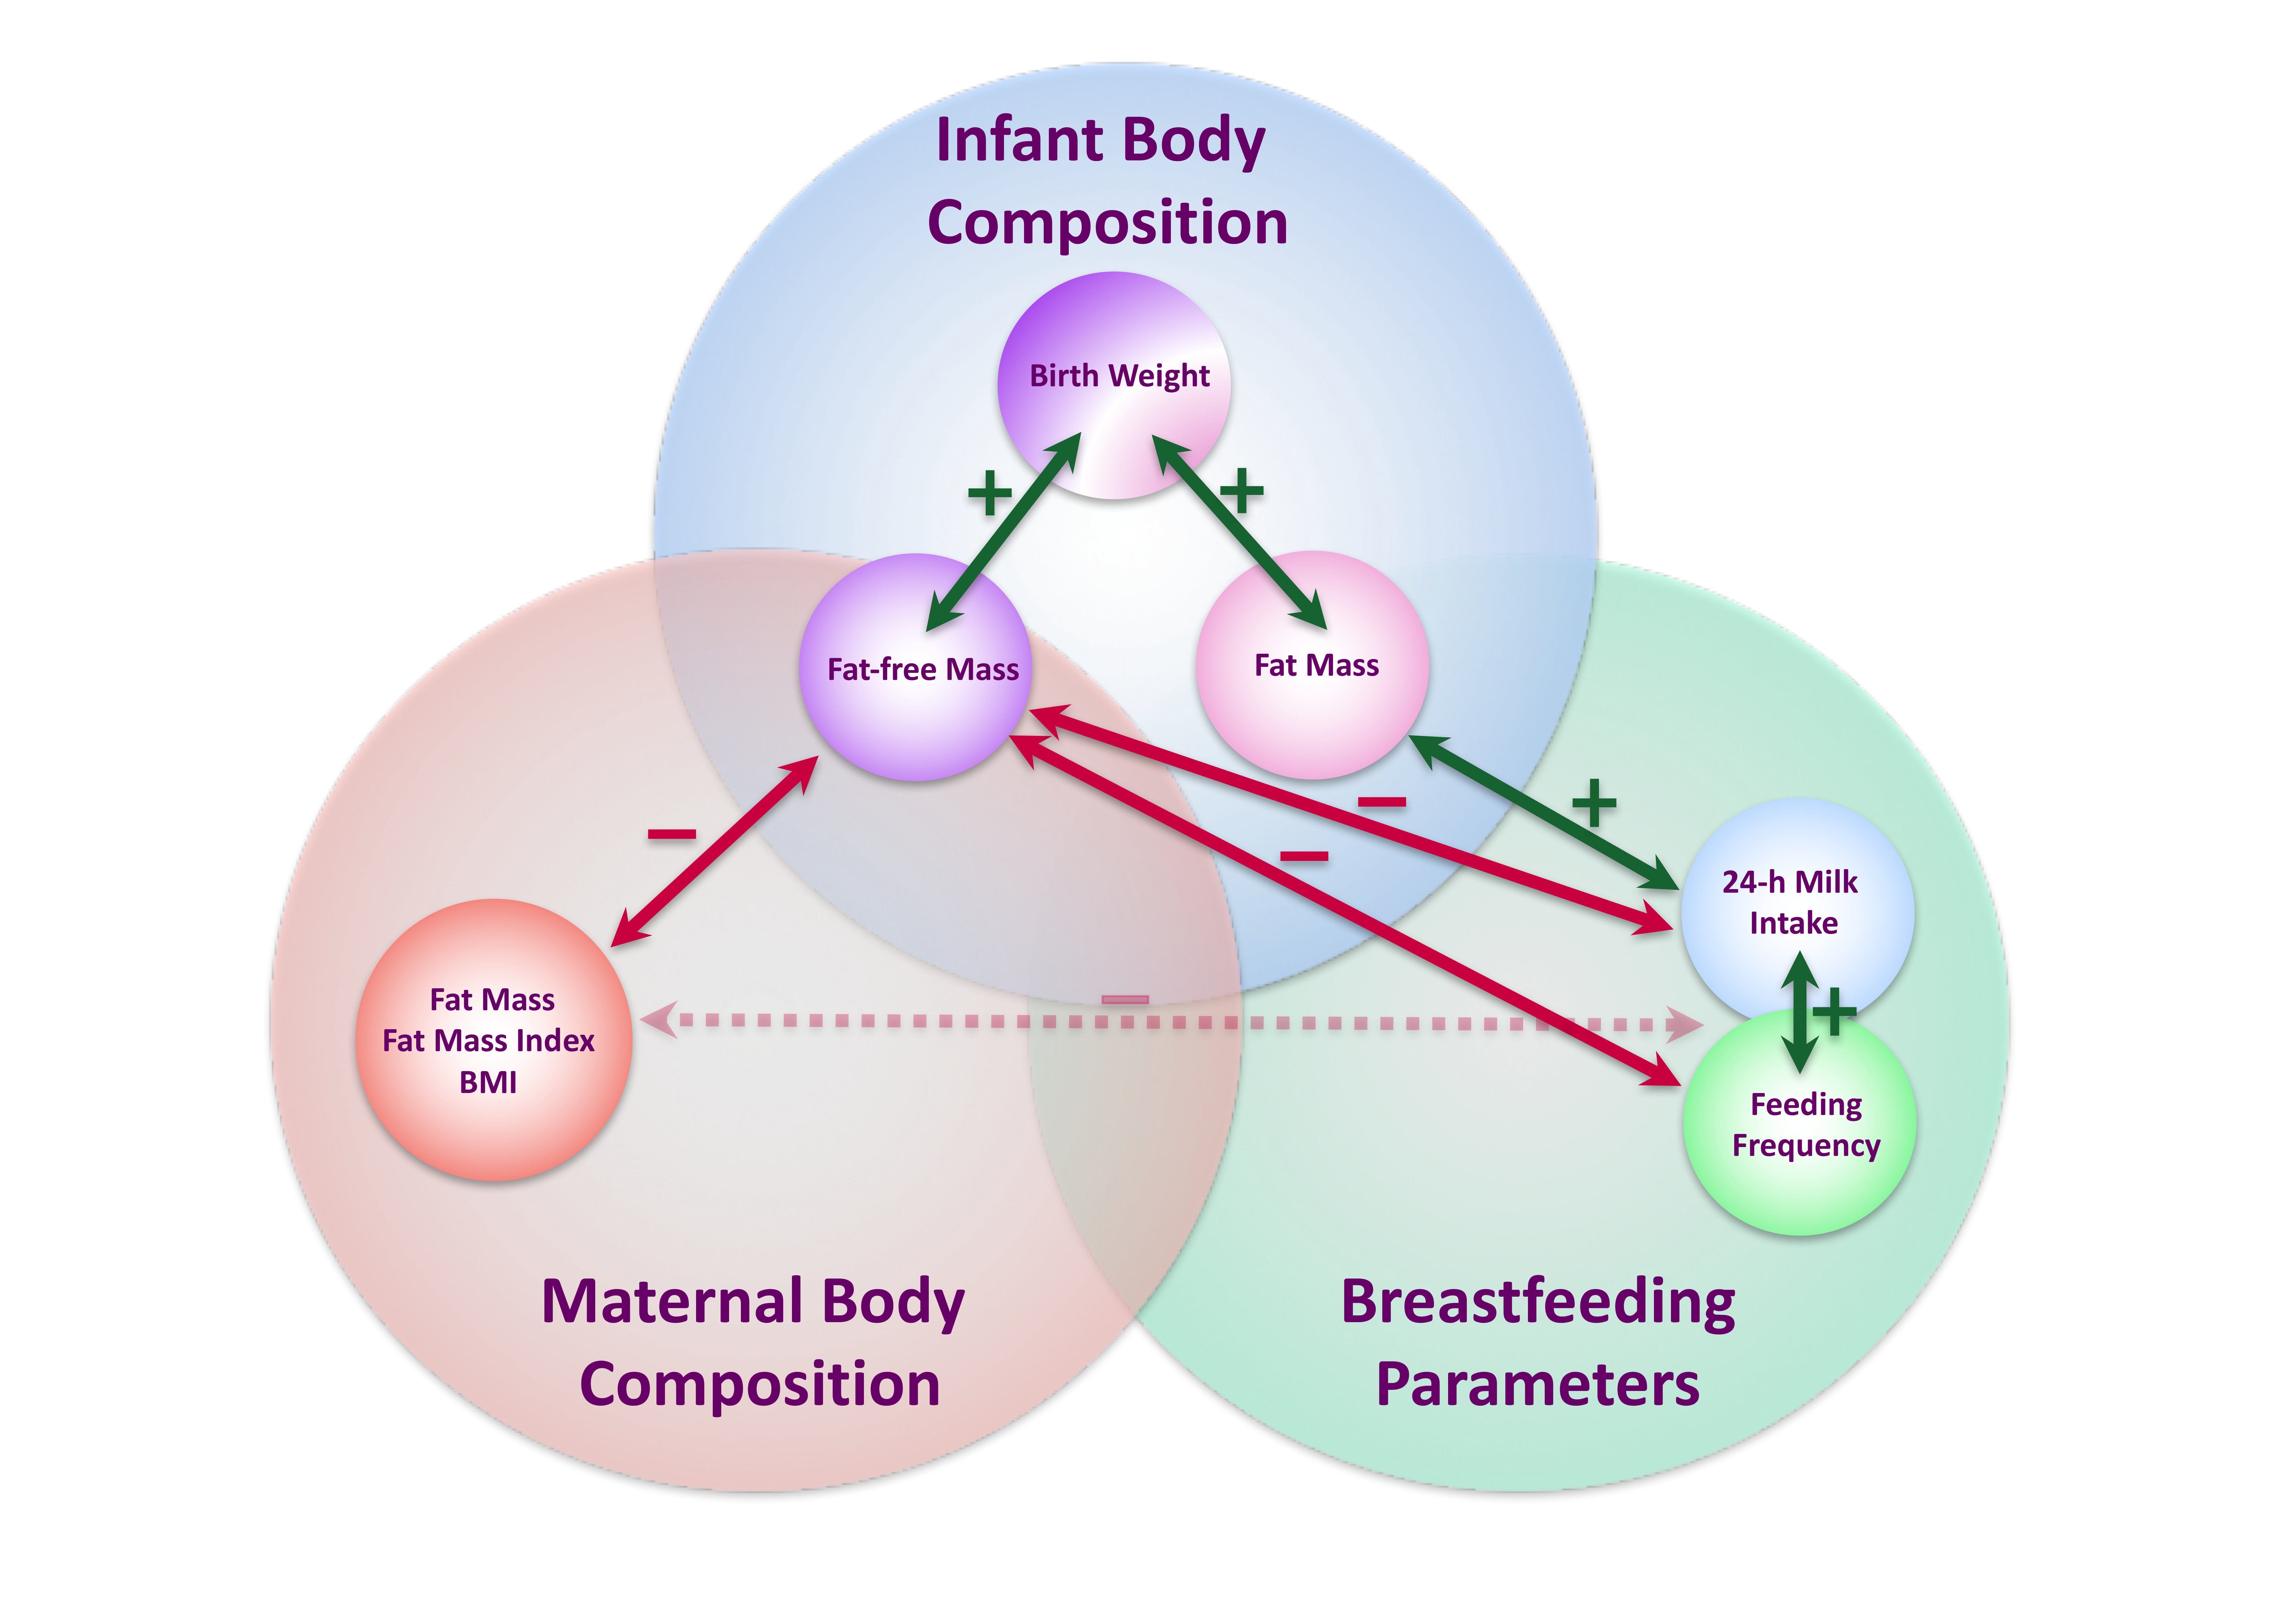
3.4. Infant Birth Weight and Maternal and Infant Body Composition
3.5. 24-H Milk Intake and Feeding Frequency
3.6. Longitudinal Changes in Maternal, Breastfeeding and Infant Characteristics
3.7. Relationships between Infant and Maternal Body Composition
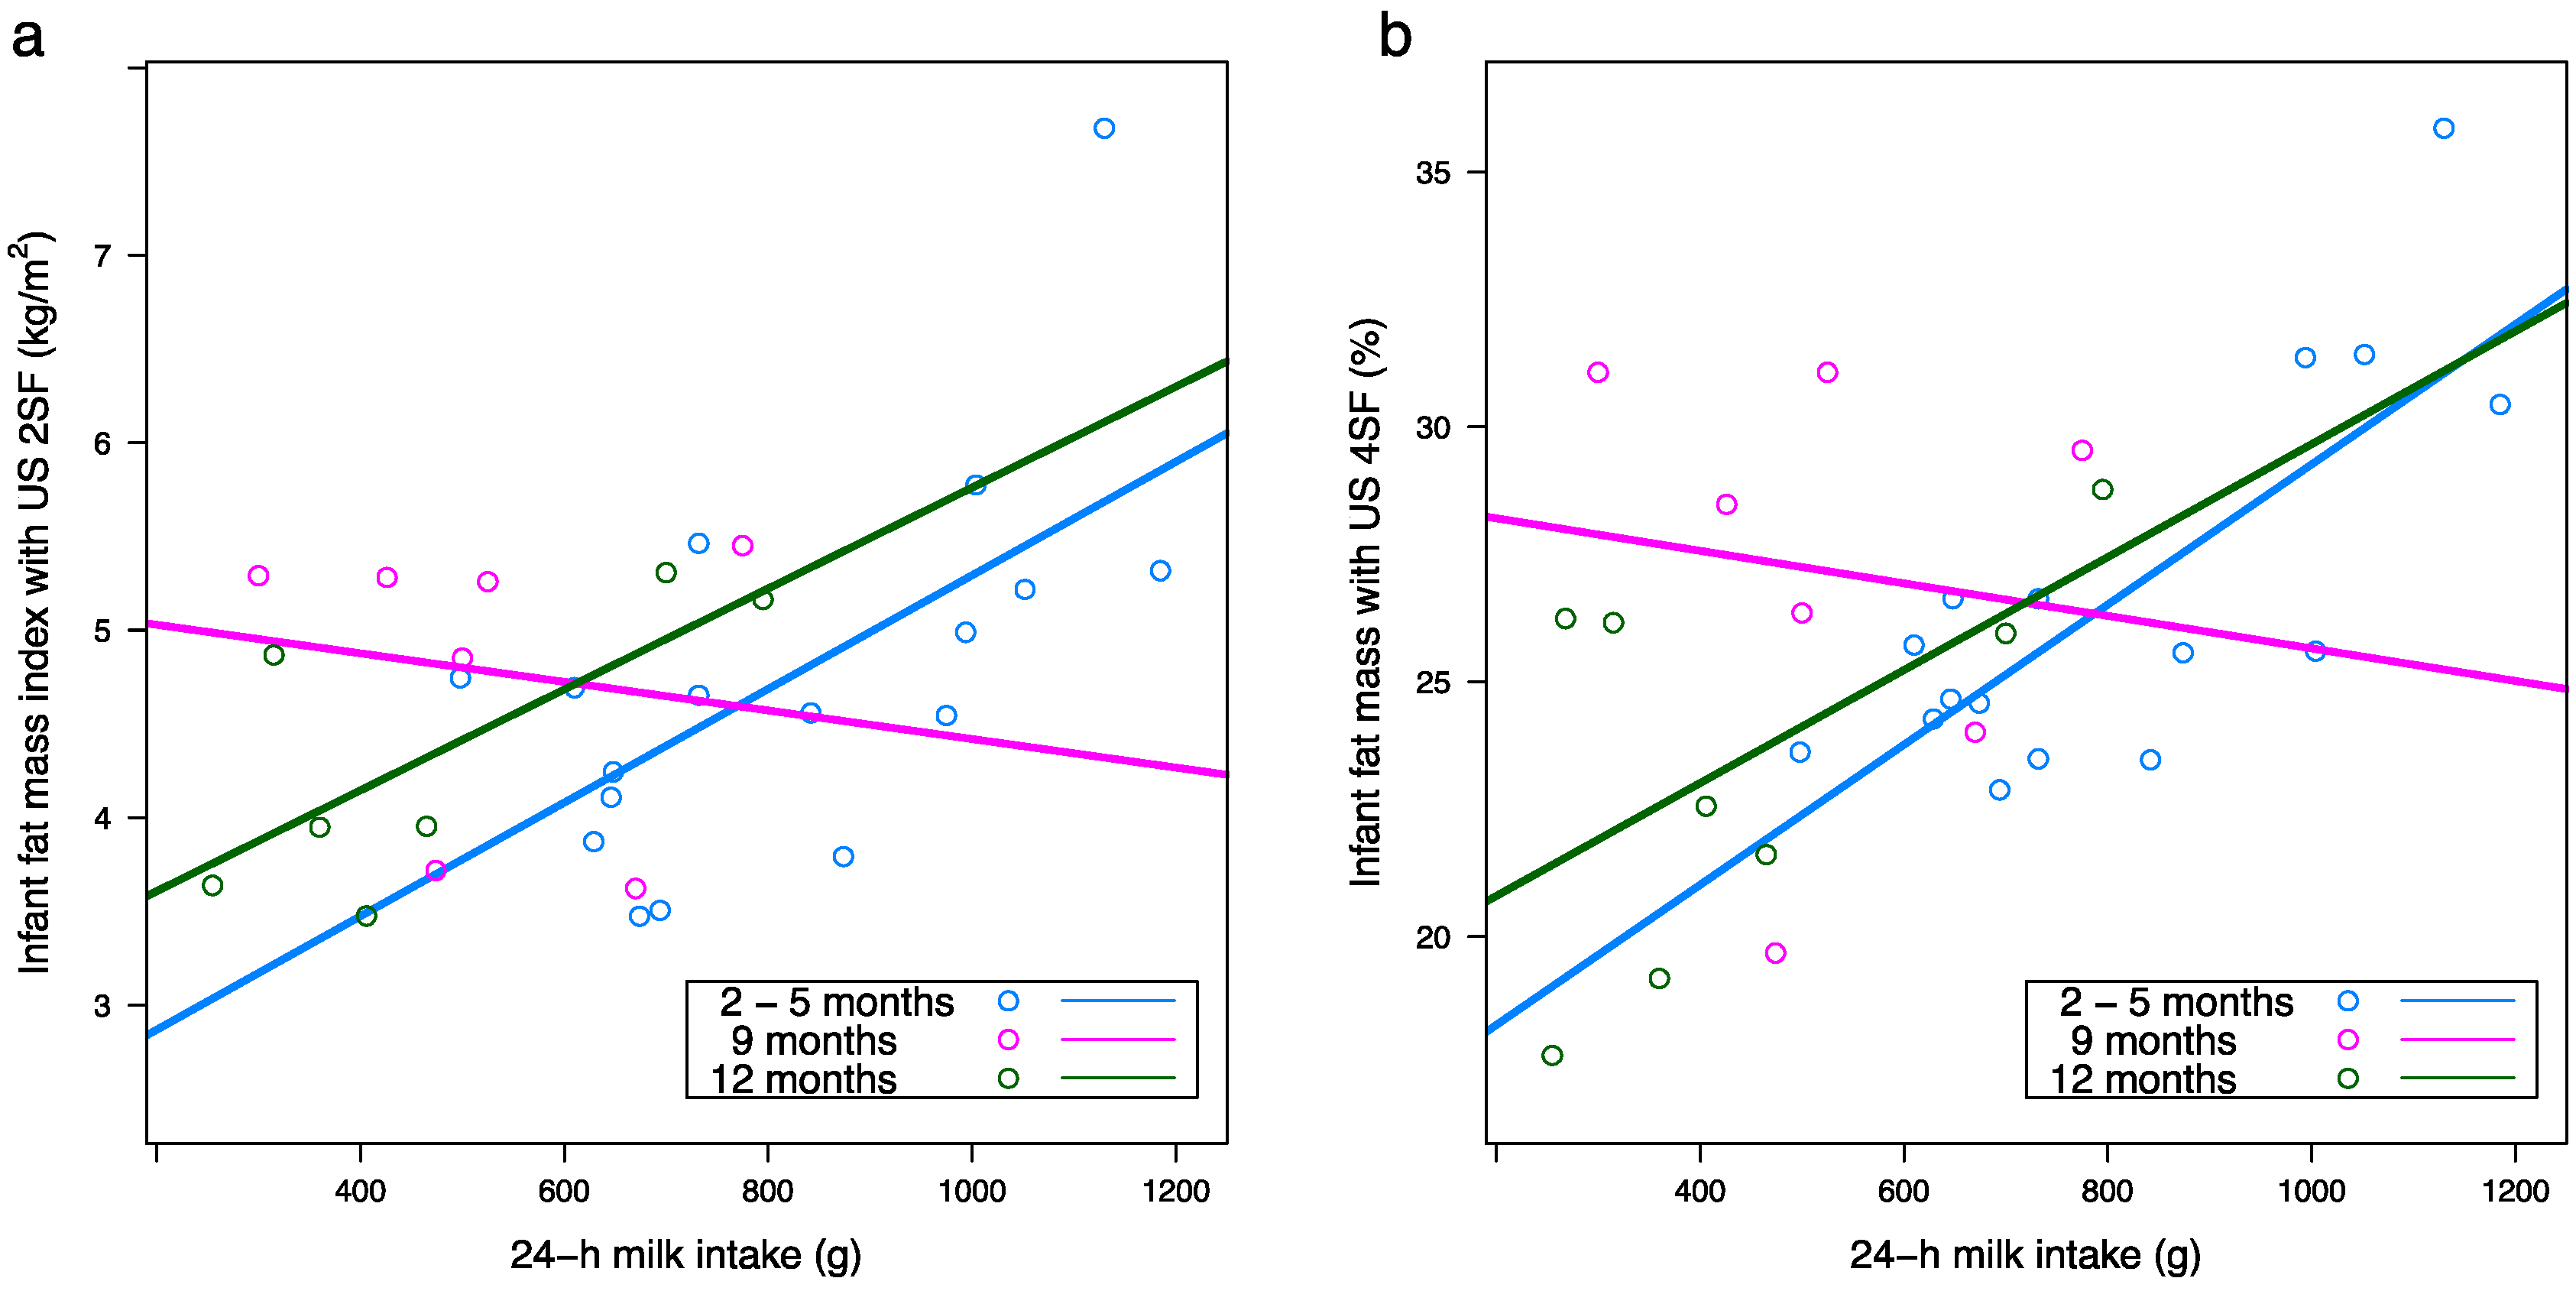
3.8. Infant Body Composition and Breastfeeding Parameters
3.9. Maternal Body Composition and Breastfeeding Parameters
4. Discussion
5. Conclusions
Supplementary Materials
Acknowledgments
Author Contributions
Conflicts of Interest
Appendix A

| Predictor | 2 Months | 5 Months | 9 Months | 12 Months | p-Value | ||||||
|---|---|---|---|---|---|---|---|---|---|---|---|
| Intercept (SE) | Slope (SE) | Intercept (SE) | Slope (SE) | Intercept (SE) | Slope (SE) | Intercept (SE) | Slope (SE) | Predictor | Infant Age (Months) | Interaction | |
| Infant fat-free mass with ultrasound 2 skinfolds (kg) | |||||||||||
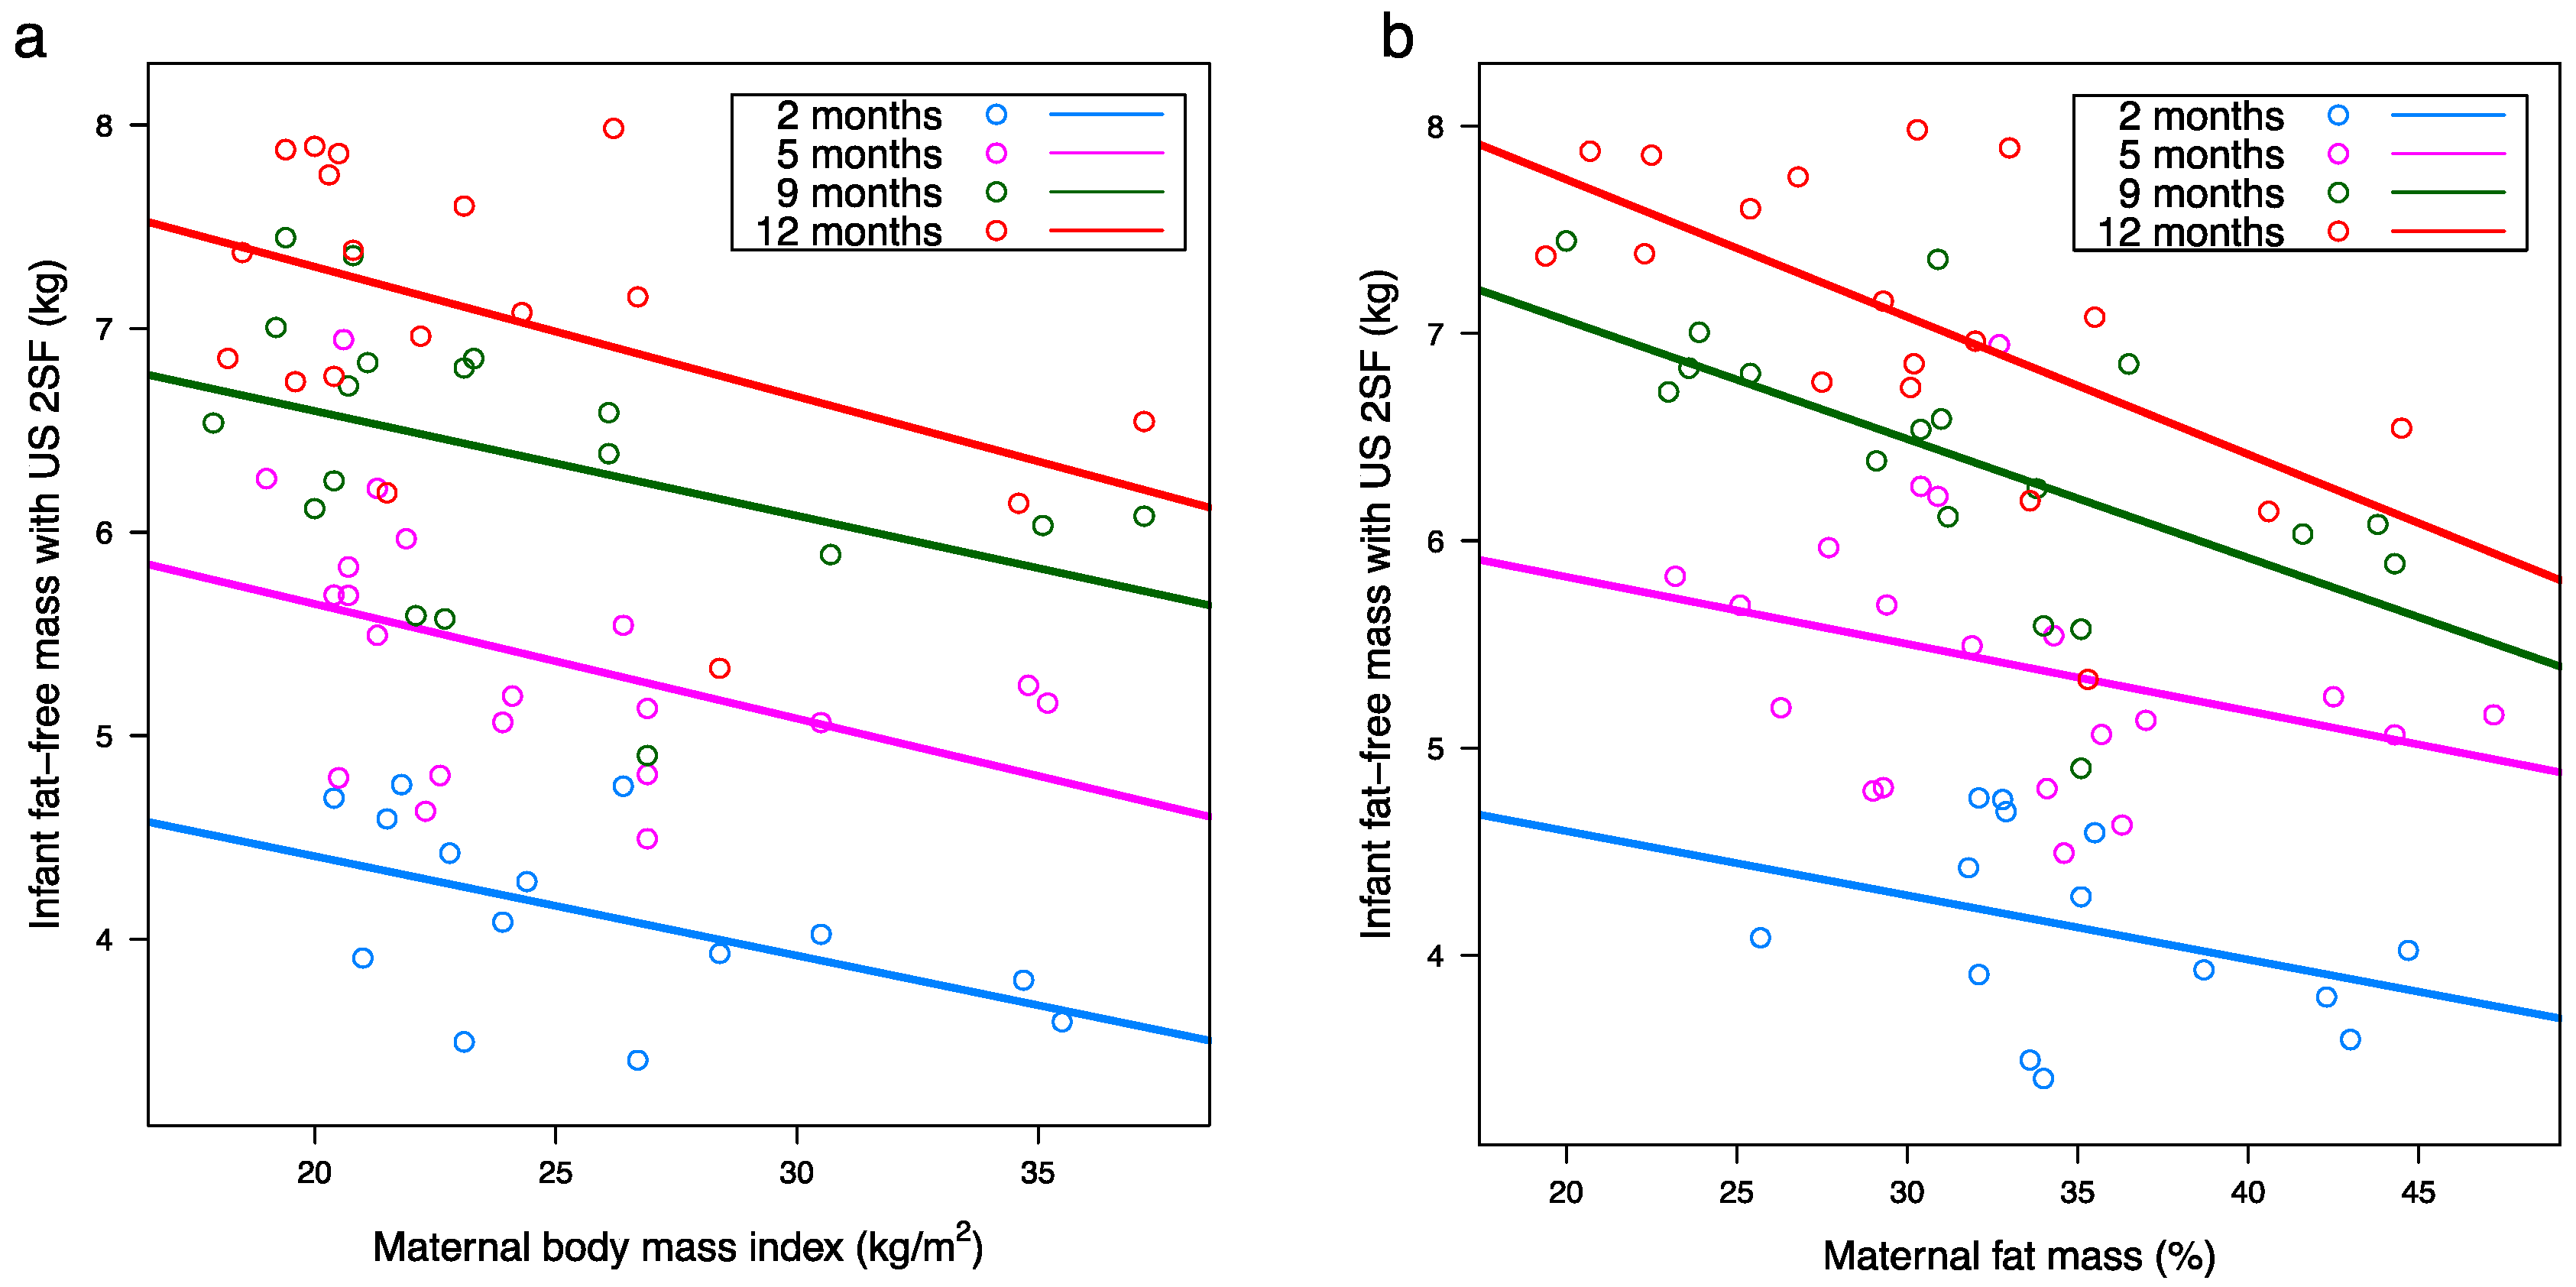
| Maternal BMI d (kg/m2) | 5.62 (0.79) a | −0.06 (0.03) | 6.81 (0.69) | −0.06 (0.03) | 7.78 (0.61) | −0.06 (0.03) | 8.55 (0.60) | −0.06 (0.03) | 0.007 b | <0.001 c | 0.99 c |
| Maternal FM d (%) | 5.30 (0.84) | −0.03 (0.02) | 6.22 (0.63) | −0.03 (0.02) | 7.87 (0.57) | −0.05 (0.02) | 8.68 (0.55) | −0.05 (0.02) | 0.004 | <0.001 | 0.40 |
| Maternal FM (kg) | 4.79 (0.40) | −0.03 (0.02) | 5.81 (0.32) | −0.02 (0.01) | 6.99 (0.31) | −0.03 (0.01) | 7.72 (0.29) | −0.03 (0.01) | 0.018 | <0.001 | 0.62 |
| Maternal FMI d (kg/m2) | 4.91 (0.43) | −0.09 (0.05) | 5.98 (0.35) | −0.07 (0.04) | 7.15 (0.32) | −0.09 (0.04) | 7.87 (0.31) | −0.11 (0.04) | 0.005 | <0.001 | 0.72 |
| Infant fat-free mass with ultrasound 4 skinfolds (kg) | |||||||||||
| Maternal BMI | 5.90 (0.84) | −0.07 (0.03) | 7.05 (0.74) | −0.07 (0.03) | 7.82 (0.66) | −0.06 (0.03) | 8.84 (0.65) | −0.07 (0.03) | 0.010 | <0.001 | 0.93 |
| Maternal FM (%) | 5.01 (0.88) | −0.03 (0.03) | 6.06 (0.67) | −0.02 (0.02) | 7.75 (0.63) | −0.04 (0.02) | 8.74 (0.60) | −0.05 (0.02) | 0.024 | <0.001 | 0.29 |
| Maternal FM (kg) | 4.82 (0.43) | −0.03 (0.02) | 5.86 (0.35) | −0.02 (0.01) | 7.01 (0.33) | −0.02 (0.01) | 7.90 (0.32) | −0.03 (0.01) | 0.033 | <0.001 | 0.54 |
| Maternal FMI d (kg/m2) | 4.93 (0.46) | −0.09 (0.05) | 6.03 (0.38) | −0.07 (0.04) | 7.17 (0.35) | −0.09 (0.04) | 8.05 (0.33) | −0.11 (0.04) | 0.011 | <0.001 | 0.71 |
| Infant fat-free mass with bioelectrical impedance spectroscopy (kg) | |||||||||||
| Maternal BMI | 5.76 (0.89) | −0.06 (0.03) | 6.54 (0.76) | −0.05 (0.03) | 7.85 (0.68) | −0.06 (0.03) | 8.32 (0.68) | −0.05 (0.03) | 0.030 | <0.001 | 0.99 |
| Maternal FMI d (kg/m2) | 4.93 (0.48) | −0.07 (0.05) | 5.73 (0.39) | −0.05 (0.04) | 7.16 (0.36) | −0.09 (0.04) | 7.72 (0.36) | −0.08 (0.04) | 0.037 | <0.001 | 0.79 |
| Infant fat-free mass index with ultrasound 2 skinfolds (kg/m2) | |||||||||||
| Maternal FM d (%) | 13.90 (1.56) | −0.04 (0.05) | 14.10 (1.14) | −0.04 (0.03) | 15.10 (1.04) | −0.07 (0.03) | 14.50 (1.00) | −0.06 (0.03) | 0.038 | 0.12 | 0.85 |
| Predictor | 2 Months | 5 Months | 9 Months | 12 Months | p-Value | ||||||
|---|---|---|---|---|---|---|---|---|---|---|---|
| Intercept (SE) | Slope (SE) | Intercept (SE) | Slope (SE) | Intercept (SE) | Slope (SE) | Intercept (SE) | Slope (SE) | Predictor | Infant Age (Months) | Interaction | |
| Infant body mass index (kg/m2) | |||||||||||
| 24-h milk intake (g) c | n/a c | n/a c | 15.20 (1.16) a | 0.003 (0.001) | 17.7 (1.25) | 0.001 (0.002) | 18.90 (0.90) | −0.003 (0.002) | 0.40 b | 0.61 | 0.018 b |
| Infant fat mass with ultrasound 2 skinfolds (%) | |||||||||||
| 24-h milk intake (g) | n/a | n/a | 17.20 (3.45) a | 0.01 (0.004) | 29.5 (4.72) | −0.005 (0.01) | 21.50 (3.03) | 0.01 (0.006) | 0.008 | 0.30 | 0.20 |
| Infant fat mass with ultrasound 4 skinfolds (%) | |||||||||||
| Feeding frequency SR d | 18.40 (5.71) | 3.06 (2.42) | 25.40 (2.91) | 0.32 (1.01) | 30.50 (2.73) | −1.21 (1.01) | 27.00 (2.01) | −0.64 (0.32) | 0.040 | 0.34 | 0.26 |
| Feeding frequency MP | n/a | n/a | 24.30 (5.49) | 0.29 (0.66) | 18.9 (6.50) | 1.53 (1.17) | 16.60 (3.17) | 1.52 (0.69) | 0.029 | 0.16 | 0.38 |
| 24-h milk intake (g) | n/a | n/a | 15.20 (3.30) | 0.01 (0.004) | 28.2 (4.46) | −0.002 (0.01) | 18.90 (2.87) | 0.01 (0.006) | <0.001 | 0.043 | 0.20 |
| Infant fat mass with ultrasound 2 skinfolds (kg) | |||||||||||
| 24-h milk intake (g) | n/a | n/a | 0.93 (0.37) | 0.001 (0.0004) | 2.53 (0.43) | −0.0002 (0.001) | 2.10 (0.28) | 0.001 (0.001) | 0.004 | <0.001 | 0.18 |
| Feeding frequency MP | n/a | n/a | 2.89 (0.57) | −0.11 (0.07) | 2.00 (0.56) | 0.08 (0.10) | 1.94 (0.30) | 0.12 (0.06) | 0.63 | 0.036 | 0.014 |
| Infant fat mass with ultrasound 4 skinfolds (kg) | |||||||||||
| 24-h milk intake (g) | n/a | n/a | 0.81 (0.37) | 0.001 (0.0004) | 2.37 (0.45) | 0.0001 (0.001) | 1.88 (0.29) | 0.001 (0.001) | 0.002 | <0.001 | 0.28 |
| Infant fat mass with bioelectrical impedance spectroscopy (kg) | |||||||||||
| 24-h milk intake (g) | n/a | n/a | 1.20 (0.44) | 0.001 (0.001) | 1.79 (0.57) | 0.001 (0.001) | 2.22 (0.41) | 0.0004 (0.001) | 0.045 | 0.030 | 0.65 |
| Infant fat mass index with ultrasound 2 skinfolds (kg/m2) | |||||||||||
| 24-h milk intake (g) | n/a | n/a | 2.17 (0.79) | 0.003 (0.001) | 4.88 (1.0) | 0.0001 (0.002) | 3.57 (0.72) | 0.002 (0.001) | 0.001 | 0.060 | 0.25 |
| Feeding frequency MP | n/a | n/a | 4.39 (1.28) | 0.04 (0.16) | 2.90 (1.57) | 0.35 (0.28) | 2.55 (0.82) | 0.37 (0.17) | 0.046 | 0.42 | 0.32 |
| Infant fat mass index with ultrasound 4 skinfolds (kg/m2) | |||||||||||
| Feeding frequency MP | n/a | n/a | 3.81 (1.34) | 0.12 (0.16) | 2.82 (1.58) | 0.39 (0.28) | 2.36 (0.82) | 0.36 (0.17) | 0.025 | 0.14 | 0.52 |
| 24-h milk intake (g) | n/a | n/a | 1.78 (0.77) | 0.004 (0.001) | 4.76 (1.03) | 0.0003 (0.002) | 2.91 (0.74) | 0.002 (0.002) | <0.001 | 0.022 | 0.23 |
| Infant fat mas index with bioelectrical impedance spectroscopy (kg/m2) | |||||||||||
| 24-h milk intake (g) | n/a | n/a | 2.71 (0.92) | 0.003 (0.001) | 3.56 (1.18) | 0.001 (0.002) | 4.37 (0.85) | 0.00003 (0.002) | 0.029 | 0.75 | 0.31 |
| Infant fat-free mass with ultrasound 2 skinfolds (kg) | |||||||||||
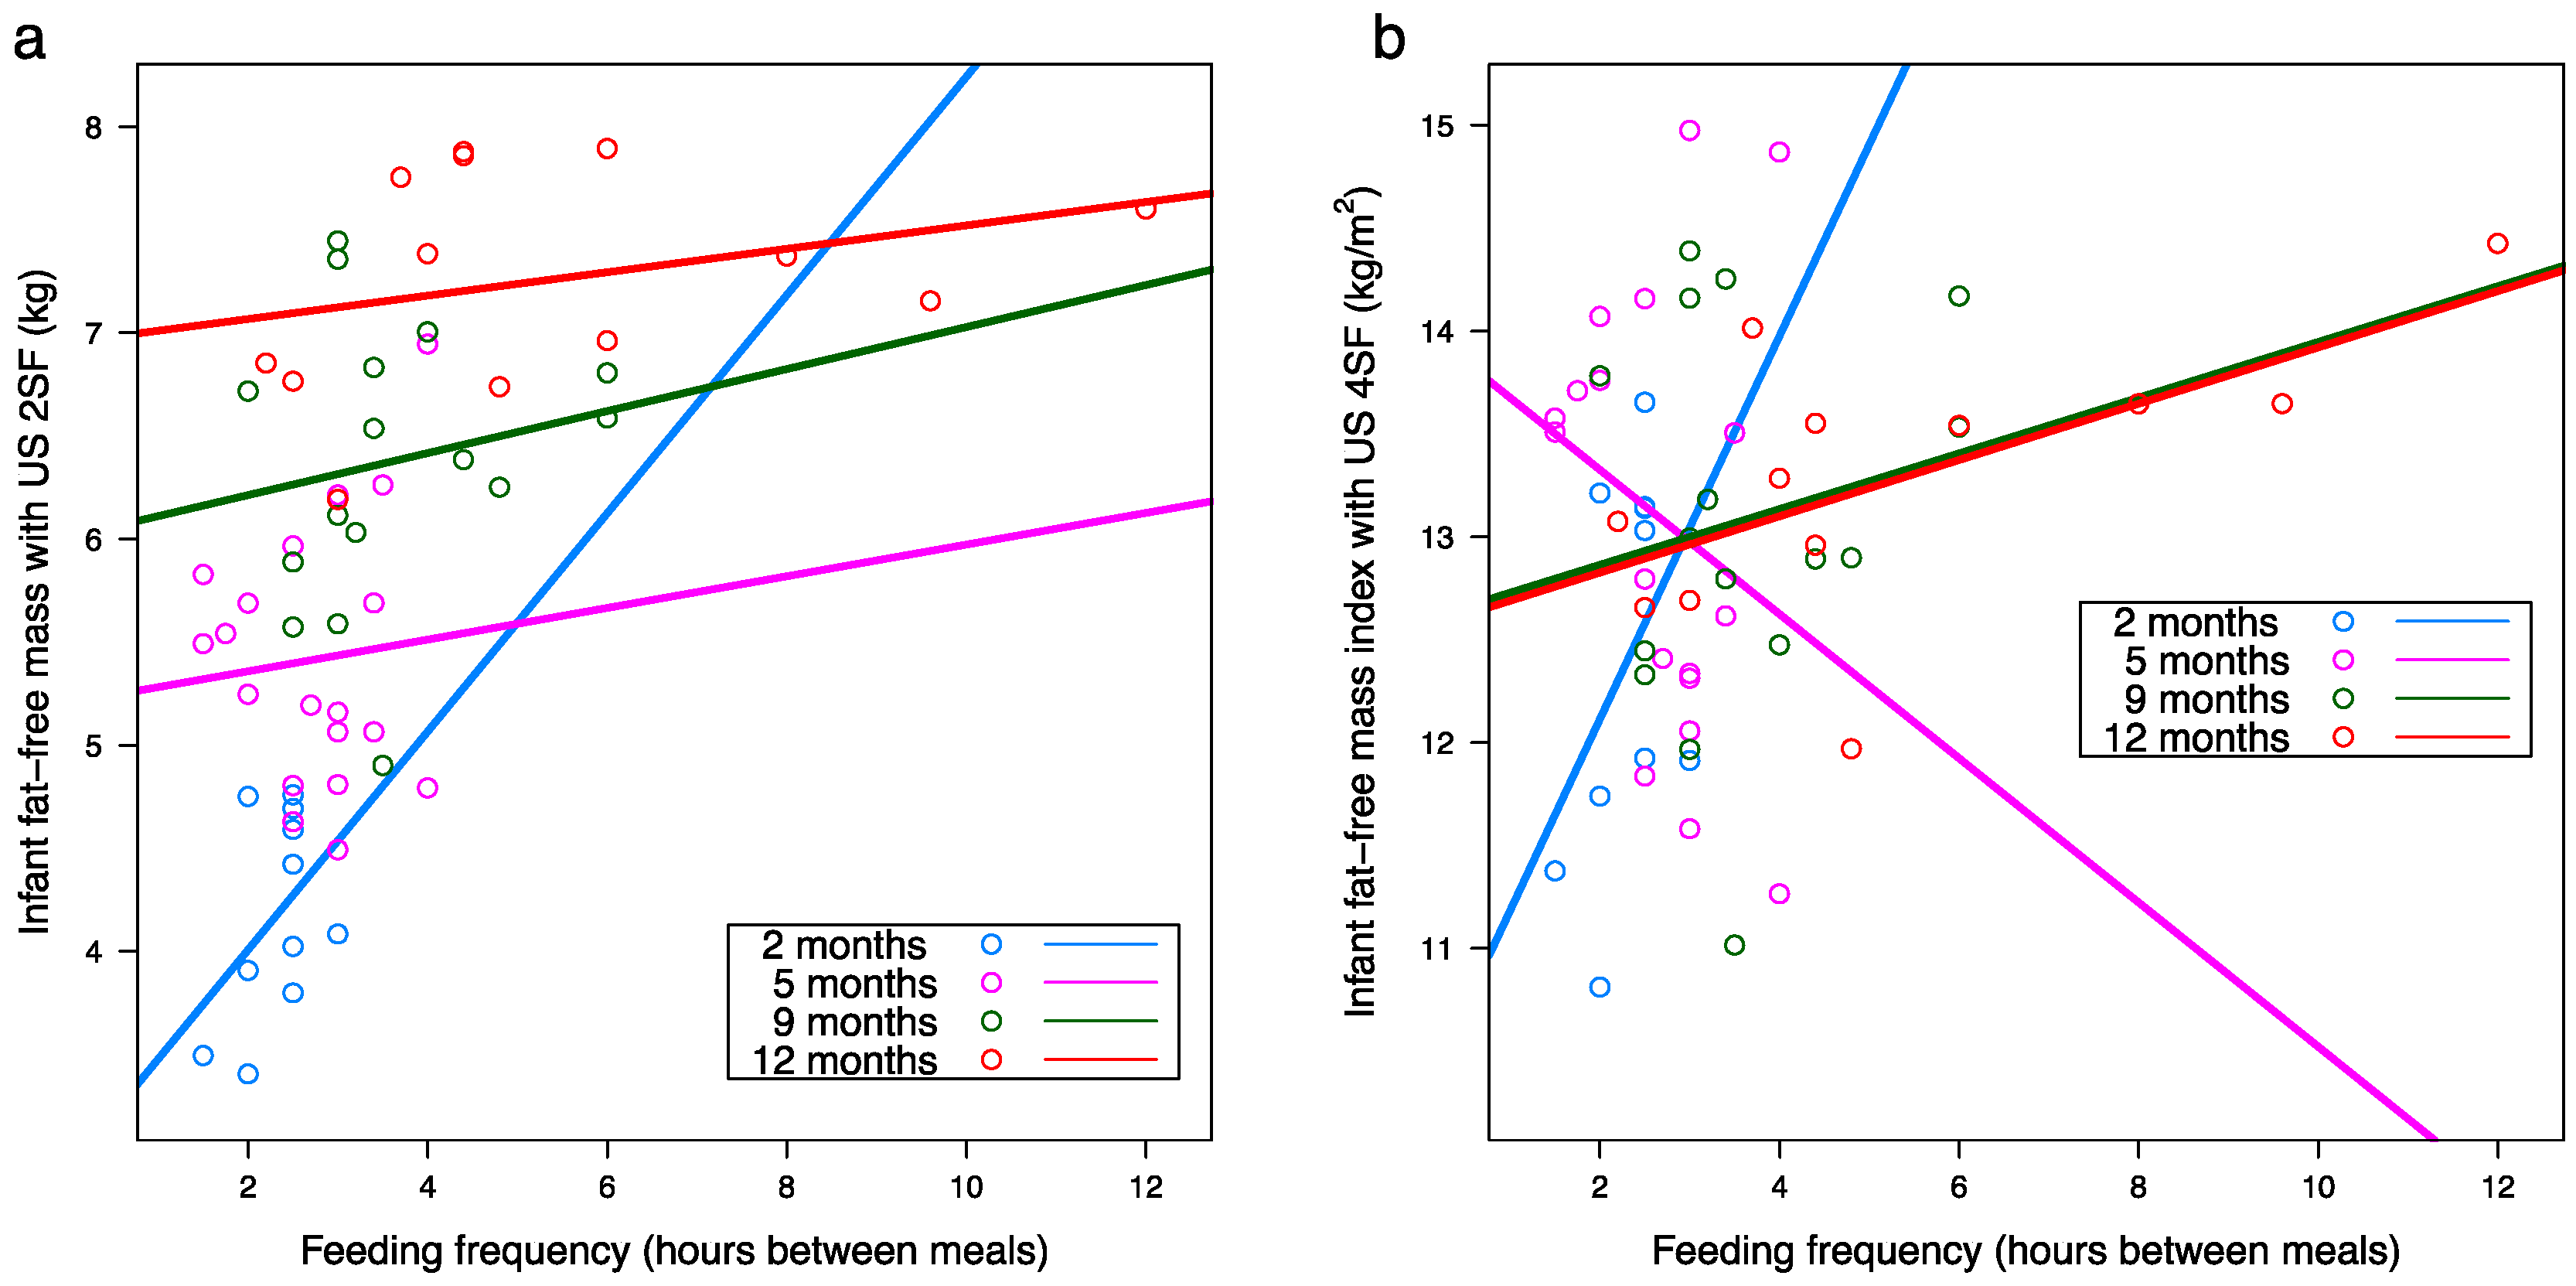
| Feeding frequency SR | 4.41 (0.61) | −0.09 (0.25) | 4.94 (0.32) | 0.17 (0.11) | 5.82 (0.31) | 0.16 (0.11) | 6.58 (0.24) | 0.10 (0.03) | 0.001 | <0.001 | 0.67 |
| Infant fat-free mass with ultrasound 4 skinfolds (kg) | |||||||||||
| Feeding frequency SR | 4.14 (0.51) | 0.04 (0.21) | 5.19 (0.28) | 0.09 (0.09) | 5.56 (0.27) | 0.24 (0.09) | 6.58 (0.22) | 0.13 (0.03) | <0.001 | <0.001 | 0.25 |
| Infant fat-free mass with bioelectrical impedance spectroscopy (kg) | |||||||||||
| Feeding frequency SR | 4.37 (0.75) | −0.001 (0.32) | 5.14 (0.41) | 0.06 (0.14) | 5.69 (0.37) | 0.22 (0.14) | 6.74 (0.29) | 0.08 (0.04) | 0.019 | <0.001 | 0.48 |
| Infant fat-free mass index with ultrasound 2 skinfolds (kg/m2) | |||||||||||
| Feeding frequency SR | 12.10 (1.26) | 0.19 (0.53) | 13.10 (0.67) | −0.07 (0.23) | 12.80 (0.61) | 0.08 (0.23) | 11.90 (0.46) | 0.19 (0.07) | 0.013 | 0.20 | 0.68 |
| Infant fat-free mass index with ultrasound 4 skinfolds (kg/m2) | |||||||||||
| Feeding frequency SR | 11.50 (1.01) | 0.44 (0.43) | 13.40 (0.57) | −0.13 (0.19) | 12.20 (0.51) | 0.26 (0.19) | 11.90 (0.39) | 0.25 (0.06) | <0.001 | 0.031 | 0.25 |
| 24-h milk intake (g) | n/a | n/a | 13.60 (0.80) | −0.001 (0.001) | 13.30 (0.82) | −0.001 (0.002) | 15.40 (0.60) | −0.004 (0.001) | 0.015 | 0.057 | 0.024 |
| Infant fat-free mass index with bioelectrical impedance spectroscopy (kg/m2) | |||||||||||
| Feeding frequency SR | 12.20 (1.15) | 0.30 (0.49) | 13.10 (0.62) | −0.15 (0.21) | 12.40 (0.57) | 0.21 (0.21) | 12.20 (0.44) | 0.15 (0.06) | 0.017 | 0.16 | 0.49 |
| Changes in Infant Characteristic | Months after Birth | |||||
|---|---|---|---|---|---|---|
| 5 and 2 | 9 and 2 | 12 and 2 | 9 and 5 | 12 and 5 | 12 and 9 | |
| 24-h milk intake between 2 and 5 months e | ||||||
| BMI d (kg/m2) | 0.014 a,c 0.003 ± 0.001 b | 0.54 0.001 ± 0.002 | 0.94 0.0002 ± 0.002 | 0.55 −0.001 ± 0.001 | 0.29 −0.002 ± 0.002 | 0.35 −0.001 ± 0.001 |
| Fat-free mass US 2SF d (kg) | 0.65 −0.004 ± 0.001 | 0.013 0.002 ± 0.001 | 0.10 0.002 ± 0.001 | 0.56 0.004 ± 0.001 | 0.56 0.004 ± 0.001 | 0.88 0.0 ± 0.0 |
| Fat-free mass US 4SF d (kg) | 0.35 0.001 ± 0.001 | 0.004 0.003 ± 0.001 | 0.007 0.003 ± 0.001 | 0.38 0.001 ± 0.001 | 0.29 0.001 ± 0.001 | 0.26 0.0004 ± 0.003 |
| Fat-free mass BIS d (kg) | 0.096 0.001 ± 0.0003 | 0.14 0.002 ± 0.001 | 0.009 0.003 ± 0.001 | 0.46 0.001 ± 0.001 | 0.20 0.001 ± 0.001 | 0.23 0.001 ± 0.001 |
| Fat-free mass index US 4SF (kg/m2) | 0.068 0.003 ± 0.001 | 0.092 0.003 ± 0.001 | 0.035 0.005 ± 0.002 | 0.63 0.001 ± 0.001 | 0.84 0.0003 ± 0.001 | 0.91 0.0001 ± 0.001 |
| Fat-free mass index BIS (kg/m2) | 0.031 0.002 ± 0.001 | 0.47 0.001 ± 0.002 | 0.37 0.002 ± 0.002 | 0.68 0.001 ± 0.001 | 0.92 0.0001 ± 0.001 | 0.68 0.001 ± 0.001 |
| Fat mass US 2SF (kg) | 0.037 0.002 ± 0.001 | 0.46 0.001 ± 0.001 | 0.47 0.001 ± 0.001 | 0.77 −0.0002 ± 0.001 | 0.60 −0.0003 ± 0.001 | 0.97 0.0 ± 0.0 |
| Fat mass index US 2SF (kg/m2) | 0.033 0.004 ± 0.002 | 0.98 0.0 ± 0.0 | 0.87 −0.0004 ± 0.002 | 0.50 −0.001 ± 0.001 | 0.25 −0.002 ± 0.001 | 0.39 −0.001 ± 0.001 |
| Fat mass index US 4SF (kg/m2) | 0.47 0.001 ± 0.001 | 0.23 −0.003 ± 0.002 | 0.19 −0.004 ± 0.003 | 0.38 −0.001 ± 0.001 | 0.074 −0.002 ± 0.001 | 0.047 −0.001 ± 0.001 |
| Fat mass index BIS (kg/m2) | 0.065 0.002 ± 0.001 | 0.97 0.0 ± 0.0 | 0.46 −0.001 ± 0.001 | 0.37 −0.001 ± 0.001 | 0.034 −0.003 ± 0.001 | 0.21 −0.002 ± 0.001 |
| 24-h milk intake at 12 months e | ||||||
| Fat-free mass index US 2SF (kg/m2) | n/a f | n/a f | 0.14 −0.005 ± 0.002 | n/a f | 0.003 −0.006 ± 0.001 | 0.064 −0.003 ± 0.001 |
| Fat-free mass index US 4SF (kg/m2) | n/a | n/a | 0.31 −0.005 ± 0.004 | n/a | 0.0004 −0.005 ± 0.0004 | 0.18 −0.003 ± 0.002 |
| Fat mass US 2SF (kg) | n/a | n/a | 0.023 0.002 ± 0.001 | n/a | 0.17 0.001 ± 0.001 | 0.41 0.0003 ± 0.0004 |
| Fat mass US 2SF (%) | n/a | n/a | 0.049 0.029 ± 0.009 | n/a | 0.11 0.013 ± 0.007 | 0.60 0.003 ± 0.006 |
| Changes in Infant Characteristic | Months after Birth | |||||
|---|---|---|---|---|---|---|
| 5 and 2 | 9 and 2 | 12 and 2 | 9 and 5 | 12 and 5 | 12 and 9 | |
| Self-reported feeding frequency at 2 months e | ||||||
| BMI d (kg/m2) | 0.83 a 0.14 ± 064 b | 0.067 −1.95 ± 0.92 | 0.42 −0.99 ± 1.15 | 0.013 c −2.09 ± 0.66 | 0.25 −1.13 ± 0.87 | 0.027 1.03 ± 0.37 |
| Fat mass US 4SF d (%) | 0.55 1.34 ± 2.14 | 0.058 −7.19 ± 3.25 | 0.25 −4.67 ± 3.79 | 0.027 −9.11 ± 3.37 | 0.13 −5.80 ± 3.40 | 0.28 3.20 ± 2.74 |
| Fat mass US 4SF (kg) | 0.37 0.14 ± 0.15 | 0.12 −0.59 ± 0.34 | 0.23 −0.44 ± 0.33 | 0.028 −0.76 ± 0.28 | 0.076 −0.56 ± 0.28 | 0.42 0.17 ± 0.20 |
| Fat mass index US 4SF (kg/m2) | 0.28 0.40 ± 0.35 | 0.039 −1.73 ± 0.70 | 0.27 −0.97 ± 0.81 | 0.009 −2.13 ± 0.62 | 0.094 −1.35 ± 0.70 | 0.14 0.83 ± 0.49 |
| Self-reported feeding frequency at 9 months e | ||||||
| Fat-free mass US 4SF (kg) | n/a g | 0.055 0.21 ± 0.10 | 0.25 0.21 ± 0.17 | 0.003 0.25 ± 0.07 | 0.13 0.18 ± 0.11 | 0.93 −0.01 ± 0.09 |
| Fat-free mass index US 4SF (kg/m2) | n/a | 0.10 0.29 ± 0.16 | 0.37 0.29 ± 0.31 | 0.014 0.36 ± 0.13 | 0.025 0.48 ± 0.19 | 0.49 0.13 ± 0.18 |
| Self-reported feeding frequency at 12 months e | ||||||
| BMI (kg/m2) | n/a g | n/a g | 0.45 0.15 ± 0.18 | n/a g | 0.12 0.21 ± 0.12 | 0.044 0.14 ± 0.06 |
| Fat-free mass US 2SF d (kg) | n/a | n/a | 0.031 0.13 ± 0.04 | n/a | 0.022 0.12 ± 0.05 | 0.43 0.03 ± 0.03 |
| Fat-free mass US 4SF (kg) | n/a | n/a | 0.047 0.15 ± 0.06 | n/a | 0.001 0.15 ± 0.03 | 0.21 0.04 ± 0.03 |
| Fat-free mass index US 2SF (kg/m2) | n/a | n/a | 0.024 0.24 ± 0.07 | n/a | 0.020 0.24 ± 0.09 | 0.052 0.12 ± 0.06 |
| Fat-free mass index US 4SF (kg/m2) | n/a | n/a | 0.043 0.31 ± 0.10 | n/a | 0.003 0.27 ± 0.07 | 0.073 0.15 ± 0.08 |
| Fat-free mass index BIS d (kg/m2) | n/a | n/a | 0.051 0.25 ± 0.09 | n/a | 0.030 0.16 ± 0.06 | 0.37 0.07 ± 0.07 |
| Fat mass US 4SF (%) | n/a | n/a | 0.043 −1.05 ± 0.39 | n/a | 0.11 −0.67 ± 0.38 | 0.44 −0.26 ± 0.32 |
| 24-h MP feeding frequency between 2 and 5 months f | ||||||
| Fat-free mass index US 2SF (kg/m2) | 0.028 0.45 ± 0.17 | 0.16 −0.27 ± 0.17 | 0.52 −0.17 ± 0.25 | 0.13 −0.28 ± 0.17 | 0.29 −0.21 ± 0.19 | 0.64 0.06 ± 0.12 |
| Fat-free mass index US 4SF (kg/m2) | 0.012 0.45 ± 0.13 | 0.51 −0.16 ± 0.23 | 0.80 −0.09 ± 0.36 | 0.065 −0.25 ± 0.12 | 0.63 −0.09 ± 0.18 | 0.46 0.11 ± 0.15 |
| Fat mass US 2SF (%) | 0.39 −1.60 ± 1.75 | 0.24 1.20 ± 0.94 | 0.48 1.34 ± 1.81 | 0.012 2.23 ± 0.78 | 0.068 1.70 ± 0.86 | 0.21 −0.51 ± 0.38 |
| Fat mass US 4SF (%) | 0.23 −0.96 ± 0.73 | 0.53 0.93 ± 1.38 | 0.62 0.90 ± 1.73 | 0.010 2.09 ± 0.69 | 0.12 1.26 ± 0.77 | 0.086 −0.76 ± 0.41 |
| Fat mass US 2SF (kg) | 0.62 −0.08 ± 0.15 | 0.23 0.14 ±0.10 | 0.48 0.13 ± 0.17 | 0.007 0.21 ± 0.07 | 0.033 0.17 ± 0.07 | 0.34 −0.04 ± 0.04 |
| Fat mass US 4SF (kg) | 0.81 −0.01 ± 0.05 | 0.24 0.14 ± 0.11 | 0.38 0.12 ± 0.13 | 0.006 0.21 ± 0.06 | 0.054 0.14 ± 0.07 | 0.17 −0.05 ± 0.04 |
| Fat mass index US 2SF (kg/m2) | 0.64 −0.16 ± 0.32 | 0.40 0.20 ± 0.23 | 0.40 0.30 ± 0.34 | 0.016 0.44 ± 0.16 | 0.11 0.33 ± 0.19 | 0.22 −0.11 ± 0.08 |
| Fat mass index US 4SF (kg/m2) | 0.81 −0.03 ± 0.13 | 0.53 0.19 ± 0.28 | 0.60 0.20 ± 0.36 | 0.023 0.42 ± 0.16 | 0.17 0.26 ± 0.18 | 0.053 −0.16 ± 0.08 |
| 24-h MP feeding frequency at 9 months f | ||||||
| Fat-free mass US 2SF (kg) | n/a g | 0.030 −0.28 ± 0.05 | 0.33 −0.32 ± 0.28 | 0.013 −0.33 ± 0.09 | 0.16 −0.33 ± 0.20 | 0.85 −0.03 ± 0.15 |
| Fat-free mass index US 4SF (kg/m2) | n/a | 0.33 −0.45 ± 0.35 | 0.43 −0.55 ± 0.57 | 0.14 −0.35 ± 0.19 | 0.044 −0.68 ± 0.23 | 0.15 −0.35 ± 0.20 |
| 24-h MP feeding frequency at 12 months f | ||||||
| Fat-free mass US 2SF (kg) | n/a g | n/a g | 0.029 −0.23 ± 0.06 | n/a g | 0.097 −0.20 ± 0.11 | 0.55 −0.05 ± 0.07 |
| Fat-free mass index US 2SF (kg/m2) | n/a | n/a | 0.070 −0.41 ± 0.12 | n/a | 0.037 −0.48 ± 0.18 | 0.45 −0.13 ± 0.15 |
| Fat mass US 2SF (%) | n/a | n/a | 0.13 2.00 ± 0.97 | n/a | 0.004 2.12 ± 0.52 | 0.96 0.03 ± 0.61 |
| Fat mass US 2SF (kg) | n/a | n/a | 0.090 0.15 ± 0.06 | n/a | 0.009 0.19 ± 0.05 | 0.90 0.01 ± 0.04 |
| Fat mass index US 2SF (kg/m2) | n/a | n/a | 0.30 0.24 ± 0.17 | n/a | 0.015 0.41 ± 0.12 | 0.75 −0.04 ± 0.11 |
| Changes in Maternal Characteristic | Months after Birth | |||||
|---|---|---|---|---|---|---|
| 5 and 2 | 9 and 2 | 12 and 2 | 9 and 5 | 12 and 5 | 12 and 9 | |
| 24-h milk intake at 9 months e | ||||||
| Fat mass BIS d (%) | n/a g | 0.075 a 0.04 ± 0.01 b | 0.33 0.01 ± 0.01 | 0.042 c −0.01 ± 0.004 | 0.013 −0.02 ± 0.005 | 0.16 −0.007 ± 0.004 |
| Fat mass BIS (kg) | n/a | 0.026 0.04 ± 0.01 | 0.28 0.01 ± 0.01 | 0.10 −0.006 ± 0.003 | 0.011 −0.01 ± 0.003 | 0.16 −0.005 ± 0.003 |
| Fat mass index BIS (kg/m2) | n/a | 0.020 0.02 ± 0.002 | 0.26 0.003 ± 0.002 | 0.11 −0.002 ± 0.001 | 0.009 −0.004 ± 0.001 | 0.15 −0.002 ± 0.001 |
| Self-reported feeding frequency at 12 months f | ||||||
| BMI d (kg/m2) | n/a g | n/a g | 0.025 0.15 ± 0.05 | n/a g | 0.96 −0.003 ± 0.05 | 0.74 0.02 ± 0.05 |
| Fat mass BIS (%) | n/a | n/a | 0.048 0.38 ± 0.15 | n/a | 0.83 0.07 ± 0.32 | 0.63 0.10 ± 0.20 |
| Fat mass BIS (kg) | n/a | n/a | 0.020 0.38 ± 0.11 | n/a | 0.71 0.08 ± 0.20 | 0.59 0.08 ± 0.15 |
| Fat mass index BIS (kg/m2) | n/a | n/a | 0.014 0.12 ± 0.03 | n/a | 0.78 0.02 ± 0.07 | 0.58 0.03 ± 0.05 |
References
- Geddes, D.; Prescott, S. Developmental origins of health and disease: The role of human milk in preventing disease in the 21(st) century. J. Hum. Lact. 2013, 29, 123–127. [Google Scholar] [CrossRef] [PubMed]
- Prescott, S.L. Early nutrition as a major determinant of ‘immune health’: Implications for allergy, obesity and other noncommunicable diseases. In Preventive Aspects of Early Nutrition; Fewtrell, M.S., Haschke, F., Prescott, S.L., Eds.; Vevey/S. Kager AG: Basel, Switzerland, 2016; Volume 85, pp. 1–17. [Google Scholar]
- Socha, P.; Hellmuth, C.; Gruszfeld, D.; Demmelmair, H.; Rzehak, P.; Grote, V.; Weber, M.; Escribano, J.; Closa-Monasterolo, R.; Dain, E.; et al. Endocrine and metabolic biomarkers predicting early childhood obesity risk. In Preventive Aspects of Early Nutrition; Fewtrell, M.S., Haschke, F., Prescott, S.L., Eds.; Vevey/S. Kager AG: Basel, Switzerland, 2016; Volume 85, pp. 81–88. [Google Scholar]
- Kelishadi, R.; Farajian, S. The protective effects of breastfeeding on chronic non-communicable diseases in adulthood: A review of evidence. Adv. Biomed. Res. 2014, 3, 3:1–3:5. [Google Scholar] [CrossRef] [PubMed]
- Godfrey, K.M.; Costello, P.M.; Lillycrop, K.A. Development, epigenetics and metabolic programming. In Preventive Aspects of Early Nutrition; Fewtrell, M.S., Haschke, F., Prescott, S.L., Eds.; Vevey/S. Kager AG: Basel, Switzerland, 2016; Volume 85, pp. 71–80. [Google Scholar]
- Wells, J.C.; Chomoto, S.; Fewtrell, M.S. Programming of body composition by early growth and nutrition. Proc. Nutr. Soc. 2007, 66, 423–434. [Google Scholar] [CrossRef] [PubMed]
- Sievers, E.; Oldigs, H.D.; Santer, R.; Schaub, J. Feeding patterns in breast-fed and formula-fed infants. Ann. Nutr. Metab. 2002, 46, 243–248. [Google Scholar] [CrossRef] [PubMed]
- Savino, F.; Liguori, S.A.; Fissore, M.F.; Oggero, R. Breast milk hormones and their protective effect on obesity. Int. J. Pediatr. Endocrinol. 2009, 2009, 327505:1–327505:8. [Google Scholar] [CrossRef]
- Bartok, C. Babies fed breastmilk by breast versus by bottle: A pilot study evaluating early growth patterns. Breastfeed. Med. 2011, 6, 117–124. [Google Scholar] [CrossRef] [PubMed]
- Luque, V.; Closa-Monasterolo, R.; Escribano, J.; Ferre, N. Early programming by protein intake: The effect of protein on adiposity development and the growth and functionality of vital organs. Nutr. Metab. Insights 2015, 8, 49–56. [Google Scholar] [CrossRef] [PubMed]
- Butte, N.; Wong, W.; Hopkinson, J.; Smith, E.; Ellis, K. Infant feeding mode affects early growth and body composition. Pediatrics 2000, 16, 1355–1366. [Google Scholar] [CrossRef]
- Kent, J.; Mitoulas, L.; Cox, D.B.; Owens, R.; Hartmann, P. Breast volume and milk production during extended lactation in women. Exp. Physiol. 1999, 84, 435–447. [Google Scholar] [CrossRef] [PubMed]
- Mitoulas, L.R.; Kent, J.C.; Cox, D.B.; Owens, R.A.; Sherriff, J.L.; Hartmann, P.E. Variation in fat, lactose and protein in human milk over 24 h and throughout the first year of lactation. Br. J. Nutr. 2002, 88, 29–37. [Google Scholar] [CrossRef] [PubMed]
- Leddy, M.A.; Power, M.L.; Schulkin, J. The impact of maternal obesity on maternal and fetal health. Rev. Obstet. Gynecol. 2008, 1, 170–178. [Google Scholar] [PubMed]
- Nahar, S.; Mascie-Taylor, C.G.; Begum, H.A. Maternal anthropometry as a predictor of birth weight. Public Health Nutr. 2007, 10, 965–970. [Google Scholar] [CrossRef] [PubMed]
- Yu, Z.; Han, S.; Zhu, J.; Sun, X.; Ji, C.; Guo, X. Pre-pregnancy body mass index in relation to infant birth weight and offspring overweight/obesity: A systematic review and meta-analysis. PLoS ONE 2013, 8, e61627. [Google Scholar] [CrossRef] [PubMed]
- Rossner, S.; Ohlin, A. Maternal body weight and relation to birth weight. Acta Obstet. Gynaecol Scand. 1990, 69, 475–478. [Google Scholar] [CrossRef]
- Moussa, H.N.; Alrais, M.A.; Leon, M.G.; Abbas, E.L.; Sibai, B.M. Obesity epidemic: Impact from preconception to postpartum. Future Sci. OA 2016, 2, FSO137:1–FSO137:12. [Google Scholar] [CrossRef] [PubMed]
- Sewell, M.F.; Huston-Presley, L.; Super, D.M.; Catalano, P. Increased neonatal fat mass, not lean body mass, is associated with maternal obesity. Am. J. Obstet. Gynecol. 2006, 195, 1100–1103. [Google Scholar] [CrossRef] [PubMed]
- Castillo-Laura, H.; Santos, I.S.; Quadros, L.C.M.; Matijasevich, A. Maternal obesity and offspring body composition by indirect methods: A systematic review and meta-analysis. Cad. Saude Publica 2015, 31, 2073–2092. [Google Scholar] [CrossRef] [PubMed]
- Kugananthan, S.; Gridneva, Z.; Lai, C.T.; Hepworth, A.R.; Mark, P.J.; Kakulas, F.; Geddes, D.T. Associations between maternal body composition and appetite hormones and macronutrients in human milk. Nutrients 2017, 9, 252. [Google Scholar] [CrossRef] [PubMed]
- Fields, D.A.; Schneider, C.R.; Pavela, G. A narrative review of the associations between six bioactive components in breast milk and infant adiposity. Obesity 2016, 24, 1213–1221. [Google Scholar] [CrossRef] [PubMed]
- Kent, E.; O’Dwyer, V.; Fattah, C.; Farah, N.; O’Connor, C.; Turner, M.J. Correlation between birth weight and maternal body composition. Obstet. Gynecol. 2013, 121, 46–50. [Google Scholar] [CrossRef] [PubMed]
- O’Connor, C.; O’Higgins, A.; Segurado, R.; Turner, M.J.; Stuart, B.; Kennelly, M.M. Maternal body composition and birth weight. Prenat. Diagn. 2014, 34, 605–607. [Google Scholar] [PubMed]
- Larciprete, G.; Valensise, H.; Vasapollo, B.; Di Pierro, G.; Menghini, S.; Magnani, F.; De Lorenzo, A.; Arduini, D. Maternal body composition at term gestation and birth weight: Is there a link? Acta Diabetol. 2003, 40, 222–224. [Google Scholar] [CrossRef] [PubMed]
- Sanin Aguirre, L.H.; Reza-Lopez, S.; Levario-Carrillo, M. Relation between maternal body composition and birth weight. Biol. Neonate 2004, 86, 55–62. [Google Scholar] [CrossRef] [PubMed]
- Ejlerskov, K.T.; Christensen, L.B.; Ritz, C.; Jensen, S.M.; Molgaard, C.; Michaelsen, K.F. The impact of early growth patterns and infant feeding on body composition at 3 years of age. Br. J. Nutr. 2015, 114, 316–327. [Google Scholar] [CrossRef] [PubMed] [Green Version]
- Holliday, M.A. Metabolic rate and organ size during growth from infancy to maturity and during late gestation and early infancy. Pediatrics 1971, 47, 169–179. [Google Scholar]
- Elia, M. Organ and tissue contribution to metabolic rate. In Energy Metabolism. Tissue Determinants and Cellular Corollaries; Kinney, J.M., Tucker, H.N., Eds.; Raven: New York, NY, USA, 1992; pp. 61–79. [Google Scholar]
- Dewey, K.; Heinig, M.; Nommsen, L.; Lonnerdal, B. Maternal versus infant factors related to breast milk intake and residual milk volume: The DARLING study. Pediatrics 1991, 87, 829–837. [Google Scholar] [PubMed]
- Kent, J.C.; Mitoulas, L.R.; Cregan, M.D.; Ramsay, D.T.; Doherty, D.A.; Hartmann, P.E. Volume and frequency of breastfeedings and fat content of breast milk throughout the day. Pediatrics 2006, 117, e387–e395. [Google Scholar] [CrossRef] [PubMed]
- Gridneva, Z.; Kugananthan, S.; Hepworth, A.R.; Tie, W.J.; Lai, C.T.; Ward, L.C.; Hartmann, P.E.; Geddes, D.T. Effect of human milk appetite hormones, macronutrients, and infant characteristics on gastric emptying and breastfeeding patterns of term fully breastfed infants. Nutrients 2017, 9, 15. [Google Scholar] [CrossRef] [PubMed]
- Binns, C.W.; Fraser, M.L.; Lee, A.H.; Scott, J. Defining exclusive breastfeeding in Australia. J. Paediatr. Child Health 2009, 45, 174–180. [Google Scholar] [CrossRef] [PubMed]
- Gridneva, Z.; Hepworth, A.; Ward, L.; Lai, C.T.; Hartmann, P.; Geddes, D.T. Bioimpedance spectroscopy in the infant: Effect of milk intake and extracellular fluid reservoirs on resistance measurements in term breastfed infants. Eur. J. Clin. Nutr. 2016, 70, 843–851. [Google Scholar] [CrossRef] [PubMed]
- Gridneva, Z.; Hepworth, A.R.; Ward, L.C.; Lai, C.T.; Hartmann, P.E.; Geddes, D.T. Determinants of body composition in breastfed infants using bioimpedance spectroscopy and ultrasound skinfolds—Methods comparison. Pediatr. Res. 2016, 81, 423–433. [Google Scholar] [CrossRef] [PubMed]
- Lingwood, B.E.; van Leeuwen, A.M.S.; Carberry, A.E.; Fitzgerald, E.C.; Callaway, L.K.; Colditz, P.B.; Ward, L.C. Prediction of fat-free mass and percentage of body fat in neonates using biolelectrical impedance analysis and anthropometric measures: Validation against Pea Pod. Br. J. Nutr. 2012, 107, 1545–1552. [Google Scholar] [CrossRef] [PubMed]
- Bocage, C. Impedance Measurements of Body Composition in Children. Master’s Thesis, University of West Indies, Kingston, Jamaica, 1988. [Google Scholar]
- Butte, N.; Hopkinson, J.; Wong, W.; Smith, E.; Ellis, K. Body composition during the first 2 years of life: An updated reference. Pediatr. Res. 2000, 47, 578–585. [Google Scholar] [CrossRef] [PubMed]
- McLeod, G.; Geddes, D.; Nathan, E.; Sherriff, J.; Simmer, K.; Hartmann, P. Feasibility of using ultrasound to measure preterm body composition and to assess macronutrient influences on tissue accretion rates. Early Hum. Dev. 2013, 89, 577–582. [Google Scholar] [CrossRef] [PubMed]
- Ulbricht, L.; Neves, E.; Ripka, W.; Romaneli, E. Comparison between Body Fat Measurements Obtained by Portable Ultrasound and Caliper in Young Adults. In Proceedings of the 2012 Annual International Conference of the IEEE Engineering in Medicine and Biology Society (EMBS), San Diego, CA, USA, 28 August–1 September 2012; pp. 1952–1955. [Google Scholar]
- Slaughter, M.; Lohman, T.; Boileau, R.; Horswill, C.; Stillman, R.; Van Loan, M.; Bemben, D. Skinfold equations for estimation of body fatness in children and youth. Hum. Biol. 1988, 60, 709–723. [Google Scholar] [PubMed]
- Brook, C. Determination of body composition of children from skinfold measurements. Arch. Dis. Child. 1971, 46, 182–184. [Google Scholar] [CrossRef] [PubMed]
- Lohman, T. Body composition in children and youth. In Advances in Pediatric Sport Sciences; Boileau, R.A., Ed.; Human Kinetics Publishers: Champaign, IL, USA, 1984; pp. 29–57. [Google Scholar]
- Van Itallie, T.B.; Yang, M.U.; Heymsfield, S.B.; Funk, R.C.; Boileau, R.A. Height-normalized indices of the body’s fat-free mass and fat mass: Potentially useful indicators of nutritional status. Am. J. Clin. Nutr. 1990, 52, 953–959. [Google Scholar]
- Arthur, P.; Hartmann, P.; Smith, M. Measurement of the milk intake of breast-fed infants. J. Pediatr. Gastroenterol. Nutr. 1987, 6, 758–763. [Google Scholar] [CrossRef] [PubMed]
- R Core Team. R: A Language and Environment for Statistical Computing; R Foundation for Statistical Computing: Vienna, Austria, 2017. [Google Scholar]
- Pinheiro, J.B.; Bates, D.; DebRoy, S.; Sarkar, D.; R Development Core Team. nlme: Linear and Nonlinear Mixed Effects Models; R Package Version 3.1–131; R Foundation for Statistical Computing: Vienna, Austria, 2017. [Google Scholar]
- Bates, D.; Maechler, M.; Bolker, B.; Walker, S. Lme4: Linear Mixed-Efects Models Using Eigen and S4; R Package Version 1.1–7; R Foundation for Statistical Computing: Vienna, Austria, 2014. [Google Scholar]
- Fox, J.; Weisberg, S. An R Companion to Applied Regression; Sage: Thousand Oaks, CA, USA, 2011. [Google Scholar]
- Gamer, M.; Lemon, J.; Fellows, I.; Singh, P. Various Coefficients of Interrater Reliability and Agreement; R Package Version 0.84; R Foundation for Statistical Computing: Vienna, Austria, 2012. [Google Scholar]
- Hothorn, T.; Bretz, F.; Westfall, P. Simultaneous inference in general parametric models. Biom. J. 2008, 50, 346–363. [Google Scholar] [CrossRef] [PubMed]
- Wickham, H. ggplot2: Elegant Graphics for Data Analysis; Springer: New York, NY, USA, 2009. [Google Scholar]
- Faul, F.; Erdfelder, E.; Buchner, A.; Lang, A.-G. Statistical power analyses using G*Power 3.1: Tests for correlation and regression analyses. Behav. Res. Methods 2009, 41, 1149–1160. [Google Scholar] [CrossRef] [PubMed]
- Diggle, P.J.; Heagerty, P.J.; Liang, K.-Y.; Zeger, S.L. Analysis of Longitudinal Data; Oxford University Press Inc.: New York, NY, USA, 2002. [Google Scholar]
- Institute of Medicine; Subcommittee on Nutrition During Lactation. Nutrition During Lactation; National Academy Press: Washington, DC, USA, 1991. [Google Scholar]
- Nommsen, L.A.; Lovelady, C.A.; Heinig, M.; Lonnerdal, B.; Dewey, K.G. Determinants of energy, protein, lipid, and lactose concentrations in human milk during the first 12 mo of lactation: The DARLING study. Am. J. Clin. Nutr. 1991, 53, 457–465. [Google Scholar] [PubMed]
- Curran-Everett, D. Multiple comparisons: Philosophies and illustrations. Am. J. Physiol. Regul. Integr. Comp. Physiol. 2000, 279, R1–R8. [Google Scholar] [CrossRef] [PubMed]
- Gallagher, D.; Heymsfield, S.B.; Heo, M.; Jebb, S.A.; Murgatroyd, P.R.; Sakamoto, Y. Healthy percentage body fat ranges: An approach for developing guidelines based on body mass index. Am. J. Clin. Nutr. 2000, 72, 694–701. [Google Scholar] [PubMed]
- Rzehak, P.; Oddy, W.H.; Mearin, M.L.; Grote, V.; Mori, T.A.; Szajewska, H.; Shamir, R.; Koletzko, S.; Weber, M.; Beilin, L.J.; et al. Infant feeding and growth trajectory patterns in childhood and body composition in young adulthood. Am. J. Clin. Nutr. 2017, 106, 568–580. [Google Scholar] [CrossRef] [PubMed]
- Nazlee, N.; Bilal, R.; Latif, Z.; Bluck, L. Maternal body composition and its relationship to infant breast milk intake in rural Pakistan. Food Nutr. Sci. 2011, 2, 932–937. [Google Scholar] [CrossRef] [PubMed]
- Galpin, L.; Thakwalakwa, C.; Phuka, J.; Ashorn, P.; Maleta, K.; Wong, W.W.; Manary, M.J. Breast milk intake is not reduced more by the introduction of energy dense complementary food than by typical infant porridge. J. Nutr. 2007, 137, 1828–1833. [Google Scholar] [PubMed]
- Butte, N.F.; Wills, C.; Jean, C.A.; Smith, E.O.; Garza, C. Feeding patterns of exclusively breast-fed infants during the first four months of life. Early Hum. Dev. 1985, 12, 291–300. [Google Scholar] [CrossRef]
- Rattigan, S.; Ghisalberti, A.V.; Hartmann, P.E. Breast-milk production in Australian women. Br. J. Nutr. 1981, 45, 243–249. [Google Scholar] [CrossRef] [PubMed]
- Kent, J.; Hepworth, A.; Sherriff, J.; Cox, D.; Mitoulas, L.; Hartmann, P. Longitudinal changes in breastfeeding patterns from 1 to 6 months of lactation. Breastfeed. Med. 2013, 8, 401–407. [Google Scholar] [CrossRef] [PubMed]
- Ay, L.; Van Houten, V.A.; Steegers, E.A.; Hofman, A.; Witteman, J.C.; Jaddoe, V.W.; Hokken-Koelega, A.C. Fetal and postnatal growth and body composition at 6 months of age. J. Clin. Endocrinol. Metab. 2009, 94, 2023–2030. [Google Scholar] [CrossRef] [PubMed]
- Forsum, E.; Lof, M.; Olausson, H.; Olhager, E. Maternal body composition in relation to infant birth weight and subcutaneous adipose tissue. Br. J. Nutr. 2006, 96, 408–414. [Google Scholar] [CrossRef] [PubMed]
- Hull, H.R.; Dinger, M.K.; Knehans, A.W.; Thompson, D.M.; Fields, D.A. Impact of maternal body mass index on neonate birthweight and body composition. Am. J. Obstet. Gynecol. 2008, 198, 416.e411–416.e416. [Google Scholar] [CrossRef] [PubMed]
- Dulloo, A.G.; Jacquet, J.; Miles-Chan, J.L.; Schutz, Y. Passive and active roles of fat-free mass in the control of energy intake and body composition regulation. Eur. J. Clin. Nutr. 2017, 71, 353–357. [Google Scholar] [CrossRef] [PubMed]
- Haroun, D.; Wells, J.C.K.; Williams, J.E.; Fuller, N.J.; Fewtrell, M.S.; Lawson, M.S. Composition of the fat-free mass in obese and nonobese children: Matched case-control analyses. Int. J. Obes. 2005, 29, 29–36. [Google Scholar] [CrossRef] [PubMed]
- Catalano, P.M.; Tyzbir, E.D.; Allen, S.R.; McBean, J.H.; McAuliffe, T.L. Evaluation of fetal growth by estimation of neonatal body composition. Obstet. Gynecol. 1992, 79, 46–50. [Google Scholar] [PubMed]
- Singh, K.A.; Huston-Presley, L.P.; Mencin, P.; Thomas, A.; Amini, S.B.; Catalano, P.M. Birth weight and body composition of neonates born to Caucasian compared with African-American mothers. Obstet. Gynecol. 2010, 115, 998–1002. [Google Scholar] [CrossRef] [PubMed]
- Andersen, G.S.; Girma, T.; Wells, J.C.K.; Kastel, P.; Michaelsen, K.F.; Friis, H. Fat and fat-free mass at birth: Air displacement plethysmography measurements on 350 Ethiopian newborns. Pediatr. Res. 2011, 70, 501–506. [Google Scholar] [CrossRef] [PubMed]
- Chomtho, S.; Wells, J.C.K.; Davies, P.S.; Lucas, A.; Fewtrell, M.S. Early growth and body composition in infancy. In Early Nutrition Programming and Health Outcomes in Later Life. Advances in Experimental Medicine and Biology; Koletzko, B., Decsi, T., Molnar, D., de la Hunty, A., Eds.; Springer: Dordrecht, The Netherlands, 2009; Volume 646, pp. 165–168. [Google Scholar]
- Andres, A.; Hull, H.R.; Shankar, K.; Casey, P.H.; Cleves, M.A.; Badger, T.M. Longitudinal body composition of children born to mothers with normal weight, overweight, and obesity. Obesity 2015, 23, 1252–1258. [Google Scholar] [CrossRef] [PubMed]
- Silliman, K.; Kretchmer, N. Maternal obesity and body composition of the neonate. Biol. Neonate 1995, 68, 384–393. [Google Scholar] [CrossRef] [PubMed]
- Breij, L.M.; Abrahamse-Berkeveld, M.; Acton, D.; De Lucia Rolfe, E.; Ong, K.K.; Hokken-Koelega, A.C.S. Impact of early infant growth, duration of breastfeeding and maternal factors on total body fat mass and visceral fat at 3 and 6 months of age. Ann. Nutr. Metab. 2017, 71, 203–210. [Google Scholar] [CrossRef] [PubMed]
- Badon, S.E.; Dyer, A.R.; Josefson, J.L.; HAPO Study Coopwrative Research Group. Gestational weight gain and neonatal adiposity in the hyperglycemia and adverse pregnancy outcome study—North American region. Obesity 2014, 22, 1731–1738. [Google Scholar] [CrossRef] [PubMed]
- Anne, D.; O’Higgins, A.; O’Connor, C.; Mullaney, L.; Bennet, A.M.; Sheridan-Pereira, M.; Turner, M.J. PS-275 The relationship between infant birth weight and neonatal body composition. Arch. Dis. Child. 2014, 99, A211. [Google Scholar] [CrossRef]
- Fomon, S.; Nelson, S. Body composition of the male and female reference infants. Ann. Rev. Nutr. 2002, 22, 1–17. [Google Scholar] [CrossRef] [PubMed]
- Jensen, S.M.; Ritz, C.; Ejlerskov, K.; Molgaard, C.; Michaelsen, K.F. Infant BMI peak, breastfeeding, and body composition at age 3 years. Am. J. Clin. Nutr. 2015, 101, 319–325. [Google Scholar] [CrossRef] [PubMed]
- Roy, S.M.; Spivack, J.G.; Faith, M.S.; Chesi, A.; Mitchell, J.A.; Kelly, A.; Grant, S.F.; McCormack, S.E.; Zemel, B.S. Infant BMI or weight-for-length and obesity risk in early childhood. Pediatrics 2016, 137, e20153492:1–e20153492:9. [Google Scholar] [CrossRef] [PubMed]
- Gale, C.; Logan, K.; Santhakumaran, S.; Parkinson, J.; Hyde, M.; Modi, N. Effect of breastfeeding compared with formula feeding on infant body composition: A systematic review and meta-analysis. Am. J. Clin. Nutr. 2012, 95, 656–669. [Google Scholar] [CrossRef] [PubMed]
- Lee, H.; Park, H.; Ha, E.; Hong, Y.-C.; Ha, M.; Park, H.; Kim, B.-N.; Lee, B.; Lee, S.-J.; Lee, K.Y.; et al. Effect of breastfeeding duration on cognitive development in infants: 3-year follow-up study. J. Korean Med. Sci. 2016, 31, 579–584. [Google Scholar] [CrossRef] [PubMed]
- Booth, A.; Magnuson, A.; Foster, M. Detrimental and protective fat: Body fat distribution and its relation to metabolic disease. Horm. Mol. Biol. Clin. Investig. 2014, 17, 13–27. [Google Scholar] [CrossRef] [PubMed]
- Roggero, P.; Gianni, M.; Orsi, A.; Piemontese, P.; Amato, O.; Liotto, N.; Morlacchi, L.; Taroni, F.; Fields, D.; Catalano, P.; et al. Quality of growth in exclusively breast-fed infants in the first six months of life: An Italian study. Pediatr. Res. 2010, 68, 542–544. [Google Scholar] [CrossRef] [PubMed]
- Gilchrist, J. Body Composition Reference Data for Exclusively Breast-Fed Infants. In Proceedings of the Pediatric Academic Society Annual Meeting, Toronto, ON, Canada, 5–7 May 2007. [Google Scholar]
- Carberry, A.; Golditz, P.; Lingwood, B. Body composition from birth to 4.5 months in infants born to non-obese women. Pediatr. Res. 2010, 68, 84–88. [Google Scholar] [CrossRef] [PubMed]
- Gilchrist, J.; Andres, A.; Badger, T. Body composition of infants fed breast-milk, milk-based formula or soy-based formula during the first 6 months of life. Obesity 2008, 16, 434. [Google Scholar]
- Twigger, A.J.; Hepworth, A.R.; Lai, C.T.; Chetwynd, E.; Stuebe, A.M.; Blancafort, P.; Hartmann, P.E.; Geddes, D.T.; Kakulas, F. Gene expression in breastmilk cells is associated with maternal and infant characteristics. Sci. Rep. 2015, 5, 12933:1–12933:14. [Google Scholar] [CrossRef] [PubMed]
- Lepe, M.; Bacardi Gascon, M.; Castaneda-Gonzalez, L.M.; Perez Morales, M.E.; Jimenez Cruz, A. Effect of maternal obesity on lactation: Systematic review. Nutr. Hosp. 2011, 26, 1266–1269. [Google Scholar] [PubMed]
- Villalpando, S.F.; Butte, N.F.; Wong, W.W.; Flores-Huerta, S.; Hernandez-Beltran, M.J.; Smith, E.O.; Garza, C. Lactation performance of rural Mesoamerindians. Eur. J. Clin. Nutr. 1992, 46, 337–348. [Google Scholar] [PubMed]
- World Health Organization. Child Growth Standards: Weight-for-Age Pecentiles. Available online: http://www.who.int/childgrowth/standards/weight_for_age/en/ (accessed on 21 December 2017).
- Hatsu, I.E.; McDougald, D.M.; Anderson, A.K. Effect of infant feeding on maternal body composition. Int. Breastfeed. J. 2008, 3, 18:1–18:8. [Google Scholar] [CrossRef] [PubMed]
- Quandt, S.A. Changes in maternal postpartum adiposity and infant feeding patterns. Am. J. Phys. Anthropol. 1983, 60, 455–461. [Google Scholar] [CrossRef] [PubMed]
- Stuebe, A.M.; Rich-Edwards, J.W. The reset hypothesis: Lactation and maternal metabolism. Am. J. Perinatol. 2009, 26, 81–88. [Google Scholar] [CrossRef] [PubMed]
- National Health and Medical Research Council. Infant Feeding Guidelines Information for Health Workers; National Health and Medical Research Council: Canberra, Australia, 2012.
- World Health Organization. Planning Guide for National Implementation of the Global Strategy for Infant and Young Child Feeding; World Health Organization: Geneva, Switzerland, 2007. [Google Scholar]
- Han, S.-Y.; Brewis, A.A. Influence of weight concerns on breastfeeding: Evidence from the Norwegian mother and child cohort study. Am. J. Hum. Biol. 2017, e23086:1–e23086:4. [Google Scholar] [CrossRef] [PubMed]


| Characteristic | 2 Months a | 5 Months b | 9 Months c | 12 Months d |
|---|---|---|---|---|
| Mean ± SD | Mean ± SD | Mean ± SD | Mean ± SD | |
| (Range) | (Range) | (Range) | (Range) | |
| Mothers | ||||
| Weight (kg) | 78.8 ± 19.3 | 70.1 ± 17.8 | 63.0 ± 10.0 | 64.2 ± 17.3 |
| (57.5–116.2) | (53.7–115.3) | (50.4–121.9) | (51.4–121.9) | |
| BMI (kg/m2) | 27.2 ± 5.5 | 24.8 ± 5.0 | 22.7 ± 3.9 | 23.9 ± 5.9 |
| (20.4–35.5) | (19.0–35.2) | (17.9–37.2) | (18.2–37.2) | |
| Fat-free Mass e (kg) | 49.5 ± 8.2 | 45.4 ± 6.6 | 44.1 ± 4.1 | 45.4 ± 6.7 |
| (38.2–66.2) | (37.4–60.9) | (35.1–68.5) | (35.9–67.7) | |
| Fat Mass e (kg) | 29.3 ± 11.8 | 24.6 ± 12.0 | 18.9 ± 7.4 | 18.8 ± 11.0 |
| (15.2–50.0) | (13.9–54.4) | (11.4–53.4) | (10.0–54.3) | |
| Fat Mass e (%) | 36.0 ± 6.4 | 33.8 ± 7.0 | 29.2 ± 6.7 | 27.7 ± 7.9 |
| (25.7–44.7) | (23.2–47.2) | (20.0–44.3) | (19.4–44.5) | |
| FFMI e (kg/m2) | 16.8 ± 2.1 | 16.2 ± 1.9 | 16.1 ± 2.3 | 16.4 ± 2.4 |
| (13.7–20.2) | (13.2–20.0) | (12.4–20.9) | (12.7–20.7) | |
| FMI e (kg/m2) | 9.5 ± 3.3 | 8.4 ± 3.3 | 7.9 ± 3.5 | 7.5 ± 3.5 |
| (6.2–15.3) | (4.8–16.6) | (3.9–16.3) | (3.6–16.6) | |
| Infants | ||||
| Sex (M/F) | 9M/6F | 10M/10F | 10M/9F | 9M/9F |
| Age (months) | 2.04 ± 0.14 | 5.16 ± 0.22 | 9.22 ± 0.27 | 12.26 ± 0.28 |
| (1.87–2.33) | (4.77–5.47) | (8.83–9.77) | (11.63–12.67) | |
| Length (cm) | 58.1 ± 1.9 | 64.8 ± 2.3 | 71.7 ± 1.9 | 73.6 ± 3.2 |
| (54.2–60.0) | (60.5–69.5) | (66.0–74.0) | (69.0–78.5) | |
| Weight (kg) | 5.630 ± 0.660 | 7.431 ± 1.134 | 8.836 ± 0.975 | 9.650 ± 0.618 |
| (4.420–7.400) | (5.808–9.510) | (6.675–10.095) | (7.165–11.085) | |
| BMI (kg/m2) | 16.6 ± 1.2 | 17.6 ± 1.9 | 17.7 ± 1.7 | 17.8 ± 0.9 |
| (14.5–18.1) | (14.9–20.4) | (14.2–20.2) | (13.7–19.2) | |
| Head circumference (cm) | 39.7 ± 1.6 | 42.1 ± 1.5 | 45.6 ± 1.7 | 46.6 ± 1.7 |
| (37.0–42.0) | (40.0–45.9) | (43.0–48.5) | (44.2–49.5) | |
| Breastfeeding characteristics | ||||
| 24-h milk intake (g) | n/a f | 818.8 ± 204.9 | 502.3 ± 157.8 | 445.5 ± 200.4 |
| (498–1185) | (300–775) | (255–795) | ||
| 24-h feeding frequency (MP) | n/a f | 8.1 ± 1.4 | 5.4 ± 1.2 | 4.4 ± 1.9 |
| (6–11) | (4–7) | (2–8) | ||
| Feeding frequency (SR) | 2.3 ± 0.4 g | 2.8 ± 0.8 | 3.7 ± 1.2 | 5.4 ± 2.9 |
| (1.5–3.0) | (1.5–4.0) | (2.0–6.0) | (2.2–12.0) | |
© 2018 by the authors. Licensee MDPI, Basel, Switzerland. This article is an open access article distributed under the terms and conditions of the Creative Commons Attribution (CC BY) license (http://creativecommons.org/licenses/by/4.0/).
Share and Cite
Gridneva, Z.; Rea, A.; Hepworth, A.R.; Ward, L.C.; Lai, C.T.; Hartmann, P.E.; Geddes, D.T. Relationships between Breastfeeding Patterns and Maternal and Infant Body Composition over the First 12 Months of Lactation. Nutrients 2018, 10, 45. https://doi.org/10.3390/nu10010045
Gridneva Z, Rea A, Hepworth AR, Ward LC, Lai CT, Hartmann PE, Geddes DT. Relationships between Breastfeeding Patterns and Maternal and Infant Body Composition over the First 12 Months of Lactation. Nutrients. 2018; 10(1):45. https://doi.org/10.3390/nu10010045
Chicago/Turabian StyleGridneva, Zoya, Alethea Rea, Anna R. Hepworth, Leigh C. Ward, Ching T. Lai, Peter E. Hartmann, and Donna T. Geddes. 2018. "Relationships between Breastfeeding Patterns and Maternal and Infant Body Composition over the First 12 Months of Lactation" Nutrients 10, no. 1: 45. https://doi.org/10.3390/nu10010045