Article

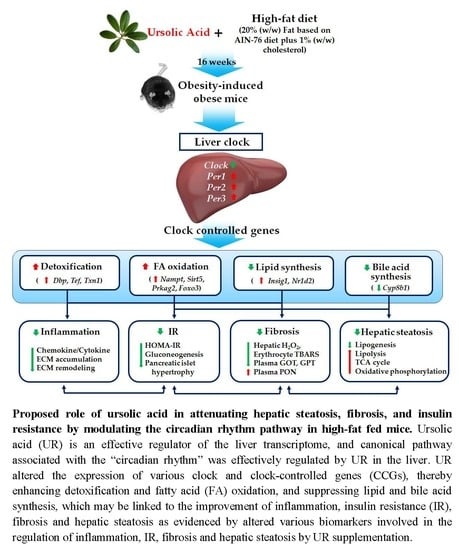
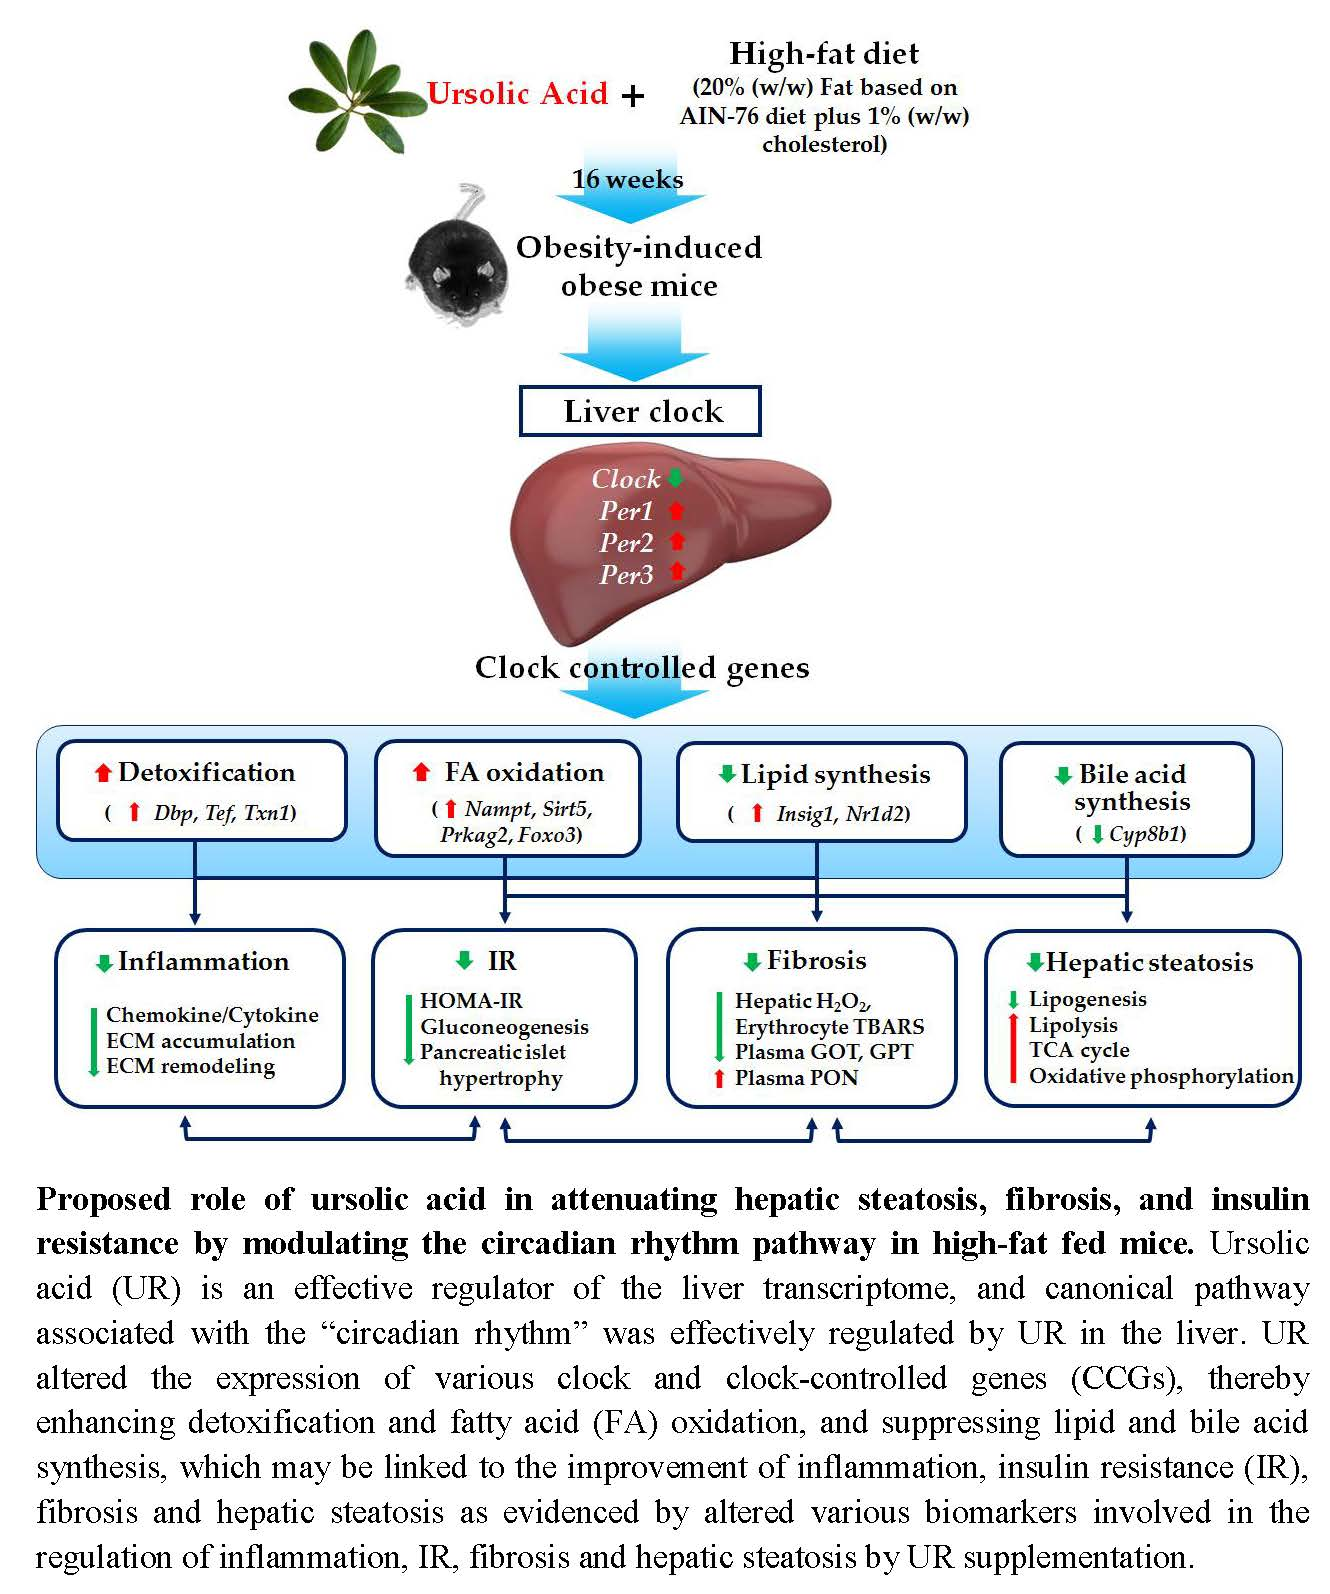
Ursolic Acid Attenuates Hepatic Steatosis, Fibrosis, and Insulin Resistance by Modulating the Circadian Rhythm Pathway in Diet-Induced Obese Mice

by
Eun-Young Kwon
1,2,†,
Su-Kyung Shin
3,† and
Myung-Sook Choi
1,2,*
1
Department of Food Science and Nutrition, Kyungpook National University, 1370 San-Kyuk Dong Puk-Ku, Daegu 41566, Korea
2
Center for Food and Nutritional Genomics Research, Kyungpook National University, 1370 San-Kyuk Dong Puk-Ku, Daegu 41566, Korea
3
Department of Physiology & Obesity-Mediated Disease Research Center, Keimyung University School of Medicine, Daegu 82601, Korea
*
Author to whom correspondence should be addressed.
These authors contributed equally to this work.
Nutrients 2018, 10(11), 1719; https://doi.org/10.3390/nu10111719
Submission received: 15 October 2018 / Revised: 7 November 2018 / Accepted: 7 November 2018 / Published: 9 November 2018

Abstract

:
The aim of the current study was to elucidate the effects of long-term supplementation with dietary ursolic acid (UR) on obesity and associated comorbidities by analyzing transcriptional and metabolic responses, focusing on the role of UR in the modulation of the circadian rhythm pathway in particular. C57BL/6J mice were divided into three groups and fed a normal diet, high-fat diet, or high-fat + 0.05% (w/w) UR diet for 16 weeks. Oligonucleotide microarray profiling revealed that UR is an effective regulator of the liver transcriptome, and canonical pathways associated with the “circadian rhythm” and “extracellular matrix (ECM)–receptor interactions” were effectively regulated by UR in the liver. UR altered the expression of various clock and clock-controlled genes (CCGs), which may be linked to the improvement of hepatic steatosis and fibrosis via lipid metabolism control and detoxification enhancement. UR reduced excessive reactive oxygen species production, adipokine/cytokine dysregulation, and ECM accumulation in the liver, which also contributed to improve hepatic lipotoxicity and fibrosis. Moreover, UR improved pancreatic islet dysfunction, and suppressed hepatic gluconeogenesis, thereby reducing obesity-associated insulin resistance. Therapeutic approaches targeting hepatic circadian clock and CCGs using UR may ameliorate the deleterious effects of diet-induced obesity and associated complications such as hepatic fibrosis.

Graphical Abstract

1. Introduction

Obesity represents one of the most severe burdens on healthcare systems, and is closely related to the increased risk of multiple chronic conditions, including insulin resistance (IR), diabetes, cardiovascular diseases, fatty liver, fibrosis, non-alcoholic steatohepatitis, and other comorbidities [1]. Molecular links between obesity, hepatic steatosis, and liver fibrosis remain incompletely understood but may include chronic inflammation and extracellular matrix (ECM) accumulation in the liver. One hypothesis explaining the link between obesity, hepatic steatosis, and liver fibrosis is the “two-hit hypothesis”, which implies that the accumulation of lipid metabolites can lead to a series of events including lipotoxicity, oxidative stress, and inflammation that produce a “second hit” [2]. Another hypothesis suggests that the “second hit” promotes tissue injury and the activation of stellate cells. Activated stellate cells are recognized as the primary cellular source of matrix components in the liver, and play a central role in the development of hepatic fibrosis by accumulating ECM proteins in the space of Disse via accelerated pro-inflammatory responses [3,4]. Moreover, genome-wide gene expression studies provided the first and important insights into the role of the circadian clock in liver metabolism, and suggest that the interaction between altered energy metabolism and disruptions in the circadian clock results in a downward spiral that can cause obesity, IR, hepatic steatosis, and other metabolic diseases or exacerbate pathological states [5,6,7,8,9], though the underlying mechanisms remain largely unknown.
Ursolic acid (UR), or 3β-hydroxy-urs-12-en-28-oic acid, is a pentacyclic triterpenoid found in large amounts in berries, leaves, flowers, and fruits of medicinal plants, such as Rosmarinus officinalis, Eriobotrya japonica, and Eugenia jambolana [10,11,12,13,14,15]. UR exerts anti-inflammatory, anti-oxidative, anti-cancer, anti-obesity, and anti-diabetic activities by activating peroxisome proliferator-activated receptor alpha (PPAR-α) and 5′ AMP-activated protein kinase (AMPK) and increasing energy expenditure. However, the effects of this chemical on hepatic fibrosis are not fully elucidated, and to date, few studies have been conducted to investigate the effects of long-term treatment with UR based on the integration of transcriptional profiles and phenotypic biomarkers. Transcriptomic studies are a common approach for the identification of molecular mechanisms underlying the anti-metabolic disease effects of traditional medicines. In the current study, we evaluated the effects of long-term supplementation with dietary UR and the molecular mechanisms underlying its metabolic regulatory effects in diet-induced obesity (DIO) and metabolic disease using transcriptomic analysis. This study demonstrates for the first time that dietary UR attenuated inflammation-mediated metabolic diseases including DIO, hepatic steatosis, dyslipidemia, fibrosis, and IR by controlling the circadian clock and suppressing hepatic ECM remodeling in DIO mice.

2. Materials and Methods

2.1. Animals

Thirty-six male C57BL/6J mice were obtained from the Jackson Laboratory (Bar Harbor, ME, USA) at 4 weeks of age. Mice were individually housed under a constant temperature (24 °C) and 12-h light/dark cycles, fed an AIN-76 semi-purified diet for a 1-week acclimation period, and then randomly divided into three groups. The mice were fed a normal diet (ND, n = 10), high-fat diet (HFD) consisting of 20% fat and 1% cholesterol (n = 13), or HFD with 0.05% (w/w) UR (n = 13; UR obtained from Sigma-Aldrich, St. Louis, MO, USA) for 16 weeks. All experimental diets were prepared weekly and stored in a dark room at 4 °C. Body weights (BW) and blood glucose levels were recorded every 2 weeks. At the end of the experimental period, all mice were anesthetized with ether after a 12-h fast. Blood was collected from the inferior vena cava to determine the glucose, plasma lipid, and hormone concentrations. Tissues were removed, rinsed with physiological saline, weighed, immediately frozen in liquid nitrogen, and stored at −70 °C until analysis. The animal study protocols were approved by the Ethics Committee at Kyungpook National University (approval no. KNU 2010-4-14).

2.2. Blood Glucose, Intraperitoneal Glucose Tolerance Test (IPGTT), Homeostasis Model Assessment-Estimated IR (HOMA-IR) Index, and Plasma Biomarkers

Every 2 weeks, 12-h fasting blood glucose levels were measured in the tail vein using a glucose analyzer (Lifescan Inc., Wayne, PA, USA). For the IPGTT, 5 weeks after the start of the experiment, 12-h-fasted mice were injected intraperitoneally with glucose (0.5 g/kg BW), and blood glucose levels were measured in the tail vein after 0, 30, 60, and 120 min. Radioimmunometric assays were used to measure plasma insulin and glucagon concentrations using a multiplex detection kit (Bio-Rad, Millipore, Hercules, CA, USA). The HOMA-IR index was calculated according to the following formula: (fasting insulin concentration (mU/L) × fasting glucose concentration (mg/dL) × 0.05551)/22.5.

2.3. Analyses of Plasma and Hepatic Lipids

The levels of total plasma cholesterol (TC), high-density lipoprotein cholesterol (HDL-C), triglycerides (TG), glutamic oxaloacetic transaminase (GOT), glutamic pyruvic transaminase (GPT), and phospholipids were measured using enzymatic assay kits (Asan Pharm Co., Seoul, Korea) as were those of plasma free fatty acid (FFA) (Wako Chemicals, Osaka, Japan), apolipoprotein A1 (apoA1; Eiken Chemical Co., Tokyo, Japan), and apolipoprotein B100 (apoB100; Eiken Chemical Co.). The non-HDL-C value, HDL-C-to-TC ratio (HTR), and atherogenic index (AI) were calculated as follows: non-HDL-C = TC − HDL-C − (TG/5); HTR (%) = HDL-C/TC × 100; and AI = (TC − HDL-C)/HDL-C. Concentrations of plasma adiponectin, leptin, tumor necrosis factor-α (TNF-α), monocyte chemoattractant protein-1 (MCP-1), and interferon-γ (IFN-γ) were measured using a multiplex detection kit (Bio-Rad, Millipore, Hercules, CA, USA). Hepatic lipid levels were determined using the same enzymatic kit used in the plasma analyses after extraction using the method described by Folch et al. [16].

2.4. Morphology of Liver, Fat, and Pancreatic Tissues

The liver, epididymal adipose, and pancreatic tissues were harvested from each mouse. Liver and epididymal adipose tissue samples were subsequently fixed in 10% (v/v) paraformaldehyde/phosphate buffered saline (PBS) and embedded in paraffin for staining with hematoxylin and eosin, and Masson’s trichrome stain. The pancreatic tissue samples were fixed in 4% (v/v) paraformaldehyde/PBS and embedded in paraffin for immunohistochemical staining of insulin and glucagon. The stained area was visualized using a microscope with 200× magnification.

2.5. Hepatic Enzyme Activities and Glycogen Concentrations

Hepatic mitochondrial, cytosolic, and microsomal fractions were prepared as previously described [17] and the protein concentrations were determined via Bradford assay. Fatty acid synthase (FAS) [18], phosphatidate phosphohydrolase (PAP) [19], carnitine palmitoyltransferase (CPT) [20], and β-oxidation [21] activities were measured as previously described. Microsomal 3-hydroxy-3-methyl-glutaryl-coenzyme A reductase (HMGCR) [22] and acyl-CoA:cholesterol acyltransferase (ACAT) [23] activities were measured using [14C]-HMG-CoA and [14C]-oleoyl CoA substrates, respectively. Spectrophotometric assays were used to determine glucose-6-phosphatase (G6Pase) [24], glucokinase [25], and phosphoenolpyruvate carboxykinase (PEPCK) [26] activities as described previously. Hepatic glycogen [27] concentrations were also determined as previously described.

2.6. Hepatic H2O2 and Erythrocyte Thiobarbituric Acid Reactive Substance (TBARS) Concentrations, and Plasma Paraoxonase (PON) Activity

The hepatic H2O2 [28] and erythrocyte TBARS [29] levels were determined as previously described. The plasma PON activity was measured using the method described by Mackness [30].

2.7. RNA Preparation and Quality Control

Total RNA was extracted from adipose tissue, liver, and skeletal muscle using TRIzol reagent (Invitrogen Life Technologies, Grand Island, NY, USA) according to the manufacturer’s instructions. DNase digestion and subsequent re-precipitation in ethanol were performed to remove any DNA and phenol contaminants, respectively. For quality control, the RNA purity and integrity were evaluated using an Agilent 2100 Bioanalyzer (Agilent Technologies, Santa Clara, CA, USA). For the liver, epididymal adipose tissue, and skeletal muscle samples, three pooled RNA sample sets were constructed for each of the ND, HFD, and UR groups as previously described [31]. RNA was stored at −70 °C prior to further analysis via microarray and quantitative polymerase chain reaction (qPCR).

2.8. Quantitative Real-Time PCR

Total RNA (1 μg) was reverse-transcribed into cDNA using the QuantiTect® reverse transcription kit (Qiagen, Hilden, Germany), and mRNA expression was quantified via qPCR using the SYBR green PCR kit (Qiagen) and the CFX96TM real-time system (Bio-Rad). Gene-specific mouse primers were used as mentioned in Table S1. Ct values were normalized to those of glyceraldehyde 3-phosphate dehydrogenase (GAPDH) and the relative gene expression was calculated using the 2−ΔΔ Ct method [32].

2.9. Microarray Analysis

Total RNA was amplified and purified using the Ambion Illumina RNA amplification kit (Ambion, Waltham, MA, USA). Biotinylated cRNA (750 ng per sample) was hybridized to Illumina MouseWG-6 v2 Expression BeadChips (Illumina, San Diego, CA, USA) according to the manufacturer’s instructions. Hybridized arrays were washed and stained with Amersham Fluorolink streptavidin-Cy3 (GE Healthcare Bio-Sciences, Little Chalfont, UK) following the standard protocol provided in the bead array manual. Hybridization quality and overall chip performance were determined by visual inspection of both the internal quality controls and the raw scanned data in the Illumina BeadStudio software. Probe signal intensities were quantile-normalized and log-transformed. Microarray analysis was performed using the ArrayAssists software (Stratagene, La Jolla, CA, USA) in the R programming language.
The statistical differential gene expression analysis between groups was performed using the non-parametric RankProd approach. Oligonucleotides that presented changes between groups with a false discovery rate (FDR) < 0.05 were considered significant. The Kyoto Encyclopedia of Genes and Genomes (KEGG) pathways mapper (www.genome.jp/kegg) was consulted for the analysis of gene functions involved in circadian rhythm, lipid metabolism, tricarboxylic acid (TCA) cycle, oxidative phosphorylation, and ECM–receptor interaction. These microarray data were deposited in the Gene Expression Omnibus (GEO) database (GEO accession numbers: GSE120243).

2.10. Statistical Analysis

The parameter values are expressed as means (standard error of the mean, SEM). Significant differences between the groups were determined via Student’s t-test and Wilcoxon t-test using the SPSS software (SPSS Inc., Chicago, IL, USA). Results were considered statistically significant at p < 0.05.

3. Results

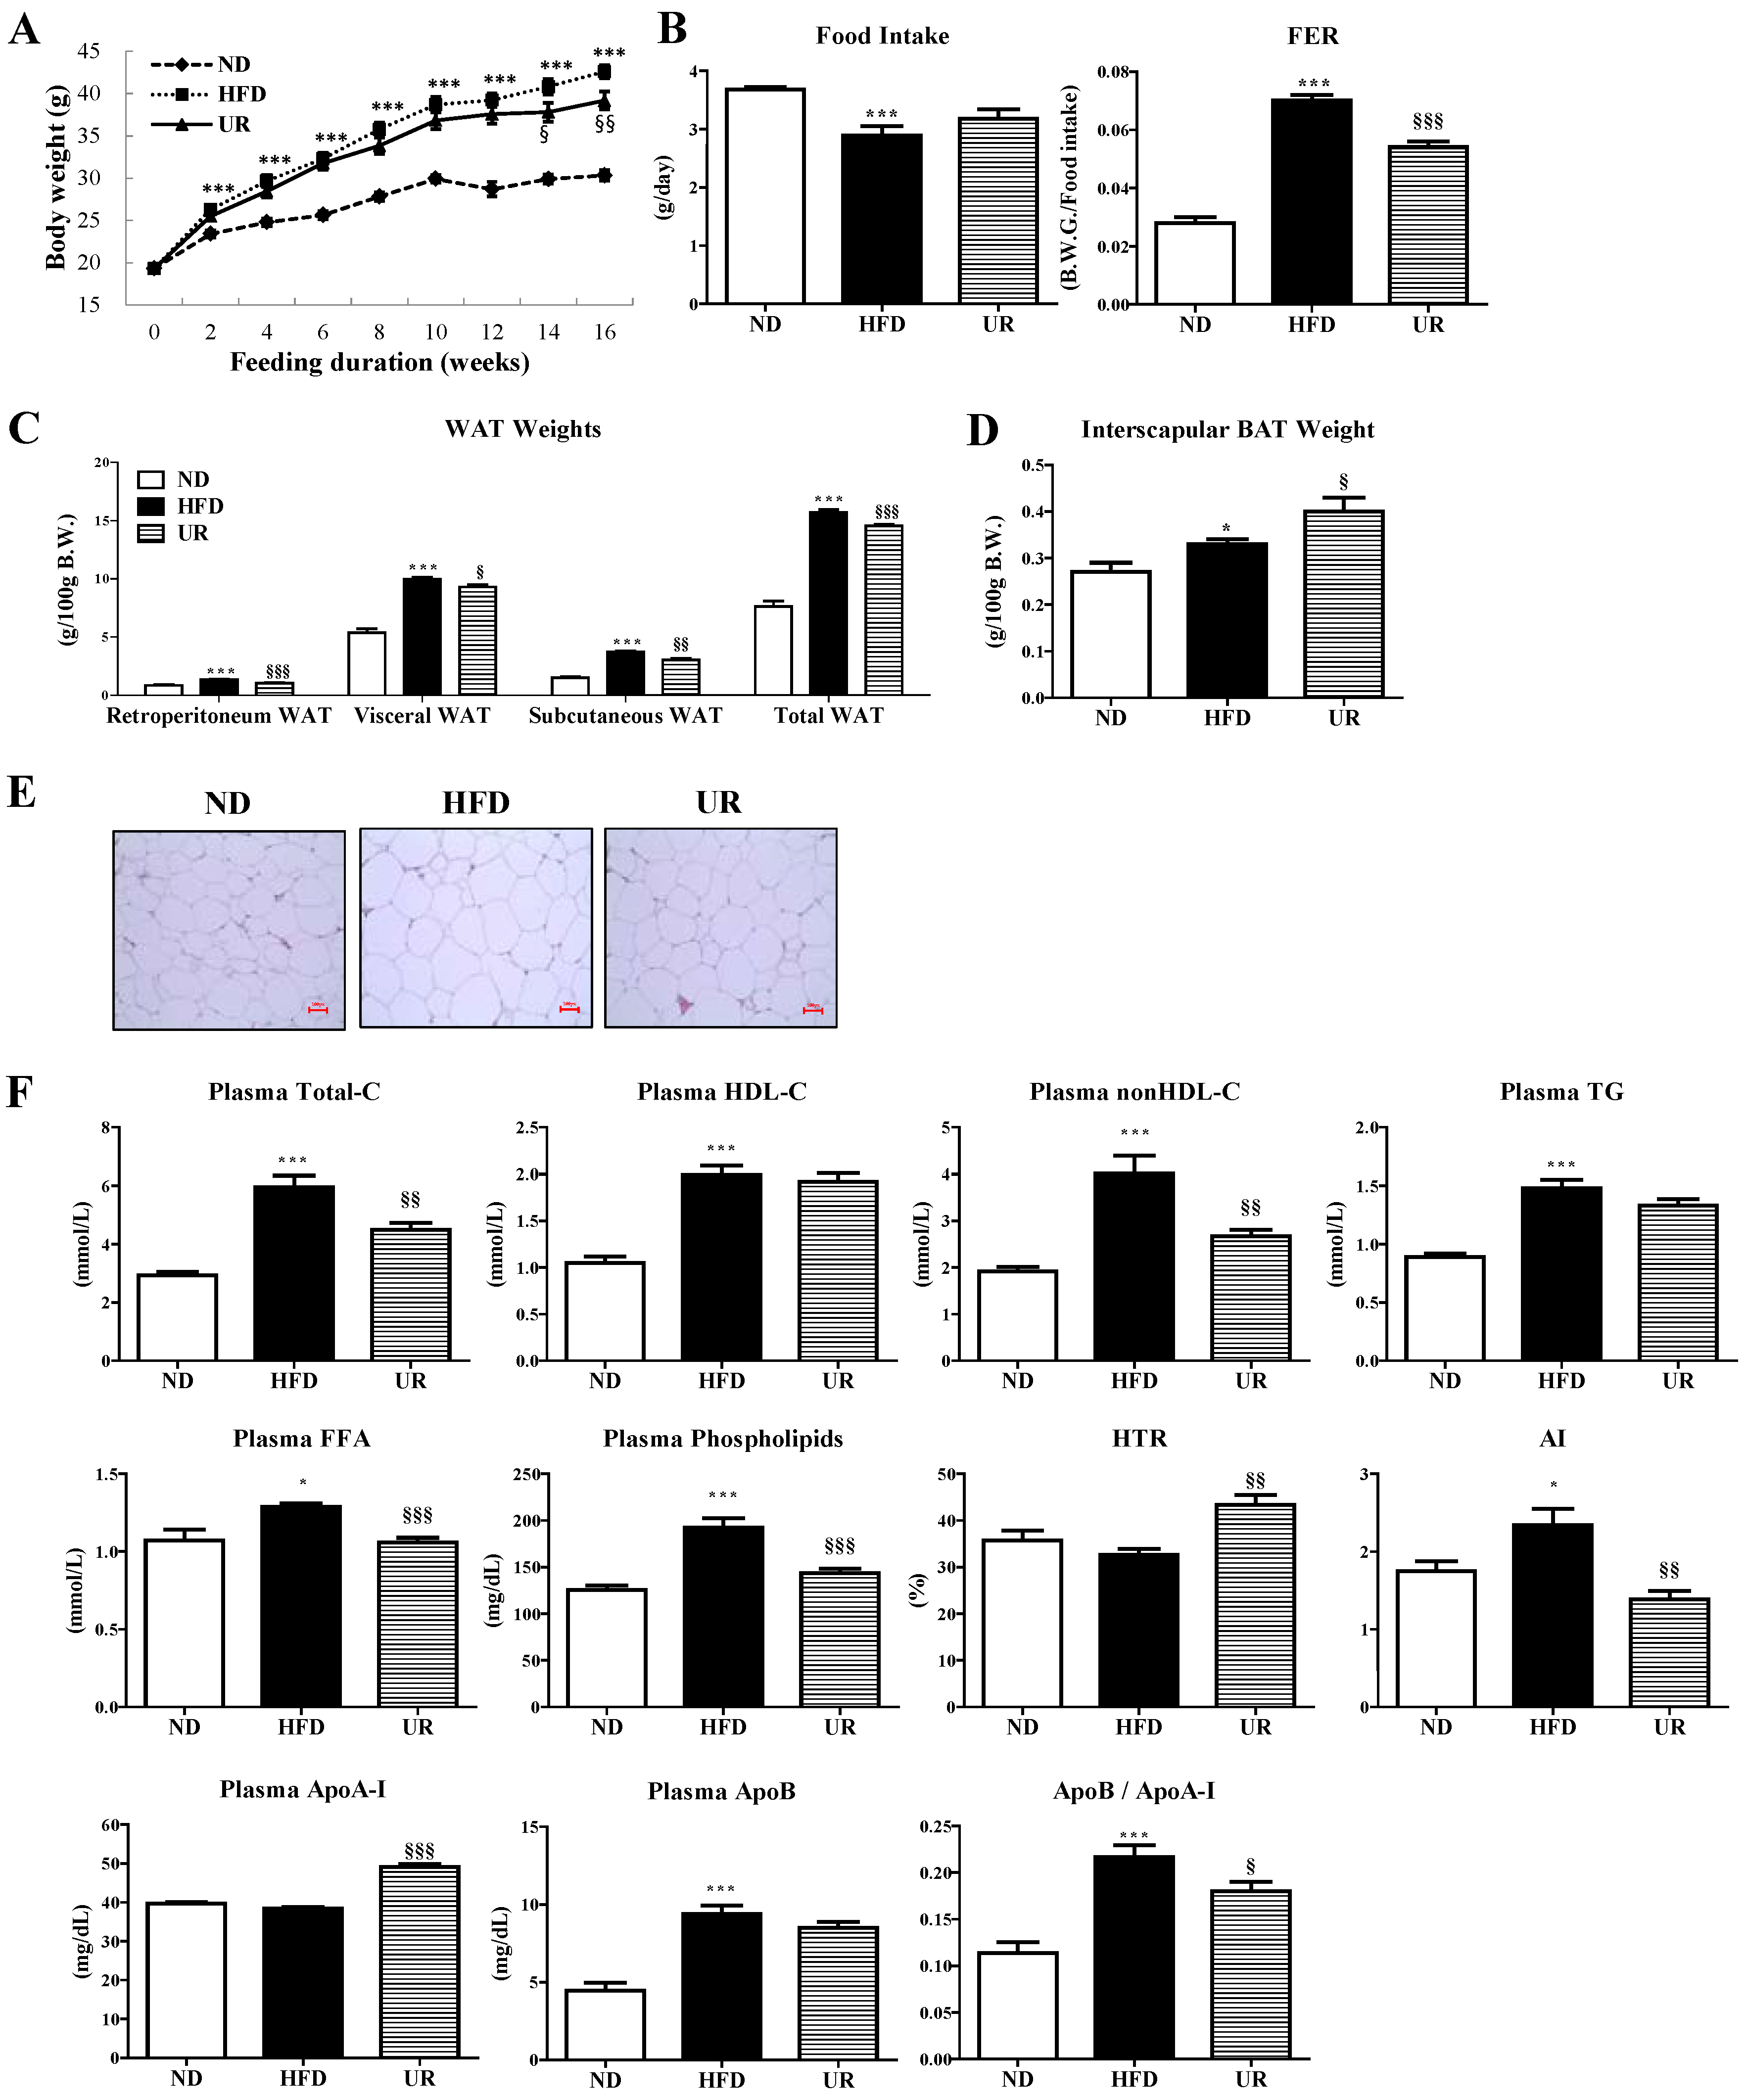
3.1. UR Decreased Adiposity and Plasma Lipids Levels

UR markedly decreased BW and food efficiency ratio (FER) after Week 14 compared to that of mice in the HFD group (Figure 1A,B). UR also significantly reduced the weights of white adipose tissue (WAT) depots, including retroperitoneal, subcutaneous, visceral (sum of epididymal, perirenal, mesenteric, and retroperitoneal WAT), and total WAT (sum of visceral, subcutaneous, and interscapular WAT), while increasing the interscapular brown adipose tissue (BAT) weight compared with those of mice in the HFD group (Figure 1C,D). Moreover, morphological observations revealed that the epididymal adipocyte size in mice in the UR group was smaller than that in mice in the HFD group (Figure 1E). Plasma levels of TC, non-HDL-C, FFA, phospholipid, AI, and apoB-to-apoAI ratio were significantly lower, whereas the apoA-I level and HTR were significantly higher in mice in the UR group than those in the HFD group (Figure 1F).

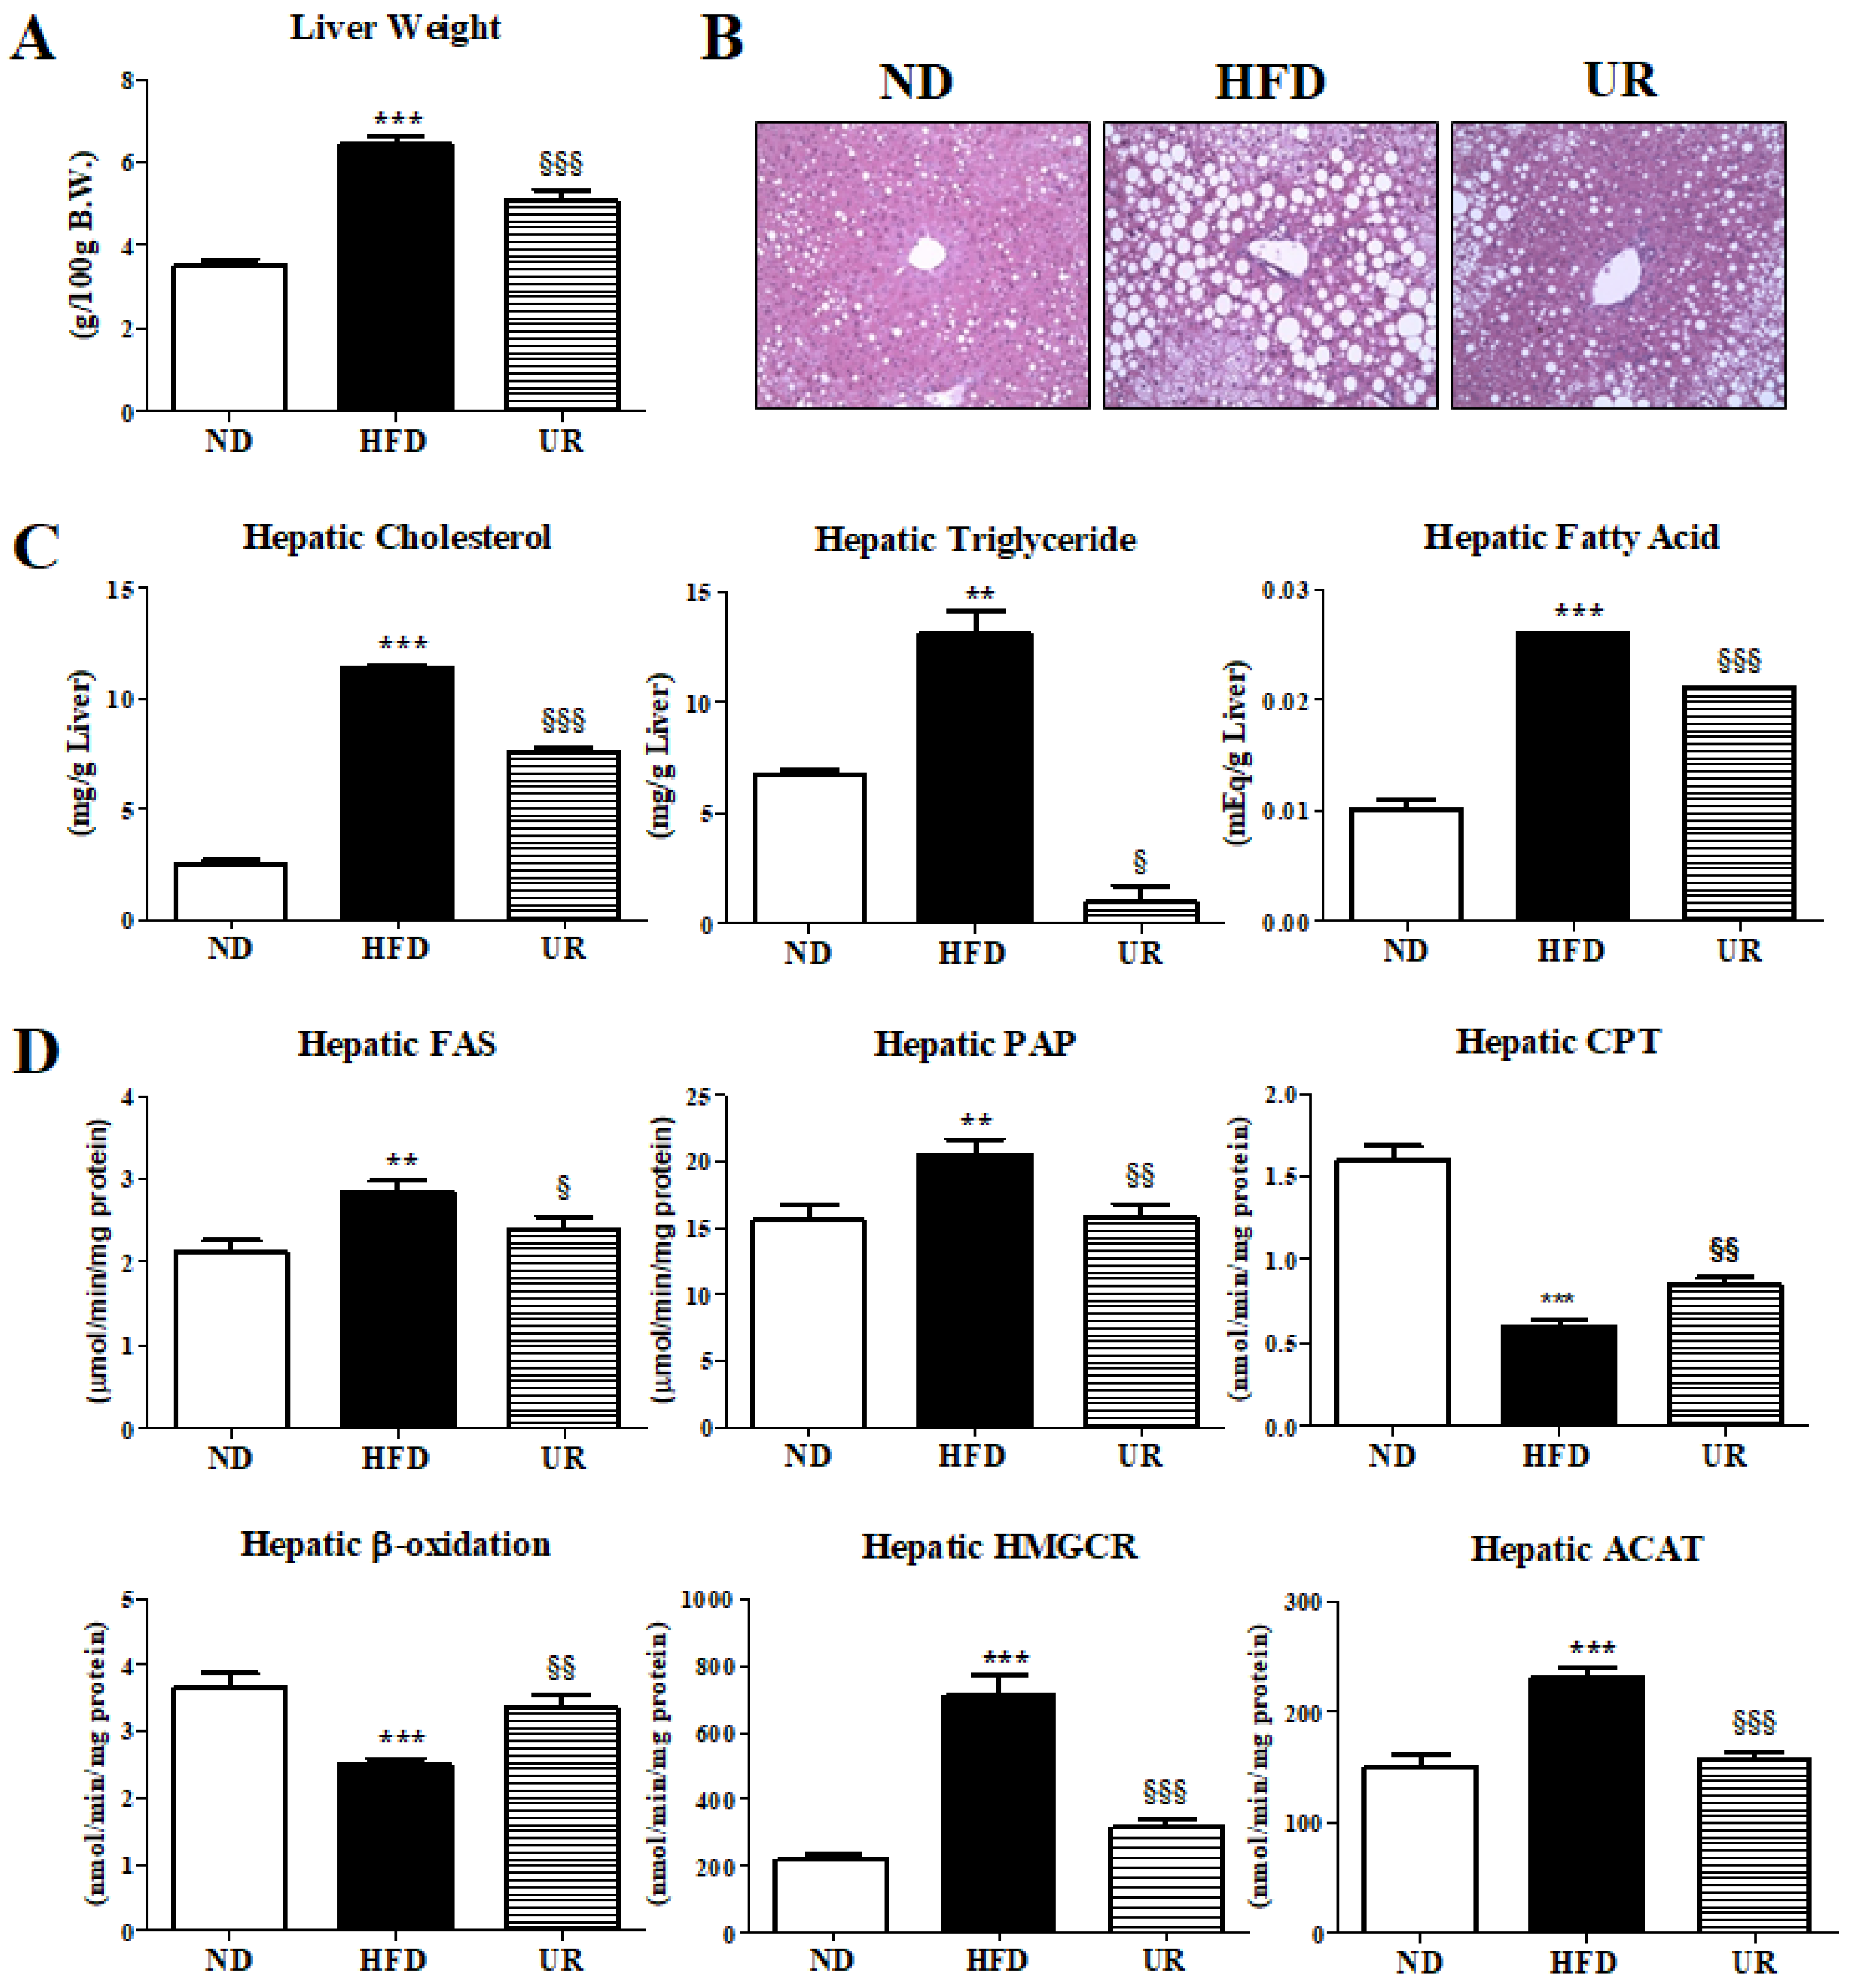
3.2. UR Abated HFD-Induced Hepatic Steatosis by Modulating Hepatic Lipid-Regulating Enzyme Activities

UR treatment significantly decreased the liver weight (Figure 2A) as well as the accumulation and size of hepatic lipid droplets relative to that of mice in the HFD group (Figure 2B). Furthermore, treatment with UR markedly decreased the hepatic cholesterol, TG, and fatty acid (FA) contents, relative to that of mice in the HFD group (Figure 2C). The activities of the hepatic enzymes involved in lipogenesis (i.e., FAS and PAP) were significantly reduced, and those related to FA oxidation (i.e., CPT and β-oxidation) were markedly increased by UR treatment compared to those in mice in the HFD group (Figure 2D). Activities of the hepatic cholesterol-regulating enzymes HMGCR and ACAT were also remarkably lower in mice in the UR group than those in mice in the HFD group (Figure 2D).

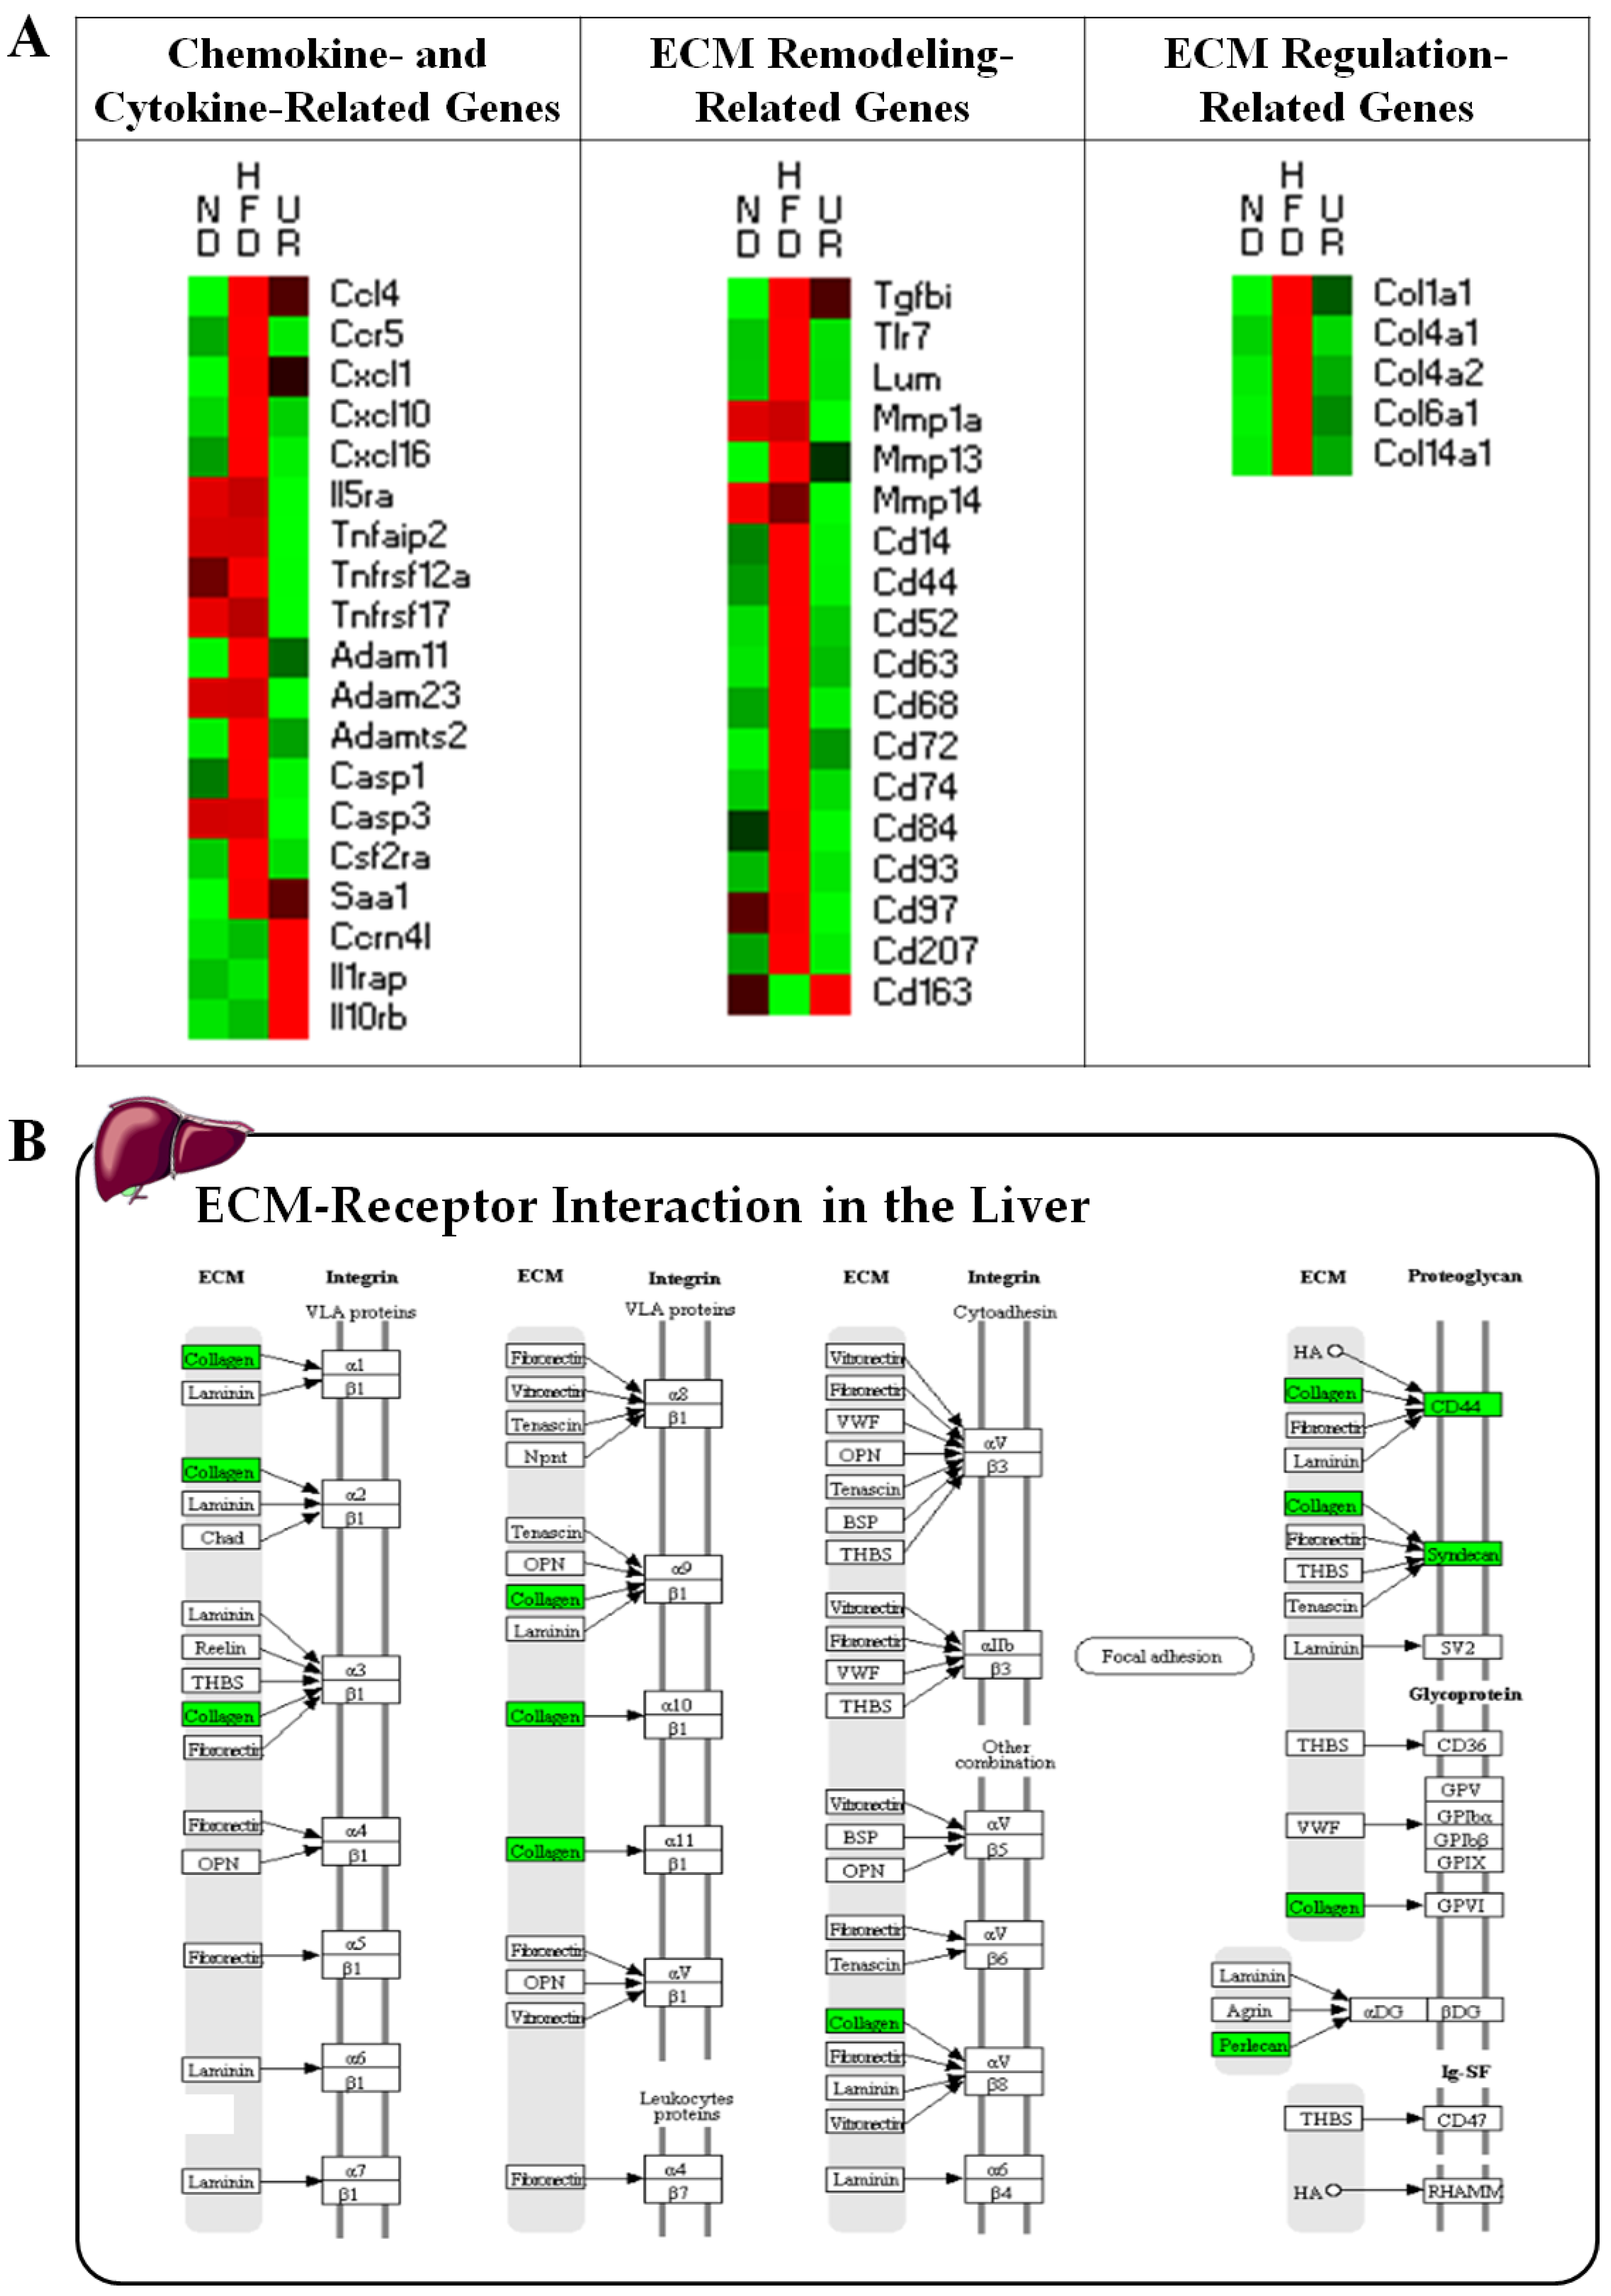
3.3. UR Ameliorated Tissue Fibrosis in Mice with DIO

Levels of hepatic lipotoxicity markers including plasma GOT and GPT were significantly decreased by UR treatment compared with those in mice in the HFD group (Figure 3A). Hepatic mitochondrial H2O2 and erythrocyte TBARS levels were also significantly lower in mice in the UR group than in mice in the HFD group (Figure 3B,C). The activity of plasma PON, an atheroprotective protein, was strikingly increased in mice in the UR group compared to that in mice in the HFD group (Figure 3D). To assess tissue fibrosis, we used Masson’s trichrome stain, which colors fibrous collagen-containing tissue blue, to display the fibrous tissue of the liver and adipose tissue in the HFD group. The hepatic portal vein of HFD-fed mice was surrounded by fibrous bands, and epididymal WAT depots in HFD-fed mice contained pronounced trichrome-positive “streaks” interspersed among the adipocytes. The UR group, on the other hand, showed normal hepatic architecture and fat-pad, with very thin, closely packed collagen sheets surrounding each adipocyte (Figure 3E).

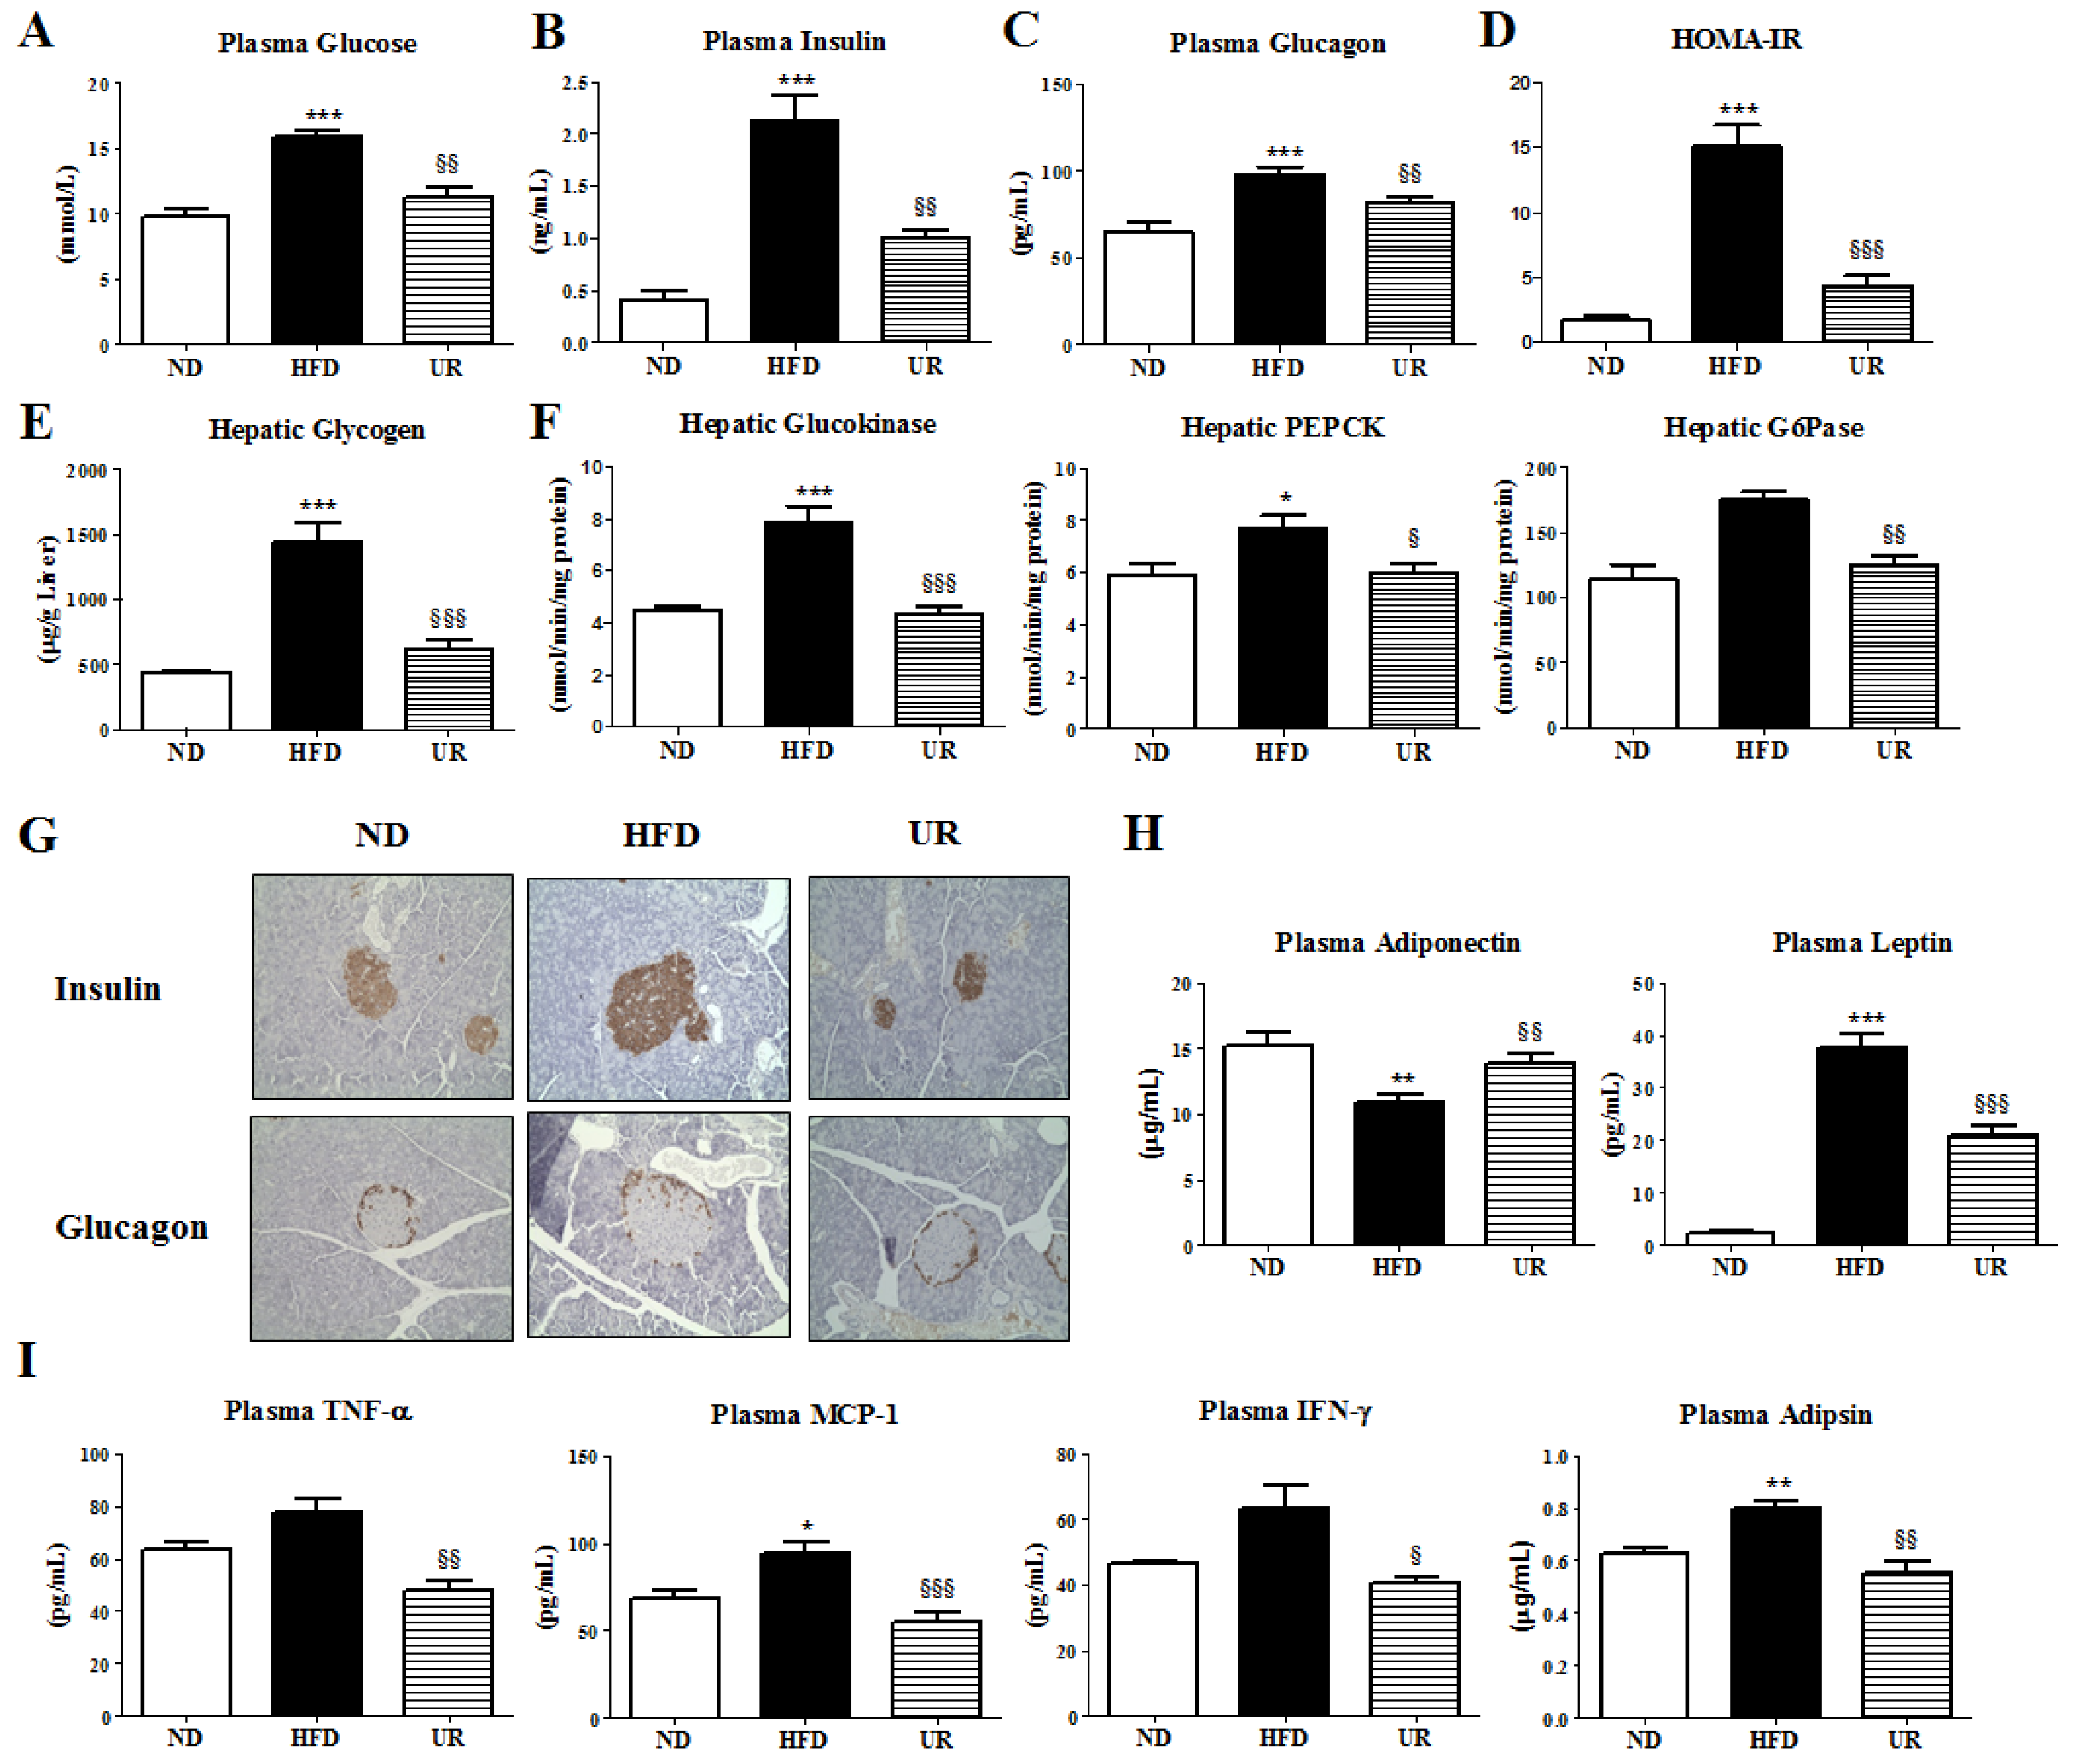
3.4. UR Prevented HFD-Induced IR and Pancreatic Islet Hypertrophy

UR significantly decreased plasma glucose, insulin, and glucagon levels, and HOMA-IR index relative to that in mice in the HFD group (Figure 4A–D). Glycogen levels and glucokinase, PEPCK, and G6Pase activities were lowered by UR compared with those in the liver of mice in the HFD group (Figure 4E,F). Immunohistochemical staining of the pancreatic tissue for insulin and glucagon also revealed that pancreatic islet hypertrophy caused by HFD was prevented by UR treatment, thereby normalizing the insulin and glucagon content in the plasma (Figure 4G). Moreover, expression of the anti-inflammatory cytokine adiponectin was markedly increased, whereas levels of pro-inflammatory cytokines/chemokines such as leptin, TNF-α, MCP-1, IFN-γ, and adipsin were significantly suppressed by UR treatment relative to that in mice in the HFD group (Figure 4H,I).

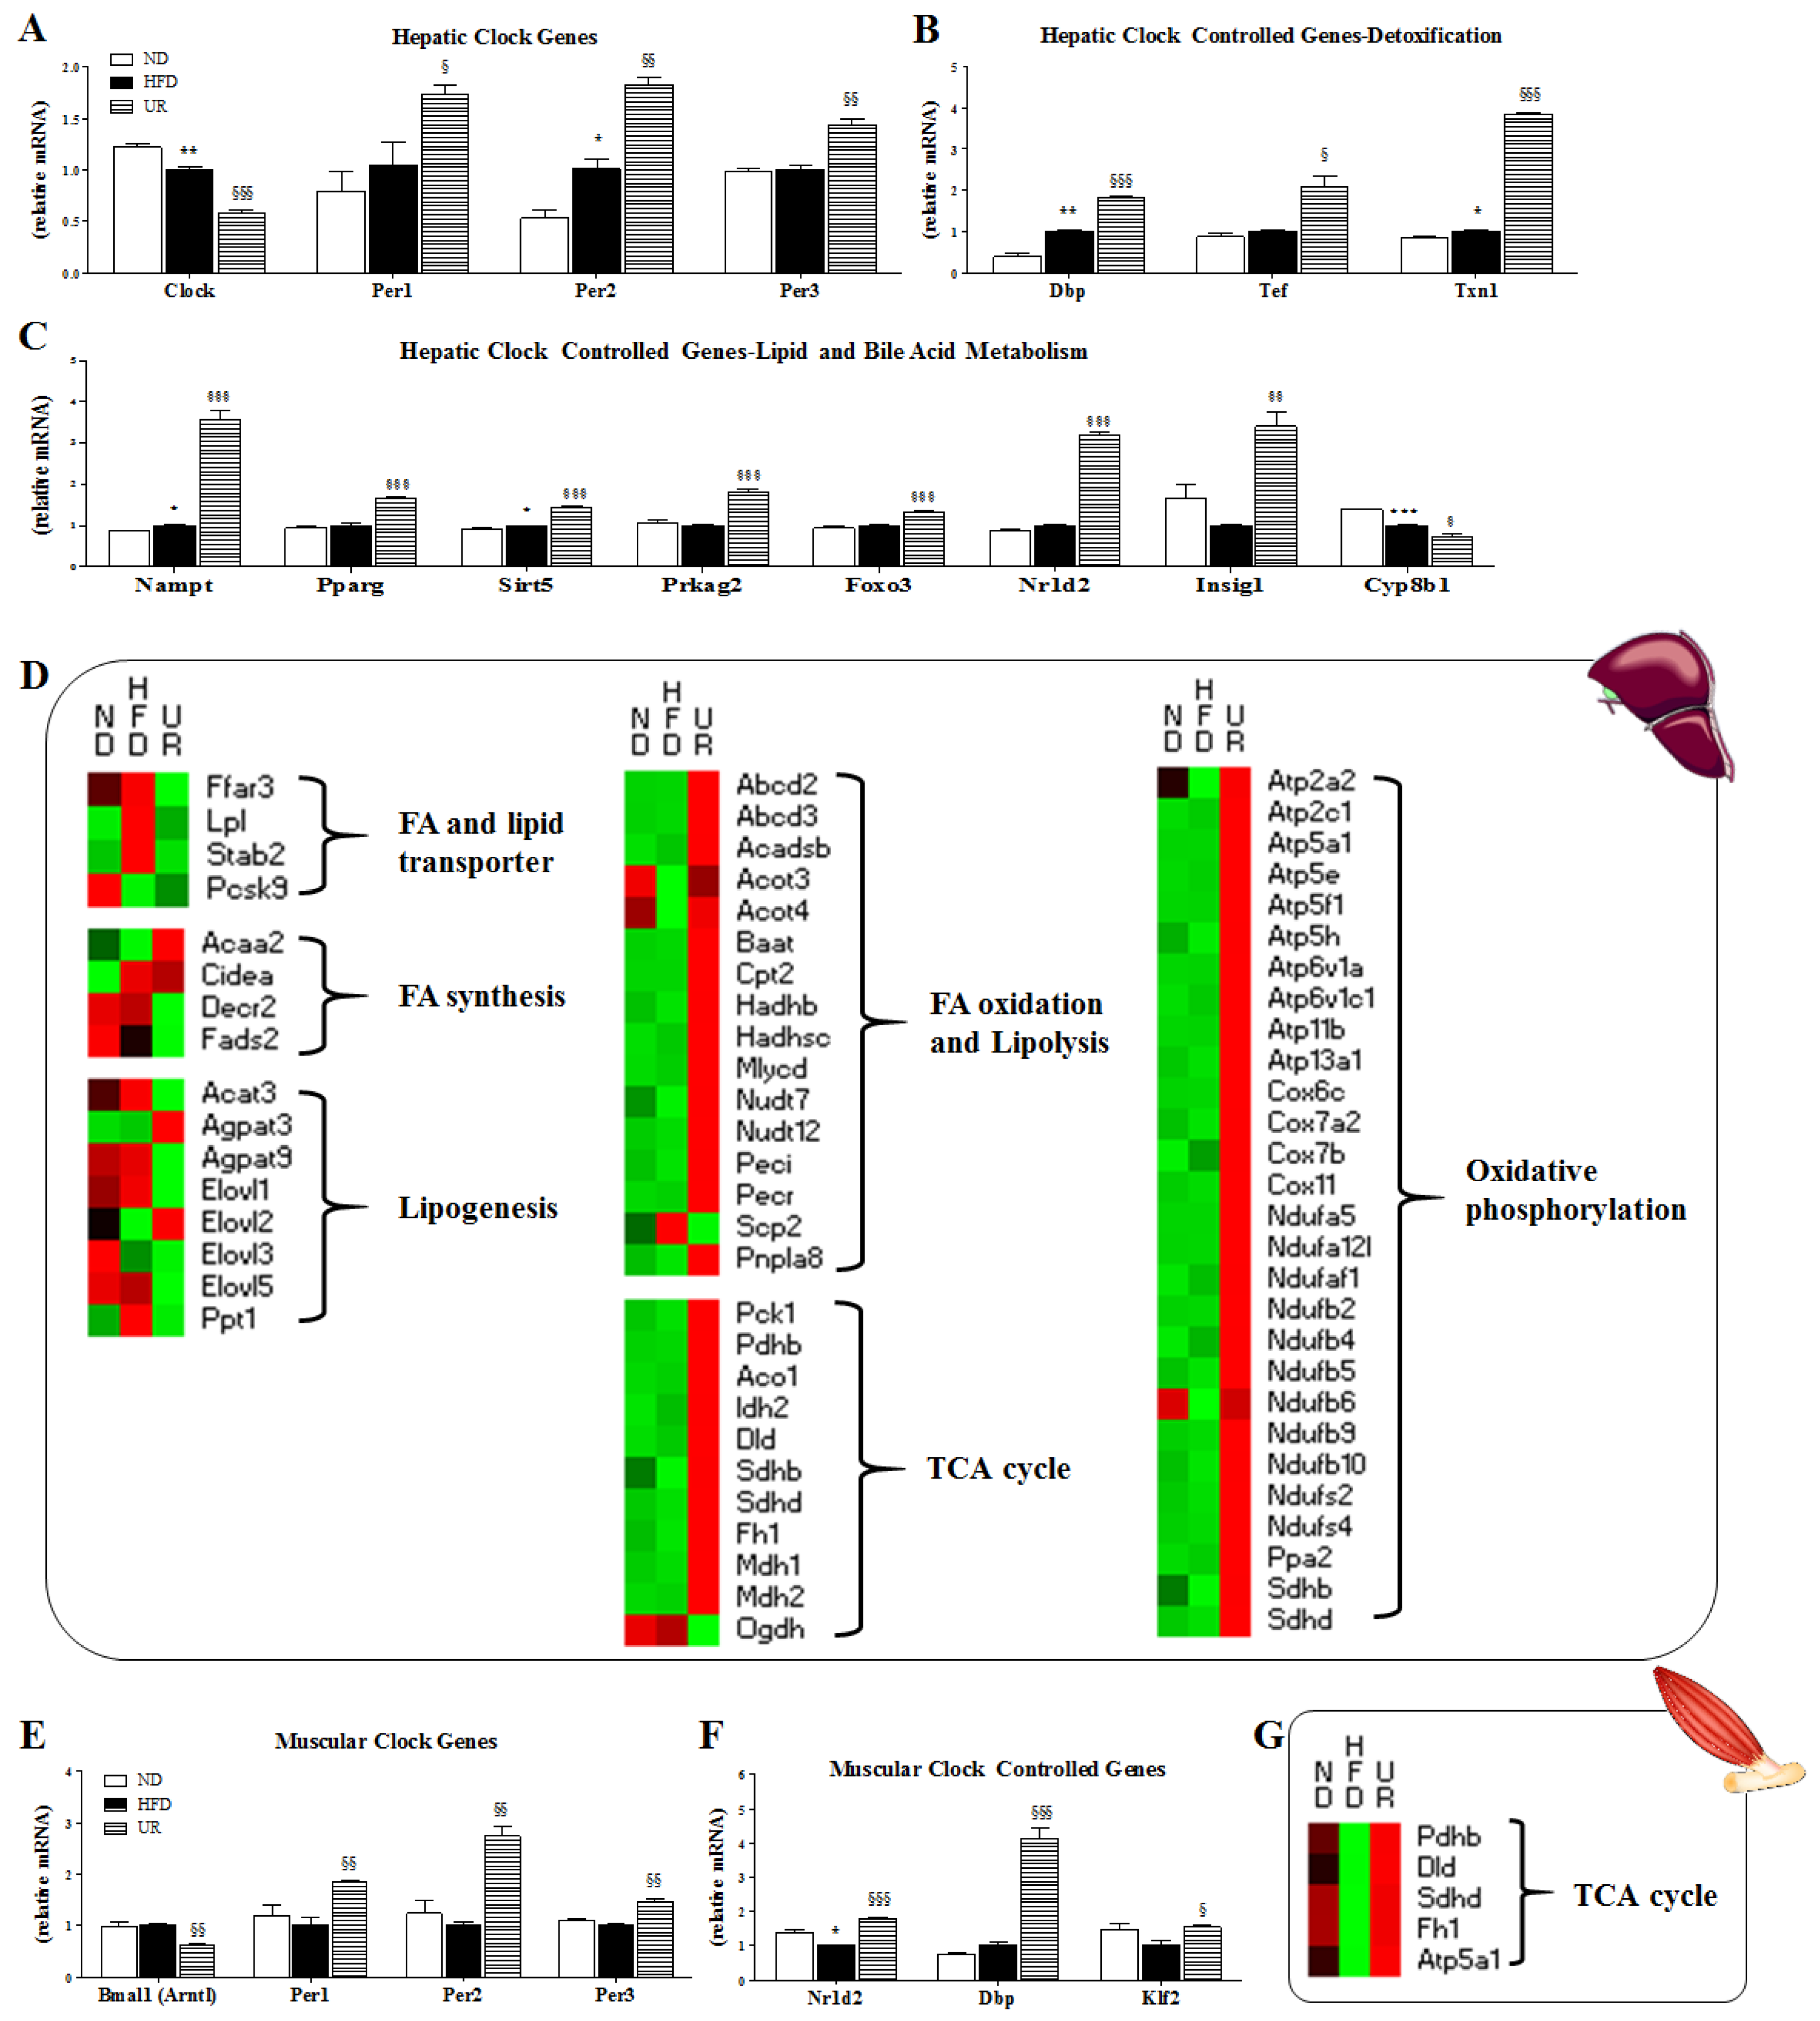
3.5. UR Altered the Transcriptional Responses Involved in Circadian Clock and ECM in the Liver and Muscle Tissue of DIO Mice

Microarray analysis revealed that 1773 genes in the liver, 106 genes in WAT, and 202 genes in the muscle were differentially expressed in response to UR treatment compared to those in HFD-fed mice (Figures S1 and S2). In the liver, UR altered the expression of clock genes and CCGs. Among them, UR reduced Clock gene expression, while enhancing the expression of Per1, Per2, and Per3 genes when compared to that in mice in the HFD group (Figure 5A). The expression of genes responsible for detoxification (Dbp, Tef, and Txn1), as well as lipid and bile acid metabolism (Nampt, Pparg, Sirt5, Prkag2, Foxo3, Nr1d2, and Insig1) was increased, while expression of the bile acid biosynthesis-related gene Cyp8b1 was down-regulated by UR (Figure 5B,C). With regard to lipid metabolism, UR lowered the expression of hepatic genes up-regulated by HFD and involved in FA and lipid transport, FA synthesis, and lipogenesis, and enhanced the expression of genes associated with FA oxidation and lipolysis, the TCA cycle, and oxidative phosphorylation (Figure 5D and Table S2). Microarray analysis of the muscle also revealed that UR altered the expression of clock and CCGs, and their transcription regulators. UR treatment decreased Arntl (Bmal1) gene expression and increased that of PER family genes (Per1, Per2, and Per3), CCGs (Nr1d2, Dbp, and Klf2), and TCA cycle-related genes (Pdhb, Dld, Sdhb, Fh1, and Atp5a1), consistent with our hepatic microarray analysis results (Figure 5E–G and Table S3).
Next, we examined the levels of many key fibrotic genes involved in cytokine/chemokine expression, ECM remodeling, and ECM regulation during HFD-induced inflammation (Figure 6 and Tables S4 and S5). With regard to inflammatory pathways involved in obesity, UR down-regulated the hepatic transcription of several pro-inflammatory chemokines/cytokines (Ccl4, Ccr5, Cxcl1, Cxcl10, Cxcl16, Il5ra, Tnfaip2, Infrsf12a, Tnfrsf17, Adam11, Adam23, Adamts2, Casp1, Casp3, Csf2ra, and Saa1), while up-regulating the expression of Ccrn4l, Il1rap, and Il10rb genes. The expression of most of the genes responsible for ECM remodeling and regulation was up-regulated by consumption of the HFD, whereas these genes were down-regulated by UR treatment. Specifically, ECM remodeling-associated genes (Tgfbi, Tlr7, Lum, Mmp1a, Mmp13, Cd14, Cd44, Cd52, Cd63, Cd68, Cd72, Cd74, Cd84, Cd93, and Cd207) and ECM regulation-associated genes (Col1a1, Col4a1, Col4a2, Col6a1, and Col14a1) were down-regulated, while expression of the M2 macrophage marker Cd163 was markedly up-regulated by UR in comparison to that in mice in the HFD group (Figure 6A and Table S4). Moreover, pathway analysis using the KEGG mapper also revealed that the expression of genes involved in ECM–receptor interactions was down-regulated by UR (Figure 6B).
In contrast to our hepatic microarray results, UR increased the expression of muscular genes involved in cytokine/chemokine expression (Adam9, Cxcl4, Il15, Itgbl1, and Itgb1bp3), ECM remodeling (Dcn, Sparc, and Sparcl1), and ECM regulation (Col1a1, Col3a1, Col5a1, Col6a1, Col6a3, Col8a1, and Col16a1; Table S5).

4. Discussion

In the current study, we evaluated the effects of UR and the molecular mechanisms underlying its metabolic regulatory properties in DIO and metabolic disease via transcriptomic analysis. This study demonstrates for the first time that dietary UR improved inflammation-mediated metabolic diseases including DIO, hepatic steatosis, dyslipidemia, fibrosis, and IR by controlling the circadian clock and suppressing hepatic ECM remodeling in DIO mice. The following observations were made: (a) UR improved hepatic steatosis by restricting TG availability and decreasing lipogenesis, while promoting lipolysis, TCA cycle, and oxidative phosphorylation in the liver; (b) oligonucleotide microarray profiling revealed that hepatic transcriptomic changes in response to UR treatment were more dynamic than those in WAT and muscle, and that UR altered the expression of various clock and CCGs, which may be linked to the improvement of hepatic steatosis and fibrosis by controlling lipid metabolism and enhancing detoxification; (c) UR reduced excessive reactive oxygen species (ROS) production via an increase in plasma PON activity, adipokine/cytokine dysregulation, and ECM accumulation in the liver, which also contributed to improvement of hepatic lipotoxicity and fibrosis; and (d) UR treatment improved and normalized pancreatic islet dysfunction, and suppressed hepatic gluconeogenesis, thereby reducing obesity-associated IR in HFD-fed mice.
UR exerts various biological effects, including anti-inflammatory, anti-oxidative, anti-cancer, and anti-obesity activities [10,11,12,13,14,15]. In rat models of DIO, UR administration has been reported to ameliorate HFD-induced hepatic steatosis and inflammatory hyperalgesia by activating the PPAR-α pathway [10,11], and prevent obesity and IR by increasing FFA burning through enhancing skeletal muscle FFA uptake and β-oxidation via an uncoupling protein 3 (UCP3)/AMPK-dependent pathway [12]. In HFD-fed Swiss mice, administration of aqueous UR (50 mg/L) for 15 weeks decreased BW, visceral adiposity, and blood glucose and plasma lipid levels [13]. In addition, treatment with UR (0.27% w/w) for three weeks increased energy expenditure in skeletal muscle and brown fat, thus preventing obesity, glucose tolerance, and hepatic steatosis in C57BL/6J HFD-fed mice [14]. However, to date, few studies have been conducted on the effects of long-term UR treatment based on the integration of transcriptional profiles and phenotypic biomarkers. In the current study, we performed microarray analysis on three murine tissues (liver, muscle, and epididymal WAT) to examine the effects and potential underlying mechanisms of long-term dietary UR supplementation on HFD-induced obesity and associated metabolic diseases, including hepatic steatosis, fibrosis, IR, dyslipidemia, and inflammation in C57BL/6J mice. Oligonucleotide microarray profiling revealed that, among the three organs, the liver transcriptome was the most significantly altered by UR, revealing changes approximately 8.8 and 16.7 times higher than those in muscle and WAT, respectively, suggesting that UR is a more effective regulator of the liver transcriptome.
In this study, our global transcriptomic analyses showed that canonical pathways associated with the “circadian rhythm” and “ECM–receptor interaction” were effectively regulated by UR in the liver. The circadian clock is an endogenous biological timekeeping system that synchronizes physiology and behavior to day/night cycles. Interactions between core clock transcription factors (CLOCK and BMAL1) and repressor Period (Per) and Cryptochrome (Cry) genes, as well as a spectrum of CCGs, are known to play essential roles in the metabolism of glucose, bile acids, lipids, and cholesterol in the liver [5]. Disruption of genetic or environmental factors such as energy imbalance and the circadian clock can cause metabolic diseases including hepatic steatosis, fibrosis, and diabetes, or exacerbate pathological states [5,6,7,8,9]. In this study, UR increased the expression of Per (Per1, Per2, and Per3) mRNA, and decreased that of clock genes, thereby modulating the expression of various CCGs involved in detoxification (Dbp, Tef, and Txn1), and lipid and bile acid metabolism (Nampt, Pparg, Sirt5, Prkag2, Foxo3, Nr1d2, and Insig1). Circadian clocks mediate protective responses to oxidative stress [33], and albumin D-site-binding protein (DBP), thyrotroph embryonic factor (TEF), and thioredoxin (TXN), the master regulators of hepatic detoxification enzymes, are rhythmically controlled by clock genes [34]. Consistent with the increased expression of detoxification genes observed in UR-supplemented mice, we observed decreased excessive ROS production as evidenced by reduced hepatic H2O2 and erythrocyte TBARS levels, as well as enhanced plasma PON activity. It is well known that ROS production contributes to fibrosis and IR, and various studies support the concept that molecular clock output genes involved in detoxification, such as Dbp and Txn, perform essential functions in the development of metabolic diseases [7,35]. In addition, UR decreased the expression of genes associated with chemokine/cytokine expression, ECM remodeling, and ECM regulation that were up-regulated by HFD, and which are known to contribute to fibrosis. Thus, these observations indicate that UR has the potential to regulate hepatic clock genes and CCGs involved in detoxification, which is linked to reduced pro-inflammatory responses, ECM accumulation in the liver, and increased insulin sensitivity, thereby preventing hepatic lipotoxicity, fibrosis, and IR in DIO mice.
CCGs altered by UR treatment were also strongly linked to hepatic circadian lipid metabolism. Among CCGs, UR increased the mRNA expression of Sirt5, Prkag2 (AMPK), and Foxo3 involved in lipolysis and FA oxidation, and decreased Cyp8b1 mRNA expression involved in bile acid synthesis compared to that in mice in the HFD group, which in turn induced a significant increase in the hepatic TCA cycle and oxidative phosphorylation, which may contribute to the reduction of hepatic steatosis. Other core clock genes, such as Nampt, Pparg, Nr1d2, and Insig1, were also significantly up-regulated by UR. Previous studies have reported that Nampt mRNA is decreased in the liver of human subjects with non-alcoholic fatty liver disease, and Nampt has been shown to protect hepatocytes by increasing SIRT1 activity [36,37]. Nr1d2 also represses the expression of hepatic Apoc3 mRNA, a risk factor for atherosclerosis [38], and hepatic Insig1 overexpression reduces lipogenesis via decreased expression of Srebp1c mRNA and its target enzymes [39]. Interestingly, UR increased Pparg and Nampt mRNA expression. Stromsdorfer et al. reported that the loss of nicotinamide phosphoribosyltransferase (NAMPT) impairs adipose tissue function and decreases PPARγ expression by increasing its phosphorylation, and in turn decreases adiponectin production, while increasing FFA production, which causes IR in adipose tissue, liver, and skeletal muscle [40]. Therefore, it is plausible that a UR-mediated increase in hepatic Nampt mRNA expression could increase Pparg expression, which in turn reduces plasma FFA and increases adiponectin, thereby ameliorating hepatic steatosis and IR.
Consistent with the hepatic microarray results, UR increased Per (Per1, Per2, and Per3) mRNA expression, and diminished Arntl (BMAL1) gene expression in the skeletal muscle, thereby increasing muscular expression of CCGs including Nr1d2, Dbp, and Klf2, and TCA cycle-associated genes. However, in contrast to that in the liver, mRNA expression involved in chemokine/cytokine expression, ECM remodeling, and ECM regulation was increased rather than decreased by UR supplementation. Our findings contrast somewhat with previous studies demonstrating greater ECM accumulation in skeletal muscle in obese insulin-resistant models [41,42]. Our observations after UR treatment may be linked with ECM homeostasis in the muscle, although this would require additional experiments for verification. Taken together, the present findings suggest that UR treatment attenuates hepatic steatosis, fibrosis, and IR by modulating liver-specific metabolic responses, in connection with circadian regulation.

5. Conclusions

In summary, the data obtained from our animal study indicate that UR can suppress DIO and modulate obesity-associated metabolic disorders including hepatic steatosis, fibrosis, and IR by modulating liver-specific metabolic responses such as “ECM–receptor interactions” under circadian control. Moreover, considering that no effective treatment for liver fibrosis is currently available, therapeutic approaches targeting hepatic circadian clock genes and CCGs using UR may ameliorate the deleterious effects of DIO and complications associated therewith, such as hepatic fibrosis. However, these observations require additional experiments for verification, because translation of results obtained in an animal model to a human population is not completely reflected.

Supplementary Materials

The following are available online at https://www.mdpi.com/2072-6643/10/11/1719/s1, Figure S1: The number of differentially expressed genes (DEGs) in the liver, adipose tissue and skeletal muscle of C57BL/6J mice. Differentially expressed genes based on comparison of HFD vs. ND and UR vs. HFD according to p-value < 0.05, log2 fold change > 0.5, Figure S2: Real-time RT-qPCR validation. Microarray and RT-qPCR data shown as means ± S.E. ND vs. HFD; * p < 0.05, ** p < 0.01, *** p < 0.001. HFD vs. UR; § p < 0.05, §§ p < 0.01, §§§ p < 0.001. White bar = ND group; black bar = HFD group; stripe bar = UR group, Table S1: Primer sequences used for RT-qPCR validation of the microarray data, Table S2: Effect of ursolic acid on transcriptional pattern of lipid metabolism-related genes in liver of C57BL/6J mice, Table S3: Effect of ursolic acid on transcriptional pattern of TCA cycle-related genes in muscle of C57BL/6J mice, Table S4: Effect of ursolic acid on transcriptional pattern of fibrosis-related genes in liver of C57BL/6J mice. Table S5: Effect of ursolic acid on transcriptional pattern of fibrosis-related genes in muscle of C57BL/6J mice.

Author Contributions

E.-Y.K. and S.-K.S. contributed to the design of the experiments, generated the data, contributed to the discussion, wrote the manuscript, and reviewed/edited the manuscript. M.-S.C. contributed to the original idea, generated the data, contributed to the discussion, wrote the manuscript, and reviewed/edited the manuscript.

Funding

This research was supported by a National Research Foundation (NRF) of Korea grant funded by the Korea government (MSIP, 2015R1C1A2A01051533, 2016R1A2B4011329 and 2018R1D1A1B07043068).

Acknowledgments

The authors thank Ji-Young Choi, Su-Jung Cho, Ri Ryu and Youngji Han for advice and excellent technical support.

Conflicts of Interest

The authors declare no conflict of interest.

References

  1. Guh, D.P.; Zhang, W.; Bansback, N.; Amarsi, Z.; Birmingham, C.L.; Anis, A.H. The incidence of co-morbidities related to obesity and overweight: A systematic review and meta-analysis. BMC Public Health 2009, 9, 88. [Google Scholar] [CrossRef] [PubMed]
  2. Day, C.P.; James, O.F. Steatohepatitis: A tale of two “hits”? Gastroenterology 1998, 114, 842–845. [Google Scholar] [CrossRef]
  3. Eng, F.J.; Friedman, S.L. Fibrogenesis I. New insights into hepatic stellate cell activation: The simple becomes complex. Am. J. Physiol. Gastrointest. Liver Physiol. 2000, 279, G7–G11. [Google Scholar] [CrossRef] [PubMed]
  4. Carmiel-Haggai, M.; Cederbaum, A.I.; Nieto, N. A high-fat diet leads to the progression of non-alcoholic fatty liver disease in obese rats. FASEB J. 2005, 19, 136–138. [Google Scholar] [CrossRef] [PubMed]
  5. Ferrell, J.M.; Chiang, J.Y. Circadian rhythms in liver metabolism and disease. Acta Pharm. Sin. B 2015, 5, 113–122. [Google Scholar] [CrossRef] [PubMed]
  6. Akhtar, R.A.; Reddy, A.B.; Maywood, E.S.; Clayton, J.D.; King, V.M.; Smith, A.G.; Gant, T.W.; Hastings, M.H.; Kyriacou, C.P. Circadian cycling of the mouse liver transcriptome, as revealed by cDNA microarray, is driven by the suprachiasmatic nucleus. Curr. Biol. 2002, 12, 540–550. [Google Scholar] [CrossRef]
  7. Ohta, Y.; Taguchi, A.; Matsumura, T.; Nakabayashi, H.; Akiyama, M.; Yamamoto, K.; Fujimoto, R.; Suetomi, R.; Yanai, A.; Shinoda, K.; et al. Clock gene dysregulation induced by chronic er stress disrupts β-cell function. EBioMedicine 2017, 18, 146–156. [Google Scholar] [CrossRef] [PubMed]
  8. Turek, F.W.; Joshu, C.; Kohsaka, A.; Lin, E.; Ivanova, G.; McDearmon, E.; Laposky, A.; Losee-Olson, S.; Easton, A.; Jensen, D.R.; et al. Obesity and metabolic syndrome in circadian Clock mutant mice. Science 2005, 308, 1043–1045. [Google Scholar] [CrossRef] [PubMed]
  9. Pekovic-Vaughan, V.; Gibbs, J.; Yoshitane, H.; Yang, N.; Pathiranage, D.; Guo, B.; Sagami, A.; Taguchi, K.; Bechtold, D.; Loudon, A.; et al. The circadian clock regulates rhythmic activation of the NRF2/glutathione-mediated antioxidant defense pathway to modulate pulmonary fibrosis. Genes Dev. 2014, 28, 548–560. [Google Scholar] [CrossRef] [PubMed] [Green Version]
  10. Li, S.; Liao, X.; Meng, F.; Wang, Y.; Sun, Z.; Guo, F.; Li, X.; Meng, M.; Li, Y.; Sun, C. Therapeutic role of ursolic acid on ameliorating hepatic steatosis and improving metabolic disorders in high-fat diet-induced non-alcoholic fatty liver disease rats. PLoS ONE 2014, 9, e86724. [Google Scholar] [CrossRef] [PubMed]
  11. Zhang, Y.; Song, C.; Li, H.; Hou, J.; Li, D. Ursolic acid prevents augmented peripheral inflammation and inflammatory hyperalgesia in high-fat diet-induced obese rats by restoring downregulated spinal PPARα. Mol. Med. Rep. 2016, 13, 5309–5316. [Google Scholar] [CrossRef] [PubMed]
  12. Chu, X.; He, X.; Shi, Z.; Li, C.; Guo, F.; Li, S.; Li, Y.; Na, L.; Sun, C. Ursolic acid increases energy expenditure through enhancing free fatty acid uptake and β-oxidation via an UCP3/AMPK-dependent pathway in skeletal muscle. Mol. Nutr. Food Res. 2015, 59, 1491–1503. [Google Scholar] [CrossRef] [PubMed]
  13. Rao, V.S.; de Melo, C.L.; Queiroz, M.G.; Lemos, T.L.; Menezes, D.B.; Melo, T.S.; Santos, F.A. Ursolic acid, a pentacyclic triterpene from Sambucus australis, prevents abdominal adiposity in mice fed a high-fat diet. J. Med. Food 2011, 14, 1375–1382. [Google Scholar] [CrossRef] [PubMed]
  14. Shishodia, S.; Majumdar, S.; Banerjee, S.; Aggarwal, B.B. Ursolic acid inhibits nuclear factor-kappaB activation induced by carcinogenic agents through suppression of IkappaBalpha kinase and p65 phosphorylation: Correlation with down-regulation of cyclooxygenase 2, matrix metalloproteinase 9, and cyclin D1. Cancer Res. 2003, 63, 4375–4383. [Google Scholar] [PubMed]
  15. Kunkel, S.D.; Elmore, C.J.; Bongers, K.S.; Ebert, S.M.; Fox, D.K.; Dyle, M.C.; Bullard, S.A.; Adams, C.M. Ursolic acid increases skeletal muscle and brown fat and decreases diet-induced obesity, glucose intolerance and fatty liver disease. PLoS ONE 2012, 7, e39332. [Google Scholar] [CrossRef] [PubMed]
  16. Folch, J.; Lees, M.; Sloane Stanley, G.H. A simple method for the isolation and purification of total lipides from animal tissues. J. Biol. Chem. 1957, 226, 497–509. [Google Scholar] [PubMed]
  17. Shao, R.; Ring, S.C.; Tarloff, J.B. Coincubation of rat renal proximal tubules with hepatic subcellular fractions potentiates the effects of para-aminophenol. Fundam. Appl. Toxicol. 1997, 39, 101–108. [Google Scholar] [CrossRef] [PubMed]
  18. Nepokroeff, C.M.; Lakshmanan, M.R.; Porter, J.W. Fatty-acid synthase from rat liver. Methods Enzymol. 1975, 35, 37–44. [Google Scholar] [PubMed]
  19. Walton, P.A.; Possmayer, F. Mg2+-dependent phosphatidate phosphohydrolase of rat lung: Development of an assay employing a defined chemical substrate which reflects the phosphohydrolase activity measured using membrane-bound substrate. Anal. Biochem. 1985, 151, 479–486. [Google Scholar] [CrossRef]
  20. Markwell, M.A.; McGroarty, E.J.; Bieber, L.L.; Tolbert, N.E. The subcellular distribution of carnitine acyltransferases in mammalian liver and kidney. A new peroxisomal enzyme. J. Biol. Chem. 1973, 248, 3426–3432. [Google Scholar] [PubMed]
  21. Lazarow, P. Assay of peroxisomal b-oxidation of fatty acids. Methods Enzymol. 1981, 72, 315–319. [Google Scholar] [PubMed]
  22. Shapiro, D.J.; Nordstrom, J.L.; Mitschelen, J.J.; Rodwell, V.W.; Schimke, R.T. Micro assay for 3-hydroxy-3-methylglutaryl-CoA reductase in rat liver and in L-cell fibroblasts. Biochim. Biophys. Acta 1974, 370, 369–377. [Google Scholar] [CrossRef]
  23. Gillies, P.J.; Rathgeb, K.A.; Perri, M.A.; Robinson, C.S. Regulation of acyl-CoA:cholesterol acyltransferase activity in normal and atherosclerotic rabbit aortas: Role of a cholesterol substrate pool. Exp. Mol. Pathol. 1986, 44, 329–339. [Google Scholar] [CrossRef]
  24. Alegre, M.; Ciudad, C.J.; Fillat, C.; Guinovart, J.J. Determination of glucose-6-phosphatase activity using the glucose dehydrogenase-coupled reaction. Anal. Biochem. 1988, 173, 185–189. [Google Scholar] [CrossRef]
  25. Davidson, A.L.; Arion, W.J. Factors underlying significant underestimations of glucokinase activity in crude liver extracts: Physiological implications of higher cellular activity. Arch. Biochem. Biophys. 1987, 253, 156–167. [Google Scholar] [CrossRef]
  26. Bentle, L.A.; Lardy, H.A. Interaction of anions and divalent metal ions with phosphoenolpyruvate carboxykinase. J. Biol. Chem. 1976, 251, 2916–2921. [Google Scholar] [PubMed]
  27. Seifter, S.; Dayton, S.; Muntwyler, N.; Muntwyler, E. The estimation of glycogen with the anthrone reagent. Arch. Biochem. 1950, 25, 191–200. [Google Scholar] [PubMed]
  28. Wolff, S.P. Ferrous ion oxidation in presence of ferric ion indicator xylenol orange for measurement of hydroperoxides. Methods Enzymol. 1994, 233, 182–189. [Google Scholar]
  29. Ohkawa, H.; Ohishi, N.; Yagi, K. Assay for lipid peroxides in animal tissues by thiobarbituric acid reaction. Anal. Biochem. 1979, 95, 351–358. [Google Scholar] [CrossRef]
  30. Mackness, M.I.; Harty, D.; Bhatnagar, D.; Winocour, P.H.; Arrol, S.; Ishola, M.; Durrington, P.N. Serum paraoxonase activity in familial hypercholesterolaemia and insulin-dependent diabetes mellitus. Atherosclerosis 1991, 86, 193–199. [Google Scholar] [CrossRef]
  31. Do, G.M.; Kwon, E.Y.; Kim, E.; Kim, H.S.; Choi, M.S. Hepatic transcription response to high-fat treatment in mice: Microarray comparison of individual versus. pooled RNA samples. Biotechnol. J. 2010, 5, 970–973. [Google Scholar] [CrossRef] [PubMed]
  32. Schmittgen, T.D.; Livak, K.J. Analyzing real-time PCR data by the comparative C(T) method. Nat. Protoc. 2008, 3, 1101–1108. [Google Scholar] [CrossRef] [PubMed]
  33. Stangherlin, A.; Reddy, A.B. Regulation of circadian clocks by redox homeostasis. J. Biol. Chem. 2013, 288, 26505–26511. [Google Scholar] [CrossRef] [PubMed]
  34. Gachon, F.; Olela, F.F.; Schaad, O.; Descombes, P.; Schibler, U. The circadian PAR-domain basic leucine zipper transcription factors DBP, TEF, and HLF modulate basal and inducible xenobiotic detoxification. Cell Metab. 2006, 4, 25–36. [Google Scholar] [CrossRef] [PubMed] [Green Version]
  35. Mohamed, E.M.; Abdelrahman, S.A.; Hussein, S.; Shalaby, S.M.; Mosaad, H.; Awad, A.M. Effect of human umbilical cord blood mesenchymal stem cells administered by intravenous or intravitreal routes on cryo-induced retinal injury. IUBMB Life 2017, 69, 188–201. [Google Scholar] [CrossRef] [PubMed]
  36. Dahl, T.B.; Haukeland, J.W.; Yndestad, A.; Ranheim, T.; Gladhaug, I.P.; Damås, J.K.; Haaland, T.; Løberg, E.M.; Arntsen, B.; Birkeland, K.; et al. Intracellular nicotinamide phosphoribosyltransferase protects against hepatocyte apoptosis and is down-regulated in nonalcoholic fatty liver disease. J. Clin. Endocrinol. Metab. 2010, 95, 3039–3047. [Google Scholar] [CrossRef] [PubMed]
  37. Revollo, J.R.; Grimm, A.A.; Imai, S. The NAD biosynthesis pathway mediated by nicotinamide phosphoribosyltransferase regulates Sir2 activity in mammalian cells. J. Biol. Chem. 2004, 279, 50754–50763. [Google Scholar] [CrossRef] [PubMed]
  38. Raspé, E.; Duez, H.; Mansén, A.; Fontaine, C.; Fiévet, C.; Fruchart, J.C.; Vennström, B.; Staels, B. Identification of Rev-erbalpha as a physiological repressor of apoC-III gene transcription. J. Lipid Res. 2002, 43, 2172–2179. [Google Scholar] [CrossRef] [PubMed]
  39. Takaishi, K.; Duplomb, L.; Wang, M.Y.; Li, J.; Unger, R.H. Hepatic insig-1 or -2 overexpression reduces lipogenesis in obese Zucker diabetic fatty rats and in fasted/refed normal rats. Proc. Natl. Acad. Sci. USA 2004, 101, 7106–7111. [Google Scholar] [CrossRef] [PubMed] [Green Version]
  40. Stromsdorfer, K.L.; Yamaguchi, S.; Yoon, M.J.; Moseley, A.C.; Franczyk, M.P.; Kelly, S.C.; Qi, N.; Imai, S.; Yoshino, J. NAMPT-Mediated NAD(+) Biosynthesis in Adipocytes Regulates Adipose Tissue Function and Multi-organ Insulin Sensitivity in Mice. Cell Rep. 2016, 16, 1851–1860. [Google Scholar] [CrossRef] [PubMed]
  41. Kang, L.; Ayala, J.E.; Lee-Young, R.S.; Zhang, Z.; James, F.D.; Neufer, P.D.; Pozzi, A.; Zutter, M.M.; Wasserman, D.H. Diet-induced muscle insulin resistance is associated with extracellular matrix remodeling and interaction with integrin alpha2beta1 in mice. Diabetes 2011, 60, 416–426. [Google Scholar] [CrossRef] [PubMed]
  42. Berria, R.; Wang, L.; Richardson, D.K.; Finlayson, J.; Belfort, R.; Pratipanawatr, T.; De Filippis, E.A.; Kashyap, S.; Mandarino, L.J. Increased collagen content in insulin-resistant skeletal muscle. Am. J. Physiol. Endocrinol. Metab. 2006, 290, E560–E565. [Google Scholar] [CrossRef] [PubMed]
Figure 1. Effect of ursolic acid (UR) treatment on changes: in body weight (BW) (A); food intake and food efficiency ratio (B); white adipose tissue (WAT) weights (C); brown adipose tissue (BAT) weight (D); WAT morphology (magnification ×200) (E); and plasma lipid levels (F) in C57BL/6J mice fed a high-fat diet (HFD; 20% fat, 1% cholesterol). Data are shown as means ± SEM. Normal diet (ND; AIN-76) vs. HFD; * p < 0.05, ** p <0.01, *** p < 0.001. HFD vs. UR (HFD + 0.05% UR); § p < 0.05, §§ p < 0.01, §§§ p < 0.001. FER, food efficiency ratio, body weight gain/energy intakes per day; WAT, white adipose tissue; BAT, brown adipose tissue; Total-C, total-cholesterol; HDL-C, HDL-cholesterol; TG, triglyceride; FFA, free fatty acid; HTR, ratio of HDL-C to TC; AI, atherogenic index; Apo, apolipoprotein.
Nutrients 10 01719 g001
Figure 2. Effect of ursolic acid (UR) treatment on: the liver weight (A); hepatic morphology (magnification ×200) (B); hepatic lipid levels (C); and hepatic lipid-regulating enzyme activities (D) in C57BL/6J mice fed a high-fat diet (HFD). Data are shown as means ± SEM. Normal diet (ND; AIN-76) vs. HFD; * p < 0.05, ** p < 0.01, *** p < 0.001. HFD vs. UR (HFD + 0.05% UR); § p < 0.05, §§ p < 0.01, §§§ p < 0.001. FAS, fatty acid synthase; PAP, phosphatidate phosphohydrolase; CPT, carnitine palmitoyltransferase; HMGCR, 3-hydroxy-3-methyl-glutaryl-coenzyme A reductase; ACAT, acyl-CoA:cholesterol acyltransferase.
Nutrients 10 01719 g002
Figure 3. Effect of ursolic acid (UR) treatment on: plasma GOT and GPT (A); hepatic mitochondrial H2O2 (B); erythrocyte thiobarbituric acid reactive substance (TBARS) (C); plasma paraoxonase (PON) (D); and Masson’s trichrome staining (magnification ×200) (E) in C57BL/6J mice fed a high-fat diet (HFD). Data are shown as means ± SEM. Normal diet (ND; AIN-76) vs. HFD; * p < 0.05, ** p < 0.01, *** p < 0.001. HFD vs. UR (HFD + 0.05% UR); § p < 0.05, §§ p < 0.01, §§§ p < 0.001. GOT, glutamic oxaloacetic transaminase; GPT, glutamic pyruvic transaminase; TBARS, thiobarbituric acid reactive substance.
Nutrients 10 01719 g003
Figure 4. Effect of ursolic acid (UR) treatment on: plasma glucose level (A); insulin level (B); glucagon level (C); homeostasis model assessment-estimated insulin resistance (HOMA-IR) index (D); hepatic glycogen content (E); hepatic glucose-regulating enzyme activities (F); immunohistochemical staining of the pancreatic tissue (G); plasma adipokine (H); and pro-inflammatory cytokine levels (I) in C57BL/6J mice fed a high-fat diet (HFD). Data are shown as means ± SEM. Normal diet (ND; AIN-76) vs. HFD; * p < 0.05, ** p < 0.01, *** p < 0.001. HFD vs. UR (HFD + 0.05% UR); § p < 0.05, §§ p < 0.01, §§§ p < 0.001. HOMA-IR, homeostasis model assessment for insulin resistance; PEPCK, phosphoenolpyruvate carboxykinase; G6Pase, glucose-6-phosphatase; TNF-α, tumor necrosis factor alpha; MCP-1, monocyte chemoattractant protein-1; IFN-γ, interferon gamma.
Nutrients 10 01719 g004
Figure 5. Effect of ursolic acid (UR) treatment on: the expression of hepatic clock genes in detoxification (A); clock-controlled genes (CCGs) involved in detoxification (B); lipid and bile acid metabolism (C); transcription patterns of hepatic genes related to lipid metabolism (D); muscular clock genes (E); CCGs (F); and tricarboxylic acid (TCA) cycle-associated genes (G). Symbols in red indicate genes that were up-regulated while those in green denote genes that were down-regulated.
Nutrients 10 01719 g005
Figure 6. Effect of ursolic acid (UR) treatment on the transcription patterns of hepatic genes related to chemokine/cytokine expression, extracellular matrix (ECM) remodeling, and ECM regulation (A); and ECM–receptor interaction (B). Symbols in red indicate genes that were up-regulated while those in green denote genes that were down-regulated. UR down-regulated collagen, Cd44, Syndecan and Perlecan gene expressions involved in ECM-receptor interaction compared to HFD.
Nutrients 10 01719 g006

