Nutritional Quality of School Meals in France: Impact of Guidelines and the Role of Protein Dishes
Abstract
:1. Introduction
2. Materials and Methods
2.1. Data Collection
- -
- The “observed” weight was determined by adding the weight of each ingredient indicated on the technical file (taking into account standard cooking loss factors) divided by the number of diners;
- -
- the “recommended” weight was derived from the weights indicated for the various types of dishes in the GEM-RCN guidelines [13].
2.2. Nutritional Quality Indicators
2.3. FC Compliance Scores
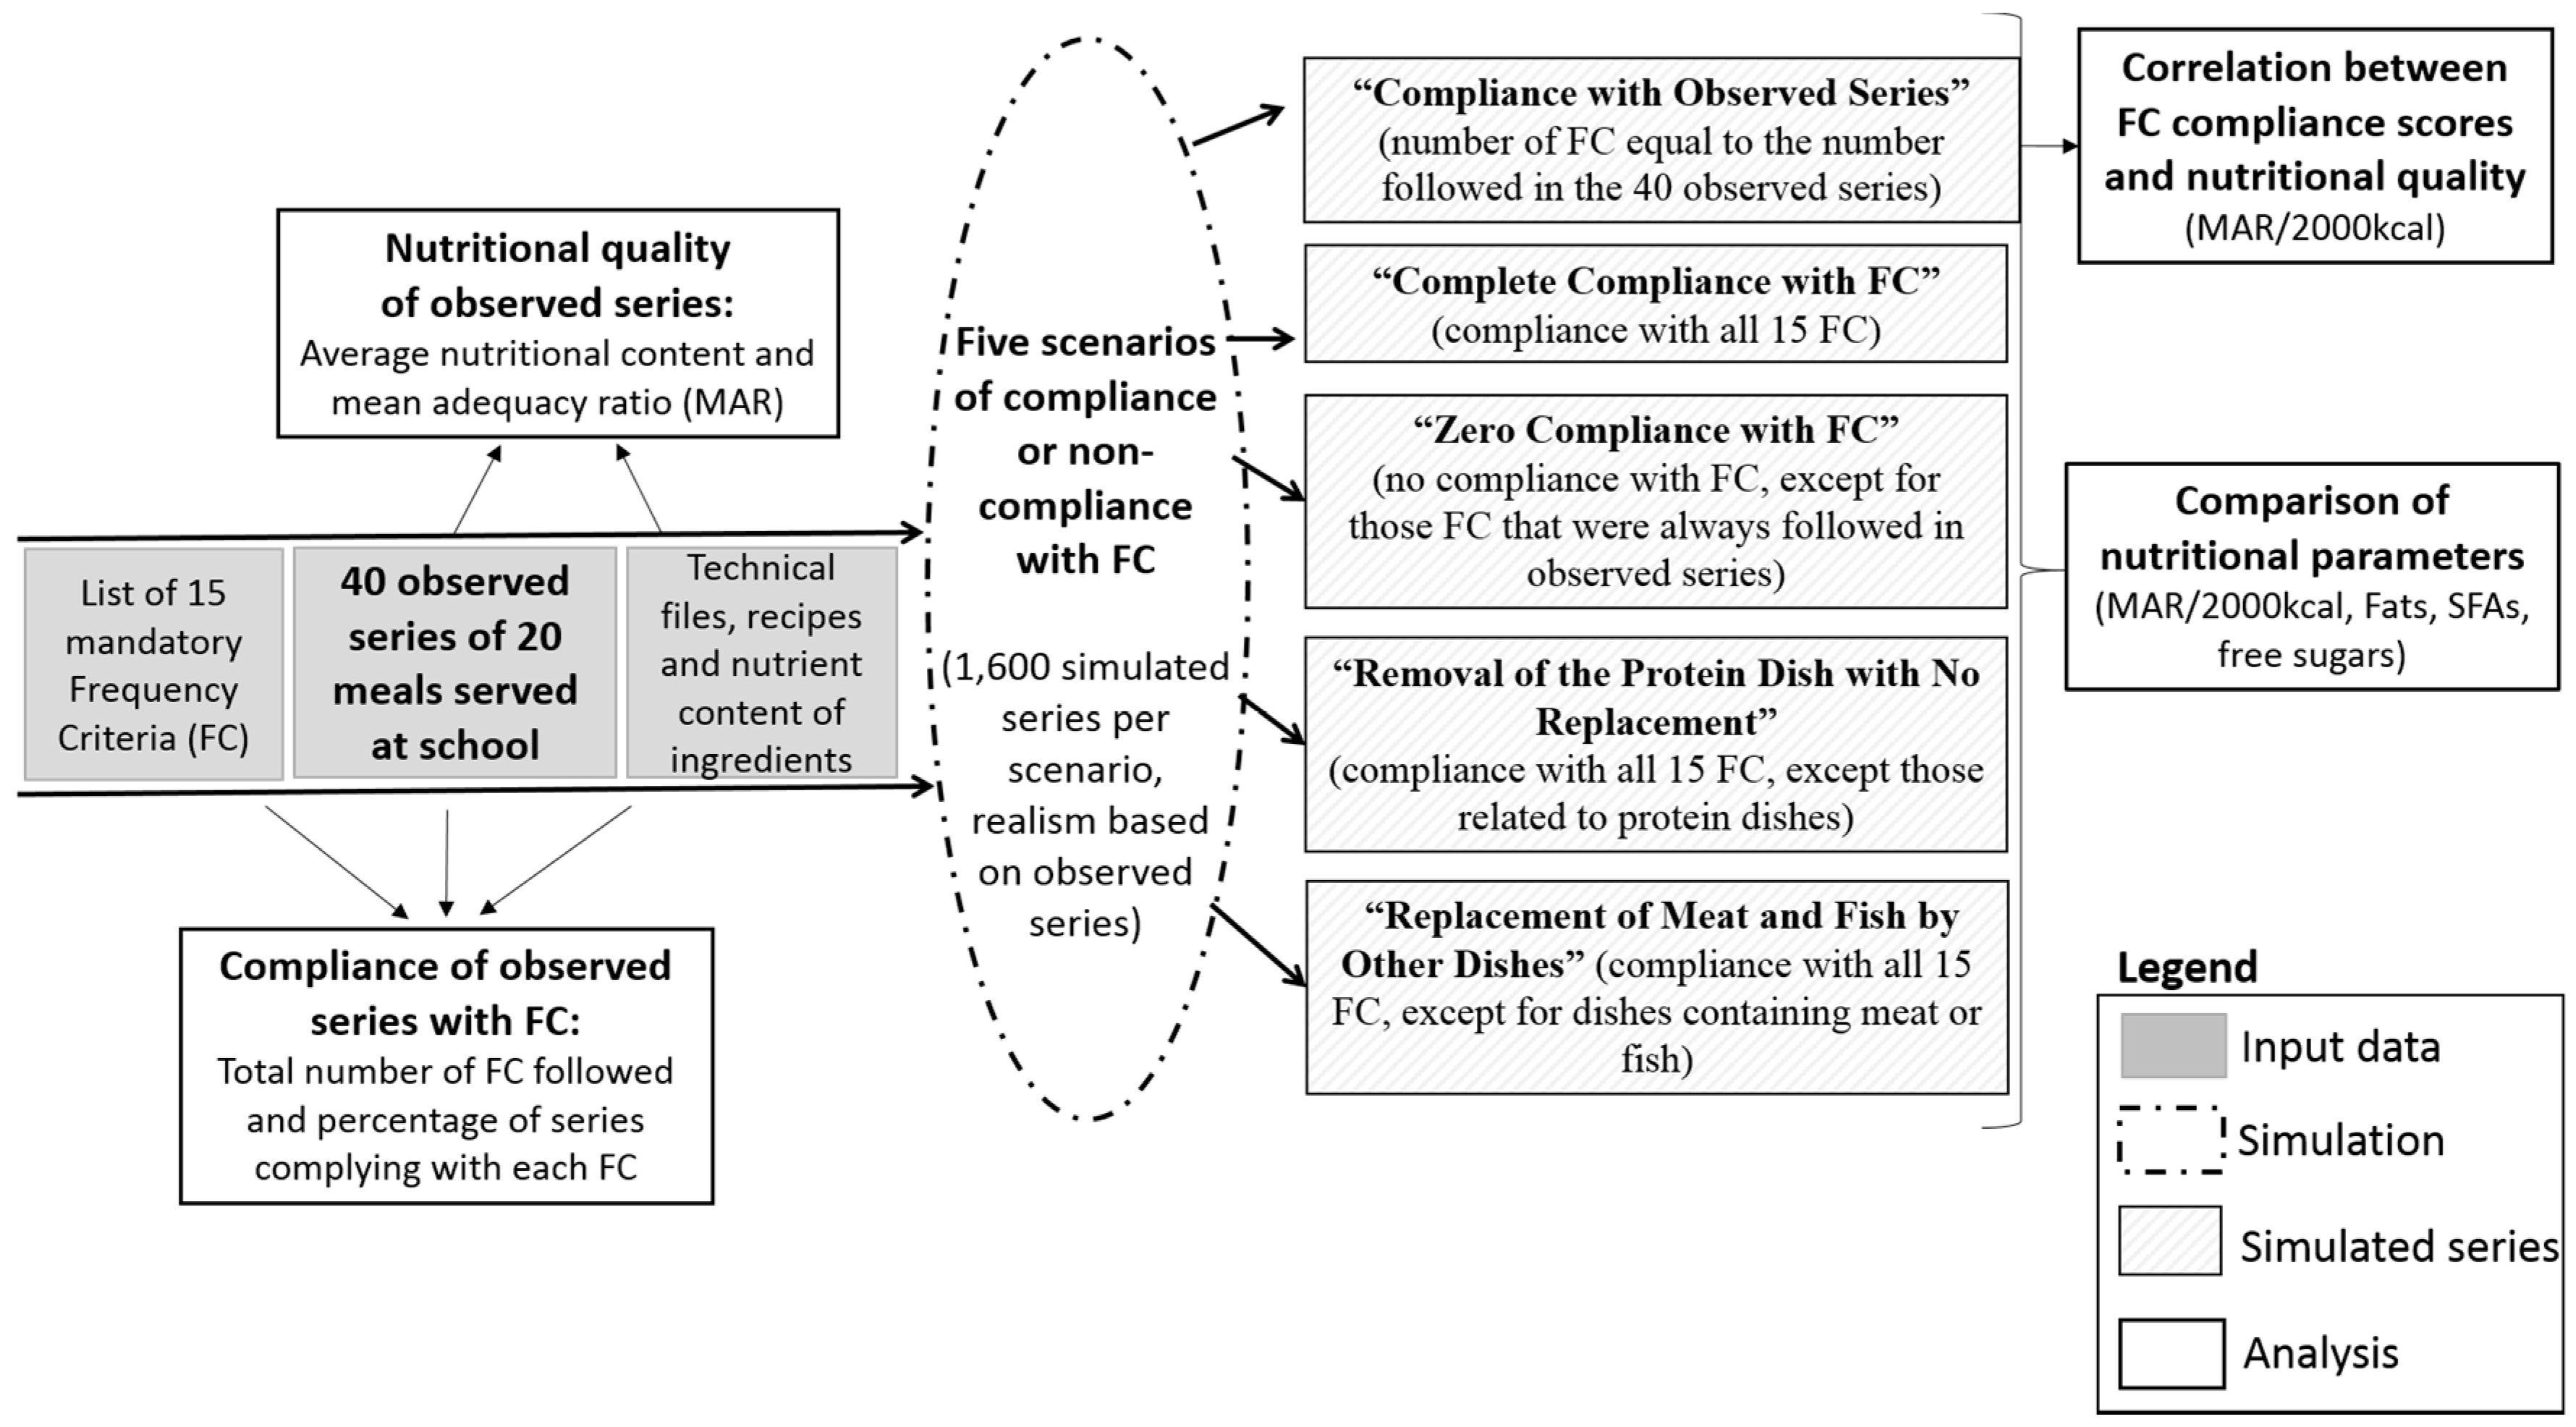
2.4. Generating Simulated Series
2.5. Statistical Analysis
3. Results
3.1. Distribution of Dishes in the Observed Series
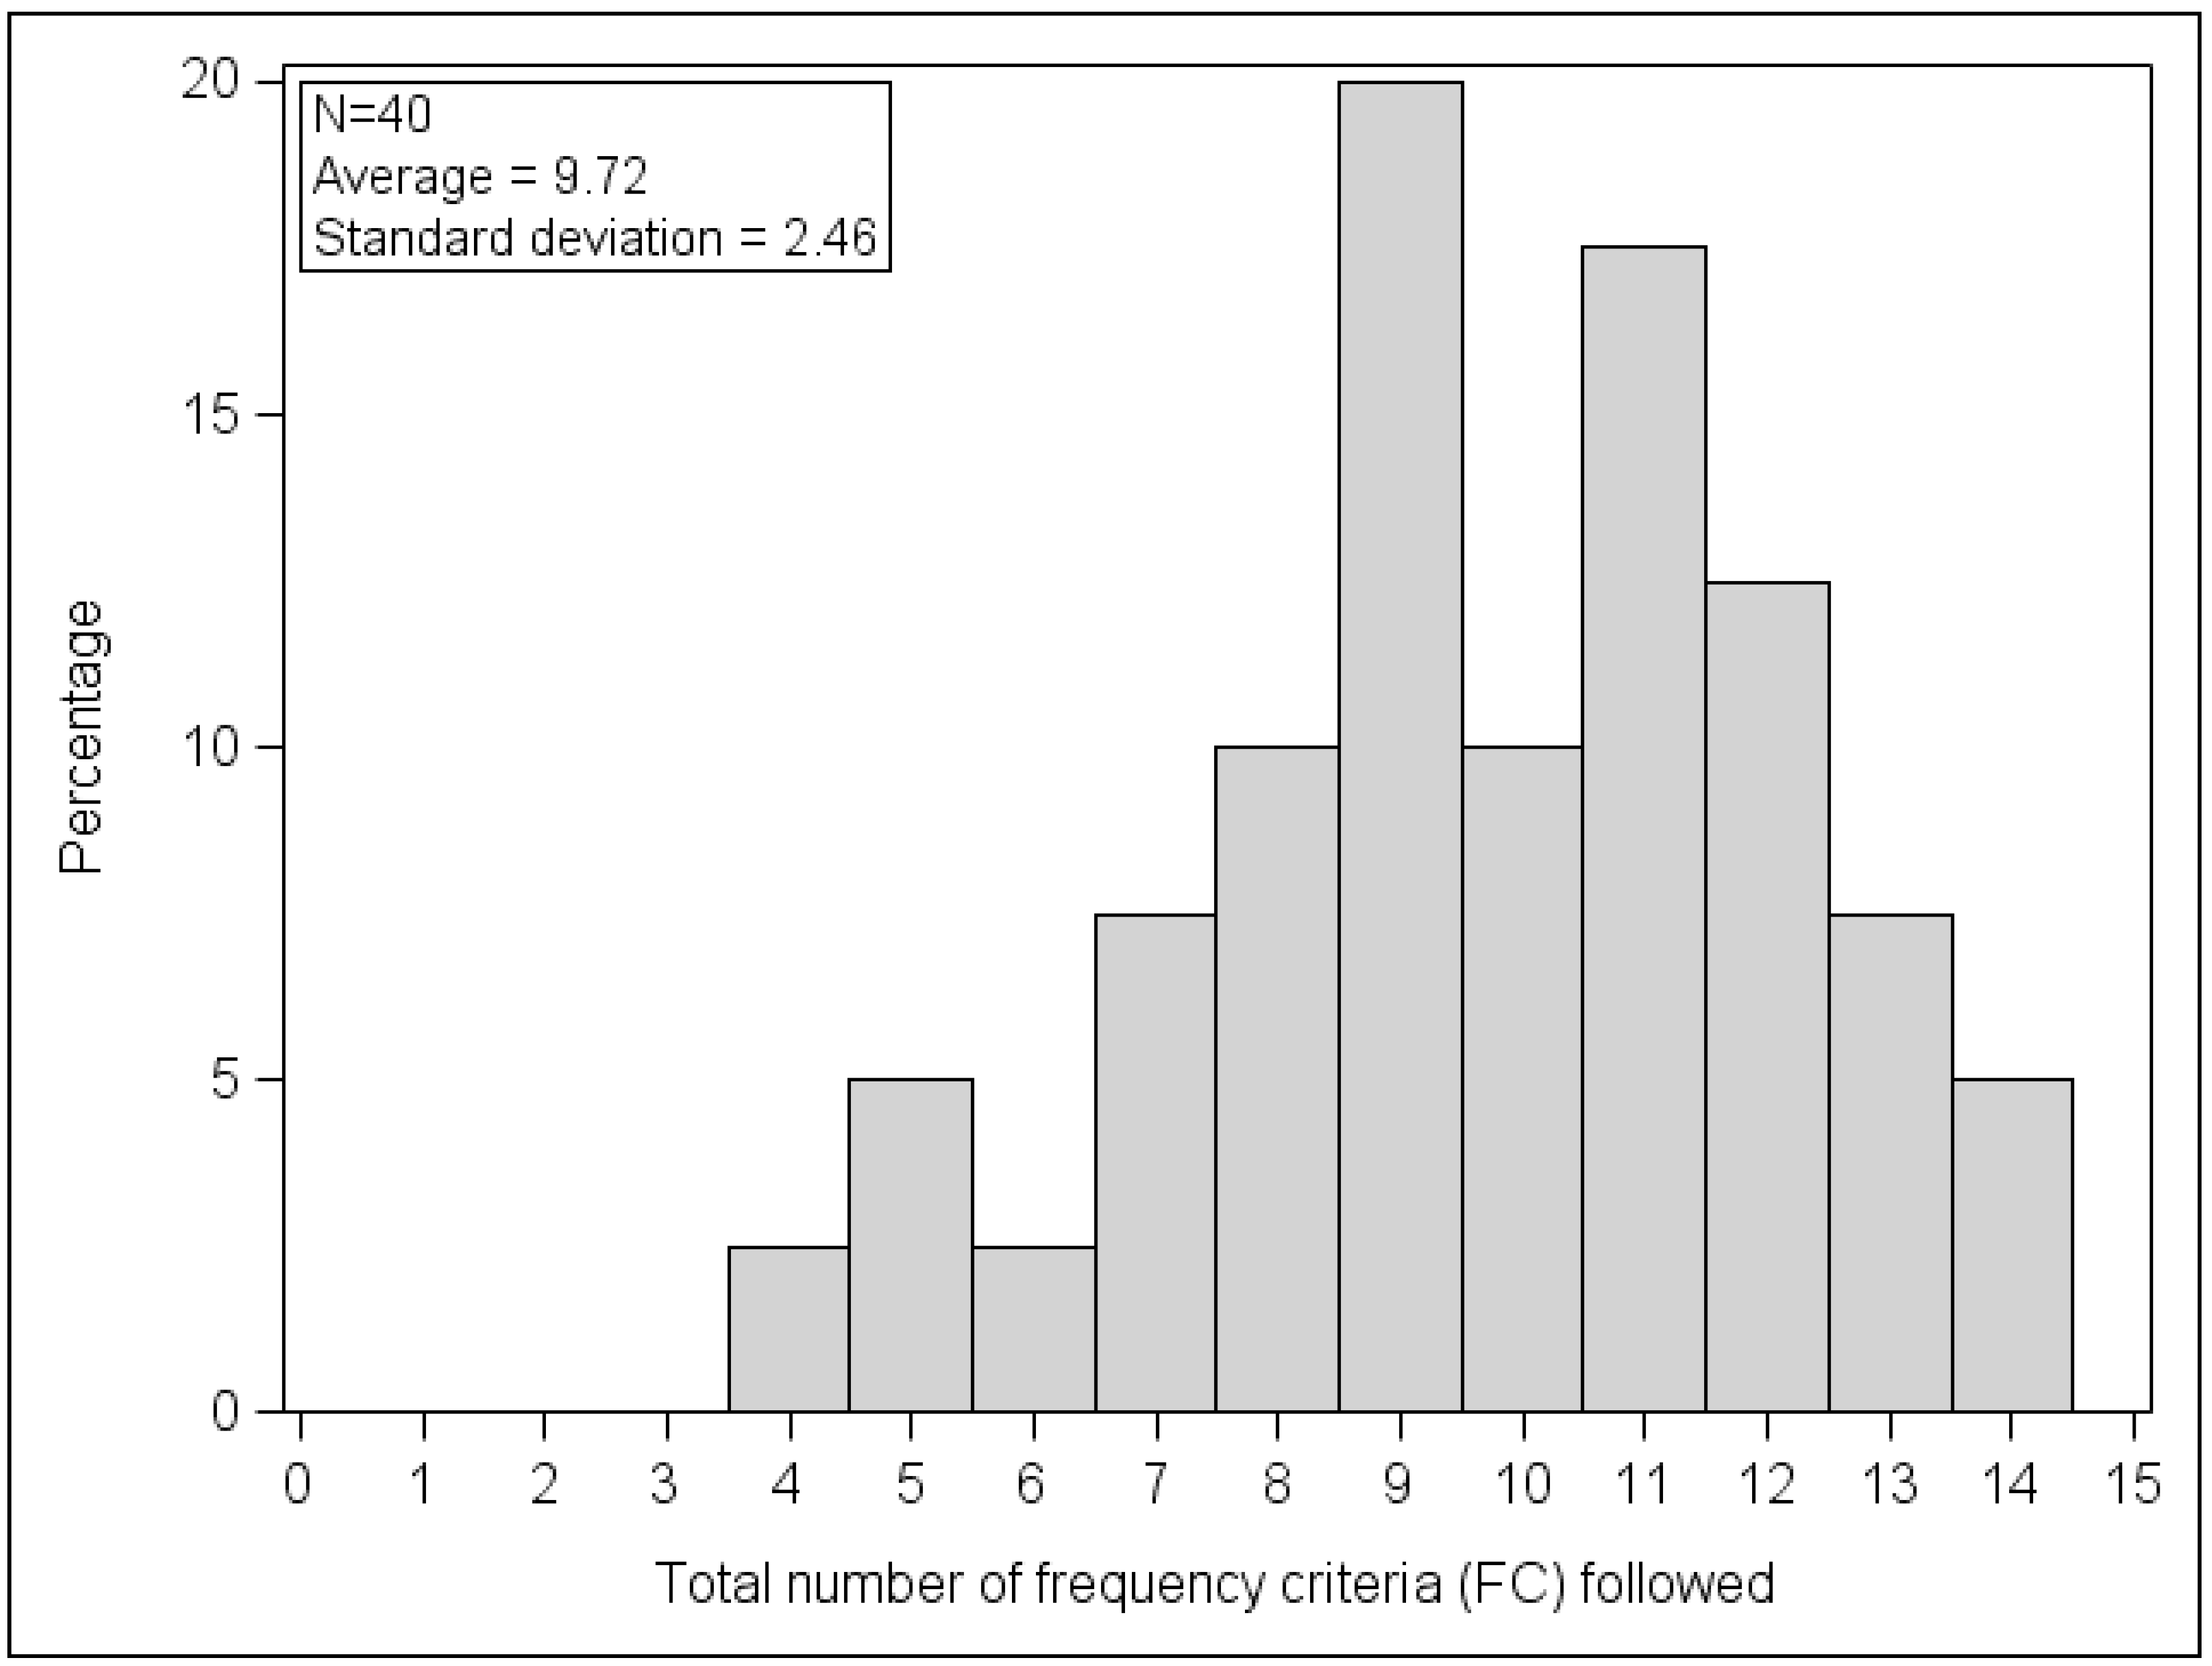
3.2. FC Compliance in Observed Series
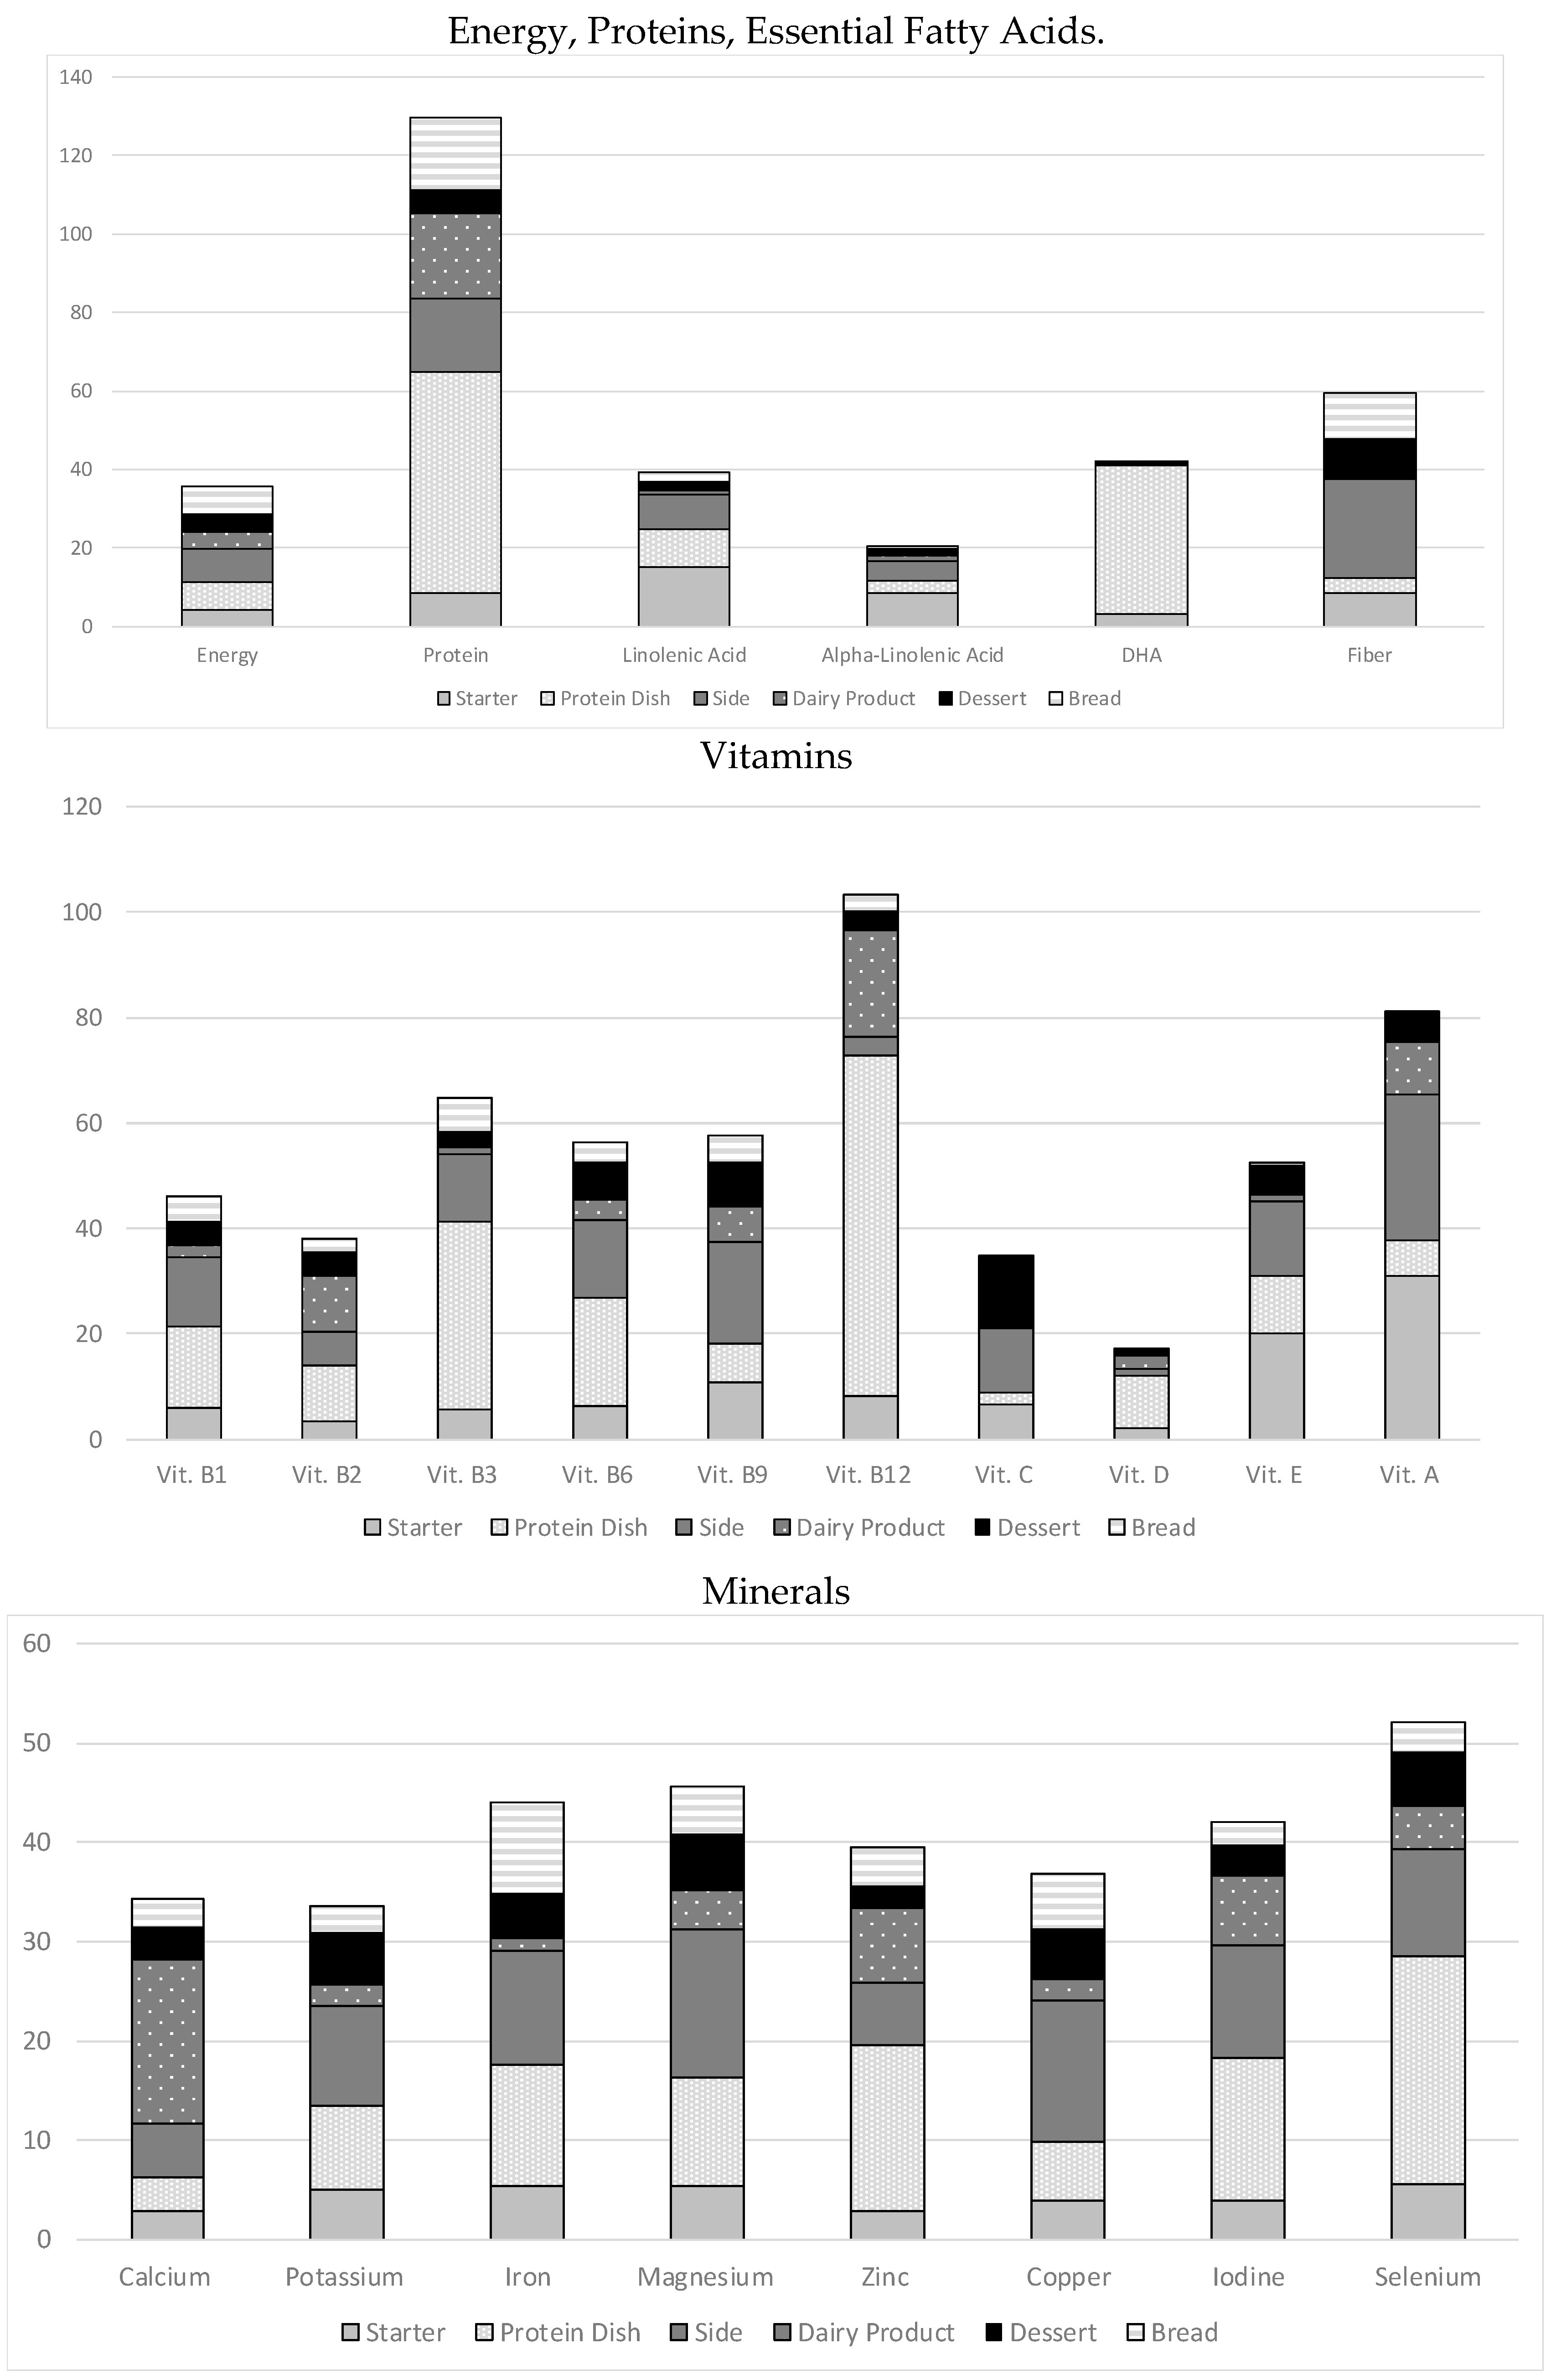
3.3. Nutritional Quality of the Observed Series
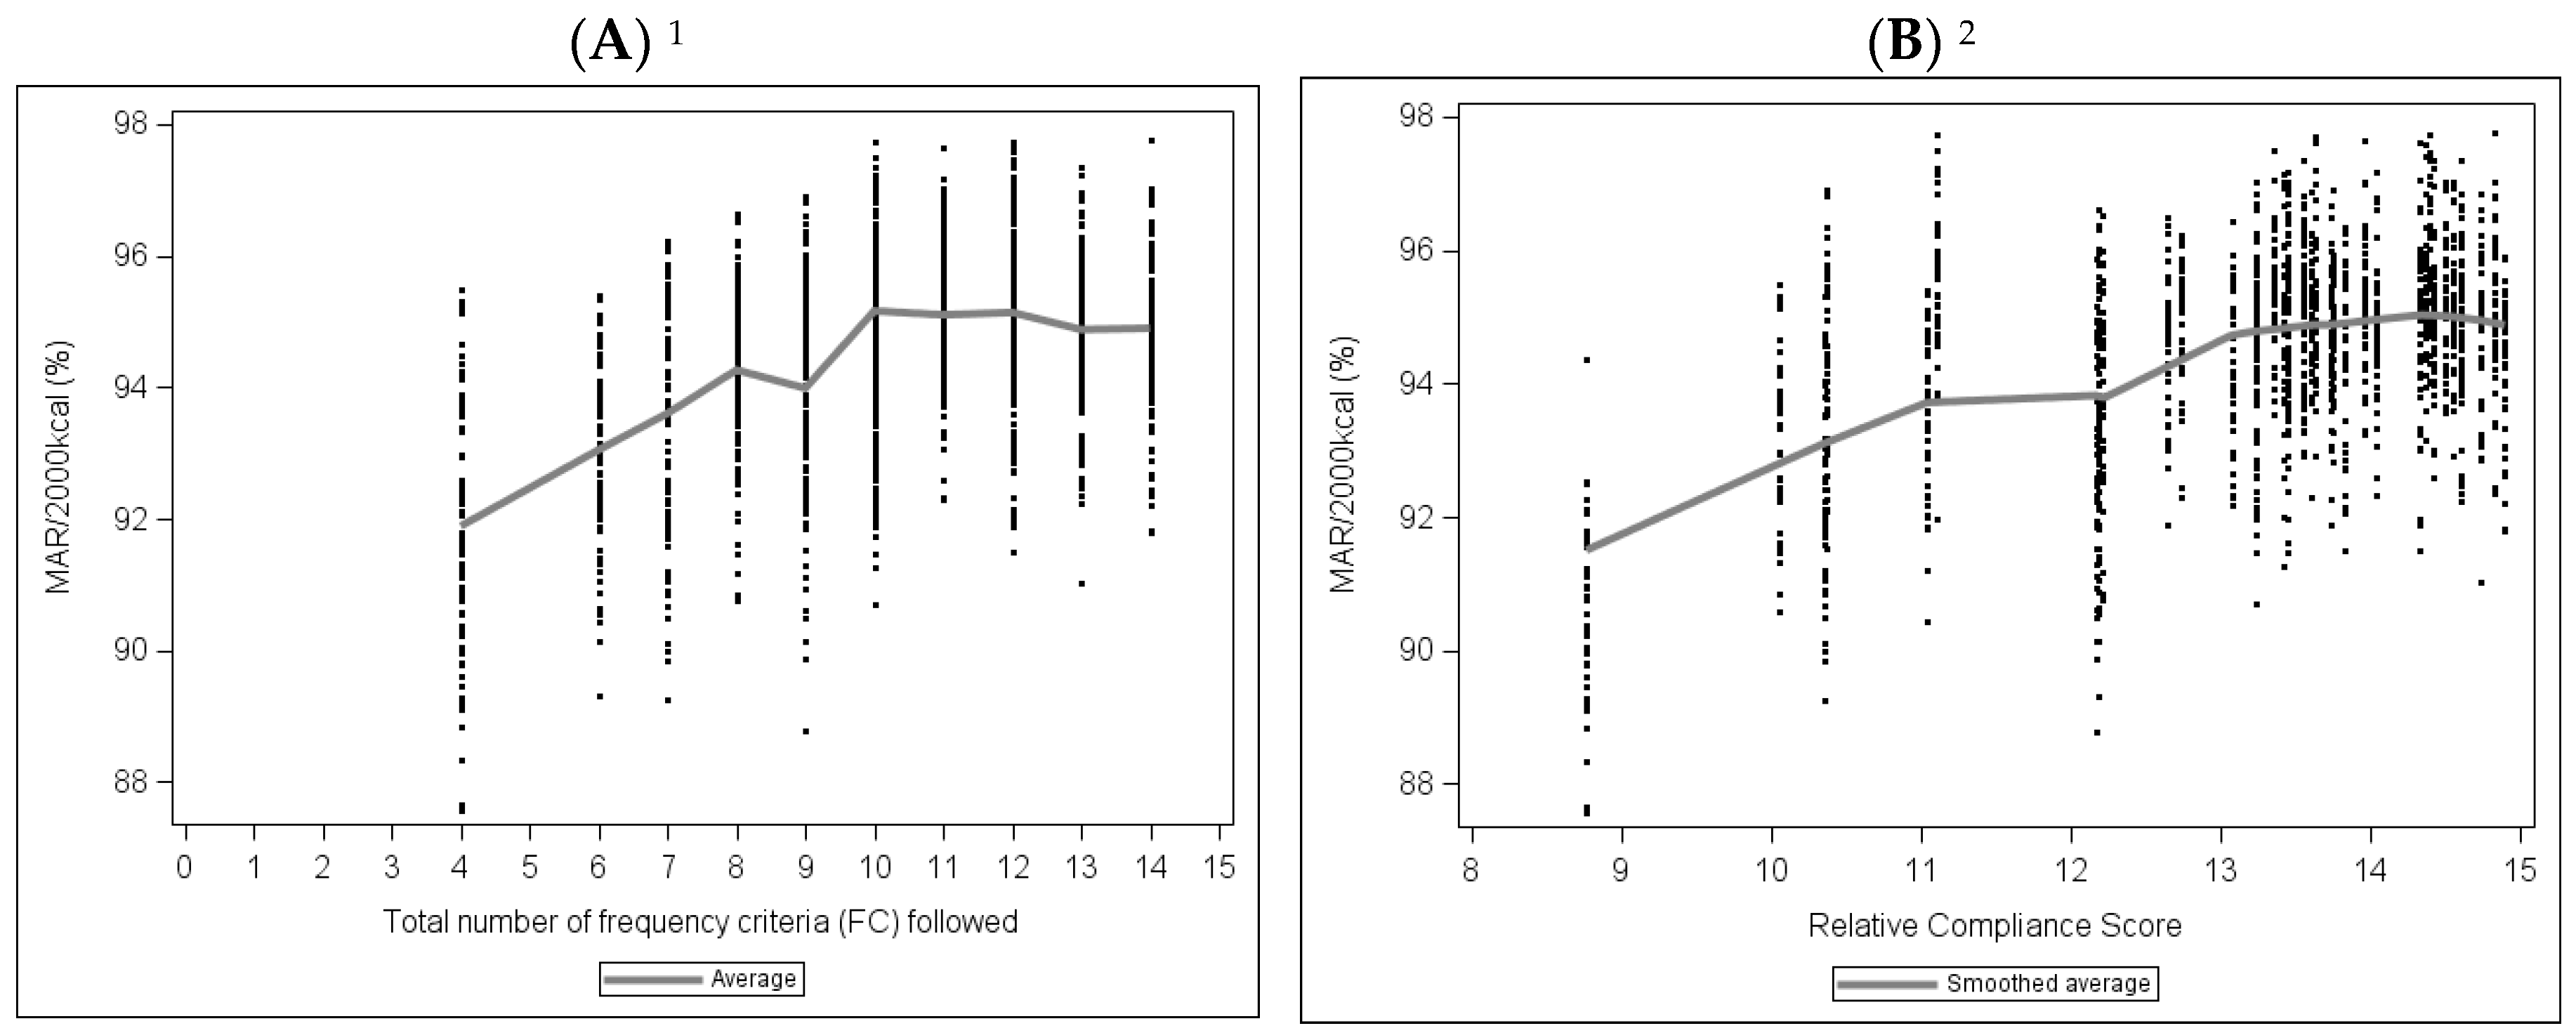
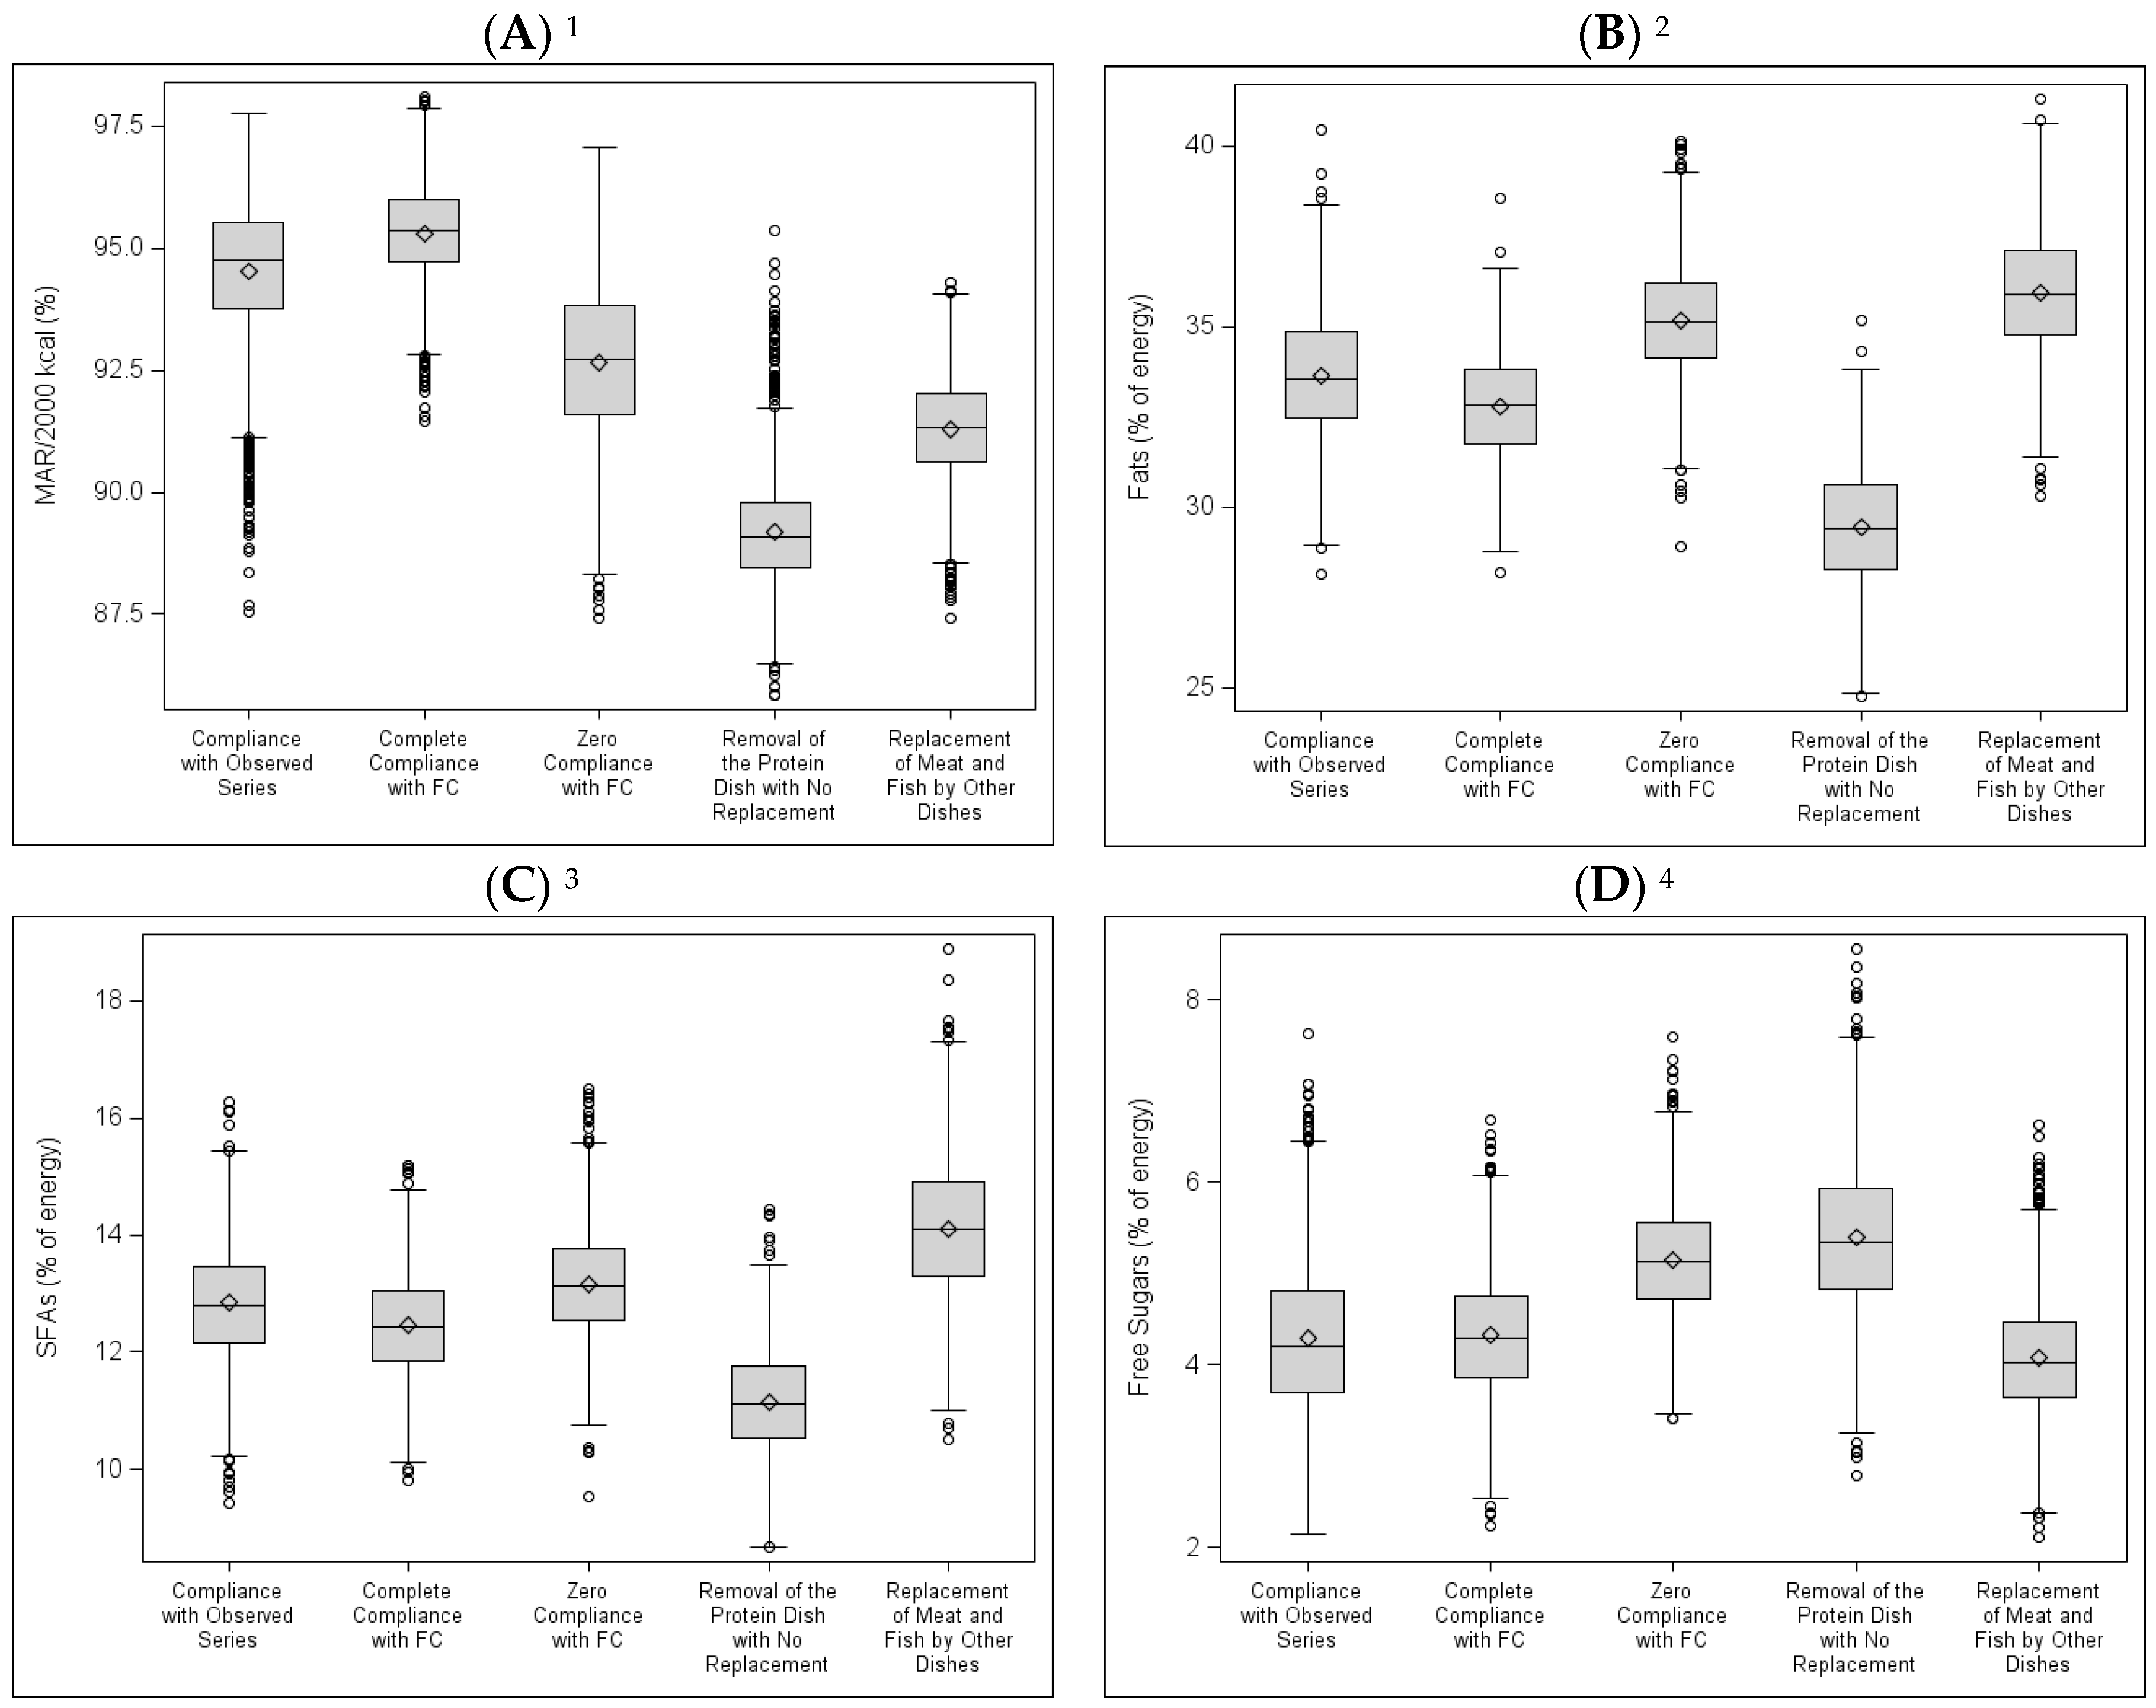
3.4. Nutritional Quality of the Simulated Series
4. Discussion
5. Conclusions
Acknowledgments
Author Contributions
Conflicts of Interest
Appendix A. Detailed Description of the Five Scenarios
Appendix B
| Component | Category | Number |
|---|---|---|
| Starter | Vegetables | 521 |
| Starches | 160 | |
| Deli Meats | 37 | |
| Cheese | 29 | |
| Fruits | 23 | |
| Eggs | 10 | |
| Fish | 9 | |
| Protein Dish | Pork, Poultry | 305 |
| Beef, Veal, Lamb | 243 | |
| Fish | 211 | |
| Eggs | 34 | |
| Starches | 6 | |
| Vegetables | 1 | |
| Side Dish | Starches | 441 |
| Vegetables | 357 | |
| Dairy Product | Cheese | 556 |
| Dairy Products | 220 | |
| Dairy Desserts | 5 | |
| Sweetened Foods | 1 | |
| Dessert | Fruits | 478 |
| Sweetened Foods | 164 | |
| Dairy Desserts | 111 | |
| Dairy Products | 17 | |
| Starches | 16 |
Appendix C
| MAR Estimation | MAR/2000 kcal Estimation | |||||||
|---|---|---|---|---|---|---|---|---|
| Nutritional Content of the Series | Recom Mended 20 Days Intake | Ratio | Ratio > 100 Replaced with 100 | Content for 2000 kcal | Recom Mended Daily Intake | Ratio | Ratio > 100 Replaced with 100 | |
| Protein (g) | 683.66 | 500 | 136.73 | 100.00 | 91.94 | 25 | 367.78 | 100 |
| Linoleic Acid (g) | 85.76 | 178 | 48.18 | 48.18 | 11.53 | 8.9 | 129.59 | 100 |
| α-Linolenic Acid (g) | 15.53 | 44 | 35.29 | 35.29 | 2.09 | 2.2 | 94.91 | 94.91 |
| DHA (mg) | 1973.28 | 3040 | 64.91 | 64.91 | 265.39 | 152 | 174.60 | 100 |
| Fiber (g) | 188.41 | 260 | 72.46 | 72.46 | 25.34 | 13 | 194.91 | 100 |
| Vitamin B1 (mg) | 7.20 | 16 | 44.99 | 44.99 | 0.97 | 0.8 | 121.01 | 100 |
| Vitamin B2 (mg) | 9.86 | 24 | 41.08 | 41.08 | 1.33 | 1.2 | 110.49 | 100 |
| Vitamin B3 (mg) | 118.20 | 180 | 65.67 | 65.67 | 15.90 | 9 | 176.63 | 100 |
| Vitamin B6 (mg) | 11.18 | 20 | 55.92 | 55.92 | 1.50 | 1 | 150.40 | 100 |
| Vitamin B9 (µg) | 2464.13 | 4020 | 61.30 | 61.30 | 331.40 | 201 | 164.88 | 100 |
| Vitamin B12 (µg) | 24.11 | 28 | 86.12 | 86.12 | 3.24 | 1.4 | 231.64 | 100 |
| Vitamin C (mg) | 616.79 | 1780 | 34.65 | 34.65 | 82.95 | 89 | 93.20 | 93.20 |
| Vitamin D (µg) | 19.79 | 100 | 19.79 | 19.79 | 2.66 | 5 | 53.23 | 53.23 |
| Vitamin E (mg) | 128.37 | 182 | 70.53 | 70.53 | 17.26 | 9.1 | 189.72 | 100 |
| Vitamin A (µg) | 6942.86 | 10,020 | 69.29 | 69.29 | 933.74 | 501 | 186.38 | 100 |
| Calcium (mg) | 6067.86 | 18,480 | 32.83 | 32.83 | 816.06 | 924 | 88.32 | 88.32 |
| Potassium (mg) | 19,425.11 | 57,840 | 33.58 | 33.58 | 2612.48 | 2892 | 90.33 | 90.33 |
| Iron (mg) | 73.00 | 164 | 44.51 | 44.51 | 9.82 | 8.2 | 119.73 | 100 |
| Magnesium (mg) | 1944.72 | 4060 | 47.90 | 47.90 | 261.54 | 203 | 128.84 | 100 |
| Zinc (mg) | 73.85 | 184 | 40.14 | 40.14 | 9.93 | 9.2 | 107.96 | 100 |
| Copper (mg) | 9.93 | 24 | 41.39 | 41.39 | 1.34 | 1.2 | 111.34 | 100 |
| Iodine (µg) | 956.99 | 2400 | 39.87 | 39.87 | 128.71 | 120 | 107.25 | 100 |
| Selenium (µg) | 516.99 | 780 | 66.28 | 66.28 | 69.53 | 39 | 178.28 | 100 |
| MAR= | 52.90 | MAR/2000 kcal= | 96.52 | |||||
Appendix D
References
- European Union (EU). EU Action Plan on Childhood Obesity 2014–2020. Available online: https://ec.europa.eu/health/sites/health/files/nutrition_physical_activity/docs/childhoodobesity_actionplan_2014_2020_en.pdf (accessed on 12 February 2018).
- Caldeira, S.; Storcksdieck Genannt Bonsmann, S.; Bakogianni, I.; Gauci, C.; Calleja, A.; Furtado, A. Public Procurement of Food for Health: Technical Report on the School Setting; Joint Publication of the Maltese Presidency and the European Commission, 2017; Available online: https://ec.europa.eu/jrc/sites/jrcsh/files/public-procurement-food-health-technical-report.pdf (accessed on 12 February 2018).
- Storcksdieck, S.; Kardakis, T.; Wollgas, J.; Nelson, M.; Caldeira, S. Mapping of National School Food Policies across the EU28 plus Norway and Switzerland; JRC Science and Policy Report; Publications Office of the European Union: Luxembourg, 2014; Available online: http://publications.jrc.ec.europa.eu/repository/bitstream/JRC90452/lbna26651enn.pdf (accessed on 12 February 2015).
- WHO Regional Office for Europe. Food and Nutrition Policy for Schools: A Tool for the Development of School Nutrition Programmes in the European Region; Programme for Nutrition and Food Security; WHO Regional Office for Europe: Copenhaguen, Denmark, 2006. [Google Scholar]
- Commission de L’environnement de La Santé Publique et de La Sécurité Alimentaire. Rapport Sur le Livre Blanc Sur La Nutrition, La Surcharge Pondérale et L’obésité (2007/2285(INI)). Rapporteur: Alessandro Foglietta. Available online: http://www.europarl.europa.eu/sides/getDoc.do?pubRef=-//EP//NONSGML+REPORT+A6-2008-0256+0+DOC+PDF+V0//FR (accessed on 12 February 2018).
- Lafay, L.; Volatier, J.-L.; Martin, A. La restauration scolaire dans l’enquête INCA, 2e partie: Les repas servis en restauration scolaire: Apports nutritionnels, alimentaires et impact sur la nutrition des enfants. Cah. Nutr. Diet. 2002, 37, 395–404. [Google Scholar]
- Evans, C.E.; Mandl, V.; Christian, M.S.; Cade, J.E. Impact of school lunch type on nutritional quality of English children’s diets. Public Health Nutr. 2016, 19, 36–45. [Google Scholar] [CrossRef] [PubMed]
- Weichselbaum, E.; Gibson-Moore, H.; Ballam, R.; Buttriss, J.L. Nutrition in schools across Europe: A summary report of a meeting of European Nutrition Foundations, Madrid, April 2010. Nutr. Bull. 2011, 36, 124–141. [Google Scholar] [CrossRef]
- République Française. Décret du 30 Septembre 2011–1227 Relatif à la Qualité Nutritionnelle des Repas Servis Dans le Cadre de la restauration scolaire. Available online: https://www.legifrance.gouv.fr/eli/decret/2011/9/30/2011-1227/jo/texte (accessed on 12 February 2018).
- République Française. Arrêté du 30 Septembre 2011 Relatif à la Qualité Nutritionnelle Des Repas Servis Dans le Cadre de la Restauration Scolaire. Available online: https://www.legifrance.gouv.fr/eli/arrete/2011/9/30/AGRG1032380A/jo/texte (accessed on 12 February 2018).
- Ministère de l’Economie. Groupe d’Etude Marchés Restauration collective et Nutrition (GEM-RCN); Recommandation Relative à La Nutrition du 4 Mai 2007; Ministry of Economy, Finance and Industry: Paris, France, 2007.
- Ministère de l’Economie; Groupe d’Etude des Marchés de Restauration Collective et de Nutrition (GEM-RCN). Recommandation Nutrition Complétée et Mise à Jour au 10 Octobre 2011; Ministry of Economy, Finance and Industry: Paris, France, 2011. Available online: https://www.economie.gouv.fr/daj/oeap-archives-recommandation-nutrition-gem-rcn-completee-et-mise-a-jour-10-octobre-2011 (accessed on 12 February 2018).
- Ministère de l’Economie; Direction des Affaires Juridiques; Observatoire Economique de l’Achat Public; Groupe d’Etude des Marchés Restauration Collective et de Nutrition (GEM-RCN). Recommandation Nutrition, Version 2.0 Juillet 2015; Ministry of Economy, Finance and Industry: Paris, France, 2015. Available online: https://www.economie.gouv.fr/files/directions_services/daj/marches_publics/oeap/gem/nutrition/nutrition.pdf (accessed on 12 February 2018).
- Dubuisson, C.; Lioret, S.; Calamassi-Tran, G.; Volatier, J.L.; Lafay, L. School meals in French secondary state schools with regard to the national recommendations. Br. J Nutr. 2009, 102, 293–301. [Google Scholar] [CrossRef] [PubMed]
- Bertin, M.; Lafay, L.; Calamassi-Tran, G.; Volatier, J.L.; Dubuisson, C. Schools meals in French secondary state schools: compliance to national recommendations and schools catering patterns. Rev. Epidemiol. Sante Publique 2011, 59, 33–44. [Google Scholar] [CrossRef] [PubMed]
- Food and Agriculture Organization of the United Nations (FAO). Nutrition-Sensitive Agriculture and Food Systems in Practice Options for Intervention; Food and Agriculture Organization of the United Nations: Rome, Italy, 2017. [Google Scholar]
- Maillot, M.; Darmon, N.; Darmon, M.; Lafay, L.; Drewnowski, A. Nutrient-Dense Food Groups Have High Energy Costs: An Econometric Approach to Nutrient Profiling. J. Nutr. 2007, 137, 1815–1820. [Google Scholar] [CrossRef] [PubMed]
- Masset, G.; Soler, L.G.; Vieux, F.; Darmon, N. Identifying sustainable foods: the relationship between environmental impact, nutritional quality, and prices of foods representative of the French diet. J. Acad. Nutr. Diet. 2014, 114, 862–869. [Google Scholar] [CrossRef] [PubMed]
- Tilman, D.; Clark, M. Global diets link environmental sustainability and human health. Nature 2014, 515, 518–522. [Google Scholar] [CrossRef] [PubMed]
- Agence de L’environnement et La Maîtrise de L’énergie (ADEME). Approche du Coût Complet des Pertes et Gaspillage Alimentaire en Restauration Collective; Rapport d’étude; ADEME: Angers, France, 2016; p. 47. [Google Scholar]
- Derbyshire, E.J. Flexitarian Diets and Health: A Review of the Evidence-Based Literature. Front. Nutr. 2016, 3, 55. [Google Scholar] [CrossRef] [PubMed]
- ANSES. French Food Composition Table Ciqual 2013. Available online: https://ciqual.anses.fr/# (accessed on 12 February 2018).
- Guthrie, H.A.; Scheer, J.C. Validity of a dietary score for assessing nutrient adequacy. J. Am. Diet. Assoc. 1981, 78, 240–245. [Google Scholar] [PubMed]
- Martin, A. (Ed.) Apports Nutritionnels Conseillés Pour La Population Française, 3th ed.; Lavoisier: Paris, France, 2001. [Google Scholar]
- Ministère de L’éducation Nationale De l’enseignement Supérieur et de La Recherche. Repères et Références Statistiques Sur Les Enseignements, La Formation et la Recherche; MENESR-DEPP: Paris, France, 2014; p. 437.
- World Health Organization (WHO). Diet, Nutrition and the Prevention of Excess Weight Gain and Obesity; Report of a joint WHO/FAO expert consultation; Technical Report, Series 916; World Health Organization (WHO): Geneva, Switzerland, 2003. [Google Scholar]
- Drewnowski, A. Concept of a nutritious food: toward a nutrient density score. Am. J. Clin. Nutr. 2005, 82, 721–732. [Google Scholar] [PubMed]
- Potier de Courcy, G.; Frelut, M.L.; Fricker, J.; Martin, A.; Dupin, H. Besoins nutritionnels et apports conseillés pour la satisfaction de ces besoins. Encycl. Med. Chir. 2003, 10, 308–332. [Google Scholar]
- Lafay, L. Etude Individuelle et Nationale sur les Consommations Alimentaires, INCA 2 (2006–2007). 2007. Available online: https://www.anses.fr/fr/system/files/PASER-Ra-INCA2.pdf (accessed on 12 February 2018).
- ANSES. Actualisation des Apports Nutritionnels Conseillés Pour les Acides Gras-Rapport D’expertise Collective; ANSES: Maisons-Alfort, France, 2011.
- ANSES. Evaluation des Apports en Vitamines et Minéraux Issus de L’alimentation Non Enrichie, de L’alimentation Enrichie et des Compléments Alimentaires Dans la Population Française: Estimation des Apports Usuels, des Prévalences D’inadéquation et des Risques; ANSES: Maisons-Alfort, France, 2015.
- Mallet, E.; Gaudelus, J.; Reinert, P.; Stagnara, J.; Benichou, J.; Basuyau, J.P.; Maurin, M.; Cordero, J.; Roden, A.; Uhlrich, J. Vitamin D status in 6- to 10-year-old children: A French multicenter study in 326 children. Arch. Pediatr. 2014, 21, 1106–1114. [Google Scholar] [CrossRef] [PubMed]
- Ardzejewska, K.; Tadros, R.; Baxter, D. A descriptive study on the barriers and facilitators to implementation of the NSW (Australia) Healthy School Canteen Strategy. Health Educ. J. 2012, 72, 136–145. [Google Scholar] [CrossRef]
- Dimbleby, H.; Vincent, J. The School Food Plan. 2013. Available online: http://www. schoolfoodplan. com/wp-content/uploads/2013/07/School_Food_Plan_2013 pdf (accessed on 12 February 2012).
- Yoong, S.L.; Nathan, N.; Wolfenden, L.; Wiggers, J.; Reilly, K.; Oldmeadow, C.; Wyse, R.; Sutherland, R.; Delaney, T.; Butler, P.; et al. CAFE: A multicomponent audit and feedback intervention to improve implementation of healthy food policy in primary school canteens: A randomised controlled trial. Int. J. Behav. Nutr. Phys. Act. 2016, 13, 126. [Google Scholar] [CrossRef] [PubMed]
- Wickramasinghe, K.K.; Rayner, M.; Goldacre, M.; Townsend, N.; Scarborough, P. Contribution of healthy and unhealthy primary school meals to greenhouse gas emissions in England: Linking nutritional data and greenhouse gas emission data of diets. Eur. J. Clin. Nutr. 2016, 70, 1162–1167. [Google Scholar] [CrossRef] [PubMed]
- Haroun, D.; Wood, L.; Harper, C.; Nelson, M. Nutrient-based standards for school lunches complement food-based standards and improve pupils’ nutrient intake profile. Br. J. Nutr. 2011, 106, 472–474. [Google Scholar] [CrossRef] [PubMed]
- Haroun, D.; Harper, C.; Wood, L.; Nelson, M. The impact of the food-based and nutrient-based standards on lunchtime food and drink provision and consumption in primary schools in England. Public Health Nutr. 2011, 14, 209–218. [Google Scholar] [CrossRef] [PubMed]
- Gibson, R.S. The role of diet- and host-related factors in nutrient bioavailability and thus in nutrient-based dietary requirement estimates. Food Nutr. Bull. 2007, 28, S77–S100. [Google Scholar] [CrossRef] [PubMed]
- Millward, D.J.; Garnett, T. Plenary Lecture 3: Food and the planet: nutritional dilemmas of greenhouse gas emission reductions through reduced intakes of meat and dairy foods. Proc. Nutr. Soc. 2010, 69, 103–118. [Google Scholar] [CrossRef] [PubMed]
- Vieux, F.; Darmon, N.; Touazi, D.; Soler, L.G. Greenhouse gas emissions of self-selected individual diets in France: Changing the diet structure or consuming less? Ecol. Econ. 2012, 75, 91–101. [Google Scholar] [CrossRef]
- Payne, C.L.; Scarborough, P.; Cobiac, L. Do low-carbon-emission diets lead to higher nutritional quality and positive health outcomes? A systematic review of the literature. Public Health Nutr. 2016, 19, 2654–2661. [Google Scholar] [CrossRef] [PubMed]
- Seves, S.M.; Verkaik-Kloosterman, J.; Biesbroek, S.; Temme, E.H. Are more environmentally sustainable diets with less meat and dairy nutritionally adequate? Public Health Nutr. 2017, 20, 2050–2062. [Google Scholar] [CrossRef] [PubMed]
- Niebylski, M.L.; Lu, T.; Campbell, N.R.; Arcand, J.; Schermel, A.; Hua, D.; Yeates, K.E.; Tobe, S.W.; Twohig, P.A.; L’Abbe, M.R.; et al. Healthy food procurement policies and their impact. Int. J. Environ. Res. Public Health 2014, 11, 2608–2627. [Google Scholar] [CrossRef] [PubMed]
- Wang, D.; Stewart, D. The implementation and effectiveness of school-based nutrition promotion programmes using a health-promoting schools approach: A systematic review. Public Health Nutr. 2013, 16, 1082–1100. [Google Scholar] [CrossRef] [PubMed]
- Perignon, M.; Barre, T.; Gazan, R.; Amiot, M.J.; Darmon, N. The bioavailability of iron, zinc, protein and vitamin A is highly variable in French individual diets: Impact on nutrient inadequacy assessment and relation with the animal-to-plant ratio of diets. Food Chem. 2018, 238, 73–81. [Google Scholar] [CrossRef] [PubMed]
- Bertin, M.; Lafay, L.; Calamassi-Tran, G.; Volatier, J.L.; Dubuisson, C. School meals in French secondary state schools: do national recommendations lead to healthier nutrition on offer? Br. J. Nutr. 2012, 107, 416–427. [Google Scholar] [CrossRef] [PubMed]
- Nicholas, J.; Wood, L.; Harper, C.; Nelson, M. The impact of the food-based and nutrient-based standards on lunchtime food and drink provision and consumption in secondary schools in England. Public Health Nutr. 2013, 16, 1052–1065. [Google Scholar] [CrossRef] [PubMed]
| Criteria | Component(s) Concerned | Expected Frequency | % of Observed Series Fulfilling the Criterion 1 |
|---|---|---|---|
| Starters containing more than 15% fat | starter | 4/20 max | 82.5% |
| Raw vegetable or fruit dishes containing at least 50% vegetables or fruits | starter, side dish | 10/20 min | 70% |
| Dishes to fry or pre-fried dishes containing more than 15% fat | protein dish, side dish | 4/20 max | 100% |
| Protein dishes with a ratio of P/F 1 ≤ 1 | protein dish | 2/20 max | 55% |
| Fish or fish-based dishes containing at least 70% fish and having a ratio of P/F ≥ 2 | protein dish | 4/20 min | 60% |
| Unground beef, veal or lamb, and offal | protein dish | 4/20 min | 77.5% |
| Preparations or ready-to-eat dishes containing less than 70% of the recommended weight for the portion of meat, fish or eggs | protein dish | 3/20 max | 25% |
| Vegetables, other than pulses, alone or in a mixture containing at least 50% vegetables | side dish | =10/20 | 27.5% |
| Pulses, starches or grains, alone or in a mixture containing at least 50% pulses, starches or grains | side dish | =10/20 | 27.5% |
| Cheese containing at least 150 mg of calcium per portion | starter, dairy product | 8/20 min | 77.5% |
| Cheese with a calcium content of more than 100 mg and less than 150 mg per portion | starter, dairy product | 4/20 min | 57.5% |
| Dairy (fresh dairy products, dairy-based desserts) containing more than 100 mg of milk calcium and less than 5 g of fat per portion | dairy product, dessert | 6/20 min | 40% |
| Desserts containing more than 15% fat | dessert | 3/20 max | 95% |
| Desserts or dairy products containing more than 20 g of total simple sugars per portion and less than 15% fat | dairy product, dessert | 4/20 max | 100% |
| Raw fruit dessert 100% raw fruit without added sugars | dessert | 8/20 min | 77.5% |
| Recommended Daily Intake | Average Content (% of Recommendation, Expressed Per Meal) | Standard Deviation | |
|---|---|---|---|
| Energy | 1996 kcal [24,28,29] | 35.6 | 2.7 |
| Protein | 25 g [28,29] | 129.8 | 8.5 |
| Linoleic Acid | 8.9 g [30] | 39.3 | 10.2 |
| α-Linolenic Acid | 2.2 g [30] | 20.4 | 8.3 |
| DHA | 152 mg [30] | 42.2 | 18.0 |
| Fiber | 13 g [24] | 59.5 | 6.2 |
| Vitamin B1 | 0.8 mg [24] | 46.3 | 5.2 |
| Vitamin B2 | 1.2 mg [24] | 38.2 | 3.4 |
| Vitamin B3 | 9 mg [24] | 64.9 | 8.9 |
| Vitamin B6 | 1 mg [24] | 56.4 | 6.0 |
| Vitamin B9 | 201 µg [24] | 57.6 | 6.7 |
| Vitamin B12 | 1.4 µg [24] | 103.4 | 15.4 |
| Vitamin C | 89 mg [24] | 35.0 | 6.3 |
| Vitamin D | 5 µg [24] | 17.3 | 4.1 |
| Vitamin E | 9.1 mg [24] | 52.5 | 15.7 |
| Vitamin A | 501 µg [24] | 81.0 | 14.2 |
| Calcium | 924 mg [24] | 34.2 | 4.1 |
| Potassium | 2892 mg [31] | 33.6 | 3.8 |
| Iron | 8.2 mg [24] | 44.0 | 4.3 |
| Magnesium | 203 mg [24] | 45.6 | 3.8 |
| Zinc | 9.2 mg [24] | 39.5 | 4.1 |
| Copper | 1.2 mg [24] | 36.8 | 3.3 |
| Iodine | 120 µg [24] | 42.1 | 6.7 |
| Selenium | 39 µg [24] | 52.0 | 6.1 |
| MAR (%) b | 49.3 | 3.7 |
© 2018 by the authors. Licensee MDPI, Basel, Switzerland. This article is an open access article distributed under the terms and conditions of the Creative Commons Attribution (CC BY) license (http://creativecommons.org/licenses/by/4.0/).
Share and Cite
Vieux, F.; Dubois, C.; Duchêne, C.; Darmon, N. Nutritional Quality of School Meals in France: Impact of Guidelines and the Role of Protein Dishes. Nutrients 2018, 10, 205. https://doi.org/10.3390/nu10020205
Vieux F, Dubois C, Duchêne C, Darmon N. Nutritional Quality of School Meals in France: Impact of Guidelines and the Role of Protein Dishes. Nutrients. 2018; 10(2):205. https://doi.org/10.3390/nu10020205
Chicago/Turabian StyleVieux, Florent, Christophe Dubois, Christelle Duchêne, and Nicole Darmon. 2018. "Nutritional Quality of School Meals in France: Impact of Guidelines and the Role of Protein Dishes" Nutrients 10, no. 2: 205. https://doi.org/10.3390/nu10020205
APA StyleVieux, F., Dubois, C., Duchêne, C., & Darmon, N. (2018). Nutritional Quality of School Meals in France: Impact of Guidelines and the Role of Protein Dishes. Nutrients, 10(2), 205. https://doi.org/10.3390/nu10020205


