Healthiness of Food and Beverages for Sale at Two Public Hospitals in New South Wales, Australia

 ,
,
Abstract
:1. Introduction
2. Materials and Methods
2.1. Policy Context
2.2. Design
2.3. Geographic Context
2.4. Data Collection
2.5. Study Outcomes
2.5.1. Product Availability
2.5.2. Portion Size and Product Quality
- Compliant Everyday or Occasional food and drinks: met the maximum portion size and quality guidelines.
- Everyday food and drinks exceeding portion size (e.g., >400 mL fruit juice or >500 mL flavoured milk).
- Below quality Everyday food and drinks: contained “do not use” ingredients as identified from the product ingredient lists (e.g., muesli bars and nut mixes with added confectionary).
- Occasional food and drinks exceeding portion size (e.g., >280 g meat pie or >500 mL diet drink)
- Below quality Occasional food and drinks: contained “do not use” ingredients (e.g., hot meal with sour cream or any sugary drink, such as soft drinks, fruit drinks, sweetened iced teas, and energy and sports drinks) [9].
2.5.3. Packaged Product Quality
2.5.4. Placement and Promotion
2.6. Data Analysis
3. Results
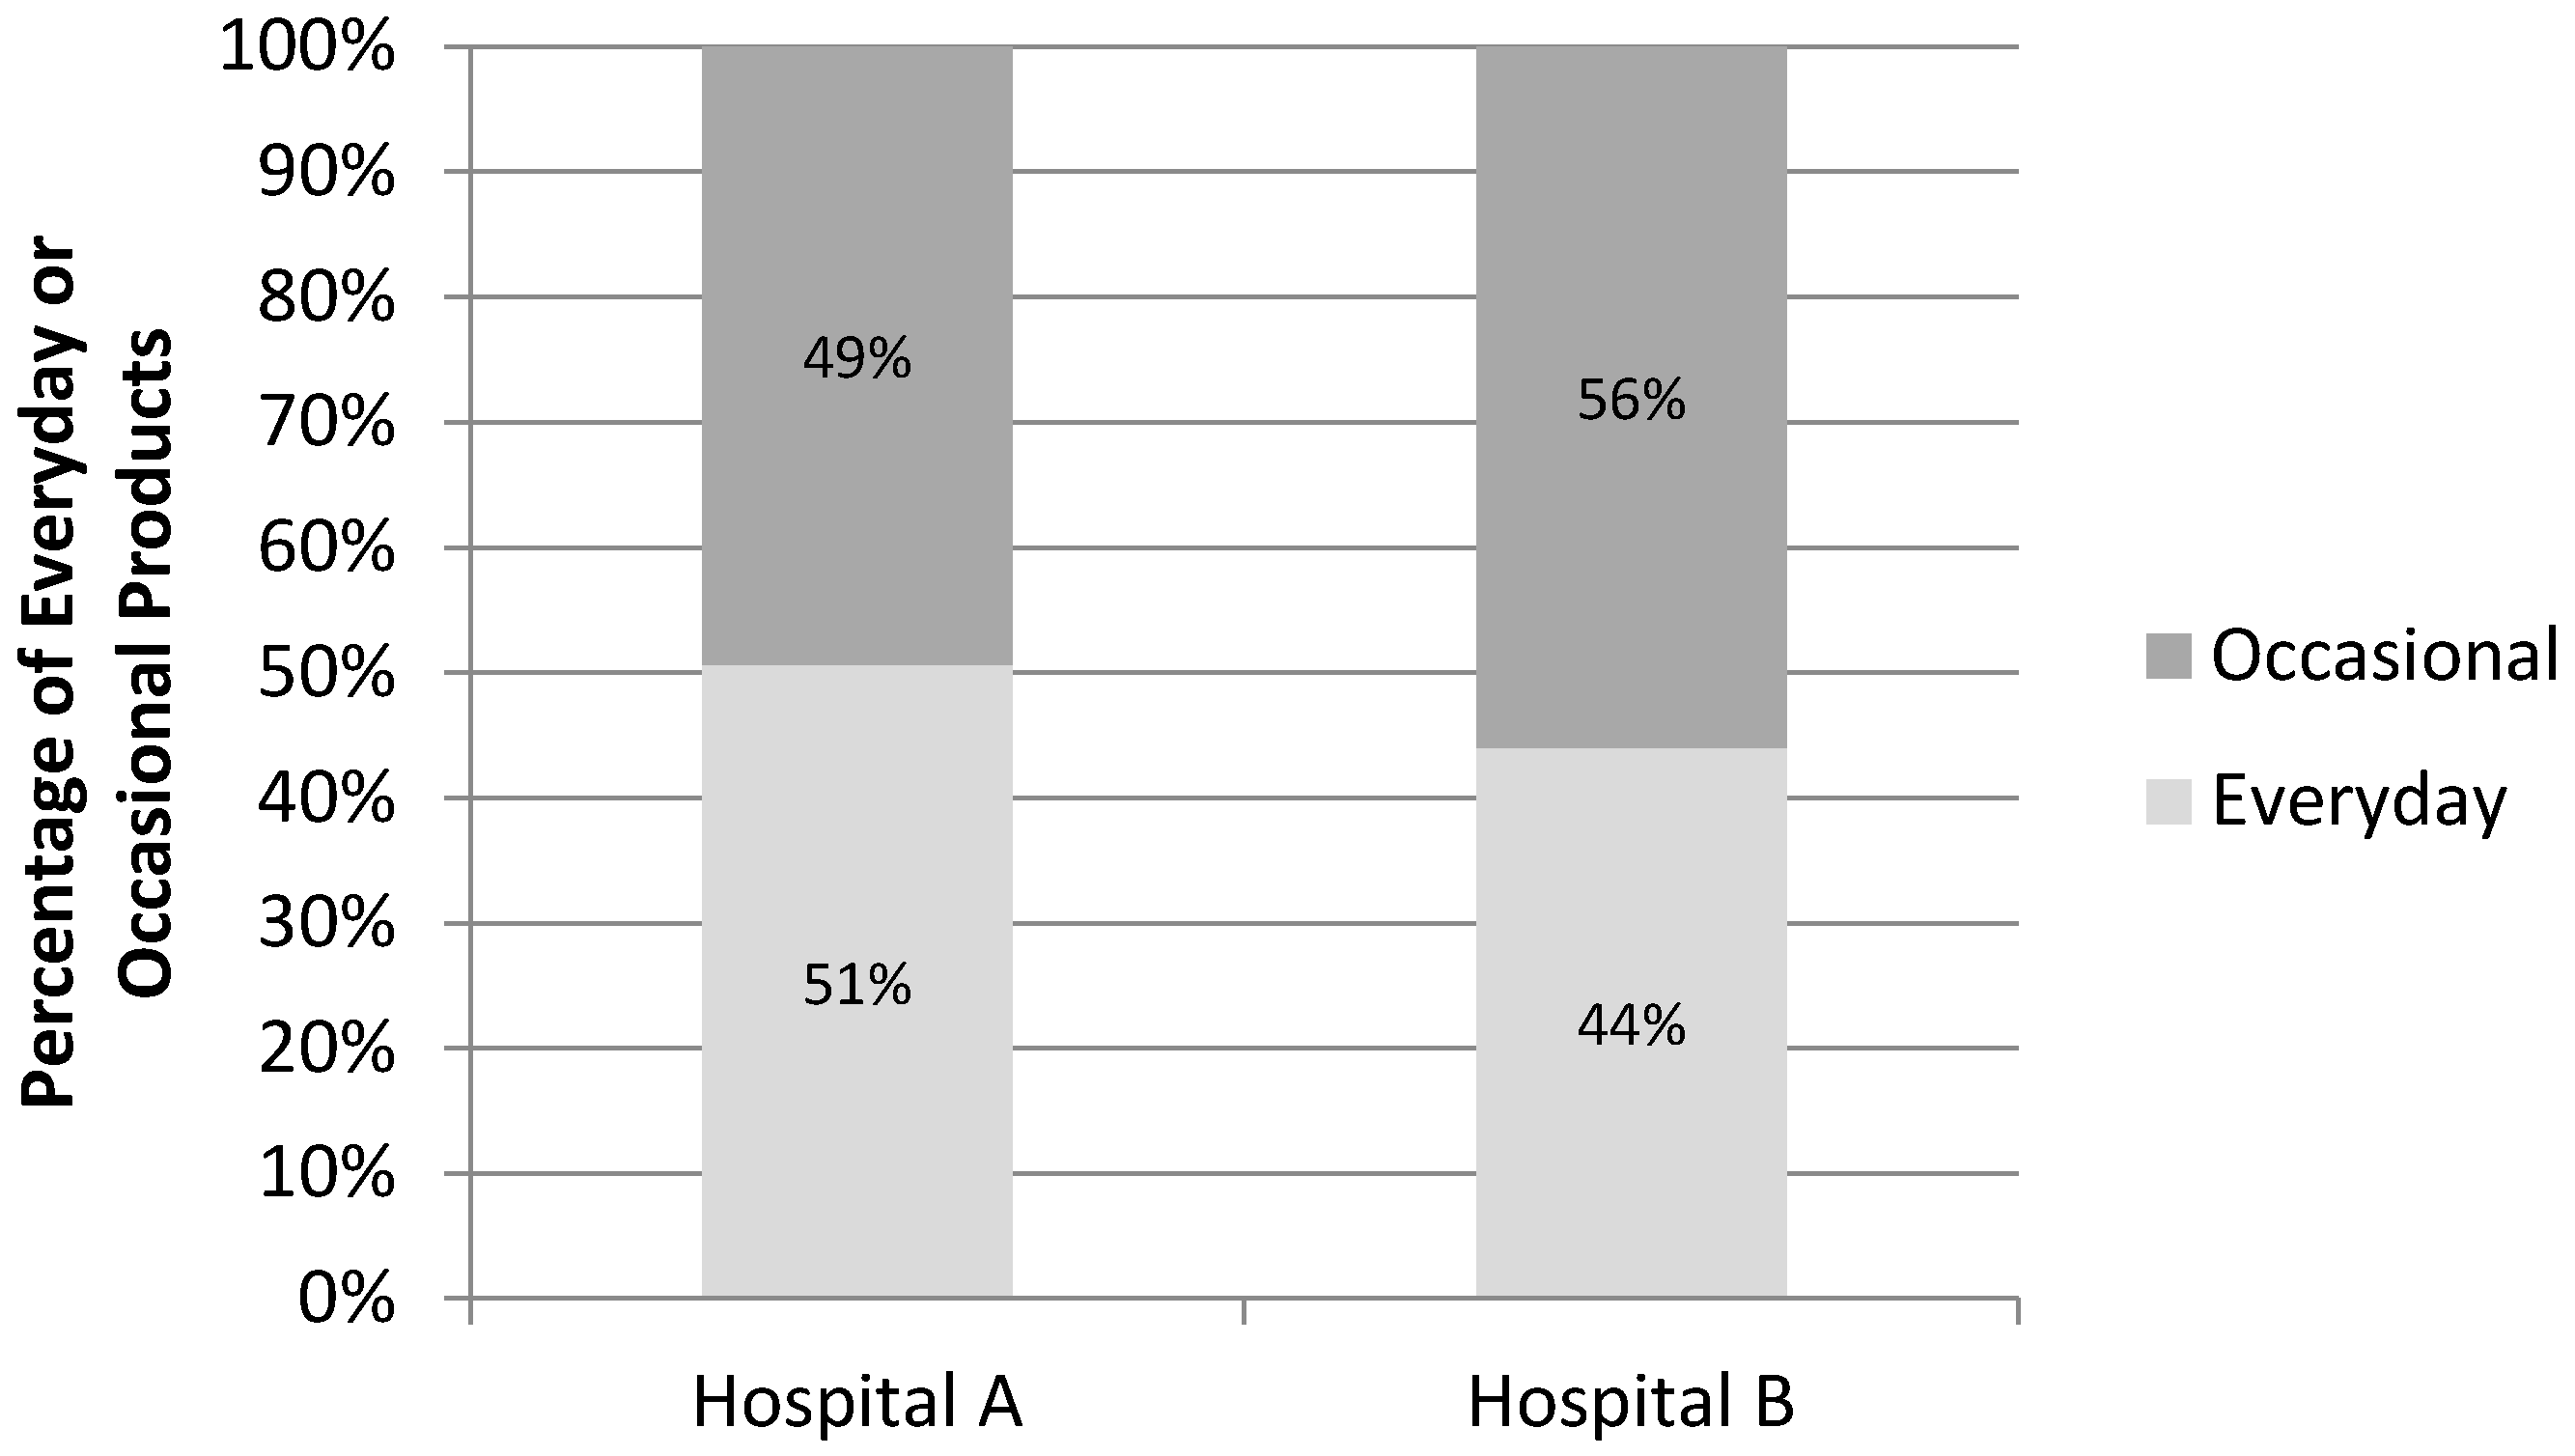
3.1. Availability
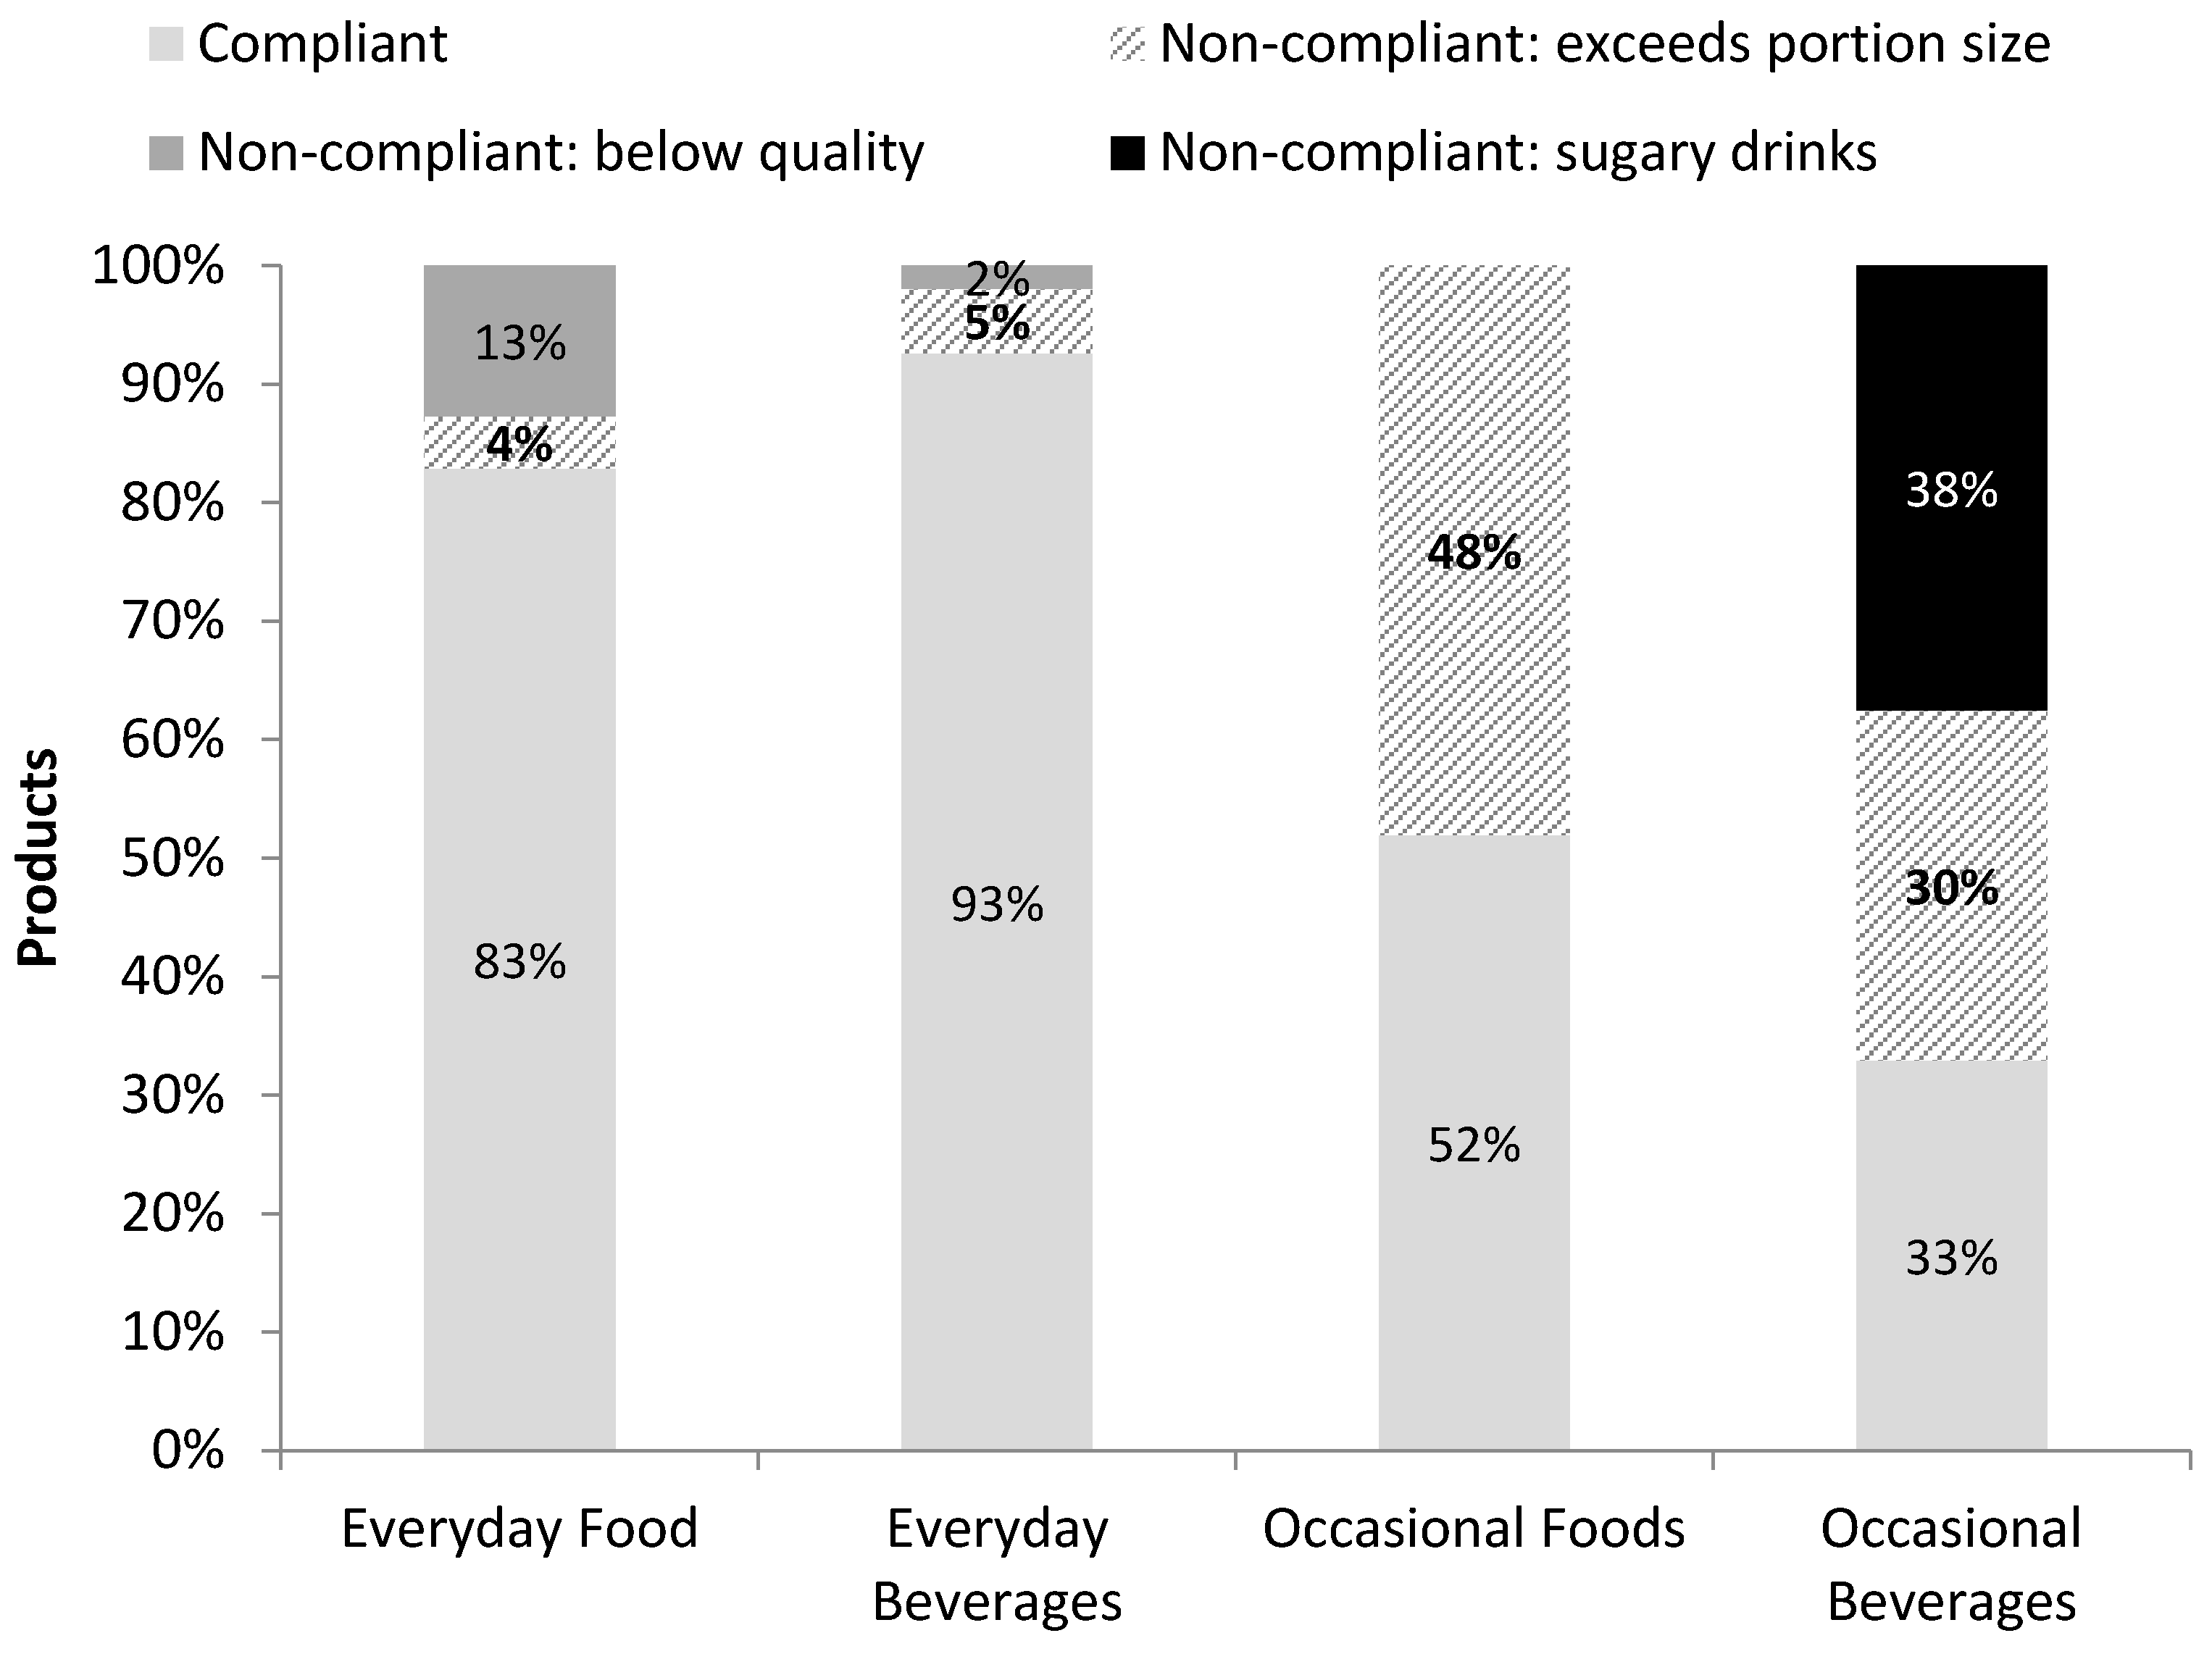
3.2. Product Quality
3.3. Product Size
3.4. Placement and Promotion
4. Discussion
Strengths and Limitations
5. Conclusions
Supplementary Materials
Acknowledgments
Author Contributions
Conflicts of Interest
Appendix A

| Sugary Beverages | All Occasional Beverages | Proportion Sugary Beverages | |
|---|---|---|---|
| Hospital A † | 35 | 492 | 7% |
| Hospital B | 325 | 467 | 70% |
| Products Exceeding Portion Size | Total | Proportion Exceeding Portion Size | |
|---|---|---|---|
| Food † | 86 | 406 | 21% |
| Beverages § | 64 | 139 | 46% |
References
- Australian Bureau of Statistics. Australian Health Survey: Nutrition First Results, 2014–15; Commonwealth of Australia: Canberra, ACT, Australia, 2015.
- Australian Bureau of Statistics. Australian Health Survey: Consumption of Food Groups from the Australian Dietary Guidelines; Commonwealth of Australia: Canberra, ACT, Australia, 2016.
- Commonwealth of Australia. Healthy Food Partnership. Available online: http://www.health.gov.au/internet/main/publishing.nsf/content/healthy-food-partnership (accessed on 8 November 2017).
- Public Health Association fo Australia. Policy-at-a-Glance--Food, Nutrition and Health Policy; Public Health Association of Australia: Deakin, ACT, Australia, 2012. [Google Scholar]
- Kelly, B.; Flood, V.M.; Yeatman, H. Measuring local food environments: An overview of available methods and measures. Health Place 2011, 17, 1284–1293. [Google Scholar] [CrossRef] [PubMed]
- Bell, C.; Pond, N.; Davies, L.; Francis, J.L.; Campbell, E.; Wiggers, J. Healthier choices in an australian health service: A pre-post audit of an intervention to improve the nutritional value of foods and drinks in vending machines and food outlets. BMC Health Serv. Res. 2013, 13, 492. [Google Scholar] [CrossRef] [PubMed]
- Lawrence, S.; Boyle, M.; Craypo, L.; Samuels, S. The food and beverage vending environment in health care facilities participating in the healthy eating, active communities program. Pediatrics 2009, 123 (Suppl. 5), S287–S292. [Google Scholar] [CrossRef] [PubMed]
- Australian Institute of Health and Welfare. Australia's Hospitals at a Glance 2015–16; AIHW: Canberra, ACT, Australia, 2017.
- New South Wales Ministry of Health. Healthy Food and Drink in NSW Health Facilities for Staff and Visitors Framework; NSW Ministry of Health: North Sydney, NSW, Australia, 2017.
- New South Wales Ministry of Health. Live Life Well @ Health: Healthier Food and Drink Choices—Staff & Visitors in NSW Health Facilities; NSW Ministry of Health: North Sydney, NSW, Australia, 2009.
- National Health and Medical Research Council. Australian Dietary Guidelines Summary; National Health and Medical Research Council: Canberra, ACT, Australia, 2013. [Google Scholar]
- Commonwealth of Australia. About Health Star Ratings. Available online: http://healthstarrating.gov.au/internet/healthstarrating/publishing.nsf/Content/About-health-stars (accessed on 20 September 2017).
- Roy, R.; Hebden, L.; Kelly, B.; De Gois, T.; Ferrone, E.M.; Samrout, M.; Vermont, S.; Allman-Farinelli, M. Description, measurement and evaluation of tertiary-education food environments. Br. J. Nutr. 2016, 115, 1598–1606. [Google Scholar] [CrossRef] [PubMed]
- Kelly, B.; Flood, V.M.; Bicego, C.; Yeatman, H. Derailing healthy choices: An audit of vending machines at train stations in nsw. Health Promot. J. Aust. 2012, 23, 73–75. [Google Scholar] [CrossRef]
- Reilly, K.; Hunter New England Population Health, New Lambton, NSW, Australia. Personal communication, 2017.
- .id-the Population Experts. State of Australia’s Fast Growing Outer Suburbs. Available online: https://ngaa.org.au/pdfs/ngaa-research-state-of-the-fast-growing-outer-suburbs-part-1-july-2017.pdf (accessed on 31 October 2017).
- Astell-Burt, T.; Feng, X.; Kolt, G.S.; McLean, M.; Maberly, G. Understanding geographical inequities in diabetes: Multilevel evidence from 114,755 adults in Sydney, Australia. Diabetes Res. Clin. Pract. 2014, 106, e68–e73. [Google Scholar] [CrossRef] [PubMed]
- NSW Government Western Sydney Local Healthy District. WSLHD 2016–17 Year in Review; WSLHD: Western Sydney, NSW, Australia, 2017.
- Landon, S.; NSW Ministry of Health, North Sydney, Australia. Personal communication, 2017.
- NSW Department of Education. Healthy School Canteens: Summary of Evidence in Inform a Revised Strategy; NSW Department of Education: Sydney, Australia, 2016.
- Dunford, E.; Trevena, H.; Goodsell, C.; Ng, K.; Webster, J.; Millis, A.; Goldstein, S.; Hugueniot, O.; Neal, B. Foodswitch: A mobile phone app to enable consumers to make healthier food choices and crowdsourcing of national food composition data. JMIR Mhealth Uhealth 2014, 2, e37. [Google Scholar] [CrossRef] [PubMed]
- Wu, J.H.; Neal, B.; Trevena, H.; Crino, M.; Stuart-Smith, W.; Faulkner-Hogg, K.; Yu Louie, J.C.; Dunford, E. Are gluten-free foods healthier than non-gluten-free foods? An evaluation of supermarket products in australia. Br. J. Nutr. 2015, 114, 448–454. [Google Scholar] [CrossRef] [PubMed]
- Winston, C.P.; Sallis, J.F.; Swartz, M.D.; Hoelscher, D.M.; Peskin, M.F. Consumer nutrition environments of hospitals: An exploratory analysis using the hospital nutrition environment scan for cafeterias, vending machines, and gift shops, 2012. Prev. Chronic Dis. 2013, 10, 1–9. [Google Scholar] [CrossRef] [PubMed]
- Derrick, J.W.; Bellini, S.G.; Spelman, J. Research: Using the hospital nutrition environment scan to evaluate health initiative in hospital cafeterias. J. Acad. Nutr. Diet. 2015, 115, 1855–1860. [Google Scholar] [CrossRef] [PubMed]
- Lesser, L.I.; Hunnes, D.E.; Reyes, P.; Arab, L.; Ryan, G.W.; Brook, R.H.; Cohen, D.A. Assessment of food offerings and marketing strategies in the food-service venues at california children’s hospitals. Acad. Pediatr. 2012, 12, 62–67. [Google Scholar] [CrossRef] [PubMed]
- McDonald, C.M.; Karamlou, T.; Wengle, J.G.; Gibson, J.; McCrindle, B.W. Nutrition and exercise environment available to outpatients, visitors, and staff in children’s hospitals in canada and the united states. Arch. Pediatr. Adolesc. Med. 2006, 160, 900–905. [Google Scholar] [CrossRef] [PubMed]
- Zheng, M.; Rangan, A.; Meertens, B.; Wu, J.H.Y. Changes in typical portion sizes of commonly consumed discretionary foods among australian adults from 1995 to 2011–2012. Nutrients 2017, 9, 577. [Google Scholar] [CrossRef] [PubMed]
- Nielsen, S.J.; Popkin, B.M. Patterns and trends in food portion sizes, 1977–1998. JAMA 2003, 289, 450–453. [Google Scholar] [CrossRef] [PubMed]
- Matthiessen, J.; Fagt, S.; Biltoft-Jensen, A.; Beck, A.M.; Ovesen, L. Size makes a difference. Public Health Nutr. 2003, 6, 65–72. [Google Scholar] [CrossRef] [PubMed]
- Kling, S.M.; Roe, L.S.; Keller, K.L.; Rolls, B.J. Double trouble: Portion size and energy density combine to increase preschool children’s lunch intake. Physiol. Behav. 2016, 162, 18–26. [Google Scholar] [CrossRef] [PubMed]
- McCrickerd, K.; Lim, C.M.; Leong, C.; Chia, E.M.; Forde, C.G. Texture-based differences in eating rate reduce the impact of increased energy density and large portions on meal size in adults. J. Nutr. 2017, 147, 1208–1217. [Google Scholar] [CrossRef] [PubMed]
- Sharma, S.V.; Winston Paolicelli, C.; Jyothi, V.; Baun, W.; Perkison, B.; Phipps, M.; Montgomery, C.; Feltovich, M.; Griffith, J.; Alfaro, V.; et al. Evaluation of worksite policies and practices promoting nutrition and physical activity among hospital workers. Int. J. Workplace Health Manag. 2016, 9, 46–62. [Google Scholar] [CrossRef]
- Roy, R.; Kelly, B.; Rangan, A.; Allman-Farinelli, M. Food environment interventions to improve the dietary behavior of young adults in tertiary education settings: A systematic literature review. J. Acad. Nutr. Diet. 2015, 115, 1647–1681. [Google Scholar] [CrossRef] [PubMed]
- Crino, M.; Herrera, A.M.M.; Ananthapavan, J.; Wu, J.H.Y.; Neal, B.; Lee, Y.Y.; Zheng, M.; Lal, A.; Sacks, G. Modelled cost-effectiveness of a package size cap and a kilojoule reduction intervention to reduce energy intake from sugar-sweetened beverages in Australia. Nutrients 2017, 9, 983. [Google Scholar] [CrossRef] [PubMed]
- Crino, M.; Sacks, G.; Wu, J.H.Y. A review of population-level actions targeting reductions in food portion sizes to address obesity and related non-communicable diseases. Curr. Nutr. Rep. 2016, 5, 323–332. [Google Scholar] [CrossRef]
- Stanton, R.A. Food retailers and obesity. Curr. Obes. Rep. 2015, 4, 54–59. [Google Scholar] [CrossRef] [PubMed]
- Cohen, D.A.; Babey, S.H. Contextual influences on eating behaviours: Heuristic processing and dietary choices. Obes. Rev. 2012, 13, 766–779. [Google Scholar] [CrossRef] [PubMed]
- Glanz, K.; Johnson, L.; Yaroch, A.L.; Phillips, M.; Ayala, G.X.; Davis, E.L. Measures of retail food store environments and sales: Review and implications for healthy eating initiatives. J. Nutr. Educ. Behav. 2016, 48, 280–288. [Google Scholar] [CrossRef] [PubMed]
- Huse, O.; Blake, M.R.; Brooks, R.; Corben, K.; Peeters, A. The effect on drink sales of removal of unhealthy drinks from display in a self-service cafe. Public Health Nutr. 2016, 19, 3142–3145. [Google Scholar] [CrossRef] [PubMed]
- Carrad, A.M.; Louie, J.C.; Milosavljevic, M.; Kelly, B.; Flood, V.M. Consumer support for healthy food and drink vending machines in public places. Aust. N. Z. J. Public Health 2015, 39, 355–357. [Google Scholar] [CrossRef] [PubMed]
- Rana, L.; Alvaro, R. Applying a health promoting schools approach to nutrition interventions in schools: Key factors for success. Health Promot. J. Aust. 2010, 21, 106–113. [Google Scholar] [CrossRef]
- Reilly, K.; Wyse, R.; Yoong, S.; Nathan, N. Is the banning of unhealthy foods at school canteens associated with principal influence or school policy? Obes. Res. Clin. Pract. 2014, 8, 85. [Google Scholar] [CrossRef]
- Boelsen-Robinson, T.; Backholer, K.; Corben, K.; Blake, M.R.; Palermo, C.; Peeters, A. The effect of a change to healthy vending in a major australian health service on sales of healthy and unhealthy food and beverages. Appetite 2017, 114, 73–81. [Google Scholar] [CrossRef] [PubMed]
- Abery, E.; Drummond, C. Implementation of mandatory nutritional guidelines in south australians primary school canteens: A qualitative study. Improv. Sch. 2014, 17, 41–53. [Google Scholar] [CrossRef]
- Bell, A.C.; Swinburn, B.A. School canteens: Using ripples to create a wave of healthy eating. Med. J. Aust. 2005, 183, 5–6. [Google Scholar] [PubMed]
- Gorton, D.; Carter, J.; Cvjetan, B.; Ni Mhurchu, C. Healthier vending machines in workplaces: Both possible and effective. N. Z. Med. J. 2010, 123, 43–52. [Google Scholar] [PubMed]
- NSW Ministry of Health. Nsw School Canteen Buyers’ Guide 2017. Healthy Kids Association Registered Products: Everyday and Occasional; NSW Ministry of Health: North Sydney, NSW, Australia, 2017.

| Café (n = 7) | Sells freshly prepared hot beverages and may sell a selection of pre-made fresh food products |
| Cafeteria (n = 5) | Sells either hot or cold fresh food products served to order, may also have a selection of premade food |
| Convenience store (n = 2) | Majority of items sold are manufacturer packaged products, limited fresh options available |
| Vending machine (n = 70) | Three types of vending machines were observed: food only, beverage only, or containing both food and beverage |
| No. of Outlets | ≥75% of Total Everyday Products, n (%) | ≥75% Everyday Food, n (%) | ≥75% Everyday Drinks, n (%) | |
|---|---|---|---|---|
| Hospitals Combined | ||||
| Fixed outlets | 14 | 1 (7) | 1 (7) | 6 (43) |
| Vending machines | 70 | 16 (23) | 0 | 16 (23) |
| Hospital A | ||||
| Fixed outlets | 11 | 1 (9) | 1 (9) | 5 (45) |
| Vending machines | 40 | 10 (25) | 0 | 10 (25) |
| Hospital B | ||||
| Fixed outlets | 3 | 0 | 0 | 1 (33) |
| Vending machines | 30 | 6 (20) | 0 | 6 (20) |
| Outlet Type (n) | Food | Beverage |
|---|---|---|
| % Everyday Median (Range) | % Everyday Median (Range) | |
| Fixed Outlet † | ||
| Café (7) | 54 (23–67) | 86 (64–92) |
| Cafeteria (5) | 54 (20–82) | 54 (45–64) |
| Convenience store (2) | 14 (5–22) | 30 (16–44) |
| p = 0.132 | p = 0.005 | |
| Vending machines § | ||
| Beverage vending (39) | N/A | 70 (50–100) |
| Mixed vending (8) | 50 (42–65) | 33 (31–35) |
| Food vending (23) | 23 (13–54) | - |
| p < 0.001 | p < 0.001 |
| Product Placement n/N(%) | Advertisements * n/N(%) | Meal Deals n/N(%) | ||
|---|---|---|---|---|
| Checkout Areas | Countertops | |||
| Hospitals Combined | 9/14 (64) | 6/9 (67) | 12/28 (43) | 6/9 (67) |
| Hospital A | 7/11 (64) | 5/7 (71) | 3/15 (20) | 2/5 (40) |
| Hospital B | 2/3 (67) | 1/2 (50) | 9/13 (69) | 4/4 (100) |
© 2018 by the authors. Licensee MDPI, Basel, Switzerland. This article is an open access article distributed under the terms and conditions of the Creative Commons Attribution (CC BY) license (http://creativecommons.org/licenses/by/4.0/).
Share and Cite
Tsai, C.; Svensen, E.; Flood, V.M.; Probst, Y.; Reilly, K.; Corbett, S.; Wu, J.H.Y. Healthiness of Food and Beverages for Sale at Two Public Hospitals in New South Wales, Australia. Nutrients 2018, 10, 216. https://doi.org/10.3390/nu10020216
Tsai C, Svensen E, Flood VM, Probst Y, Reilly K, Corbett S, Wu JHY. Healthiness of Food and Beverages for Sale at Two Public Hospitals in New South Wales, Australia. Nutrients. 2018; 10(2):216. https://doi.org/10.3390/nu10020216
Chicago/Turabian StyleTsai, Carrie, Erika Svensen, Victoria M. Flood, Yasmine Probst, Kathryn Reilly, Stephen Corbett, and Jason H. Y. Wu. 2018. "Healthiness of Food and Beverages for Sale at Two Public Hospitals in New South Wales, Australia" Nutrients 10, no. 2: 216. https://doi.org/10.3390/nu10020216