Impact of a Specific Amino Acid Composition with Micronutrients on Well-Being in Subjects with Chronic Psychological Stress and Exhaustion Conditions: A Pilot Study


Abstract
:1. Introduction
2. Materials and Methods
2.1. Questionnaires: The PSQ30, the Psychological Neurological Questionnaire (PNF), and the Visual Analogue Scales (VAS)
2.2. Participants
2.3. Study Design
2.4. Anthropometric and Clinical Measurements
2.5. Biochemical Analysis
2.6. Statistical Analysis
3. Results
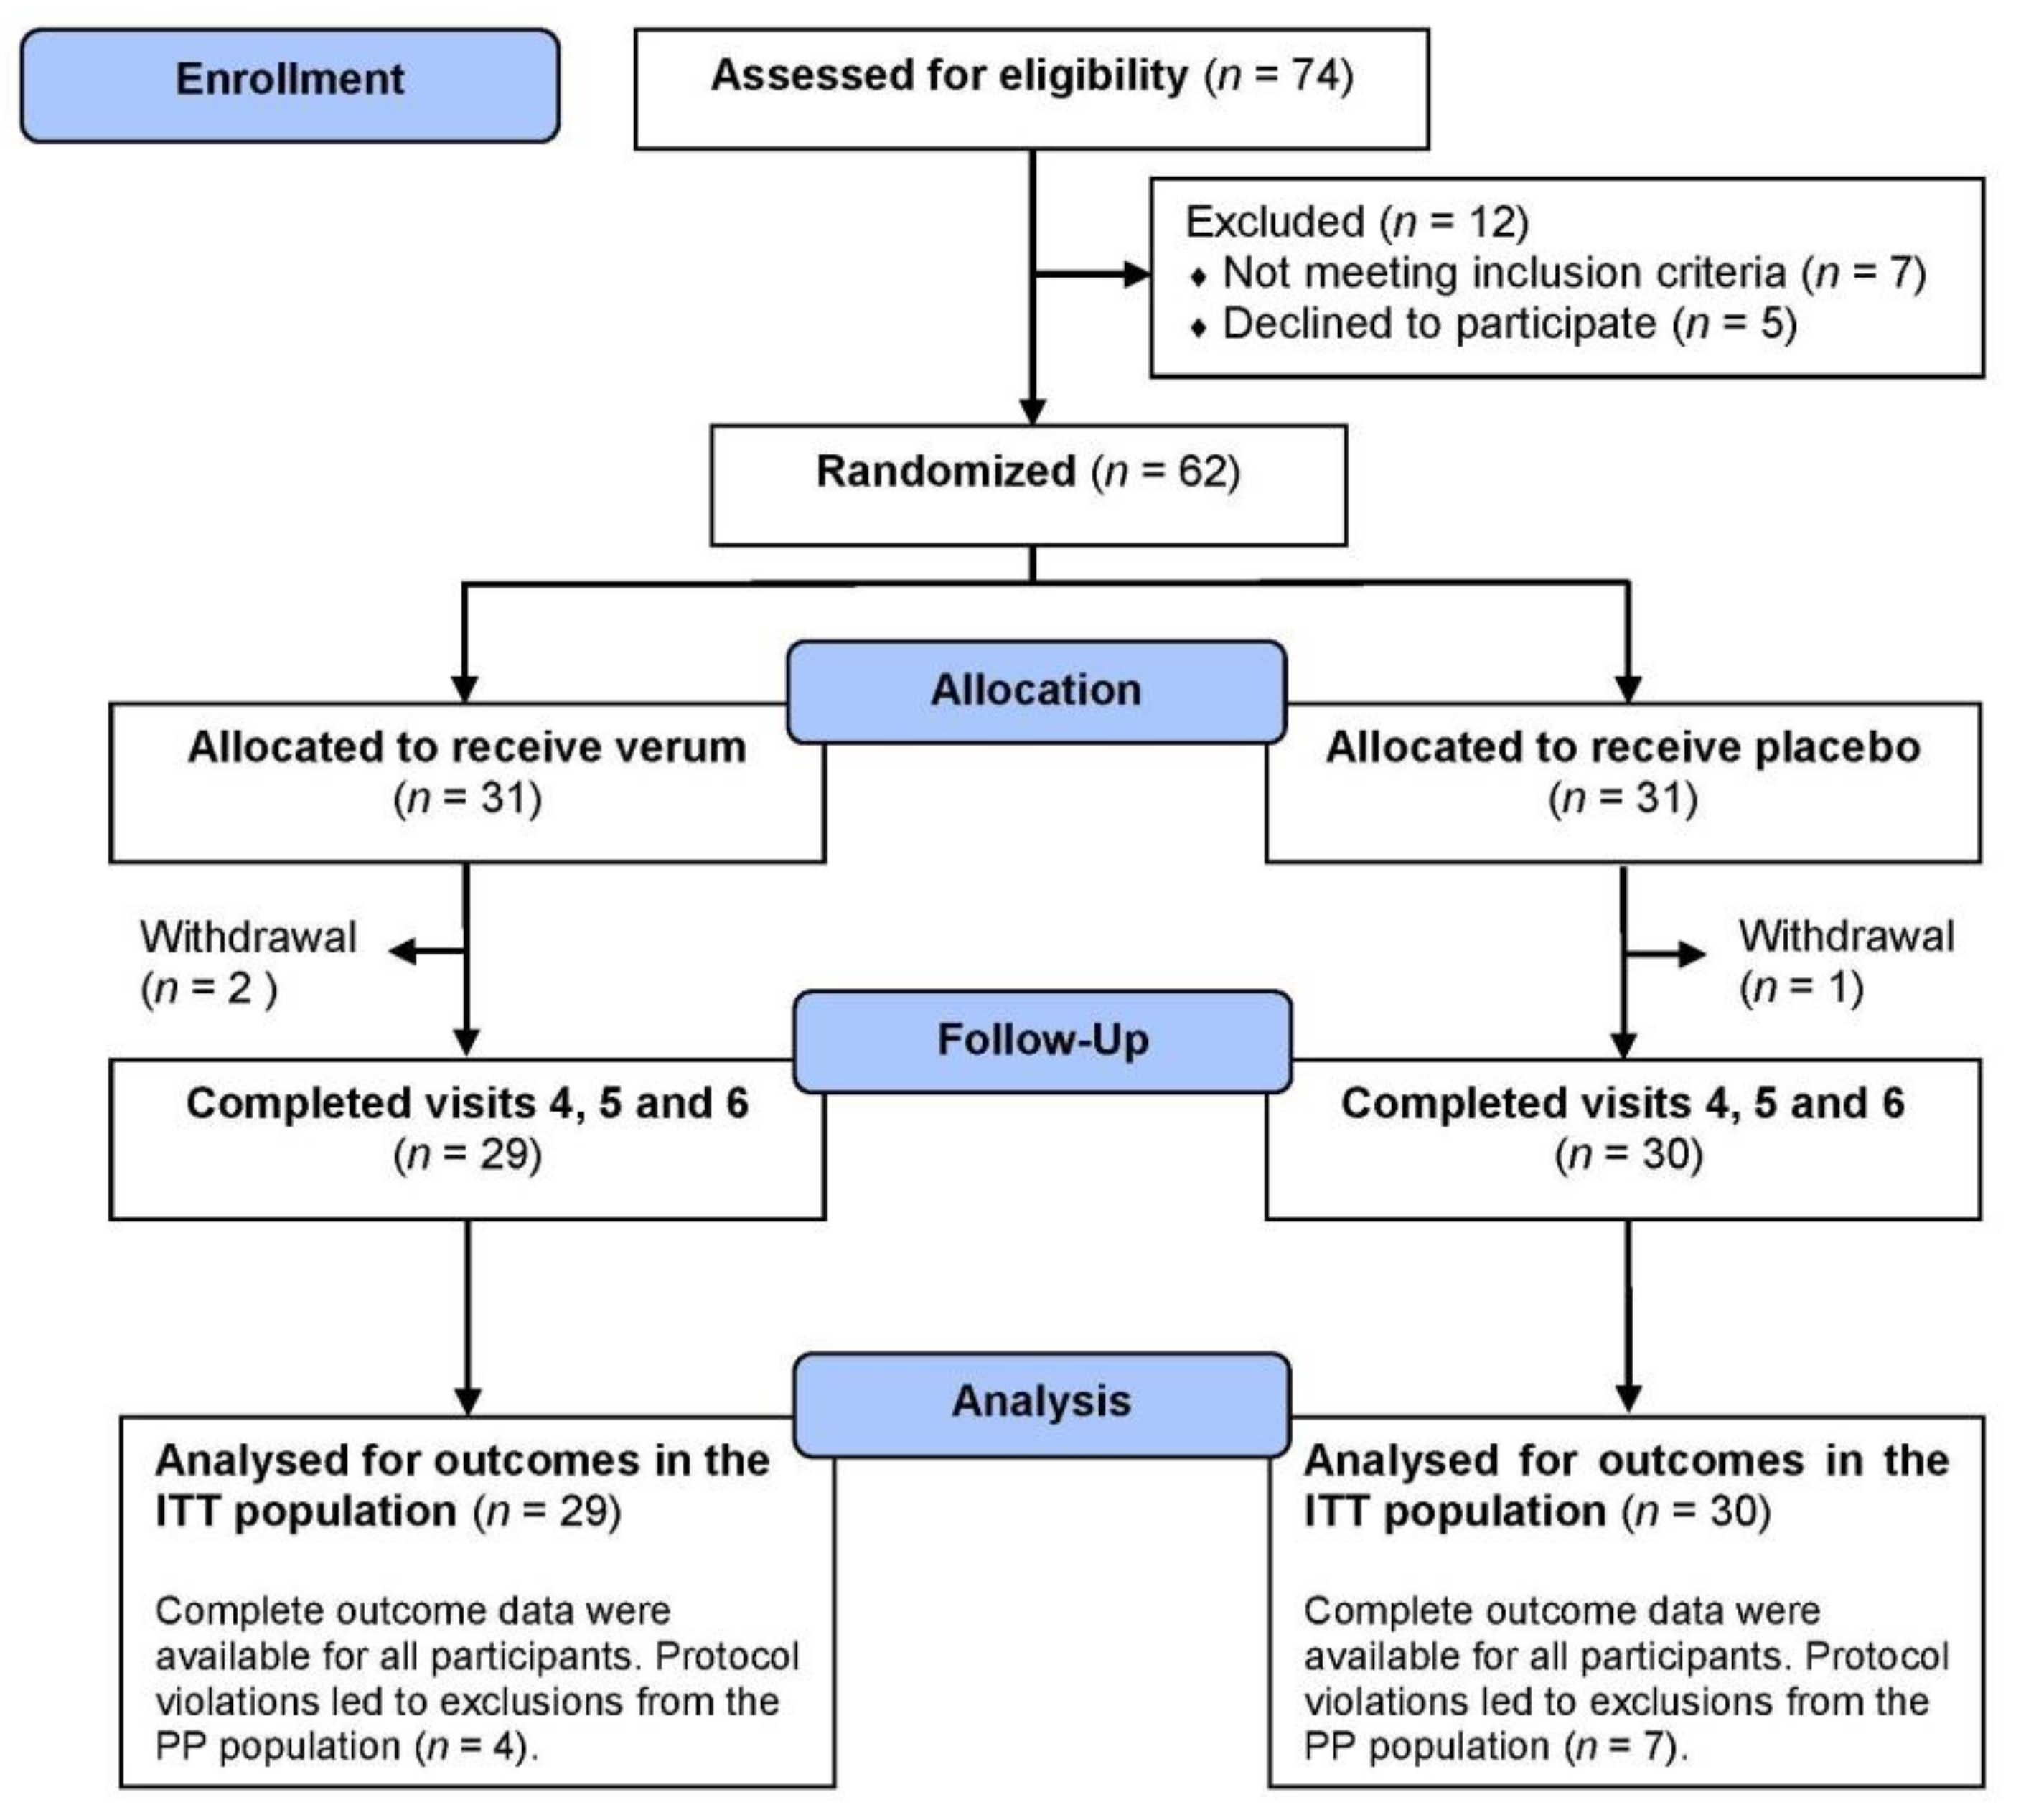
3.1. Participants
3.2. Questionnaires: the PSQ30, the PNF, and the VAS
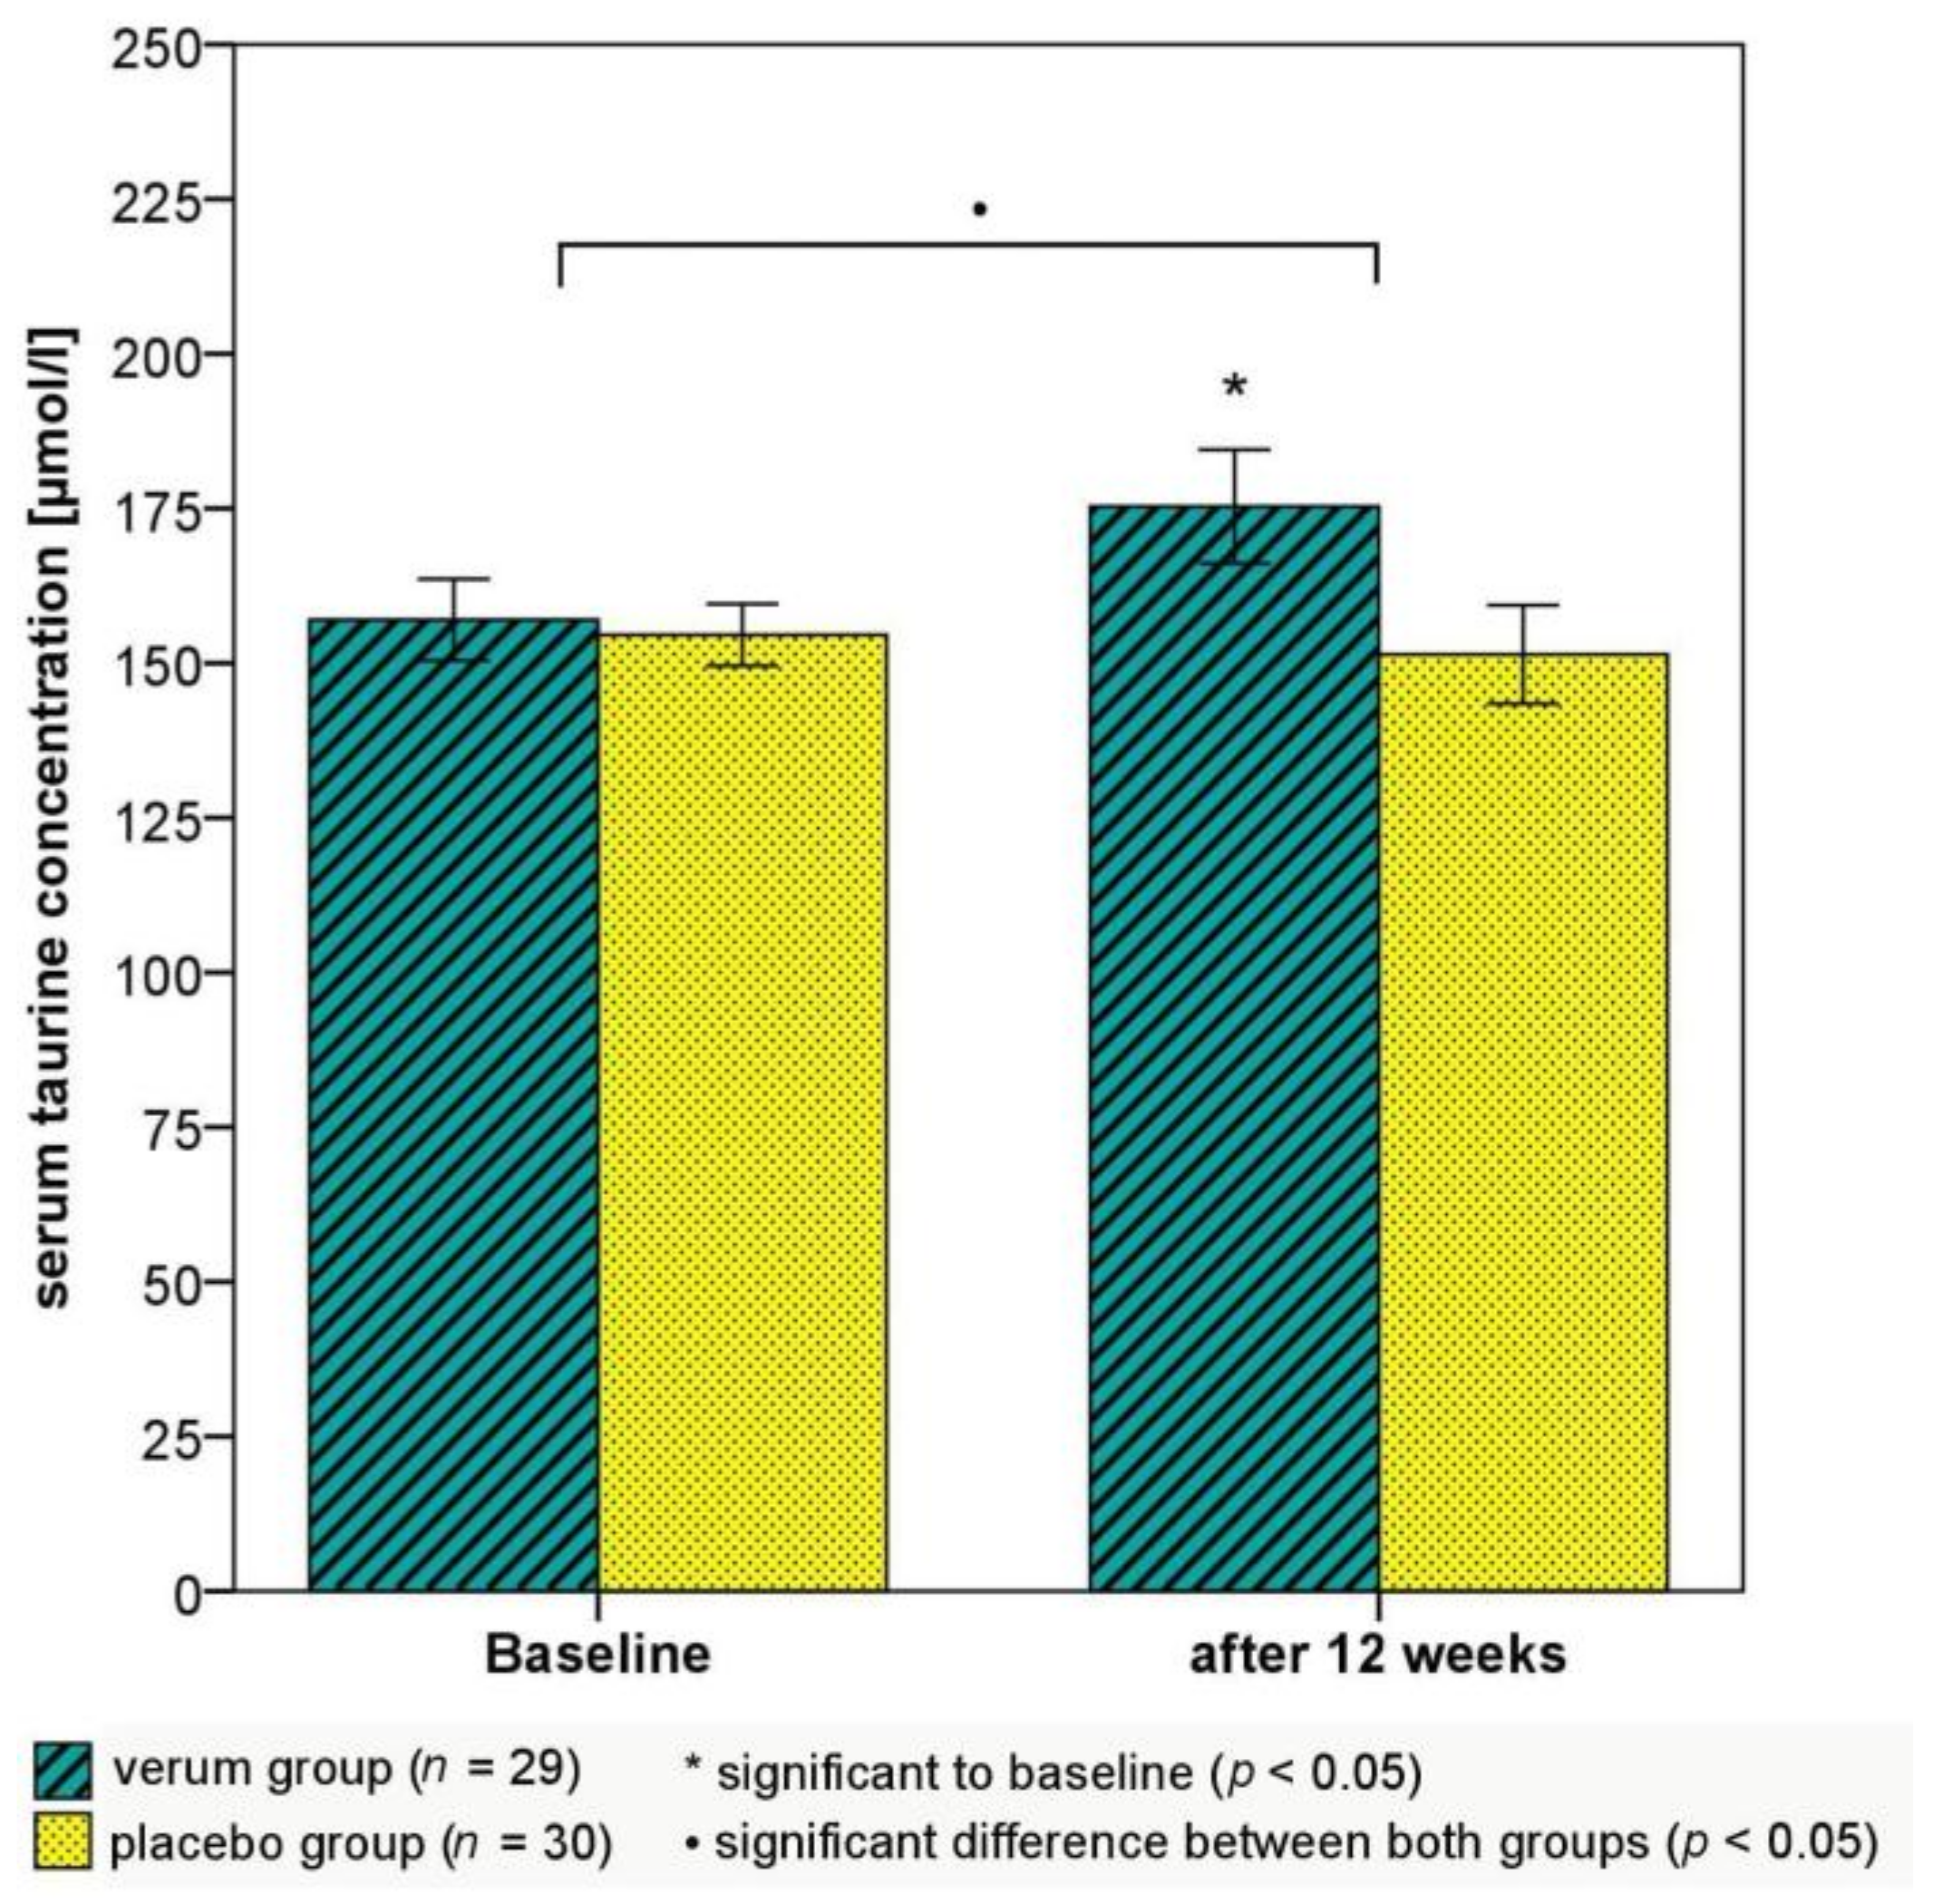
3.3. Salivary Cortisol, Serum Amino Acid, and Serotonin Concentrations
3.4. Anthropometric, Clinical, Cardiometabolic, and Biochemical Parameters
4. Discussion
5. Conclusions
Supplementary Materials
Author Contributions
Acknowledgments
Conflicts of Interest
References
- European Agency for Safety and Health at Work: European Opinion Poll on Occupational Safety and Health; Publications Office of the European Union: Luxembourg, 2013; pp. 1–80. [CrossRef]
- Wittchen, H.U.; Jacobi, F.; Rehm, J.; Gustavsson, A.; Svensson, M.; Jönsson, B.; Olesen, J.; Allgulander, C.; Alonso, J.; Faravelli, C.; et al. The size and burden of mental disorders and other disorders of the brain in Europe 2010. Eur. Neuropsychopharmacology 2011, 21, 655–679. [Google Scholar] [CrossRef] [PubMed]
- International Labour Organization. Workplace Stress: A collective challenge. In World Day for Safety and Health at Work; International Labour Office: Geneva, Switzerland, 2016; pp. 1–57. ISBN 978-92-2-130642-9. [Google Scholar]
- McEwen, B.S. Allostasis and allostatic load: Implications for neuropsychopharmacology. Neuropsychopharmacol. 2000, 22, 108–124. [Google Scholar] [CrossRef]
- McEwen, B.S. Central effects of stress hormones in health and disease: Understanding the protective and damaging effects of stress and stress mediators. Eur. J. Pharmacol. 2008, 583, 174–185. [Google Scholar] [CrossRef] [PubMed]
- Maslach, C.; Schaufeli, W.B.; Leiter, M.P. Job Burnout. Annu. Rev. Psychol. 2001, 52, 397–422. [Google Scholar] [CrossRef] [PubMed]
- Maslach, C.; Jackson, S.E. The measurement of experienced burnout. J. Organ. Behav. 1981, 2, 99–113. [Google Scholar] [CrossRef]
- Maslach, C.; Leiter, M.P. Understanding the burnout experience: Recent research and its implications for psychiatry. World Psychiatry 2016, 15, 103–111. [Google Scholar] [CrossRef] [PubMed]
- Bianchi, R.; Schonfeld, I.S.; Laurent, E. Burnout-depression overlap: A review. Clin. Psychol. Rev. 2015, 36, 28–41. [Google Scholar] [CrossRef] [PubMed]
- Schonfeld, I.S.; Bianchi, R. Burnout and Depression: Two Entities or One? J. Clin. Psychol. 2016, 72, 22–37. [Google Scholar] [CrossRef] [PubMed]
- Hintsa, T.; Elovainio, M.; Jokela, M.; Ahola, K.; Virtanen, M.; Pirkola, S. Is there an independent association between burnout and increased allostatic load? Testing the contribution of psychological distress and depression. J. Health Psychol. 2016, 21, 1576–1586. [Google Scholar] [CrossRef] [PubMed]
- Morse, G.; Salyers, M.P.; Rollins, A.L.; Monroe-DeVita, M.; Pfahler, C. Burnout in mental health services: A review of the problem and its remediation. Adm. Policy Ment. Health 2012, 39, 341–352. [Google Scholar] [CrossRef] [PubMed]
- Heinemann, L.V.; Heinemann, T. Burnout Research: Emergence and scientific investigation of a contested diagnosis. SAGE Open 2017, 1–12. [Google Scholar] [CrossRef]
- McEwen, B.S. Physiology and neurobiology of stress and adaptation: Central role of the brain. Physiol. Rev. 2007, 87, 873–904. [Google Scholar] [CrossRef] [PubMed]
- Goldstein, D.S. Adrenal responses to stress. Cell. Mol. Neurobiol. 2010, 30, 1433–1440. [Google Scholar] [CrossRef] [PubMed]
- McEwen, B.S. Stress, adaptation, and disease. Allostasis and allostatic load. Ann. N. Y. Acad. Sci. 1998, 840, 33–44. [Google Scholar] [CrossRef] [PubMed]
- Bergmann, N.; Gyntelberg, F.; Faber, J. The appraisal of chronic stress and the development of the metabolic syndrome: A systematic review of prospective cohort studies. Endocr. Connect. 2014, 3, R55–R80. [Google Scholar] [CrossRef] [PubMed]
- Björntorp, P.; Rosmond, R. Neuroendocrine abnormalities in visceral obesity. Int. J. Obes. 2000, 24, 80–85. [Google Scholar] [CrossRef]
- Paredes, S.; Ribeiro, L. Cortisol: The villain in metabolic syndrome? Rev. Assoc. Med. Bras. 2014, 60, 84–92. [Google Scholar] [CrossRef] [PubMed]
- Pouwer, F.; Kupper, N.; Adriaanse, M.C. Does emotional stress cause type 2 diabetes mellitus? A review from the European Depression in Diabetes (EDID) Research Consortium. Discov. Med. 2010, 9, 112–118. [Google Scholar] [PubMed]
- Lennartsson, A.K.; Sjörs, A.; Währborg, P.; Ljung, T.; Jonsdottir, I.H. Burnout and hypocortisolism—A matter of severity? A study on ACTH and cortisol responses to acute psychosocial stress. Front. Psychiatry 2015, 6, 1–8. [Google Scholar] [CrossRef] [PubMed]
- Ayada, C.; Toru, Ü.; Korkut, Y. The relationship of stress and blood pressure effectors. Hippokratia 2015, 19, 99–108. [Google Scholar] [PubMed]
- Yau, Y.H.; Potenza, M.N. Stress and eating behaviors. Minerva Endocrinol. 2013, 38, 255–267. [Google Scholar] [PubMed]
- Aschbacher, K.; Kornfeld, S.; Picard, M.; Puterman, E.; Havel, P.J.; Stanhope, K.; Lustig, R.H.; Epel, E. Chronic stress increases vulnerability to diet-related abdominal fat, oxidative stress, and metabolic risk. Psychoneuroendocrinology 2014, 46, 14–22. [Google Scholar] [CrossRef] [PubMed]
- Richard, D.M.; Dawes, M.A.; Mathias, C.W.; Acheson, A.; Hill-Kapturczak, N.; Dougherty, D.M. L-tryptophan: Basic metabolic functions, behavioral research and therapeutic indications. Int. J. Tryptophan Res. 2009, 2, 45–60. [Google Scholar] [CrossRef] [PubMed]
- Ongkees, B.J.; Hommel, B.; Kühn, S.; Colzato, L.S. Effect of tyrosine supplementation on clinical and healthy populations under stress or cognitive demands—A review. J. Psychiatr. Res. 2015, 70, 50–57. [Google Scholar] [CrossRef] [PubMed]
- Ripps, H.; Shen, W. Review: Taurine: A “very essential” amino acid. Mol. Vis. 2012, 18, 2673–2686. [Google Scholar] [PubMed]
- De Luca, A.; Pierno, S.; Camerino, D.C. Taurine: The appeal of a safe amino acid for skeletal muscle disorders. J. Transl. Med. 2015, 13, 1–18. [Google Scholar] [CrossRef] [PubMed]
- Jenkins, T.A.; Nguyen, J.C.; Polglaze, K.E.; Bertrand, P.P. Influence of tryptophan and serotonin on mood and cognition with a possible role of the gut-brain axis. Nutrients 2016, 8, 56. [Google Scholar] [CrossRef] [PubMed]
- Fernstrom, J.D.; Wurtman, R.J. Brain serotonin content: Physiological regulation by plasma neutral amino acids. Science 1972, 178, 414–416. [Google Scholar] [CrossRef] [PubMed]
- Mateos, S.S.; Sánchez, C.L.; Paredes, S.D.; Barriga, C.; Rodríguez, A.B. Circadian levels of serotonin in plasma and brain after oral administration of tryptophan in rats. Basic Clin. Pharmacol. Toxicol. 2009, 104, 52–59. [Google Scholar] [CrossRef] [PubMed]
- Miyake, M.; Kirisako, T.; Kokubo, T.; Miura, Y.; Morishita, K.; Okamura, H.; Tsuda, A. Randomised controlled trial of the effects of l-ornithine on stress markers and sleep quality in healthy workers. Nutr. J. 2014, 13, 1–8. [Google Scholar] [CrossRef] [PubMed]
- Huskisson, E.; Maggini, S.; Ruf, M. The influence of micronutrients on cognitive function and performance. J. Int. Med. Res. 2007, 35, 1–19. [Google Scholar] [CrossRef] [PubMed]
- Kaplan, B.J.; Crawford, S.G.; Field, C.J.; Simpson, J.S. Vitamins, minerals, and mood. Psychol. Bull. 2007, 133, 747–760. [Google Scholar] [CrossRef] [PubMed]
- Kennedy, D.O. B vitamins and the brain: Mechanisms, dose and efficacy—A review. Nutrients 2016, 8, 68. [Google Scholar] [CrossRef] [PubMed]
- Bourre, J.M. Effects of nutrients (in food) on the structure and function of the nervous system: Update on dietary requirements for brain. Part 1: Micronutrients. J. Nutr. Health Aging 2006, 10, 377–385. [Google Scholar] [PubMed]
- Harrison, F.E.; May, J.M. Vitamin C function in the brain: Vital role of the ascorbate transporter SVCT2. Free Radic. Biol. Med. 2009, 46, 719–730. [Google Scholar] [CrossRef] [PubMed]
- Covarrubias-Pinto, A.; Acuña, A.I.; Beltrán, F.A.; Torres-Díaz, L.; Castro, M.A. Old things new view: Ascorbic acid protects the brain in neurodegenerative disorders. Int. J. Mol. Sci. 2015, 16, 28194–28217. [Google Scholar] [CrossRef] [PubMed]
- Szewczyk, B.; Poleszak, E.; Sowa-Kućma, M.; Siwek, M.; Dudek, D.; Ryszewska-Pokraśniewicz, B.; Radziwoń-Zaleska, M.; Opoka, W.; Czekaj, J.; Pilc, A.; et al. Antidepressant activity of zinc and magnesium in view of the current hypotheses of antidepressant action. Pharmacol. Rep. 2008, 60, 588–589. [Google Scholar] [PubMed]
- Long, S.J.; Benton, D. Effects of vitamin and mineral supplementation on stress, mild psychiatric symptoms, and mood in nonclinical samples: A meta-analysis. Psychosom. Med. 2013, 75, 144–153. [Google Scholar] [CrossRef] [PubMed]
- Kocalevent, R.-D.; Levenstein, S.; Fliege, H.; Schmid, G.; Hinz, A.; Brähler, E.; Klapp, B.F. Contribution to the construct validity of the Perceived Stress Questionnaire from a population-based survey. J. Psychosom. Res. 2007, 63, 71–81. [Google Scholar] [CrossRef] [PubMed]
- Levenstein, S.; Prantera, C.; Varvo, V.; Scribano, M.L.; Berto, E.; Luzi, C.; Andreoli, A. Development of the Perceived Stress Questionnaire: A new tool for psychosomatic research. J. Psychosom. Res. 1993, 37, 19–32. [Google Scholar] [CrossRef]
- Schneider, H.; Wall, H.; Zeller, H.J. The psychologiconeurological questionnaire—A screeining method for examinations of ability and control. ZKM 1988, 43, 1321–1322. [Google Scholar]
- Hasson, D.; Arnetz, B.B. Validation and findings comparing VAS vs. Likert Scales for psychosocial measurements. Int. Electron. J. Health Educ. 2005, 8, 178–192. [Google Scholar]
- Fliege, H.; Rose, M.; Arck, P.; Levenstein, S.; Klapp, B.F. Validation of the “Perceived Stress Questionnaire” (PSQ) in a German sample. Diagnostica 2001, 47, 142–152. [Google Scholar] [CrossRef]
- World Health Organization (WHO). Waist Circumference and Waist-Hip Ratio: Report of a WHO Expert Consultation, Geneva, 8–11 December 2008; WHO Document Production Service: Geneva, Switzerland, 2011; pp. 1–39. ISBN 9789241501491. [Google Scholar]
- Pickering, T.G.; Hall, J.E.; Appel, L.J.; Falkner, B.E.; Graves, J.; Hill, M.N.; Jones, D.W.; Kurtz, T.; Sheps, S.G.; Roccella, E.J. Recommendations for blood pressure measurement in humans and experimental animals: Part 1: Blood pressure measurement in humans: A statement for professionals from the Subcommittee of Professional and Public Education of the American Heart Association Council on High Blood Pressure Research. Circulation 2005, 111, 697–716. [Google Scholar] [CrossRef] [PubMed]
- Grundy, S.M.; Cleeman, J.I.; Daniels, S.R.; Donato, K.A.; Eckel, R.H.; Franklin, B.A.; Gordon, D.J.; Krauss, R.M.; Savage, P.J.; Smith, S.C.; et al. Diagnosis and management of the metabolic syndrome: An American Heart Association/National Heart, Lung, and Blood Institute Scientific Statement. Circulation 2005, 112, 2735–2752. [Google Scholar] [CrossRef] [PubMed]
- Kaplan, B.J.; Rucklidge, J.J.; Romijn, A.R.; Dolph, M. A randomised trial of nutrient supplements to minimise psychological stress after a natural disaster. Psychiatry Res. 2015, 228, 373–379. [Google Scholar] [CrossRef] [PubMed]
- Chaborski, K.; Bitterlich, N.; Alteheld, B.; Parsi, E.; Metzner, C. Placebo-controlled dietary intervention of stress-induced neurovegetative disorders with a specific amino acid composition: A pilot-study. Nutr. J. 2015, 14, 1–8. [Google Scholar] [CrossRef] [PubMed]
- Bergdahl, J.; Bergdahl, M. Perceived stress in adults: Prevalence and association of depression, anxiety and medication in a Swedish population. Stress Health 2002, 18, 235–241. [Google Scholar] [CrossRef]
- Fliege, H.; Rose, M.; Arck, P.; Walter, O.B.; Kocalevent, R.-D.; Weber, C.; Klapp, B.F. The Perceived Stress Questionnaire (PSQ) reconsidered: Validation and reference values from different clinical and healthy adult samples. Psychosom. Med. 2005, 67, 78–88. [Google Scholar] [CrossRef] [PubMed]
- Rosenberger, C.; Elsenbruch, S.; Scholle, A.; de Greiff, A.; Schedlowski, M.; Forsting, M.; Gizewski, E.R. Effects of psychological stress on the cerebral processing of visceral stimuli in healthy women. Neurogastroenterol. Motil. 2009, 21, 740-e45. [Google Scholar] [CrossRef] [PubMed]
- Behrendt, I.; Schneider, I.; Schuchardt, J.P.; Bitterlich, N.; Hahn, A. Effect of an herbal extract of Sideritis scardica and B-vitamins on cognitive performance under stress: A pilot study. Int. J. Phytomed. 2016, 8, 95–103. [Google Scholar] [CrossRef]
- Kocalevent, R.D.; Hinz, A.; Brähler, E.; Klapp, B.F. Regional and individual factors of stress experience in Germany: Results of a representative survey with the perceived stress questionnaire (PSQ). Gesundheitswesen 2011, 73, 829–834. [Google Scholar] [CrossRef] [PubMed]
- Lindgren, L.; Bergdahl, J.; Nyberg, L. Longitudinal evidence for smaller hippocampus volume as a vulnerability factor for perceived stress. Cereb. Cortex 2016, 26, 3527–3533. [Google Scholar] [CrossRef] [PubMed]
- Kato, K.; Sullivan, P.F.; Evengård, B.; Pedersen, N.L. Premorbid predictors of chronic fatigue. Arch. Gen. Psychiatry 2006, 63, 1267–1272. [Google Scholar] [CrossRef] [PubMed]
- Montero-Marin, J.; Piva Demarzo, M.M.; Pereira, J.P.; Olea, M.; García-Campayo, J. Reassessment of the psychometric characteristics and factor structure of the ‘Perceived Stress Questionnaire’ (PSQ): Analysis in a sample of dental students. PLoS ONE 2014, 9, e87071. [Google Scholar] [CrossRef] [PubMed] [Green Version]
- Kudielka, B.M.; Hellhammer, D.H.; Wüst, S. Why do we respond so differently? Reviewing determinants of human salivary cortisol responses to challenge. Psychoneuroendocrinology 2009, 34, 2–18. [Google Scholar] [CrossRef] [PubMed]
- Kudielka, B.M.; Bellingrath, S.; Hellhammer, D.H. Cortisol in burnout and vital exhaustion: An overview. G. Ital. Med. Lav. Ergon. 2006, 28, 34–42. [Google Scholar] [PubMed]
- Oosterholt, B.G.; Maes, J.H.; van der Linden, D.; Verbraak, M.J.; Kompier, M.A. Burnout and cortisol: Evidence for a lower cortisol awakening response in both clinical and non-clinical burnout. J. Psychosom. Res. 2015, 78, 445–451. [Google Scholar] [CrossRef] [PubMed]
- Pruessner, J.C.; Hellhammer, D.H.; Kirschbaum, C. Burnout, perceived Stress, and cortisol responses to awakening. Psychosom. Med. 1999, 61, 197–204. [Google Scholar] [CrossRef] [PubMed]
- De Vente, W.; Olff, M.; van Amsterdam, J.G.; Kamphuis, J.H.; Emmelkamp, P.M. Physiological differences between burnout patients and healthy controls: Blood pressure, heart rate, and cortisol responses. Occup. Environ. Med. 2003, 60, i54–i61. [Google Scholar] [CrossRef] [PubMed]
- Kirschbaum, C.; Hellhammer, D.H. Salivary cortisol in psychoneuroendocrine research: Recent developments and applications. Psychoneuroendocrinolgy 1994, 19, 313–333. [Google Scholar] [CrossRef]
- Van Holland, B.J.; Frings-Dresen, M.H.; Sluiter, J.K. Measuring short-term and long-term physiological stress effects by cortisol reactivity in saliva and hair. Int. Arch. Occup. Environ. Health 2012, 85, 849–852. [Google Scholar] [CrossRef] [PubMed]
- Dettenborn, L.; Tietze, A.; Bruckner, F.; Kirschbaum, C. Higher cortisol content in hair among long-term unemployed individuals compared to controls. Psychoneuroendocrinology 2010, 35, 1404–1409. [Google Scholar] [CrossRef] [PubMed]
- Iglesias, S.; Jacobsen, D.; Gonzalez, D.; Azzara, S.; Repetto, E.M.; Jamardo, J.; Gómez, S.G.; Mensch, V.; Berg, G.; Fabre, B. Hair cortisol: A new tool for evaluating stress in programs of stress management. Life Sci. 2015, 141, 188–192. [Google Scholar] [CrossRef] [PubMed]
- Steudte, S.; Stalder, T.; Dettenborn, L.; Klumbies, E.; Foley, P.; Beesdo-Baum, K.; Kirschbaum, C. Decreased hair cortisol concentrations in generalised anxiety disorder. Psychiatry Res. 2011, 186, 310–314. [Google Scholar] [CrossRef] [PubMed]
- Berger, M.; Gray, J.A.; Roth, B.L. The expanded biology of serotonin. Annu. Rev. Med. 2009, 60, 355–366. [Google Scholar] [CrossRef] [PubMed]
- Capello, A.E.; Markus, C.R. Effect of sub chronic tryptophan supplementation on stress-induced cortisol and appetite in subjects differing in 5-HTTLPR genotype and trait neuroticism. Psychoneuroendocrinology 2014, 45, 96–107. [Google Scholar] [CrossRef] [PubMed]
- Spring, B. Recent research on the behavioral effects of tryptophan and carbohydrate. Nutr. Health 1984, 3, 55–67. [Google Scholar] [CrossRef] [PubMed]
- Wurtman, R.J.; Wurtman, J.J.; Regan, M.M.; McDermott, J.M.; Tsay, R.H.; Breu, J.J. Effects of normal meals rich in carbohydrates or proteins on plasma tryptophan and tyrosine ratios. Am. J. Clin. Nutr. 2003, 77, 128–132. [Google Scholar] [CrossRef] [PubMed]
- Fernstrom, J.D.; Fernstrom, M.H. Exercise, serum free tryptophan, and central fatigue. J. Nutr. 2006, 136, 553S–559S. [Google Scholar] [CrossRef] [PubMed]
- Blomstreand, E.; Hassmén, P.; Ekblom, B.; Newsholme, E.A. Administration of branched-chain amino acids during sustained exercise—Effects on performance and on plasma concentration of some amino acids. Eur. J. Appl. Physiol. 1991, 63, 83–88. [Google Scholar] [CrossRef]
- Curzon, G.; Knott, P.J. Effects on plasma and brain tryptophan in the rat of drugs and hormones that influence the concentration of unesterified fatty acid in the plasma. Br. J. Pharmacol. 1974, 50, 197–204. [Google Scholar] [CrossRef] [PubMed]
- Strüder, H.K.; Weicker, H. Physiology and pathophysiology of the serotonergic system and its implications on mental and physical performance. Part I. Int. J. Sports Med. 2001, 22, 467–481. [Google Scholar] [CrossRef] [PubMed]
- Markus, C.R.; Firk, C.; Gerhardt, C.; Kloek, J.; Smolders, G.F. Effect of different tryptophan sources on amino acids availability to the brain and mood in healthy volunteers. Psychopharmacology 2008, 201, 107–114. [Google Scholar] [CrossRef] [PubMed]
- Markus, C.R.; Firk, C. Differential effects of tri-allelic 5-HTTLPR polymorphisms in healthy subjects on mood and stress performance after tryptophan challenge. Neuropsychopharmacology 2009, 34, 2667–2674. [Google Scholar] [CrossRef] [PubMed]
- Pietraszek, M.H.; Takada, Y.; Yan, D.; Urano, T.; Serizawa, K.; Takada, A. Relationship between serotonergic measures in periphery and the brain of mouse. Life Sci. 1992, 51, 75–82. [Google Scholar] [CrossRef]
- Gao, H.Q.; Zhu, H.Y.; Zhang, Y.Q.; Wang, L.X. Reduction of cerebrospinal fluid and plasma serotonin in patients with post-stroke depression: A preliminary report. Clin. Investig. Med. 2008, 31, E351–E356. [Google Scholar] [CrossRef]
- Becquet, D.; Hery, M.; Francois-Bellan, A.M.; Giraud, P.; Deprez, P.; Faudon, M.; Fache, M.P.; Hery, F. Glutamate, GABA, glycine and taurine modulate serotonin synthesis and release in rostral and caudal rhombencephalic raphe cells in primary cultures. Neurochem. Int. 1993, 23, 269–283. [Google Scholar] [CrossRef]
- Xu, Y.J.; Arneja, A.S.; Tappia, P.S.; Dhalla, N.S. The potential health benefits of taurine in cardiovascular disease. Exp. Clin. Cardiol. 2008, 13, 57–65. [Google Scholar] [PubMed]
- Imae, M.; Asano, T.; Murakami, S. Potential role of taurine in the prevention of diabetes and metabolic syndrome. Amino Acids 2014, 46, 81–88. [Google Scholar] [CrossRef] [PubMed]
- Vente, J.P.; von Meyenfeldt, M.F.; van Eijk, H.M.; van Berlo, C.L.; Gouma, D.J.; van der Linden, C.J.; Soeters, P.B. Plasma-amino acid profiles in sepsis and stress. Ann. Surg. 1989, 209, 57–62. [Google Scholar] [CrossRef] [PubMed]
- Laugero, K.D.; Falcon, L.M.; Tucker, K.L. Relationship between perceived stress and dietary and activity patterns in older adults participating in the Boston Puerto Rican Health Study. Appetite 2011, 56, 194–204. [Google Scholar] [CrossRef] [PubMed]
- Tsenkova, V.; Boylan, J.M.; Ryff, C. Stress eating and health. Findings from MIDUS, a national study of US adults. Appetite 2013, 69, 151–155. [Google Scholar] [CrossRef] [PubMed]
- Adam, T.C.; Epel, E.S. Stress, eating and the reward system. Physiol. Behav. 2007, 91, 449–458. [Google Scholar] [CrossRef] [PubMed]
- Tomiyama, A.J.; Schamarek, I.; Lustig, R.H.; Kirschbaum, C.; Puterman, E.; Havel, P.J.; Epel, E.S. Leptin concentrations in response to acute stress predict subsequent intake of comfort foods. Physiol. Behav. 2012, 107, 34–39. [Google Scholar] [CrossRef] [PubMed]
- Rohleder, N. Stimulation of systemic low-grade inflammation by psychosocial stress. Psychosom. Med. 2014, 76, 181–189. [Google Scholar] [CrossRef] [PubMed]
- Esler, M. Mental stress and human cardiovascular disease. Neurosci. Biobehav. Rev. 2017, 74, 269–276. [Google Scholar] [CrossRef] [PubMed]
- Marshall, G.D. The adverse effects of psychological stress on immunoregulatory balance: Applications to human inflammatory diseases. Immunol. Allergy Clin. North Am. 2011, 31, 133–140. [Google Scholar] [CrossRef] [PubMed]
- Russ, T.C.; Stamatakis, E.; Hamer, M.; Starr, J.M.; Kivimäki, M.; Batty, G.D. Association between psychological distress and mortality: Individual participant pooled analysis of 10 prospective cohort studies. BMJ 2012, 345, e4933. [Google Scholar] [CrossRef] [PubMed] [Green Version]
- Zhang, D.; Wang, W.; Li, F. Association between resting heart rate and coronary artery disease, stroke, sudden death and noncardiovascular diseases: A meta-analysis. CMAJ 2016, 188, E384–E392. [Google Scholar] [CrossRef] [PubMed]
- Chandola, T.; Brunner, E.; Marmot, M. Chronic stress at work and the metabolic syndrome: Prospective study. BMJ 2006, 332, 521–525. [Google Scholar] [CrossRef] [PubMed]
- Pyykkönen, A.J.; Räikkönen, K.; Tuomi, T.; Eriksson, J.G.; Groop, L.; Isomaa, B. Stressful life events and the metabolic syndrome: The prevalence, prediction and prevention of diabetes (PPP)-Botnia Study. Diabetes Care 2010, 33, 378–384. [Google Scholar] [CrossRef] [PubMed]
- Parletta, N.; Milte, C.M.; Meyer, B.J. Nutritional modulation of cognitive function and mental health. J. Nutr. Biochem. 2013, 24, 725–743. [Google Scholar] [CrossRef] [PubMed]
- De Brito, N.J.; Rocha, É.D.; de Araújo Silva, A.; Costa, J.B.; França, M.C.; das Graças Almeida, M.; Brandão-Neto, J. Oral zinc supplementation decreases the serum iron concentration in healthy schoolchildren: A pilot study. Nutrients 2014, 6, 3460–3473. [Google Scholar] [CrossRef] [PubMed]
- Donangelo, C.M.; Woodhouse, L.R.; Kind, S.M.; Viteri, F.E.; King, J.C. Supplemental zinc lowers measures of iron status in young women with low iron reserves. J. Nutr. 2002, 132, 1860–1864. [Google Scholar] [CrossRef] [PubMed]
- Herman, S.; Griffin, I.J.; Suwarti, S.; Ernawati, F.; Permaesih, D.; Pambudi, D.; Abrams, S.A. Cofortification of iron-fortified flour with zinc sulfate, but not zinc oxide, decreases iron absorption in Indonesian children. Am. J. Clin. Nutr. 2002, 76, 813–817. [Google Scholar] [CrossRef] [PubMed]
- Abbaspour, N.; Hurrell, R.; Kelishadi, R. Review on iron and its importance for human health. J. Res. Med. Sci. 2014, 19, 164–174. [Google Scholar] [PubMed]


| Verum | Placebo | |
|---|---|---|
| Energy | 114 kJ/27 kcal | 15 kJ/3 kcal |
| Protein | 4.2 g | >0.0 g |
| Carbohydrates (sugar) | 0.529 g (0.0 g) | 0.344 g (0.0 g) |
| Fat | 0.0 g | >0.0 g |
| Dietary fibers | 0.002 g | 0.001 g |
| Amino acids | ||
| Taurine | 1000 mg | - |
| l-ornithine | 2000 mg | - |
| l-phenylalanine | 200 mg | - |
| l-tyrosine | 1000 mg | - |
| Vitamins | ||
| Vitamin C | 300 mg | - |
| Vitamin B1 | 25 mg | - |
| Vitamin B2 | 25 mg | - |
| Vitamin B6 | 25 mg | - |
| Vitamin B12 | 50 µg | - |
| Niacin | 100 mg | - |
| Pantothenic acid | 100 mg | - |
| Folic acid | 800 µg | - |
| ß-carotene 1 | 0.8 mg | 1 mg |
| Minerals | ||
| Magnesium | 300 mg | - |
| Zinc | 15 mg | - |
| Selenium | 100 µg | - |
| Chrome | 50 µg | - |
| Molybdenum | 50 µg | - |
| Further ingredients | citric acid; maltodextrin; aroma; acesulfame K; silicic acid | erythritol; citric acid; maltodextrin; aroma; acesulfame K; silicic acid |
| Verum Group (n = 29) 1 | Placebo Group (n = 30) 1 | V vs. P | |
|---|---|---|---|
| Mean ± SD; n (%) | Mean ± SD; n (%) | p-Value | |
| Women | 21 (72.4%) | 20 (66.7%) | 0.779 |
| Men | 8 (27.6%) | 10 (33.3%) | |
| Age (years) | 43.6 ± 12.6 | 45.0 ± 11.9 | 0.693 |
| Smokers | 7 (24.1%) | 8 (26.7%) | 1.000 |
| Anthropometric, clinical, and cardiometabolic parameters | |||
| Height (cm) | 170.5 ± 8.7 | 170.4 ± 9.6 | 0.795 |
| Weight (kg) | 73.3 ± 13.3 | 76.2 ± 21.4 | 0.913 |
| BMI (kg/m2) | 25.2 ± 4.4 | 25.9 ± 5.8 | 0.982 |
| BMI 25–< 30 kg/m² | 10 (34.5%) | 7 (23.3%) | 0.399 |
| BMI ≥ 30 kg/m² | 4 (13.8%) | 7 (23.3%) | 0.506 |
| WC (cm; women) | 87.9 ± 13.5 | 85.2 ± 11.7 | 0.473 |
| WC ≥ 88 cm (women) | 11 (52.4%) | 8 (40%) | 0.536 |
| WC (cm; men) | 96.4 ± 6.6 | 106.0 ± 16.4 | 0.051 |
| WC ≥ 102 cm (men) | 2 (25%) | 6 (60%) | 0.188 |
| BP systolic (mmHg) | 113.7 ± 12.6 | 111.2 ± 15.8 | 0.352 |
| BP diastolic (mmHg) | 75.1 ± 8.2 | 75.7 ± 9.0 | 0.704 |
| BP ≥ 130/85 mmHg | 6 (20.7%) | 5 (16.7%) | 0.748 |
| Resting heart rate (1/min) | 66.7 ± 9.0 | 66.5 ± 8.4 | 0.877 |
| TC (mg/dL) | 209.9 ± 51.7 | 213.1 ± 43.2 | 0.606 |
| HDL-C (mg/dL) | 64.3 ± 18.6 | 64.4 ± 21.7 | 0.789 |
| LDL-C (mg/dL) | 130.1 ± 48.0 | 137.2 ± 35.1 | 0.356 |
| TG (mg/dL) | 109.2 ± 64.9 | 92.7 ± 41.8 | 0.427 |
| FPG (mg/dL) | 88.1 ± 9.3 | 91.4 ± 22.6 | 0.979 |
| HbA1c (%) | 5.41 ± 0.29 | 5.63 ± 0.75 | 0.380 |
| HOMA-index | 1.50 ± 0.84 | 1.96 ± 2.04 | 0.574 |
| Insulin-ECLIA (μU/mL) | 6.75 ± 3.54 | 7.83 ± 4.90 | 0.496 |
| CRP sensitive (mg/L) | 2.86 ± 3.89 | 1.65 ± 2.97 | 0.061 |
| Serum serotonin and salivary cortisol | |||
| Serum serotonin (μg/L) | 137.7 ± 58.0 | 150.1 ± 80.9 | 0.554 |
| Cortisol_morning (ng/mL) | 12.54 ± 6.61 | 14.62 ± 4.55 | 0.118 |
| Cortisol > 10 ng/mL (m) | 20 (69.0%) | 25 (83.3%) | 0.233 |
| Cortisol_evening (ng/mL) | 3.00 ± 4.90 | 2.04 ± 2.49 | 0.313 |
| Cortisol > 2 ng/mL (e) | 11 (37.9%) | 7 (23.3%) | 0.267 |
| Δ cortisol (m − e) (ng/mL) | 9.54 ± 6.37 | 12.57 ± 5.35 | 0.037 |
| PSQ30 and PNF | |||
| Total PSQ30 score | 0.674 ± 0.124 | 0.664 ± 0.116 | 0.836 |
| Total PNF (points) | 53.7 ± 13.2 | 48.3 ± 10.4 | 0.104 |
| Impulsion (points) | 11.8 ± 3.7 | 9.8 ± 3.3 | 0.016 |
| Serum amino acids | |||
| l-ornithine (µmol/L) | 106.7 ± 33.0 | 100.3 ± 21.3 | 0.766 |
| l-phenylalanine (µmol/L) | 95.6 ± 19.8 | 99.6 ± 13.2 | 0.467 |
| Taurine (µmol/L) | 157.0 ± 35.5 | 154.6 ± 27.4 | 0.913 |
| l-Trp (µmol/L) | 53.0 ± 14.8 | 54.9 ± 9.4 | 0.213 |
| l-tyrosine (µmol/L) | 67.5 ± 17.4 | 70.4 ± 13.1 | 0.375 |
| l-Trp/CAA | 0.087 ± 0.033 | 0.086 ± 0.013 | 0.456 |
| l-Trp/BCAA | 0.117 ± 0.040 | 0.118 ± 0.021 | 0.429 |
| Verum Group (n = 29) 1 | Placebo Group (n = 30) 1 | V vs. P | ||||||||||
|---|---|---|---|---|---|---|---|---|---|---|---|---|
| Mean ± SD | Mean ± SD | p-Value b | ||||||||||
| Baseline | Week 8 | Week 12 | Difference 8 Weeks | Difference 12 Weeks | Baseline | Week 8 | Week 12 | Difference 8 Weeks | Difference 12 Weeks | 8 Weeks | 12 Weeks | |
| Total PSQ30 score | 0.674 ± 0.124 | 0.543 ± 0.160 | 0.482 ± 0.163 | −0.131 ± 0.143 ** | −0.192 ± 0.161 ** | 0.664 ± 0.116 | 0.607 ± 0.127 | 0.581 ± 0.163 | −0.057 ± 0.115 * | −0.083 ± 0.121 ** | 0.092 | 0.012 |
| Harassment | 2.8 ± 0.5 | 2.4 ± 0.5 | 2.2 ± 0.6 | −0.4 ± 0.6 * | −0.6 ± 0.7 ** | 2.8 ± 0.5 | 2.6 ± 0.6 | 2.5 ± 0.6 | −0.2 ± 0.6 | −0.3 ± 0.6 * | 0.370 | 0.067 |
| Overload | 3.1 ± 0.5 | 2.7 ± 0.6 | 2.6 ± 0.7 | −0.4 ± 0.4 ** | −0.5 ± 0.5 ** | 3.1 ± 0.5 | 3.0 ± 0.5 | 2.9 ± 0.7 | −0.1 ± 0.5 | −0.2 ± 0.5 * | 0.046 | 0.014 |
| Irritability | 3.0 ± 0.6 | 2.7 ± 0.7 | 2.4 ± 0.6 | −0.3 ± 0.7 * | −0.6 ± 0.7 ** | 2.8 ± 0.6 | 2.8 ± 0.6 | 2.6 ± 0.6 | −0.0 ± 0.6 | −0.2 ± 0.6 * | 0.143 | 0.030 |
| Lack of joy | 3.0 ± 0.4 | 2.7 ± 0.5 | 2.6 ± 0.4 | −0.3 ± 0.5 * | −0.4 ± 0.4 ** | 3.0 ± 0.5 | 2.9 ± 0.4 | 2.9 ± 0.6 | −0.1 ± 0.3 | −0.1 ± 0.4 * | 0.199 | 0.006 |
| Fatigue | 3.3 ± 0.4 | 2.9 ± 0.6 | 2.7 ± 0.5 | −0.4 ± 0.7 * | −0.6 ± 0.6 ** | 3.3 ± 0.4 | 3.0 ± 0.5 | 3.0 ± 0.5 | −0.2 ± 0.4* | −0.3 ± 0.5 * | 0.339 | 0.034 |
| Worries | 2.8 ± 0.6 | 2.3 ± 0.7 | 2.2 ± 0.6 | −0.5 ± 0.5 ** | −0.6 ± 0.6 ** | 2.8 ± 0.4 | 2.6 ± 0.4 | 2.5 ± 0.6 | −0.2 ± 0.4* | −0.4 ± 0.5 ** | 0.121 | 0.140 |
| Tension | 3.1 ± 0.4 | 2.6 ± 0.6 | 2.4 ± 0.7 | −0.5 ± 0.5 ** | −0.7 ± 0.6 ** | 3.0 ± 0.5 | 2.8 ± 0.6 | 2.7 ± 0.6 | −0.2 ± 0.6 | −0.3 ± 0.6 * | 0.077 | 0.012 |
| Total PNF points | 53.7 ± 13.2 | a | 39.3 ± 14.4 | - | −14.3 ± 11.8 ** | 48.3 ± 10.4 | a | 41.3 ± 14.6 | - | −7.0 ± 12.5 * | - | 0.063 |
| Psycho-neurovegetative stability | 19.0 ± 5.2 | a | 13.3 ± 4.7 | - | −5.7 ± 4.7 ** | 17.9 ± 4.4 | a | 14.6 ± 5.2 | - | −3.3 ± 5.2 * | - | 0.136 |
| Neurological symptoms | 7.2 ± 3.7 | a | 4.6 ± 2.9 | - | −2.6 ± 2.5 ** | 6.3 ± 3.5 | a | 4.8 ± 3.4 | - | −1.5 ± 3.2 * | - | 0.246 |
| Impulsion | 11.8 ± 3.7 | a | 8.4 ± 4.5 | - | −3.4 ± 3.6 ** | 9.8 ± 3.3 | a | 9.1 ± 4.1 | - | −0.7 ± 3.4 | - | 0.010 |
| Excitability | 5.7 ± 2.9 | a | 4.5 ± 2.9 | - | −1.2 ± 2.2 * | 4.9 ± 2.0 | a | 4.3 ± 2.4 | - | −0.6 ± 2.0 | - | 0.334 |
| Concentration and memory | 9.9 ± 3.7 | a | 8.5 ± 3.9 | - | −1.4 ± 3.0 * | 9.4 ± 2.9 | a | 8.5 ± 3.2 | - | −0.9 ± 2.9 | - | 0.507 |
| Total VAS points | 15.9 ± 3.6 | 14.1 ± 3.7 | 12.7 ± 4.4 | −1.8 ± 3.9 | −3.3 ± 4.2 ** | 15.3 ± 3.6 | 15.0 ± 3.8 | 14.5 ± 4.3 | −0.3 ± 4.6 | −0.8 ± 5.5 | 0.284 | 0.178 |
| Lack of motivation | 3.1 ± 1.0 | 2.7 ± 0.8 | 2.4 ± 1.1 | −0.4 ± 1.1 | −0.7 ± 1.1 * | 3.2 ± 0.9 | 2.9 ± 1.0 | 2.9 ± 1.0 | −0.3 ± 1.2 | −0.4 ± 1.3 | 0.671 | 0.558 |
| Indifference | 3.0 ± 1.0 | 2.4 ± 1.1 | 2.2 ± 1.0 | −0.5 ± 1.3 * | −0.8 ± 1.1 * | 2.8 ± 1.0 | 2.8 ± 1.0 | 2.5 ± 1.1 | −0.0 ± 1.2 | −0.3 ± 1.5 | 0.155 | 0.235 |
| Fatigue | 3.4 ± 1.1 | 3.1 ± 1.1 | 2.8 ± 1.2 | −0.3 ± 1.3 | −0.6 ± 1.3 * | 3.5 ± 1.0 | 3.4 ± 1.1 | 3.5 ± 1.0 | −0.1 ± 1.4 | 0.0 ± 1.3 | 0.728 | 0.096 |
| Mood changes | 3.2 ± 0.9 | 2.9 ± 1.0 | 2.7 ± 1.0 | −0.3 ± 1.1 | −0.5 ± 1.1 * | 2.8 ± 1.0 | 2.9 ± 1.1 | 2.6 ± 1.1 | 0.1 ± 1.2 | −0.2 ± 1.5 | 0.250 | 0.389 |
| Productivity | 3.1 ± 1.1 | 2.9 ± 0.8 | 2.5 ± 1.0 | −0.2 ± 0.9 | −0.6 ± 1.1 * | 2.9 ± 0.9 | 3.0 ± 1.0 | 3.0 ± 0.9 | 0.1 ± 1.2 | 0.0 ± 1.2 | 0.364 | 0.040 |
| Verum Group (n = 29) 1 | Placebo Group (n = 30) 1 | V vs. P | |||||
|---|---|---|---|---|---|---|---|
| Mean ± SD | Mean ± SD | p-Value a | |||||
| Baseline | Week 12 | Difference | Baseline | Week 12 | Difference | 12 Weeks | |
| Salivary | |||||||
| Cortisol_morning (ng/mL) | 12.54 ± 6.61 | 13.96 ± 5.76 | 1.42 ± 8.17 | 14.62 ± 4.55 | 15.08 ± 6.64 | 0.47 ± 5.78 | 0.596 |
| Cortisol_evening (ng/mL) | 3.00 ± 4.90 | 2.07 ± 1.80 | −0.93 ± 5.0 | 2.04 ± 2.49 | 2.59 ± 3.60 | 0.55 ± 4.10 | 0.495 |
| Δ cortisol (m − e) (ng/mL) | 9.54 ± 6.37 | 11.89 ± 6.05 | 2.34 ± 7.32 | 12.57 ± 5.35 | 12.49 ± 7.98 | −0.08 ± 7.60 | 0.300 |
| Serum | |||||||
| Protein (g/dL) † | 7.15 ± 0.34 | 7.16 ± 0.40 | 0.01 ± 0.36 | 7.41 ± 0.43 | 7.24 ± 0.44 | −0.17 ± 0.38 * | 0.075 |
| l-arginine (µmol/L) † | 115.9 ± 27.9 | 122.7 ± 25.4 | 6.8 ± 19.4 | 132.7 ± 22.8 | 126.3 ± 19.5 | −6.4 ± 23.1 | 0.014 |
| l-ornithine (µmol/L) | 106.7 ± 33.0 | 108.4 ± 67.4 | 1.8 ± 52.0 | 100.3 ± 21.3 | 100.4 ± 32.5 | 0.1 ± 22.5 | 0.590 |
| l-phenylalanine (µmol/L) | 95.6 ± 19.8 | 97.5 ± 14.5 | 1.9 ± 17.9 | 99.6 ± 13.2 | 94.9 ± 15.9 | −4.6 ± 15.7 | 0.090 |
| Taurine (µmol/L) | 157.0 ± 35.5 | 175.3 ± 49.5 | 18.3 ± 38.2 * | 154.6 ± 27.4 | 151.4 ± 43.6 | −3.2 ± 40.1 | 0.027 |
| l-Trp (µmol/L) | 53.0 ± 14.8 | 53.1 ± 9.3 | 0.1 ± 14.9 | 54.9 ± 9.4 | 54.6 ± 9.8 | −0.3 ± 7.8 | 0.197 |
| l-tyrosine (µmol/L) | 67.5 ± 17.4 | 71.4 ± 21.9 | 3.9 ± 18.6 | 70.4 ± 13.1 | 69.2 ± 14.7 | −1.2 ± 19.3 | 0.102 |
| l-Trp/CAA | 0.087 ± 0.033 | 0.088 ± 0.015 | 0.001 ± 0.033 * | 0.086 ± 0.013 | 0.087 ± 0.015 | 0.001 ± 0.014 | 0.181 |
| l-Trp/BCAA | 0.117 ± 0.040 | 0.122 ± 0.021 | 0.005 ± 0.039 * | 0.118 ± 0.021 | 0.118 ± 0.022 | 0.000 ± 0.021 | 0.088 |
| Serotonin (μg/L) | 137.7 ± 58.0 | 138.7 ± 57.3 | 1.0 ± 20.9 | 150.1 ± 80.9 | 140.5 ± 99.8 | −9.6 ± 32.4 * | 0.047 |
| Folic acid (ng/mL) b | 9.67 ± 4.13 | 18.18 ± 2.84 | 8.51 ± 4.38 ** | 9.48 ± 3.08 | 8.93 ± 3.71 | −0.55 ± 2.48 | < 0.001 |
| Magnesium (mmol/L) | 0.87 ± 0.06 | 0.87 ± 0.05 | −0.00 ± 0.04 | 0.89 ± 0.06 | 0.86 ± 0.06 | −0.03 ± 0.05 * | 0.021 |
| Calcium (mmol/L) | 2.38 ± 0.08 | 2.37 ± 0.09 | −0.01 ± 0.10 | 2.40 ± 0.12 | 2.37 ± 0.10 | −0.03 ± 0.10 * | 0.413 |
| Urine | |||||||
| Magnesium (mmol/24 h) | 3.83 ± 1.41 | 5.67 ± 1.49 | 1.84 ± 1.56 ** | 3.63 ± 1.27 | 3.84 ± 1.61 | 0.21 ± 1.22 | < 0.001 |
| Calcium (mmol/24 h) | 4.88 ± 2.36 | 5.60 ± 3.19 | 0.71 ± 2.58 * | 4.58 ± 3.26 | 4.32 ± 2.93 | −0.26 ± 1.56 | 0.023 |
| Sodium (mmol/24 h) | 166.9 ± 66.3 | 142 ± 58.1 | −24.9 ± 65.9 * | 157.4 ± 75.7 | 172.0 ± 84.5 | 14.7 ± 82.9 | 0.025 |
| Chloride (mmol/24 h) | 151.9 ± 60.8 | 140.6 ± 56.1 | −11.3 ± 59.1 | 134.3 ± 66.4 | 148.5 ± 76.6 | 14.2 ± 70.3 | 0.145 |
| pH value | 6.22 ± 0.42 | 6.06 ± 0.43 | −0.16 ± 0.48 | 6.16 ± 0.35 | 6.26 ± 0.42 | 0.10 ± 0.44 | 0.028 |
| Creatinine (g/24h) | 1.46 ± 0.53 | 1.37 ± 0.44 | −0.09 ± 0.34 | 1.37 ± 0.52 | 1.33 ± 0.53 | −0.04 ± 0.30 | 0.949 |
| Volume (L/24h) | 2.14 ± 0.69 | 2.12 ± 0.73 | −0.02 ± 0.80 | 2.13 ± 0.96 | 2.10 ± 0.85 | −0.03 ± 0.69 | 0.871 |
| Verum Group (n = 29) 1 | Placebo Group (n = 30) 1 | V vs. P | |||||
|---|---|---|---|---|---|---|---|
| Mean ± SD; n (%) | Mean ± SD; n (%) | p-Value a | |||||
| Baseline | Week 12 | Difference | Baseline | Week 12 | Difference | 12 Weeks | |
| Weight (kg) | 73.3 ± 13.3 | 73.5 ± 13.3 | 0.2 ± 1.2 | 76.2 ± 21.4 | 77.1 ± 22.4 | 0.9 ± 2.0* | 0.292 |
| Body mass index (BMI, kg/m²) | 25.2 ± 4.4 | 25.3 ± 4.3 | 0.1 ± 0.4 | 25.9 ± 5.8 | 26.2 ± 6.1 | 0.3 ± 0.6* | 0.253 |
| Waist circumference (WC, cm) | 90.2 ± 12.5 | 90.3 ± 12.4 | 0.1 ± 1.3 | 92.1 ± 16.5 | 92.8 ± 16.6 | 0.7 ± 1.8* | 0.133 |
| Waist-to-height ratio (WHtR) | 0.530 ± 0.077 | 0.531 ± 0.076 | 0.001 ± 0.007 | 0.540 ± 0.085 | 0.543 ± 0.085 | 0.004 ± 0.011* | 0.120 |
| Systolic blood pressure (mmHg) | 113.7 ± 12.6 | 111.0 ± 11.3 | −2.7 ± 7.2 * | 111.2 ± 15.8 | 108.6 ± 14.9 | −2.5 ± 7.3* | 0.871 |
| Diastolic blood pressure (mmHg) | 75.1 ± 8.2 | 73.8 ± 6.9 | −1.3 ± 5.1 | 75.7 ± 9.0 | 74.5 ± 8.5 | −1.2 ± 4.7 | 0.973 |
| Resting heart rate (1/min) | 66.7 ± 9.0 | 65.3 ± 7.4 | −1.4 ± 6.8 | 66.5 ± 8.4 | 67.4 ± 10.0 | 1.0 ± 9.0 | 0.495 |
| Resting heart rate (female; V: n = 21, P: n = 20) | 67.8 ± 9.1 | 67.3 ± 6.9 | −0.5 ± 7.2 | 66.2 ± 8.4 | 65.2 ± 8.6 | −1.0 ± 8.4 | 0.412 |
| Resting heart rate (male; V: n = 8, P: n = 10) | 64.0 ± 8.8 | 60.2 ± 6.5 | −3.8 ± 5.0 | 67.0 ± 8.9 | 71.9 ± 11.6 | 4.9 ± 9.3 | 0.011 |
| Pulse pressure (mmHg) | 38.6 ± 7.2 | 37.2 ± 6.1 | −1.4 ± 5.1 | 35.5 ± 9.2 | 34.2 ± 8.7 | −1.3 ± 5.8 | 0.919 |
| Total cholesterol (TC, mg/dL) | 209.9 ± 51.7 | 206.4 ± 47.3 | −3.4 ± 20.6 | 213.1 ± 43.2 | 210.9 ± 45.7 | −2.2 ± 25.7 | 0.931 |
| HDL-C (mg/dL) | 64.3 ± 18.6 | 65.8 ± 19.0 | 1.6 ± 7.2 | 64.4 ± 21.7 | 63.8 ± 23.4 | −0.6 ± 8.0 | 0.203 |
| LDL-C (mg/dL) | 130.1 ± 48.0 | 125.9 ± 43.4 | −4.2 ± 18.6 | 137.2 ± 35.1 | 132.6 ± 35.8 | −4.6 ± 21.8 | 0.961 |
| Triglycerides (TG, mg/dL) | 109.2 ± 64.9 | 109.7 ± 63.7 | 0.5 ± 35.5 | 92.7 ± 41.8 | 110.7 ± 92.2 | 18.0 ± 75.6 | 0.606 |
| Fasting plasma glucose (FPG, mg/dL) | 88.1 ± 9.3 | 86.2 ± 7.2 | −1.8 ± 6.2 | 91.4 ± 22.6 | 94.5 ± 35.0 | 3.1 ± 15.5 | 0.295 |
| HbA1c (glycated hemoglobin A1c, %) | 5.41 ± 0.29 | 5.41 ± 0.24 | 0.00 ± 0.30 | 5.63 ± 0.75 | 5.62 ± 0.94 | −0.01 ± 0.29 | 0.841 |
| HOMA-index | 1.50 ± 0.84 | 1.50 ± 1.05 | 0.01 ± 0.91 | 1.96 ± 2.04 | 2.83 ± 4.89 | 0.87 ± 3.47 | 0.859 |
| Insulin-ECLIA (µU/mL) | 6.75 ± 3.54 | 7.02 ± 4.71 | 0.27 ± 4.06 | 7.83 ± 4.90 | 10.00 ± 13.71 | 2.17 ± 11.49 | 0.839 |
| C-reactive protein sensitive (CRP, mg/L) | 2.86 ± 3.89 | 2.23 ± 3.23 | −0.62 ± 3.46 | 1.65 ± 2.97 | 1.85 ± 2.46 | 0.21 ± 3.48 | 0.312 |
| Ferritin (ng/mL) | 99.2 ± 68.5 | 80.9 ± 81.2 | −18.3 ± 23.4 ** | 129.1 ± 135.5 | 145.8 ± 182.0 | 16.7 ± 107.0 | 0.011 |
| Gamma-glutamyltransferase (GGT, U/L) | 21.7 ± 14.8 | 23.7 ± 20.2 | 1.9 ± 13.0 | 22.8 ± 12.2 | 24.4 ± 20.9 | 1.6 ± 18.1 | 0.088 |
| Aspartate aminotransferase (ASAT, U/L) | 27.0 ± 17.6 | 26.3 ± 5.9 | −0.8 ± 14.7 | 23.5 ± 4.7 | 35.5 ± 66.0 | 12.0 ± 66.3 | 0.126 |
| Alanine aminotransferase (ALAT, U/L) | 23.9 ± 12.4 | 27.3 ± 15.4 | 3.4 ± 8.1 * | 23.3 ± 12.1 | 52.7 ± 162.5 | 29.4 ± 163.4 | 0.047 |
| GFR (CKD-EPI) (mL/min) | 96.2 ± 16.3 | 97.3 ± 15.0 | 1.1 ± 5.8 | 95.8 ± 13.1 | 97.7 ± 14.2 | 1.8 ± 8.0 | 0.830 |
| Fasting plasma glucose (FPG) ≥ 100 mg/dL | 3 (10.3%) | 2 (6.9%) | −1 (−33%) | 4 (13.3%) | 7 (23.3%) | 3 (75%) | 0.343 |
| Metabolic syndrome | 3 (10.3%) | 2 (6.9%) | −1 (−33%) | 3 (10%) | 6 (20%) | 3 (100%) | 0.531 |
© 2018 by the authors. Licensee MDPI, Basel, Switzerland. This article is an open access article distributed under the terms and conditions of the Creative Commons Attribution (CC BY) license (http://creativecommons.org/licenses/by/4.0/).
Share and Cite
Armborst, D.; Metzner, C.; Alteheld, B.; Bitterlich, N.; Rösler, D.; Siener, R. Impact of a Specific Amino Acid Composition with Micronutrients on Well-Being in Subjects with Chronic Psychological Stress and Exhaustion Conditions: A Pilot Study. Nutrients 2018, 10, 551. https://doi.org/10.3390/nu10050551
Armborst D, Metzner C, Alteheld B, Bitterlich N, Rösler D, Siener R. Impact of a Specific Amino Acid Composition with Micronutrients on Well-Being in Subjects with Chronic Psychological Stress and Exhaustion Conditions: A Pilot Study. Nutrients. 2018; 10(5):551. https://doi.org/10.3390/nu10050551
Chicago/Turabian StyleArmborst, Deborah, Christine Metzner, Birgit Alteheld, Norman Bitterlich, Daniela Rösler, and Roswitha Siener. 2018. "Impact of a Specific Amino Acid Composition with Micronutrients on Well-Being in Subjects with Chronic Psychological Stress and Exhaustion Conditions: A Pilot Study" Nutrients 10, no. 5: 551. https://doi.org/10.3390/nu10050551