Abstract
Controversy exists on whether animal and plant proteins influence obesity differently. The purpose of this study was to evaluate the association between total, animal, and plant protein intake with the body mass index (BMI), waist circumference (WC), and renal function in the Korean elderly. Study participants included Korean adults aged 60 years or older from the Korean National Health and Nutrition Examination Survey in 2013–2014. Height, weight, and waist circumference were measured and the body mass index was calculated. One-day 24-hour recall data were used to estimate daily total, animal, and plant protein intake. Glomerular filtration rate (GFR) was calculated by using the Modification of Diet in Renal Disease (MDRD) equation. General linear modellings were used to assess the relationships between protein intake, BMI and WC. The mean age was 69.2 ± 0.2 years and 44.2% were male. The total daily protein intake was 1.1 ± 0.02 g/kg/day and 0.9 ± 0.02 g/kg/day for males and females, respectively. Only one third of protein intake was from animal sources. In males, BMI (regression coefficient (95% CI); −1.30 (−1.55, −1.06), p < 0.001; −0.29 (−0.52, −0.05), p = 0.016; −1.30 (−1.8, −1.02), p < 0.001, respectively) and WC (−3.87 (−4.58, −3.16), p < 0.001; −0.90 (−1.58, −0.22), p = 0.010; −3.88 (−4.68, −3.08), p < 0.001, respectively) decreased as daily intake of plant protein (g/kg/day), animal protein (g/kg/day) and total protein (g/kg/day) increased. Similar associations were shown in Korean females. GFR was not associated with protein intake regardless of protein source in both sexes. In Korean adults aged 60 years or older, the protein intake was associated with a favorable obesity index without decrease in renal function. The effect was similar in both males and females, with both animal and plant proteins.
1. Introduction
Overweight and obesity are rising in Korea [1]. In particular, the prevalence of obesity among people aged 70 and over rose sharply from 31.5% in 2005 to 37.4% in 2015 [2]. Obesity not only increases the risk of metabolic diseases, but also increases the all-cause mortality rate in the elderly population [3,4]. Therefore, measures to contain the epidemic of obesity in the elderly population are needed.
The association between obesity and protein intake has become the topic of interest. Observational studies in the US have reported that protein intake above the Recommended Daily Allowance (RDA) reduces body weight and waist circumference (WC) [5], and improves body composition [6]. In addition, a longitudinal study of the elderly showed that the increase in protein intake decreases the risk of sarcopenia and obesity [7]. These associations were observed across all age groups.
Whether the effect of protein on obesity depends on the protein source, i.e., plant versus animal source, is unclear. A study done in the United States showed that the increased consumption of both plant and animal protein improved body mass index (BMI) and WC [8]. However, Belgian research showed that only plant protein significantly improved the obesity indexes [9].
Recent Korean health statistics showed that the only age group in Korea that consumes dietary protein less than the RDA is the elderly population [10]. The daily total protein intake of Korean males and females in their 70s were 61.4 ± 1.4 g/day and 45.4 ± 1.0 g/day, respectively, and it was 52.2 ± 2.4 g/day and 39.5 ± 1.5 g/day for persons over 80 years old [11]. Furthermore, because the Koreans eat rice as staple food, more than two-thirds of protein intake is taken as a plant protein [11]. By contrast, in the United States, the daily protein intake was 80.8 ± 2.0 g/day and 60.0 ± 1.5 g/day for males and females over 70 years old, respectively, while consuming more than 60% of the total protein intake from animal sources [12,13]. Due to differences in the quantity and quality of protein intake between Korea and the west, study results from western countries may not be directly applied to the Korean population.
Only few studies investigated the relationship between protein and obesity in East Asians. Therefore, we sought to evaluate the relationship between the protein intake and obesity according to protein source (animal versus plant protein) in the elderly Korean population using the nation-wide representative sample of Koreans. We also evaluated the association between protein intake and renal function.
2. Materials and Methods
2.1. Study Participants
The Korea National Health and Nutrition Examination Survey (KNHANES) is a population-based cross-sectional survey conducted to assess the health-related behavior, the health condition, and the nutritional state of Koreans. The KNHANES consists of health interview surveys (household survey, comorbidity, periodic health examination, quality of life, injury, health care utilization, education and economic activities, and health behavior survey), health examination surveys and nutrition surveys (dietary behavior, food frequency questionnaire, and 24-hour dietary recall). Detailed descriptions of the plan and operation of the survey have been described on the KNHANES website (http://knhanes.cdc.go.kr/). In 2013 and 2014, participation rate of health interview survey and health examination survey were 75.0% and 73.9%, respectively, and that of nutrition survey was 82.7% and 81.7%, respectively.
Our study subjects included a total of 2549 persons aged 60 years or older (male: 1127; female 1427) who participated in all three surveys from the 2013~2014 KNHANES. We excluded participants who reported to consume <500 kcal or >5000 kcal a day or those with missing data on the health behavior survey of the health interview survey. The study protocol was approved by the Institutional Review Board of Seoul Paik Hospital (IRB No. 2017-11-010). Informed consent was waived by the Institutional Review Board.
2.2. Covariate Measurements
We collected data on the demographic (age and sex) and socioeconomic (household income and education) factors. Participants were categorized according to age (60 to 69 years, 70 to 79 years, ≥80 years), household income (upper, upper middle, lower middle and lower) and education level (<9 years, 10–12 years, and ≥13 years).
Data on comorbidities including hypertension, dyslipidemia, stroke, ischemic heart disease, osteoarthritis, rheumatoid arthritis, asthma, diabetes, thyroid disease, chronic kidney disease, chronic liver disease or any type of cancer were collected.
2.3. Health Behavior Measurement
Smoking status was divided into smokers and non-smokers. Alcohol intake was divided into 0, 1, and ≥2 times per week. The level of physical activity was assessed by calculating the Metabolic Equivalent for Task (MET) per week using the International Physical Activity Questionnaire (IPAQ) which consists of self-reported exercise days per week and exercise duration of walking, moderate-intensity and vigorous-intensity exercise [14].
2.4. Body Mass Index and Waist Circumference
Height (SECA 225; Seca, Hamburg, Germany) and weight (GL-6000-20; CAS, Yangju-si, Korea) were measured while the participant wore a lightweight gown or underwear. BMI was calculated and classified into ≤18.4 kg/m2 (underweight), 18.5–22.9 kg/m2 (normal), 23.0–24.9 kg/m2 (overweight), and ≥25.0 kg/m2 (obesity) according to the Asia Pacific Standards of the WHO-recommended definition of Obesity [15].
The WC measured by a well-trained examiner to the nearest 0.1 cm at the mid-point between the lower rib and the pelvic iliac crest.
2.5. Assessment of Protein and Other Macronutrient Intake
One-day 24-h recall data were used to estimate the daily protein and macronutrient intake. Each food consumed was classified into 19 food groups adapted by the KNHANES [16]. Of the 19 food groups, proteins taken from grains, potatoes, sugars, beans and legumes, nuts, plants, mushrooms, fruits, seaweeds, drinks and alcohols, condiments, and other (plant) were classified as plant protein and those taken from meat, eggs, fish and shellfish, dairy foods, oil (animal), and other (animal) were classified as animal protein. Protein intake was further quantified (1) as protein intake in grams per day; (2) percentage of energy from protein; and (3) grams per kilogram body weight.
2.6. Renal Function Assessment
Glomerular filtration rate (GFR) was calculated according to Modification of Diet in Renal Disease-GFR (MDRD-GFR) formula [17].
2.7. Statistical Analysis
All analyses were stratified according to gender. Descriptive statistics were presented as means or proportions with their standard errors. The trend test was used to evaluate the relationship between total protein intake quartiles and macronutrients intake, animal and plant protein intake, anthropometric measurements, and physical activity level.
Multivariate general linear modellings were carried out to examine the relationship between protein intake quartiles and obesity index measured by BMI, WC and renal function index measured by serum creatinine and GFR. Adjusted means of BMI and WC by protein intake quartiles were presented after controlling age (year), household income quartiles, education (≤9 years, 10–12 years, 13≤ years), presence of chronic disease (yes or no), current smoking status (yes or no), alcohol intake frequency per week (0, 1, 2≤), physical activity (MET/week), % energy from fat (%), % energy from carbohydrate (%) and total energy intake (kcal). For the modelling of serum creatinine and GFR, age (year), BMI (kg/m2), physical activity (MET/week), household income quartiles, current smoking status (yes or no), and alcohol intake frequency per week (0, 1, 2≤) were controlled.
A two-sided probability value <0.05 was considered to indicate a statistically significant difference. Statistical tests were performed using SPSS 18 statistical package (SPSS Inc., Chicago, IL, USA) incorporating sampling weight while considering the multistage probability sampling design of KNHANES and the nonresponses.
3. Results
3.1. Study Population
A total of 2549 participants were enrolled. The mean age was 69.5 ± 0.2 years; 44% were male (Table 1), two-thirds had lower or middle lower household income and education less than 9 years; 77% had at least one comorbidity.

Table 1.
General characteristics of the study population.
The proportion of overweight or obese participants were 55.8% and 64.0%, the mean waist circumference 84.8 ± 0.3 cm and 82.5 ± 0.3 cm, and the physical activity level measured by MET were 2275.1 ± 92.8 MET/week and 1542.6 ± 66.3 MET/week, for males and females, respectively.
3.2. Characteristics of Study Participants According to Protein Intake
Total protein intake for males was 67.1 ± 1.1 g/day, accounting for 13.1 ± 0.1% of the total energy intake (Table 2). Total protein intake per body weight was 1.1 ± 0.02 g/kg/day, of which 0.6 ± 0.01 g/kg/day was from plant sources and 0.4 ± 0.02 g/kg/day was from animal sources, thus the proportion of animal protein to the total protein was 33.4 ± 0.7%. Females reported lower total protein intake (0.9 ± 0.02 g/kg/day) and a lower proportion of animal to total protein (29.0 ± 0.7%) than males. Plant protein intake was the main contributor to the total protein intakes in both sexes. The energy % from carbohydrate (p < 0.001) decreased, and that from fat (p < 0.001) increased in both sexes as the quartiles of total protein intake (g/kg/day) increased.
Table 2.
Energy and macronutrient intake, anthropometric characteristics, and physical activity level by the quartiles of daily total protein intake per weight of Korean elderly population.
In males, total protein intake was positively associated with both plant (p < 0.001) and animal (p < 0.001) protein intake. From the lowest to highest quartiles of total protein intake, the plant protein intake approximately doubled from 28.0 ± 0.5 g/day to 52.7 ± 1.3 g/day while animal protein increased six times from 8.1 ± 0.4 g/day to 53.4 ± 2.5 g/day. Similar patterns were observed in females. The increase in animal protein intake, rather than plant protein intake contributed more to the increase of total protein intake.
3.3. Body Mass Index, Waist Circumference and Protein Intake
In males, the daily intake of plant protein (regression coefficient (95% CI); −1.30 (−1.55, −1.06), p < 0.001; −3.86 (−4.58, −3.16), p < 0.001, respectively), animal protein (−0.29 (−0.52, −0.05), p = 0.016; −0.90 (−1.58, −0.22), p = 0.010) and total protein (−1.30 (−1.58, −1.02), p < 0.001; −3.88 (−4.68, −3.08), p < 0.001) were all inversely associated with BMI and WC, after adjusting for covariates (Figure 1 and Figure 2). The associations between protein intake and obesity index were more marked in plant protein than in animal protein. Similar associations were shown in Korean females.
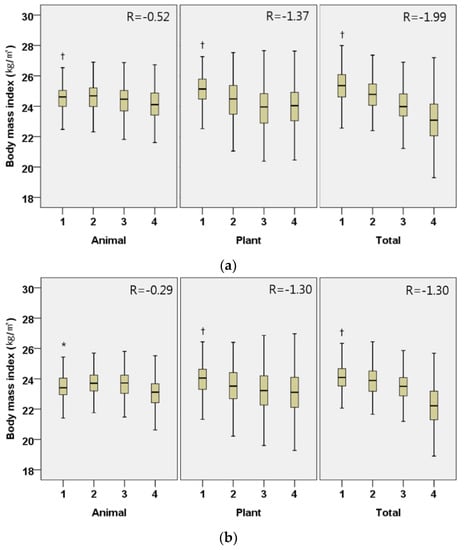
Figure 1.
Adjusted body mass index (kg/m2) by the quartiles of daily animal, plant, and total protein intake per weight (g/kg/day) in Korean elderly population. (a) Male; (b) Female. All models are adjusted for age (year), household income quartile, education (≤9 years, 10–12 years, 13≤ years), presence of chronic disease (yes or no), current smoking status (yes or no), alcohol intake frequency per week (0, 1, 2≤), physical activity (MET/week), % energy from fat (%), % energy from carbohydrate (%) and total energy intake (kcal). Participants were divided into quartiles for daily animal, plant, and total protein intake per weight (g/kg/day); male animal (Q1 < 0.13, Q2 0.13–0.29, Q3 0.30–0.56, Q4 0.56<), male plant (Q1 < 0.45, Q2 0.45–0.61, Q3 0.62–0.79, Q4 0.79<), male total (Q1 < 0.70, Q2 0.70–0.97, Q3 0.98–1.30, Q4 1.30<), female animal (Q1 < 0.07, Q2 0.07–0.21, Q3 0.21–0.40, Q4 0.40<), female plant (Q1 < 0.42, Q2 0.42–0.57, Q3 0.58–0.74, Q4 0.74<), female total (Q1 < 0.59, Q2 0.59–0.82, Q3 0.83–1.14, Q4 1.14<); β-coefficient (95% confidence interval) male animal −0.29 (−0.52, −0.05), male plant −1.30 (−1.55, −1.06), male total −1.30 (−1.58, −1.02), female animal −0.52 (−0.75, −0.30), female plant −1.37 (−1.60, −1.14), female total −1.99 (−2.29, −1.70); * p < 0.05, † p < 0.001 by trend test.
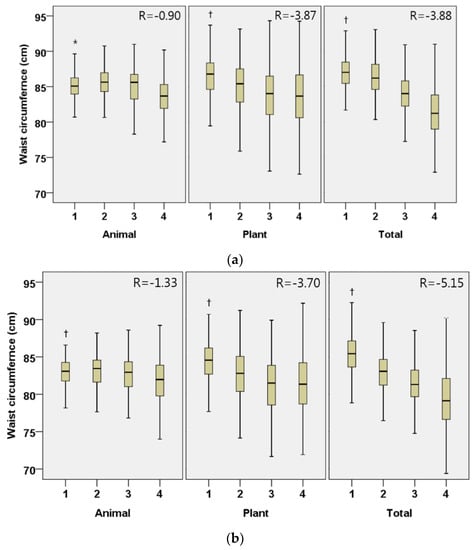
Figure 2.
Adjusted waist circumference by the quartiles of daily animal, plant, and total protein intake per weight (g/kg/day) in Korean elderly population. (a) Male; (b) Female. All models are adjusted for age (year), household income quartile, education (≤9 years, 10-12 years, 13≤ years), presence of chronic disease (yes or no), current smoking status (yes or no), alcohol intake frequency per week (0, 1, 2≤), physical activity (MET/week), % energy from fat (%), % energy from carbohydrate (%) and total energy intake (kcal). Participants were divided into quartiles for daily animal, plant, and total protein intake per weight (g/kg/day); male animal (Q1 < 0.13, Q2 0.13–0.29, Q3 0.30–0.56, Q4 0.56<), male plant (Q1 < 0.45, Q2 0.45–0.61, Q3 0.62–0.79, Q4 0.79<), male total (Q1 < 0.70, Q2 0.70–0.97, Q3 0.98–1.30, Q4 1.30<), female animal (Q1 < 0.07, Q2 0.07–0.21, Q3 0.21–0.40, Q4 0.40<), female plant (Q1 < 0.42, Q2 0.42–0.57, Q3 0.58–0.74, Q4 0.74<), female total (Q1 < 0.59, Q2 0.59–0.82, Q3 0.83–1.14, Q4 1.14<); β-coefficient (95% confidence interval) male animal −0.90 (−1.58, −0.22), male plant −3.87 (−4.58, −3.16), male total −3.88 (−4.68, −3.08), female animal −1.33 (−1.95, −0.71), female plant −3.70 (−4.42, −2.99), female total −5.15 (−5.93, −4.37); * p < 0.05, † p < 0.001 by trend test.
3.4. Markers of Kidney Function and Protein Intake
To explore the relationship between protein intake and renal function, we excluded 18 participants who reported physician-diagnosed renal disease and 311 patients who had missing data on serum creatinine, so that the data of 2220 participants (1007 males and 1213 females) were included in this analysis (Table 3). None of plant protein, animal protein, and total protein intake had significant relationship with serum creatinine or GFR in both sexes.
Table 3.
Adjusted GFR and serum creatinine of kidney function by quartiles of daily total, plant, and animal protein intake per weight in Korean elderly population.
4. Discussion
There is controversy of whether animal and plant proteins have different effects on obesity. In this study, a representative sample of Koreans aged 60 years or older revealed that animal and plant protein intakes, as well as the total protein intake, had negative associations with BMI and WC.
4.1. Total Protein, Plant Protein, Animal Protein and Obesity
Though there has been some consensus on the beneficial effect of protein intake on obesity indexes such as BMI and WC, there has been inconsistent results on whether the source of protein, i.e., plant or animal, has different effects on obesity [5,6,8,18]. Previous studies showed that protein intake from plant sources improved obesity index in cross-sectional and longitudinal studies. Lin et al. [9] reported that plant protein intake was inversely correlated with BMI and WC in Belgian adults, using two non-consecutive 24-h recall. Deibert et al. [19] implemented a randomized trial that provided a substitution diet containing high-soy-protein and reported that in overweight and obese subjects, body weight and BMI decreased as soy protein intake increased. In addition, our study found a negative association between plant protein intake and the obesity index.
Nonetheless, the effect of animal protein intake on obesity showed conflicting results. Berryman et al. [8] developed the usual protein intake from the US NHANES with the use of the National Cancer Institute method [20] and reported that animal protein intake was negatively associated with the risk of obesity and abdominal obesity. By contrast, Bujnowski et al. [21] obtained crossed-checked dietary information for three consecutive days using Burke’s comprehensive dietary history method [22] and reported that obesity risk increased with an increase in animal protein intake during a 7-year longitudinal study. Alkerwi et al. [23] also reported that the risk of abdominal obesity increases with increasing intake of meat, fish and fish products, using 134-item semiquantitative food frequency questionnaire. In our study, it was found that animal protein intake correlated negatively with BMI and WC.
The reason for inconsistent results regarding the intake of animal protein is unclear. Possible explanations are differences in culinary culture among countries leading to different quality and quantity of protein intake. Studies whose participants had a high daily protein intake tend to show positive associations between protein intake and obesity while those with a low protein intake tend to display negative associations. For example, the mean intake of the lowest quartile of animal protein in the study from Bujnowski et al. [21] was 74.7 g/day, which was substantially higher than the highest quartile of animal protein intake (53 g/day for males, 37 g/day for females) in our study. Alkerwi et al. [23] reported 2.5-fold higher mean animal protein intake (53.9 g/day) than ours (25.9 g/day for males and 17.4 g/day for females). Berryman et al. [8], showed negative associations between animal protein intake and obesity and the mean animal protein intake was 37.4 g/day which was lower than those from other western studies. Taken together, we carefully suggest that there may be a J-curve relationship between animal protein intake and obesity index. Below the threshold, animal protein intake might lessen obesity, and above that threshold, it might worsen obesity. More studies are needed to confirm our hypothesis.
4.2. Mechanism that Protein Intake Affects Obesity
Several mechanisms have been suggested to explain the observed association between protein intake and obesity. First, protein is the least efficient energy source among macronutrients using more energy in the metabolic process than carbohydrates or fats [24,25]. Second, protein increases satiety, resulting in less additional food intake [26]. The increase of peptide YY, an appetite-suppressing hormone from the gastrointestinal tract [27], and the decrease of Ghrelin, a hormone that increases appetite from the gastric parietal cells are the suggested underlying mechanisms for the satiety [28]. Cholecystokinin secreted from the duodenum by the intake of protein also suppresses appetite [29]. In addition, GLP-1 secretion induced by protein intake from the L-cell of the distal small intestine lowers the gastric emptying rate and increases satiety to suppress appetite [30]. Third, the sufficient protein intake in the elderly increases lean body mass and prevents sarcopenia, leading to an increase in both basal metabolism and physical activity, which in turn reduces obesity risk [31].
4.3. Renal Function and Protein Intake
One of the biggest concerns of protein intake is the possibility of impairment of renal function. Especially, since a low protein diet has been recommended to individuals with renal disease to prevent or slow the progression of renal damage. However, we found no effect of protein intake on GFR, which is in line with a recent US national study demonstrating that protein intake is not associated with a decrease in renal function in adults without chronic kidney disease [8]. Additionally, a meta-analysis of dietary intervention studies reported that high protein diet does not decrease GFR, in contrast it improves the GFR in healthy adults [32].
The RDA of protein intake for Koreans is 0.91 g/kg/day, which is lower than that of 1.0–1.2 g/kg/day by European Society for Clinical Nutrition and Metabolism (ESPEN) and European Union Geriatric Medicine Society (EUGM) [33,34]. Currently, protein intake greater than the RDA is recommended to increase muscle mass, strength and physical function in elderly with normal renal function [35]. However, 5 out of 10 Korean males and 4 out of 10 Korean females over 60 years old do not even meet the RDA [11]. Considering this, the protein intake at least up to the RDA must be encouraged for Korean elderly with normal renal function than overemphasizing the less possible risk of renal side effects.
4.4. Limitations and Strengths of This Study
This study has some limitations. First, the one-day 24-h recall data might have been too short to represent the usual intake of study participants. If usual intake measures were employed, the range of intake would have been reduced which may have modified associations found with one-day intake measures. Reporting bias is another limitation of the self-reported dietary data. Second, the cross-sectional study design could not infer any causal relationships between protein intake and obesity index. Third, body composition analysis like the Dual-Energy X-ray Absorptiometry was not performed; it was not possible to assess the detailed relationship between protein intake and individual components (i.e., fat, muscle, and bone) of body composition.
Despite the limitations, this study is the first in Korea to distinguish protein by its source while studying its effect on obesity. To the best of our knowledge, this study is the first in Asia.
5. Conclusions
In Korean adults aged 60 years or older, protein intake was associated with a favorable obesity index without decrease in renal function. The effect was similar in both male and females, with both animal and plant proteins. This outcome has potential public health implications, as promotion of a proper protein intake might attenuate obesity epidemics and subsequent cardiometabolic risks in the aged Korean population. Additional studies are warranted to explore and validate our findings.
Author Contributions
K.-B.P. contributed to interpret the study results and wrote the paper. H.A.P. contributed to the study concept and design, analysis and interpretation of the data, statistical analysis, and manuscript writing; J.-H.K. contributed to the study concept and design, gave professional advice on statistical analysis and interpretation of the data; K.K. contributed to administrative support for the study, and commented on manuscript; Y.G.C. contributed to the study concept and design and gave comments on manuscript; J.J. contributed to the study concept and design, and manuscript preparation; All authors reviewed and approved the final manuscript.
Conflicts of Interest
The authors declare no conflict of interest.
References
- Ogden, C.L.; Carroll, M.D.; Fryar, C.D.; Flegal, K.M. Prevalence of Obesity among Adults and Youth: United States, 2011–2014; US Department of Health and Human Services, Centers for Disease Control and Prevention, National Center for Health Statistics: Atlanta, GA, USA, 2015.
- KOSIS. Trend of Obesity Prevalence 2005–2015: Ministry of Health and Welfare, Korea National Health and Nutrition Survey. Available online: kosis.kr/statHtml/statHtml.do?orgId=117&tblId=DT_11702_N101&conn_path=I2 (accessed on 25 April 2018).
- Janssen, I.; Mark, A.E. Elevated body mass index and mortality risk in the elderly. Obes. Rev. 2007, 8, 41–59. [Google Scholar] [CrossRef] [PubMed]
- Di Angelantonio, E.; Bhupathiraju, S.N.; Wormser, D.; Gao, P.; Kaptoge, S.; de Gonzalez, A.B.; Cairns, B.J.; Huxley, R.; Jackson, C.L.; Joshy, G. Body-mass index and all-cause mortality: Individual-participant-data meta-analysis of 239 prospective studies in four continents. Lancet 2016, 388, 776–786. [Google Scholar] [CrossRef]
- Pasiakos, S.M.; Lieberman, H.R.; Fulgoni, V.L., 3rd. Higher-protein diets are associated with higher HDL cholesterol and lower BMI and waist circumference in US adults. J. Nutr. 2015, 145, 605–614. [Google Scholar] [CrossRef] [PubMed]
- Green, K.K.; Shea, J.L.; Vasdev, S.; Randell, E.; Gulliver, W.; Sun, G. Higher dietary protein intake is associated with lower body fat in the Newfoundland Population. Clin. Med. Insights Endocrinol. Diabetes 2010, 3, 25–35. [Google Scholar] [CrossRef] [PubMed]
- Oh, C.; Jeon, B.H.; Storm, S.N.R.; Jho, S.; No, J.-K. The most effective factors to offset sarcopenia and obesity in the older Korean: Physical activity, vitamin D, and protein intake. Nutrition 2017, 33, 169–173. [Google Scholar] [CrossRef] [PubMed]
- Berryman, C.E.; Agarwal, S.; Lieberman, H.R.; Fulgoni, V.L., 3rd; Pasiakos, S.M. Diets higher in animal and plant protein are associated with lower adiposity and do not impair kidney function in US adults. Am. J. Clin. Nutr. 2016, 104, 743–749. [Google Scholar] [CrossRef] [PubMed]
- Lin, Y.; Bolca, S.; Vandevijvere, S.; De Vriese, S.; Mouratidou, T.; De Neve, M.; Polet, A.; Van Oyen, H.; Van Camp, J.; De Backer, G. Plant and animal protein intake and its association with overweight and obesity among the Belgian population. Br. J. Nutr. 2011, 105, 1106–1116. [Google Scholar] [CrossRef] [PubMed]
- Korea Centers for Disease Control and Prevention. Korea Health Statistics 2016: Korea National Health and Nutrition Examination Survey (KNHANES Ⅶ-1); Ministry of Health and Welfare: Seoul, Korea, 2017.
- Park, H. Adequacy of protein intake of Korean elderly: An analysis of 2013–2014 Korea national health and nutrition examination survey data. Korean J. Fam. Med. 2017, 39, 130–134. [Google Scholar] [CrossRef] [PubMed]
- Pasiakos, S.M.; Agarwal, S.; Lieberman, H.R.; Fulgoni, V.L. Sources and Amounts of Animal, Dairy, and Plant Protein Intake of US Adults in 2007–2010. Nutrients 2015, 7, 7058–7069. [Google Scholar] [CrossRef] [PubMed]
- U.S. Department of Agriculture, Agricultural Research Service. Nutrient Intakes from Food and Beverages: Mean Amounts Consumed per Individual, by Gender and Age, What We Eat in America, NHANES 2013–2014. Day 1. Available online: www.ars.usda.gov/nea/bhnrc/fsrg (accessed on 1 November 2017).
- Ainsworth, B.E.; Haskell, W.L.; Herrmann, S.D.; Meckes, N.; Bassett, D.R., Jr.; Tudor-Locke, C.; Greer, J.L.; Vezina, J.; Whitt-Glover, M.C.; Leon, A.S. 2011 Compendium of Physical Activities: A second update of codes and MET values. Med. Sci. Sports Exerc. 2011, 43, 1575–1581. [Google Scholar] [CrossRef] [PubMed]
- World Health Organization. The Asia-Pacific Perspective: Redefining Obesity and Its Treatment; Health Communications Australia: Sydney, Australia, 2000. [Google Scholar]
- Korea Centers for Disease Control and Prevention. The Sixth Korea National Health and Nutrition Examination Survey (KNHANES VI); Korea Centers for Disease Control and Prevention: Cheongju-si, Korea, 2015.
- Levey, A.S.; Bosch, J.P.; Lewis, J.B.; Greene, T.; Rogers, N.; Roth, D. A more accurate method to estimate glomerular filtration rate from serum creatinine: A new prediction equation. Ann. Intern. Med. 1999, 130, 461–470. [Google Scholar] [CrossRef] [PubMed]
- Mirmiran, P.; Hajifaraji, M.; Bahadoran, Z.; Sarvghadi, F.; Azizi, F. Dietary protein intake is associated with favorable cardiometabolic risk factors in adults: Tehran Lipid and Glucose Study. Nutr. Res. 2012, 32, 169–176. [Google Scholar] [CrossRef] [PubMed]
- Deibert, P.; König, D.; Schmidt-Trucksaess, A.; Zaenker, K.; Frey, I.; Landmann, U.; Berg, A. Weight loss without losing muscle mass in pre-obese and obese subjects induced by a high-soy-protein diet. Int. J. Obes. 2004, 28, 1349–1352. [Google Scholar] [CrossRef] [PubMed]
- Tooze, J.A.; Kipnis, V.; Buckman, D.W.; Carroll, R.J.; Freedman, L.S.; Guenther, P.M.; Krebs-Smith, S.M.; Subar, A.F.; Dodd, K.W. A mixed-effects model approach for estimating the distribution of usual intake of nutrients: The NCI method. Stat. Med. 2010, 29, 2857–2868. [Google Scholar] [CrossRef] [PubMed]
- Bujnowski, D.; Xun, P.; Daviglus, M.L.; Van Horn, L.; He, K.; Stamler, J. Longitudinal association between animal and vegetable protein intake and obesity among men in the United States: The Chicago Western Electric Study. J. Am. Diet. Assoc. 2011, 111, 1150–1155. [Google Scholar] [CrossRef] [PubMed]
- Burke, B.S. The dietary history as a tool in research. J. Am. Diet. Assoc. 1947, 23, 1041–1046. [Google Scholar]
- Alkerwi, A.A.; Sauvageot, N.; Buckley, J.D.; Donneau, A.-F.; Albert, A.; Guillaume, M.; Crichton, G.E. The potential impact of animal protein intake on global and abdominal obesity: Evidence from the Observation of Cardiovascular Risk Factors in Luxembourg (ORISCAV-LUX) study. Public Health Nutr. 2015, 18, 1831–1838. [Google Scholar] [CrossRef] [PubMed]
- Fine, E.J.; Feinman, R.D. Thermodynamics of weight loss diets. Nutr. Metab. 2004, 1, 15. [Google Scholar] [CrossRef] [PubMed]
- Feinman, R.D.; Fine, E.J. Thermodynamics and metabolic advantage of weight loss diets. Metab. Syndr. Relat. Disord. 2003, 1, 209–219. [Google Scholar] [CrossRef] [PubMed]
- Halton, T.L.; Hu, F.B. The effects of high protein diets on thermogenesis, satiety and weight loss: A critical review. J. Am. Coll. Nutr. 2004, 23, 373–385. [Google Scholar] [CrossRef] [PubMed]
- Batterham, R.L.; Heffron, H.; Kapoor, S.; Chivers, J.E.; Chandarana, K.; Herzog, H.; Le Roux, C.W.; Thomas, E.L.; Bell, J.D.; Withers, D.J. Critical role for peptide YY in protein-mediated satiation and body-weight regulation. Cell Metab. 2006, 4, 223–233. [Google Scholar] [CrossRef] [PubMed]
- Lee, K.; Cha, D.; Cheon, S.; Yeo, M.; Cho, S. Plasma ghrelin levels and their relationship with gastric emptying in patients with dysmotility-like functional dyspepsia. Digestion 2009, 80, 58–63. [Google Scholar] [CrossRef] [PubMed]
- Verdich, C.; Flint, A.; Gutzwiller, J.-P.; Naslund, E.; Beglinger, C.; Hellstrom, P.; Long, S.; Morgan, L.; Holst, J.; Astrup, A. A meta-analysis of the effect of glucagon-like peptide-1 (7–36) amide on ad libitum energy intake in humans. J. Clin. Endocrinol. Metab. 2001, 86, 4382–4389. [Google Scholar] [CrossRef] [PubMed]
- Kissileff, H.R.; Pi-Sunyer, F.X.; Thornton, J.; Smith, G.P. C-terminal octapeptide of cholecystokinin decreases food intake in man. Am. J. Clin. Nutr. 1981, 34, 154–160. [Google Scholar] [CrossRef] [PubMed]
- Stenholm, S.; Harris, T.B.; Rantanen, T.; Visser, M.; Kritchevsky, S.B.; Ferrucci, L. Sarcopenic obesity-definition, etiology and consequences. Curr. Opin. Clin. Nutr. Metab. Care 2008, 11, 693–700. [Google Scholar] [CrossRef] [PubMed]
- Schwingshackl, L.; Hoffmann, G. Comparison of high vs. normal/low protein diets on renal function in subjects without chronic kidney disease: A systematic review and meta-analysis. PLoS ONE 2014, 9, e97656. [Google Scholar] [CrossRef] [PubMed]
- Deutz, N.E.; Bauer, J.M.; Barazzoni, R.; Biolo, G.; Boirie, Y.; Bosy-Westphal, A.; Cederholm, T.; Cruz-Jentoft, A.; Krznariç, Z.; Nair, K.S. Protein intake and exercise for optimal muscle function with aging: Recommendations from the ESPEN Expert Group. Clin. Nutr. 2014, 33, 929–936. [Google Scholar] [CrossRef] [PubMed]
- Bauer, J.; Biolo, G.; Cederholm, T.; Cesari, M.; Cruz-Jentoft, A.J.; Morley, J.E.; Phillips, S.; Sieber, C.; Stehle, P.; Teta, D. Evidence-based recommendations for optimal dietary protein intake in older people: A position paper from the PROT-AGE Study Group. J. Am. Med. Dir. Assoc. 2013, 14, 542–559. [Google Scholar] [CrossRef] [PubMed]
- Wolfe, R.R.; Miller, S.L.; Miller, K.B. Optimal protein intake in the elderly. Clin. Nutr. 2008, 27, 675–684. [Google Scholar] [CrossRef] [PubMed]
© 2018 by the authors. Licensee MDPI, Basel, Switzerland. This article is an open access article distributed under the terms and conditions of the Creative Commons Attribution (CC BY) license (http://creativecommons.org/licenses/by/4.0/).