Article

In Vitro Evaluation of the Effects of Commercial Prebiotic GOS and FOS Products on Human Colonic Caco–2 Cells

1
Division of Microbiology, Brewing and Biotechnology, School of Biosciences, University of Nottingham, Sutton Bonington Campus, Loughborough LE12 5RD, UK
2
Saputo Dairy UK, Innovation Centre, Harper Adams University, Newport TF10 8NB, UK
*
Author to whom correspondence should be addressed.
Nutrients 2020, 12(5), 1281; https://doi.org/10.3390/nu12051281
Submission received: 12 March 2020 / Revised: 21 April 2020 / Accepted: 28 April 2020 / Published: 30 April 2020
(This article belongs to the Section Prebiotics and Probiotics)

Abstract

:
Prebiotic oligosaccharides are widely used as human and animal feed additives for their beneficial effects on the gut microbiota. However, there are limited data to assess the direct effect of such functional foods on the transcriptome of intestinal epithelial cells. The purpose of this study is to describe the differential transcriptomes and cellular pathways of colonic cells directly exposed to galacto-oligosaccharides (GOS) and fructo-oligosaccharides (FOS). We have examined the differential gene expression of polarized Caco–2 cells treated with GOS or FOS products and their respective mock-treated cells using mRNA sequencing (RNA-seq). A total of 89 significant differentially expressed genes were identified between GOS and mock-treated groups. For FOS treatment, a reduced number of 12 significant genes were observed to be differentially expressed relative to the control group. KEGG and gene ontology functional analysis revealed that genes up-regulated in the presence of GOS were involved in digestion and absorption processes, fatty acids and steroids metabolism, potential antimicrobial proteins, energy-dependent and -independent transmembrane trafficking of solutes and amino acids. Using our data, we have established complementary non-prebiotic modes of action for these frequently used dietary fibers.

1. Introduction

Prebiotics are generally defined as substances that are selectively utilized by host microorganisms to produce a health benefit [1]. Prebiotic oligosaccharides conform to the definition as non-digestible food ingredients that beneficially affect the host by stimulating the growth and/or activity of beneficial bacteria in the colon [2]. Such oligosaccharides are widely used as human and animal nutritional additives for their beneficial effects on the composition of the probiotic microbiota and gut health [3,4]. However, oligosaccharides that largely resist hydrolytic activities of salivary and intestinal digestive enzymes reach the colon virtually intact, thus prompting to question whether they could have a direct or “non-prebiotic” effect on the intestinal epithelium should they reach the mucosa.
Galacto-oligosaccharides (GOS or β-GOS) are produced through the β-galactosidase catalyzed transgalactosylation of lactose creating oligosaccharides with degrees of polymerization (DP) ranging from 2 to 8 monomeric units with β(1→3), β(1→4) and β(1→6) linkages between galactose units and are usually coupled to a terminal glucose [5]. Commercial GOS products typically also contain residual lactose, glucose and galactose reactants. Fructo-oligosaccharides (FOS) are commonly produced by acid- or enzyme-catalyzed hydrolysis of inulin [6], which results in fructan oligomers of 1 to 7 units (DP 1–7), sometimes with a terminal glucose [6,7]. Commercial FOS products typically also contains residual sucrose, fructose and glucose.
In vivo, GOS supplementation has been shown to increase iron absorption from micronutrient powder in Kenyan infants [8] or to reduce stress-induced gastrointestinal dysfunction and days of cold or flu symptoms in controlled trials of healthy university students [9]. In a healthy volunteer study, Schmidt et al. [10] described the reduction of the salivary cortisol awakening response associated with GOS administration, implying suppression of the neuroendocrine stress response. However, Liu et al. [11] suggested short-term intake of high-dose GOS and FOS prebiotics had an adverse effect on glucose metabolism despite increased Bifidobacterium in the fecal microbiota. In controlled animal studies, GOS has been associated with improved growth performance of broiler chickens [12] or during exposure to heat stress [13,14]. Dietary supplementation of GOS has also been linked with improvements in the transition to a mature intestinal microbiota in broiler chickens [12,15] and in suckling piglets [16,17]. In a study conducted with suckling male rats, in addition to changes in the intestinal microbiota, Le Dréan et al. [18] observed GOS and FOS supplementation impacted entero-endocrine cell maturation by bringing about transient increases in the density of GLP-1 cells and the production of the satiety-related peptides GLP-1 and PYY.
The direct cellular effects of prebiotics have been investigated using polarized intestinal epithelial cell models. For example, GOS exposure has been associated with improved tight junction formation and re-epithelialization post disruption, which coincided with increases in the expression of cell proliferation and cell differentiation pathways [19]. GOS was also reported to prevent deoxynivalenol-induced compromise of the integrity of Caco–2 cell monolayers and the corresponding decline in the expression of the tight junction encoding gene CLDN3 [20]. GOS is also reported to reduce the adherence of Salmonella Typhimurium to mucus- and to non-mucus-producing HT–29 cells [21].
Several studies have reported that GOS, FOS and inulin promote calcium absorption in the animal and human gut [22,23,24]. FOS has also been reported to have non-microbiome or non-prebiotic mediated effects on immune function. For example, Fransen et al. used germ-free mice to confirm microbiota-independent changes in immune function with short- or long-chain β2→1-fructans enhancing T helper 1 cells in Peyer’s patches and short-chain β2→1-fructans, increasing regulatory T cells and CD11b−CD103− dendritic cells in the mesenteric lymph nodes [25]. FOS-inulin pre-incubation of a chicken macrophage cell line HD11 before challenge with Salmonella Enteriditis reduced cellular uptake of the pathogen and IL-1β gene expression, suggesting that inulin-enriched FOS had the ability to modulate the innate immune response [26].
Caco–2 cells are a continuous line of heterogeneous human epithelial colorectal adenocarcinoma cells that produce tight junctions, microvilli, enzymes and transporters characteristic of enterocytes. The Caco–2 monolayer is widely used in the pharmaceutical industry as an in vitro model of the human intestinal mucosa to predict the absorption of orally administered drugs. Caco–2 cells are commonly cultured as a polarized epithelial stratum by forming confluent monolayers on insert filters that provide a physical and biochemical barrier to the passage of ions and small molecules [27]. In this study, we have examined the effects of Nutrabiotic® GOS and Beneo® FOS (also referred to as “GOS” and “FOS” respectively) on the integrity of the monolayers by measuring trans-epithelial electrical resistance (TEER), and on differential gene expression relative to mock treated control using whole transcriptome sequencing technology. Our data establish complementary non-prebiotic modes of action for these frequently used dietary fibers.

2. Materials and Methods

2.1. Oligosaccharides

Galacto-oligosaccharides (Nutrabiotic® GOS, 66% w/w syrup) were provided by Dairy Crest Ltd (Esher, Surrey, UK) and Fructo-oligosaccharides (FOS Orafti®L95, 75% w/w syrup) were obtained from BENEO–Orafti (Oreye, Belgium). The detailed composition of the oligosaccharide treatments applied are summarized in Table 1. The GOS treatment media contained 2% v/v of Nutrabiotic® GOS, equivalent to 1.4% w/v of DP 2–7+ galacto-oligosaccharides. The FOS treatment media contained 2% v/v of Orafti®L95 FOS, equivalent to 2% w/v of DP 2–8 fructo-oligosaccharides. To account for the presence of mono- and digestible di-saccharides contained in Nutrabiotic® GOS and Orafti®L95 FOS syrups used for treatment, we tailored the mock-treatments accordingly for GOS by incorporating galactose (0.03%), glucose (0.4%) and lactose (0.2%) in the GOS mock control, and by inclusion of fructose (0.06%), glucose (0.004%) and sucrose (0.04%) in the FOS mock control.

2.2. Cells and Experimental Design

The microbiota-independent effects of GOS and FOS oligosaccharides were assessed in vitro using human Caco–2 cells cultured as a confluent monolayer and exposed to treatment for 24 h. Each treatment was undertaken as three technical replications of three independent biological replicates represented by different cell passages. The human colon adenocarcinoma Caco–2 cell line was obtained from the American Type Tissue Collection (ATCC® HTB–37™, passage 18; lot 62381028; LGC Standards, Teddington, UK,) and propagated according to established methods [28]. In brief, cells were cultured in Dulbecco’s modified Eagle medium (DMEM) and seeded at a density of 105 cells onto 1.12 cm2 Transwell® permeable support with a 0.4 μm tissue culture treated polyester membrane placed in a 12-well plate (3460; Costar, Kennebunk, ME, USA). Caco–2 cells were maintained in a humidified atmosphere of 95% air and 5% CO2 at 37 °C. Fresh culture medium containing DMEM (D6546, Sigma, Gillingham, UK), sterile Fetal Bovine Serum 10% v/v (F9665, Sigma), L-glutamine 2 mM (G7513, Sigma), MEM non-essential amino acid solution supplement 1x (M7145, Sigma), penicillin 100 U/mL and streptomycin 100 µg/mL (P0781, Sigma) was replenished every 2 to 3 days. Control mono- and di-saccharides-containing “GOS mock” and “FOS mock” treatment media were prepared as indicated in Table 2. GOS and FOS treatment media were prepared by dissolving 2% (v/v) of the oligo-saccharides syrups in FBS-free and antibiotic-free cell culture DMEM. All treatment culture media were free from serum and antibiotics to eliminate any interference from extraneous molecules, proteins or hormones.
After 18 days of culture, a confluent monolayer was obtained with a TEER exceeding 400 Ωcm2 as measured by an EVOM voltohmmeter (World Precision Instruments, Sarasota, FL, USA). Independently, replicates of cells from passages ranging 22 to 26 were gently washed 3 times (at hourly intervals) with warm non-supplemented (serum-free, antibiotic-free) DMEM culture medium and finally replenished from apical and basolateral sides of the Transwell® inserts with oligosaccharides or mock treatment media for 24 h exposure before being harvested for total RNA extraction.

2.3. Integrity of Tight Junctions

Development of tight junction formation was monitored at regular intervals during the monolayers expansion by measuring the TEER across each of the growth inserts with an EVOM voltohmmeter (World Precision Instruments) connected to a pair of chopstick electrodes. Ohmic resistance of a blank (culture insert with respective medium but without cells) was measured in parallel. To obtain the sample resistance, the blank value was subtracted from the total resistance of the sample-containing cells. Final unit area resistance (Ωcm2) was calculated by multiplying the sample resistance by the effective area of the membrane (1.12 cm2 for 12-wells Transwell® inserts). To assess the effect of oligosaccharides on the Caco–2 cell monolayers, the electrical resistance across each cell monolayer was measured prior to exposure (T0) and after 24 h of exposure (T24h) to the treatment media.

2.4. RNA Extraction and Qualification

Cells were gently washed in situ twice with ice cold sterile PBS followed by addition of 500 µl of TRIzol™ reagent (ThermoFisher Scientific, Paisley, UK) ready for harvesting by directly scraping the cells from the culture surface. Harvested cells were transferred to a 2 mL Eppendorf® safe-lock microcentrifuge tube for total RNA extraction according to TRIzol™ reagent manufacturer’s protocol. Purified RNAs were quality-assessed using Agilent TapeStation 2200 system (G2964AA; Agilent, Stockport, UK) with RNA ScreenTape Assay reagents (5067–5576; 5067–5577; 5067–5578 Agilent). The RNA preparations had RIN values within the range 8.2 to 9.7 (mean = 9.24), which were subsequently aliquoted to limit freeze-thaw cycles and stored in −80 °C until cDNA library preparation.

2.5. Library Preparation for mRNA Sequencing

RNA concentrations were measured using Qubit Fluorometer and Qubit RNA BR Assay Kit (Q10211; ThermoFisher Scientific). A Biomek 4000 Automated Workstation (Beckman Coulter, High Wycombe, UK) was used to prepare sequencing libraries. mRNA was purified from 1 µg of total RNA using the NEBNext Poly(A) mRNA Magnetic Isolation Module (E7490; New England Biolabs, Ipswich, UK). Indexed sequencing libraries were then prepared using the NEBNext Ultra directional RNA Library Preparation Kit for Illumina (E7760; New England) and NEBNext Multiplex Oligos for Illumina, Index Primers Sets 1 and 2 (E7335 and E7500; New England Biolabs). Libraries were quantified using Qubit Fluorometer and Qubit dsDNA HS Kit (Q32854; ThermoFisher Scientific). Library fragment-length distributions were analyzed using the Agilent TapeStation 4200 with the Agilent High Sensitivity D1000 ScreenTape Assay (5067–5584 and 5067–5585; Agilent). Libraries were pooled in equimolar amounts and final library quantification performed using KAPA Library Quantification Kit for Illumina (KK4824; Roche, Pleasanton, CA, USA). The library pool was sequenced on an Illlumina NextSeq500 over two High Output 150 cycle kits (FC-404-2002; Illumina, San Diego, CA, USA), to generate over 40 million pairs of 75-bp paired-end reads per sample. The metadata and DNA sequences are available under the NCBI GEO series accession number GSE145303.

2.6. Quality Control and Mapping Analyses

High-throughput sequence reads were quality checked with FastQC (version 0.11.3). Raw reads in FASTQ format were subsequently processed using the Trim Sequences Module in CLC Genomics Workbench 12.03 (Qiagen, Aarhus, Denmark). In this step, clean data were obtained by removing reads from the raw data that contained adapter sequences and those of low-quality, all downstream analyses were performed with high-quality clean data. Using the RNA-Seq Analysis Module in CLC Genomics Workbench 12.03, clean trimmed reads were paired and mapped to Homo sapiens Hg38 (GRCh38 reference genome available in ENSEMBL) thus generating normalized counts of gene and transcript hits as RPKM (reads per kilobase of exon model per million mapped reads) and TPM (transcripts per million). Normalized counts were treated to compute P-values and fold changes (FC) for downstream differential expression analysis. Using the RNA-Seq Analysis Module from CLC Genomics Workbench 12.03, differential expression analysis between oligosaccharides-treated group and mock-treated group was determined using a negative binomial distribution model with the resulting P-values being adjusted to p-adj values using the approach of Benjamini and Hochberg [29] for controlling the false discovery rate (FDR). Genes with absolute FC ≥ 1.5 and p–adj value < 0.05 were designated as significantly differentially expressed (DE). Volcano plots of genes that were differentially expressed were developed using CLC workbench 12.03. Principal Component Analysis (PCA) was carried out using the web-based tool ClustVis [30]. Heatmap diagrams were developed using the Morpheus web-based tool [31] where rows and columns were clustered using Pearson’s correlation distance and average linkage. Venn diagram showing the overlap of differentially expressed genes between GOS and FOS treatments were calculated using the web-based tool InteractiVenn [32].

2.7. Functional Analysis of Differentially Expressed Genes

Functional analysis of significant differentially expressed genes was achieved by implementing bioinformatics tools on gene set enrichment and pathway databases analysis based on Gene Ontology (GO) [33,34] terms and the Kyoto Encyclopedia of Genes and Genomes (KEGG) [35] collection of databases. We investigated statistically significant gene sets modulated by GOS and FOS with | FC value | ≥ 1.5 and FDR p–adj. < 0.05 by implementing hypergeometric distribution within NIPA.Enrichment.R script (v0.6.7.R, https://github.com/ADAC-UoN/NIPA) and applying a minimum of 2 genes enriched, a cut-off q–value = 0.05 for KEGG and GO bases and an enrichment analysis established on “hsa” (Homo sapiens) Ensembl database. Briefly, NIPA.Enrichment.R script executed the bioconductor biomaRt [36,37] package to integrate Ensembl sequence data with data analysis using the GO tool, the Generally Applicable Gene set Enrichment for pathway (GAGE) package performed gene set analysis [38] and Pathview completed pathway-based data integration and visualization [39].

2.8. Quantitative Real-Time PCR Validation

Relative gene expression of DE genes computed by RNA-seq was established by RT-qPCR according to the Minimum Information for publication of Quantitative real-time PCR Experiments (MIQE) guidelines [40]. Sequences of RT-qPCR primers (Eurofins Genomics, Ebersberg, Germany) were designed using National Center for Biotechnology Information (NCBI) primer designing tool (http://www.ncbi.nlm.nih.gov/tools/primer-blast/) [41] and are described in Table 3. cDNA was synthesized using Invitrogen™ SuperScript™ II (18064014, ThermoFisher Scientific) according to the random hexamers primer method previously described [42]. Quantitative RT-PCR was performed using the Applied Biosystems PowerUP™ SYBR™ Green PCR Master Mix (A25742, ThermoFisher Scientific) on a Real-Time PCR LightCycler® 480 System (Roche, Pleasanton, CA, USA). Each sample was processed in triplicate and the expression of genes of interest was normalized to endogenous housekeeping genes GAPDH, PUM1 and ACTB. Amplification protocol comprised one denaturation cycle at 95 °C for 5 min (ramp rate 4.8 °C/s), forty amplification cycles at 95 °C for 15 s, 65 °C for 30 s and 72 °C for 30s (ramp rate 1.5 °C/s). Melting curves were assessed for each RT-qPCR reaction using LightCycler® 480 System software (v 1.5.1.62; Roche, Pleasanton). Resulting PCR product size was confirmed using Agilent TapeStation 2200 system (G2964AA; Agilent) with DNA D1000 ScreenTape Assay (5067-5582 and 5067-5583; Agilent). Primer sets were validated for specificity when melting curves analysis exhibited a single peak with Tm > 78 °C and amplified product size matched expected product size as established by the NCBI primer designing tool. Relative gene expression was calculated using the relative quantification method with amplification efficiency corrected calculation models [43,44]. Amplification rate and relative concentration was calculated using LightCycler® 480 System software (v 1.5.1.62; Roche, Pleasanton) based on a linear regression slope established by 2-fold dilution series of a pool of all RNA samples.

2.9. Statistical Analysis

TEER experimental results are expressed as mean ± standard deviation, the differences between groups were evaluated by one-way ANOVA using Genstat 19th edition (VSNI Ltd, Hemel Hempstead, UK), where p-values < 0.05 were considered statistically significant. Within CLC Genomics Workbench 12.03, differential gene expression statistical analysis was based on Baggerly’s beta-binomial model [45] to account for between-library variability; two-sided p-values for the test are described as “p-value”. p-values were subsequently corrected for false discovery rate FDR (“p-adj values”) using the Benjamini and Hochberg’s approach [29]; p-adj value < 0.05 was considered significant. For functional analysis, a hypergeometric distribution model generated q-values [46]; a minimum of 2 genes enriched with q-values < 0.05 for KEGG and GO enrichment were used as the criteria for reporting.

2.10. Data Availability

The data discussed in this publication have been deposited in NCBI’s Gene Expression Omnibus database and are accessible through GEO series accession number GSE145303 (https://www.ncbi.nlm.nih.gov/geo/query/acc.cgi?acc=GSE145303). The project appears in the NCBI database within Bioproject PRJNA606703 (https://www.ncbi.nlm.nih.gov/bioproject/PRJNA606703).

3. Results

3.1. Influence of GOS and FOS on Epithelial Monolayer Tight Junction Integrity

To assess the direct effect of dietary GOS and FOS, cells were exposed to tailored media containing the oligosaccharides. The presence of mono- and di-saccharides contained in GOS and FOS syrups used for treatment was accounted for in the control mock media for Nutrabiotic® GOS 64% by incorporating galactose, glucose and lactose and by inclusion of fructose, glucose and sucrose for Orafti®L95 FOS. The treatment of Caco–2 cell monolayers with GOS generated a significant increase in the TEER values (Figure 1, TEER +33.62%, p = 0.00037) when compared to the mock-exposed cells. Similarly, FOS also induced greater TEER when compared to the mock-exposed cells (Figure 1, TEER +28.68%, p = 0.054). The rise in trans-epithelial electrical resistance of the monolayer suggest an acceleration of the tight junction dynamics that indicates an improvement of the monolayer integrity under the influence of the oligosaccharide treatments.

3.2. Transcriptome Sequencing and Functional Annotation

The effect of GOS and FOS preparations on the global transcriptome of Caco–2 cell monolayers were assessed by RNA-seq using the Illumina NextSeq sequencing platform. RNAs were harvested from three biological replicates for each treatment group and mRNA sequencing generated between 44 and 134 million paired-end reads of 75-bp per sample. An average of 88.67% good-quality paired-end reads per sample were mapped to Homo sapiens Hg38 reference genome. The summary of RNA-seq data and mapping for each sample are presented in Table 4. Gene and transcript normalized hit counts were used to generate FC and FDR adjusted p-values to implement differential gene expression analysis.

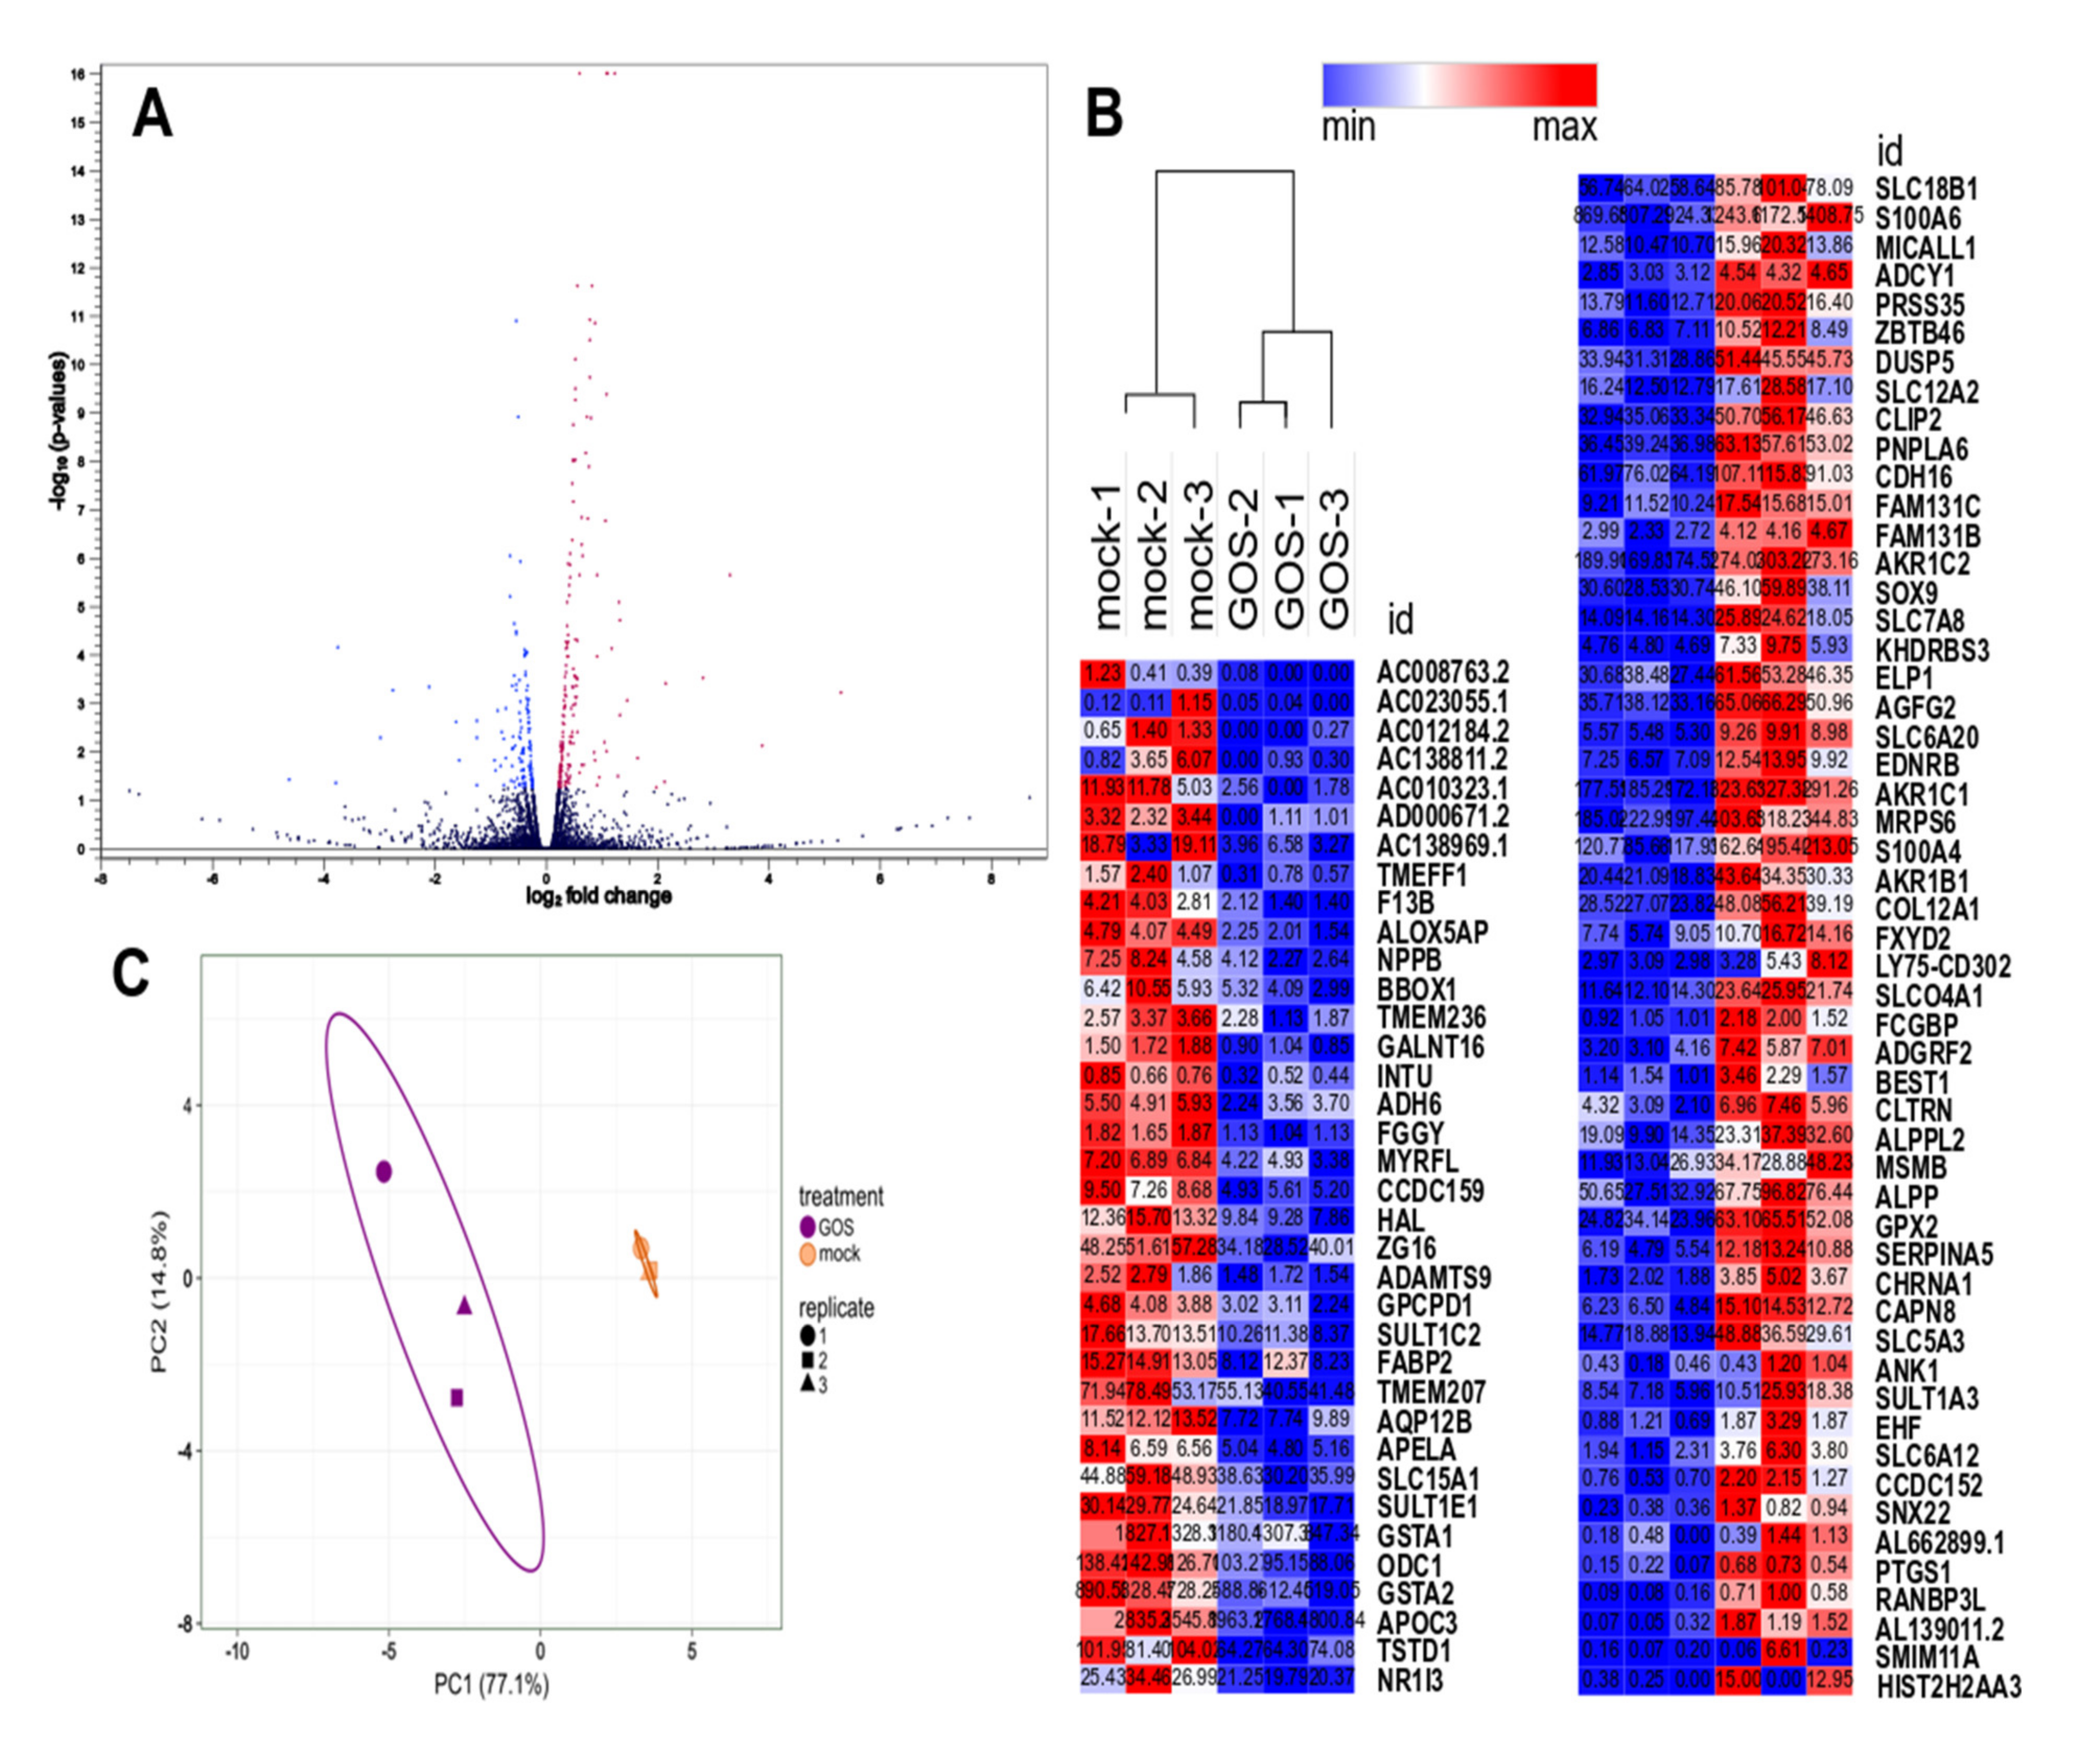
3.3. Analysis of Differential Gene Expression

Volcano plots were generated to visualize the distribution of differentially expressed genes following GOS and FOS exposure (Figure 2A and Figure 3A respectively), which showed a limited number of genes modulated by FOS when compared to GOS. Principal component analysis of the normalized transcript counts (TPM) disclosed a tight relationship between biological replicates within each treatment group such that oligosaccharides-exposed samples clustered distinctly from their mock-treated counterparts. As a result, the first two principal components taken together explained 91.9% and 87.8% of the variability among the samples exposed to GOS and FOS when compared to mock treated cells (Figure 2B and Figure 3B respectively). We further examined the distribution of differentially expressed genes exhibiting FDR p-adj < 0.05 and |FC| ≥ 1.5 using heatmaps, which are presented in Figure 2C and Figure 3C for the GOS and FOS treatments respectively. Following exposure to GOS, 89 genes were differentially expressed according to the criteria, of which 53 were up-regulated and 36 down-regulated when compared to control mock-treated cells (Figure 2C and Table S1). Whereas for FOS, the total number of genes fulfilling the criteria for differential expression was limited to 12, comprising of eight up-regulated and four down-regulated genes (Figure 3C and Table S1). GOS- and FOS-treated cells shared five differentially expressed genes as presented in the Venn diagram shown in Figure 3D: TMEFF1, GPX2, SLC5A3, SULT1A3, AL139011.2. Three of these genes were up-regulated upon exposure to GOS and FOS treatments (GPX2, SLC5A3 and AL139011.2) and two genes showed the opposite modulation such that TMEFF1 transcripts were reduced upon GOS exposure whilst increased with FOS treatment, and SULT1A3 transcription was increased with GOS but reduced with FOS exposure.

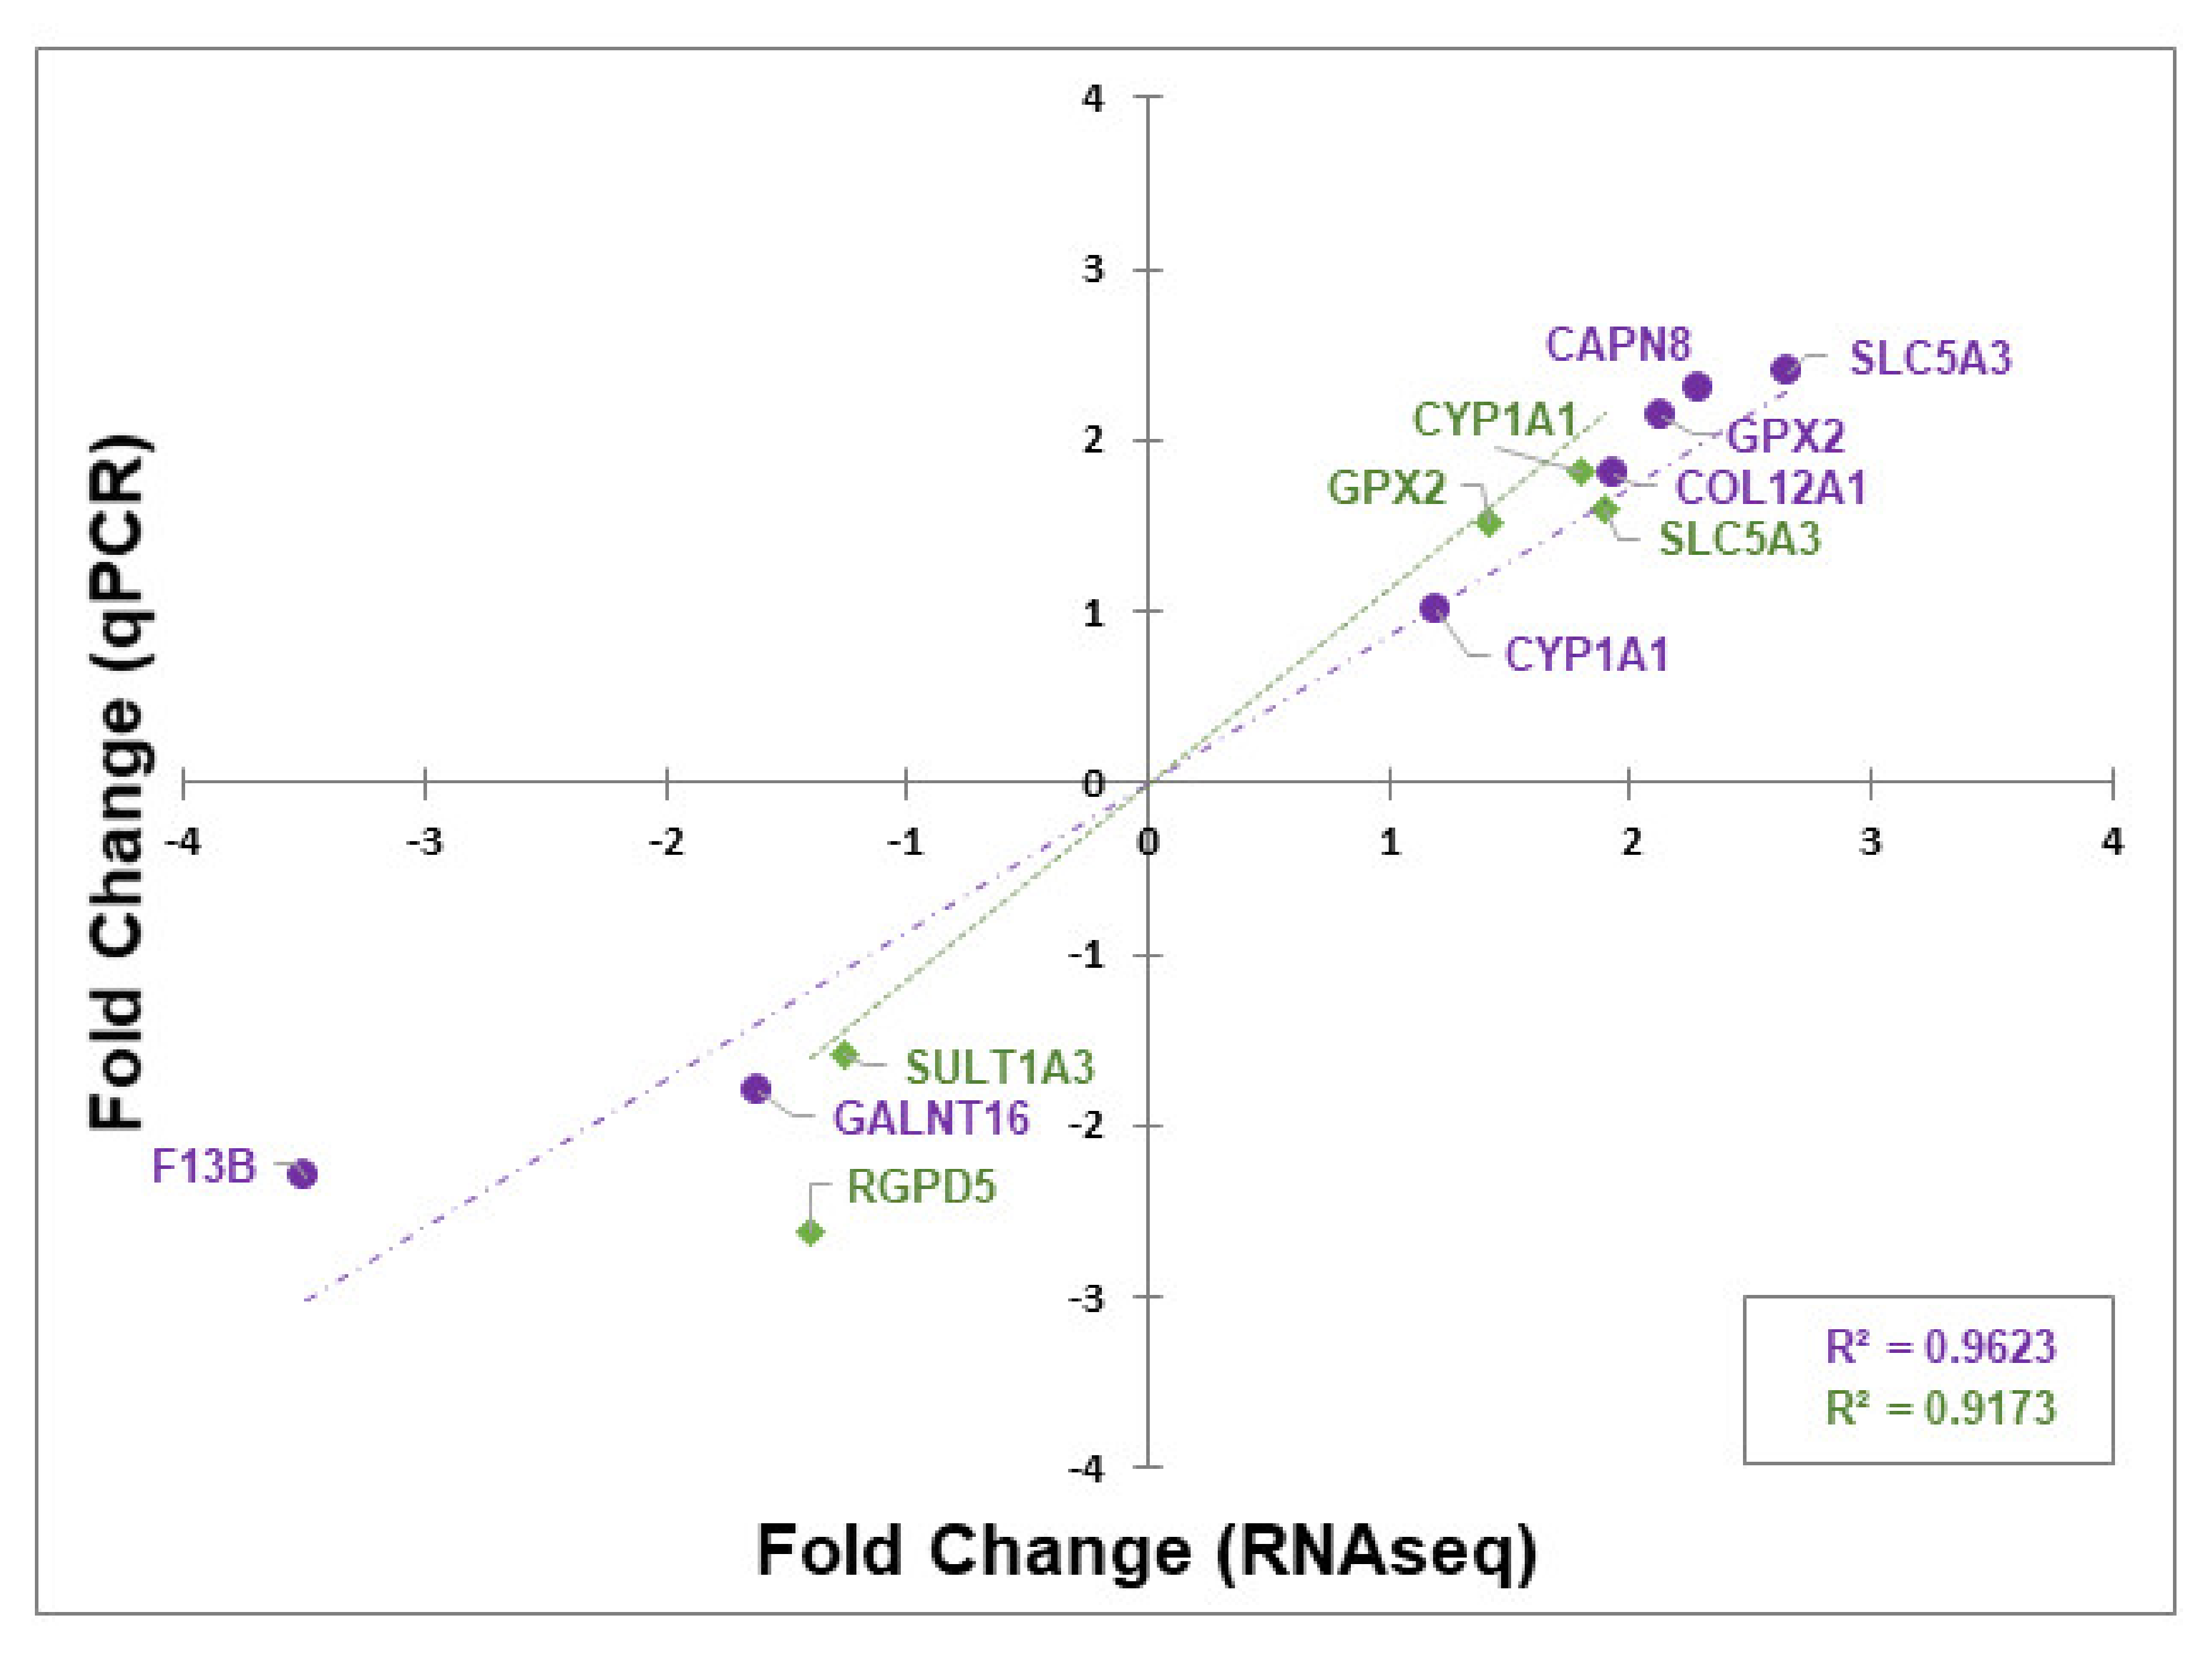
3.4. Validation of Differentially Expressed Genes by RT-qPCR

RNA-seq data was independently validated by RT-qPCR measurement of the transcript levels of genes identified as differentially expressed (RT-qPCR raw data presented in Table S2). Results revealed strong correlation between the RNA-seq and RT-qPCR differential expression data for the GOS and FOS treatments (Figure 4; GOS R2 = 0.9623 and FOS R2 = 0.9173). Accordingly, genes GPX2 (RT-qPCR GOS FC = +2.1; FOS FC = +1.4) and SLC5A3 (RT-qPCR GOS FC = +2.7; FOS FC = +1.9) were found up-regulated simultaneously with GOS and FOS treatments. Consistent with the GOS RNA-seq data, genes F13B (RT-qPCR FC = −3.6) and GALNT16 (RT-qPCR FC = −1.6) were found to be down-regulated whilst COL12A1 (RT-qPCR FC = +1.9) and CAPN8 (RT-qPCR FC = +2.3) were up-regulated. Similarly, congruency was observed for the FOS treatment-associated up-regulated gene CYP1A1 (RT-qPCR FC = +1.7) and down-regulated genes SULT1A3 (RT-qPCR FC = −1.3) and RGPD5 (RT-qPCR FC = −1.4).

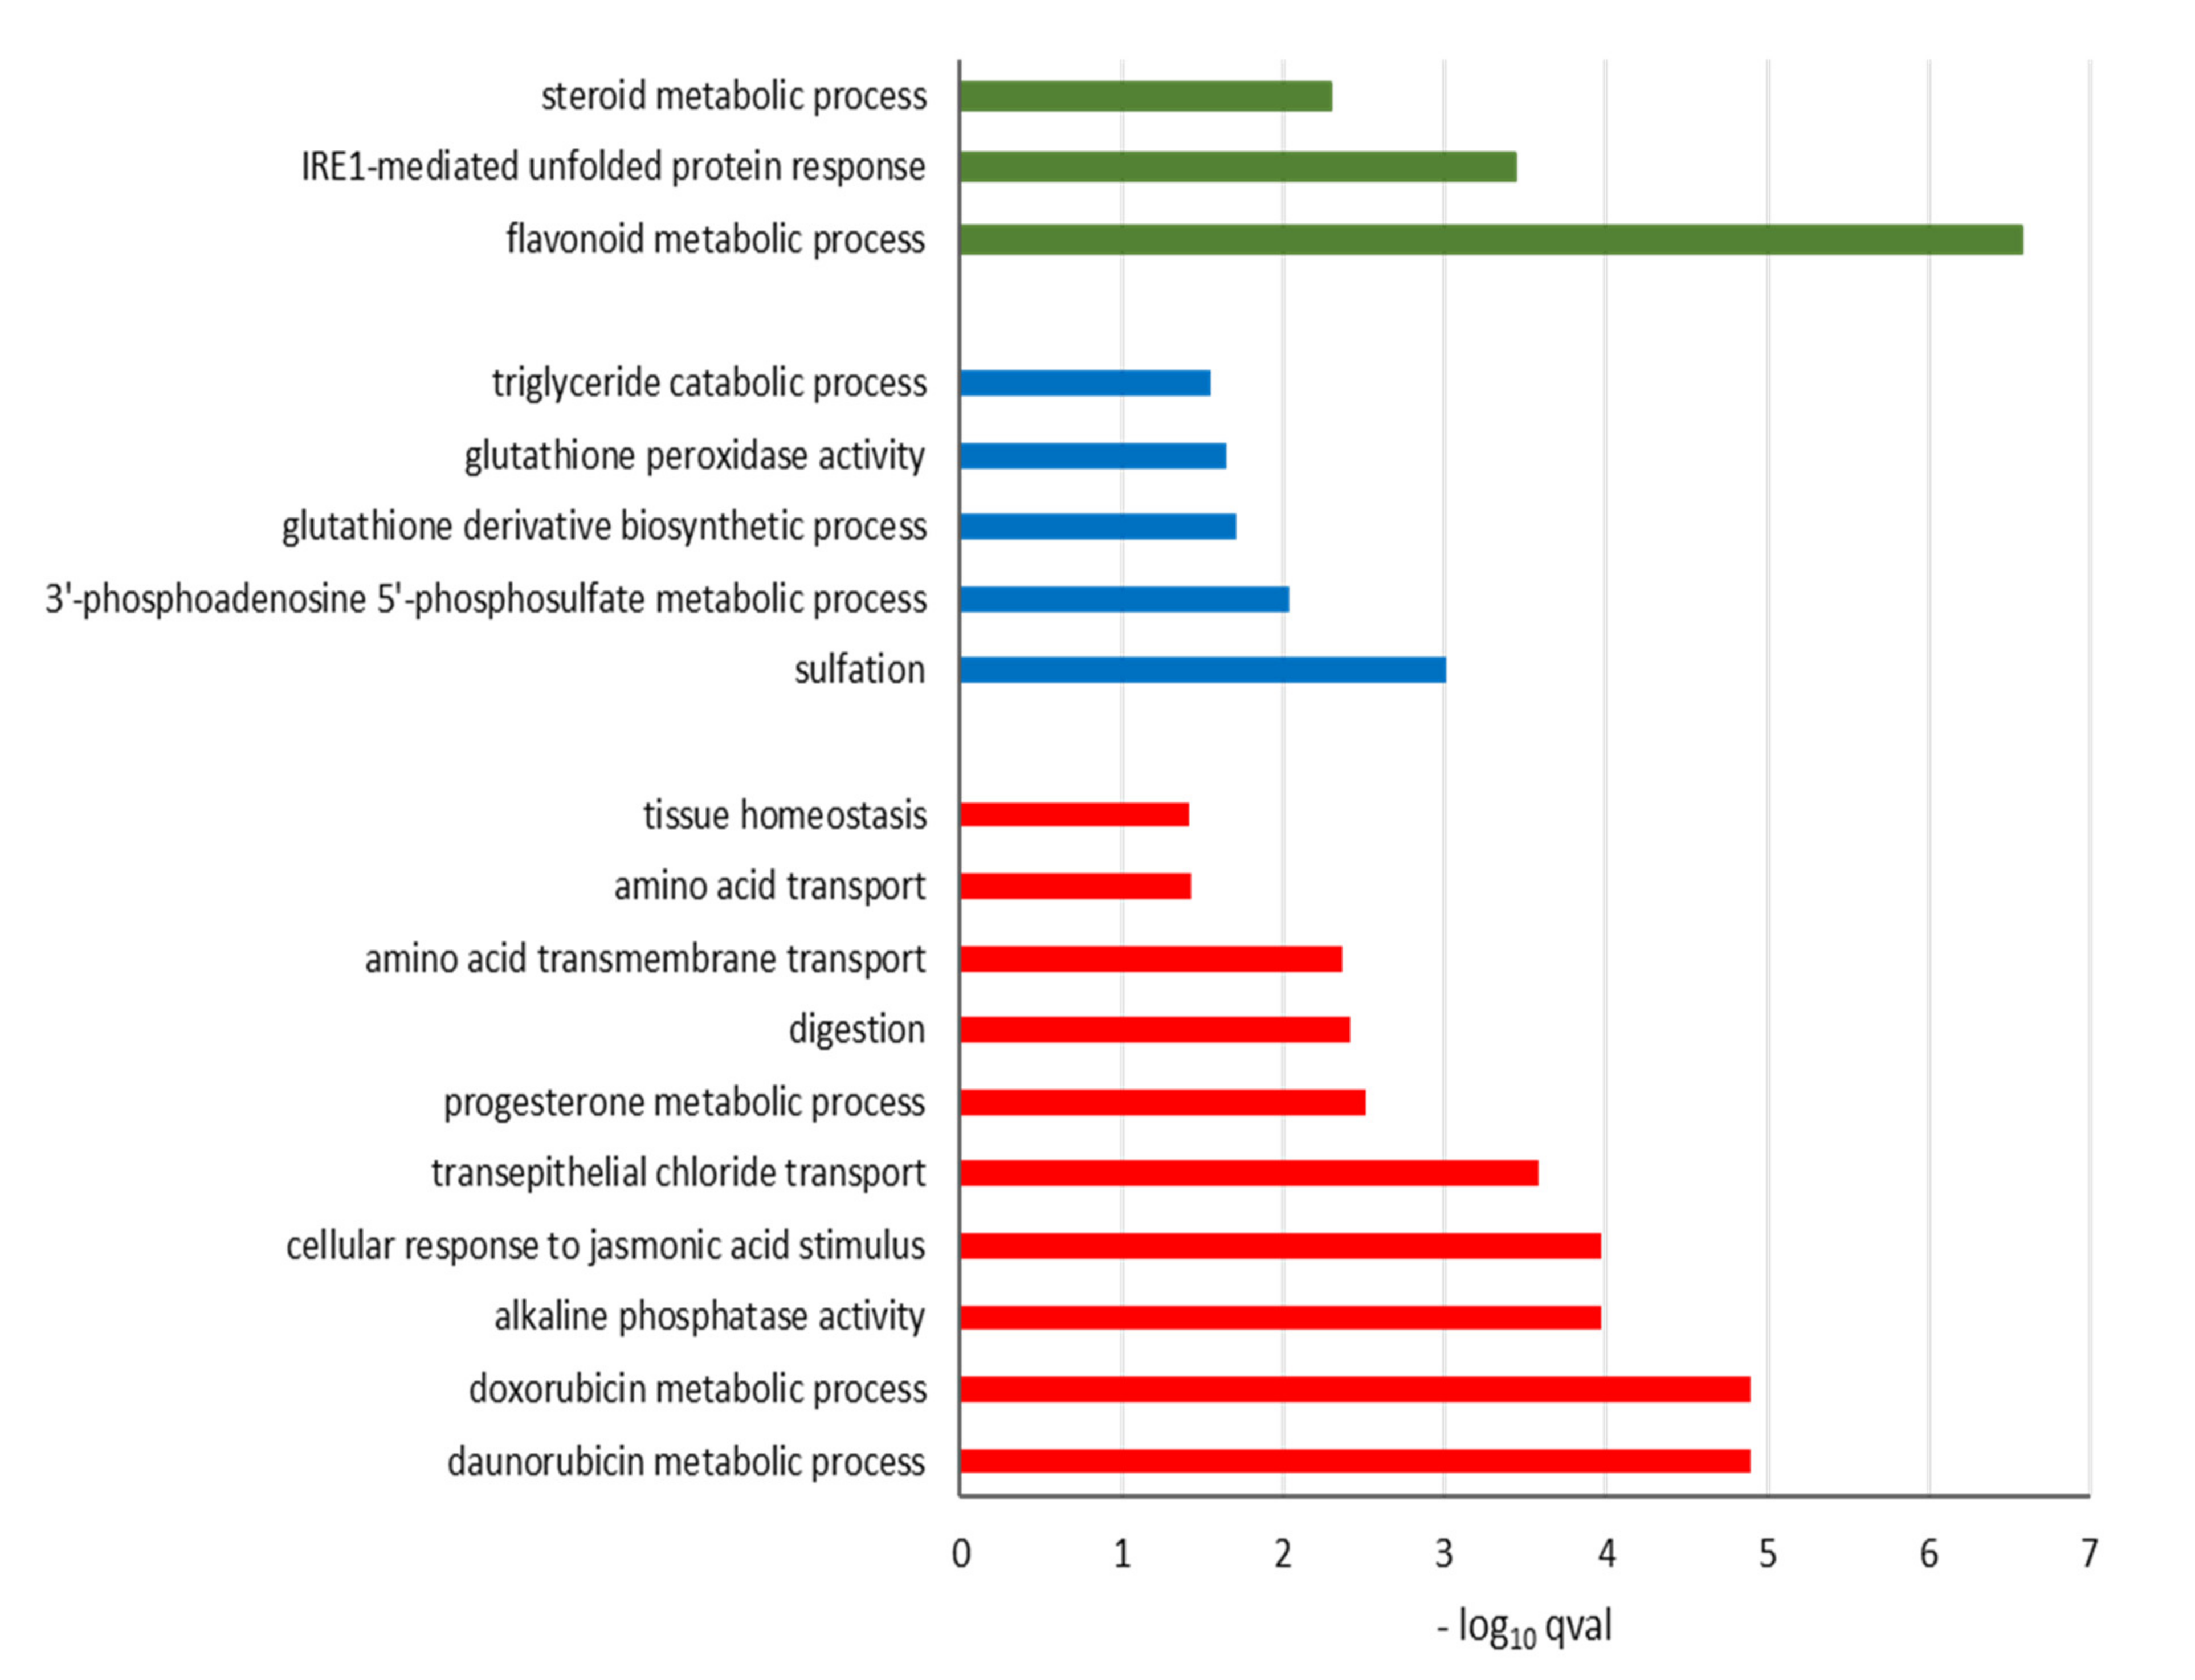
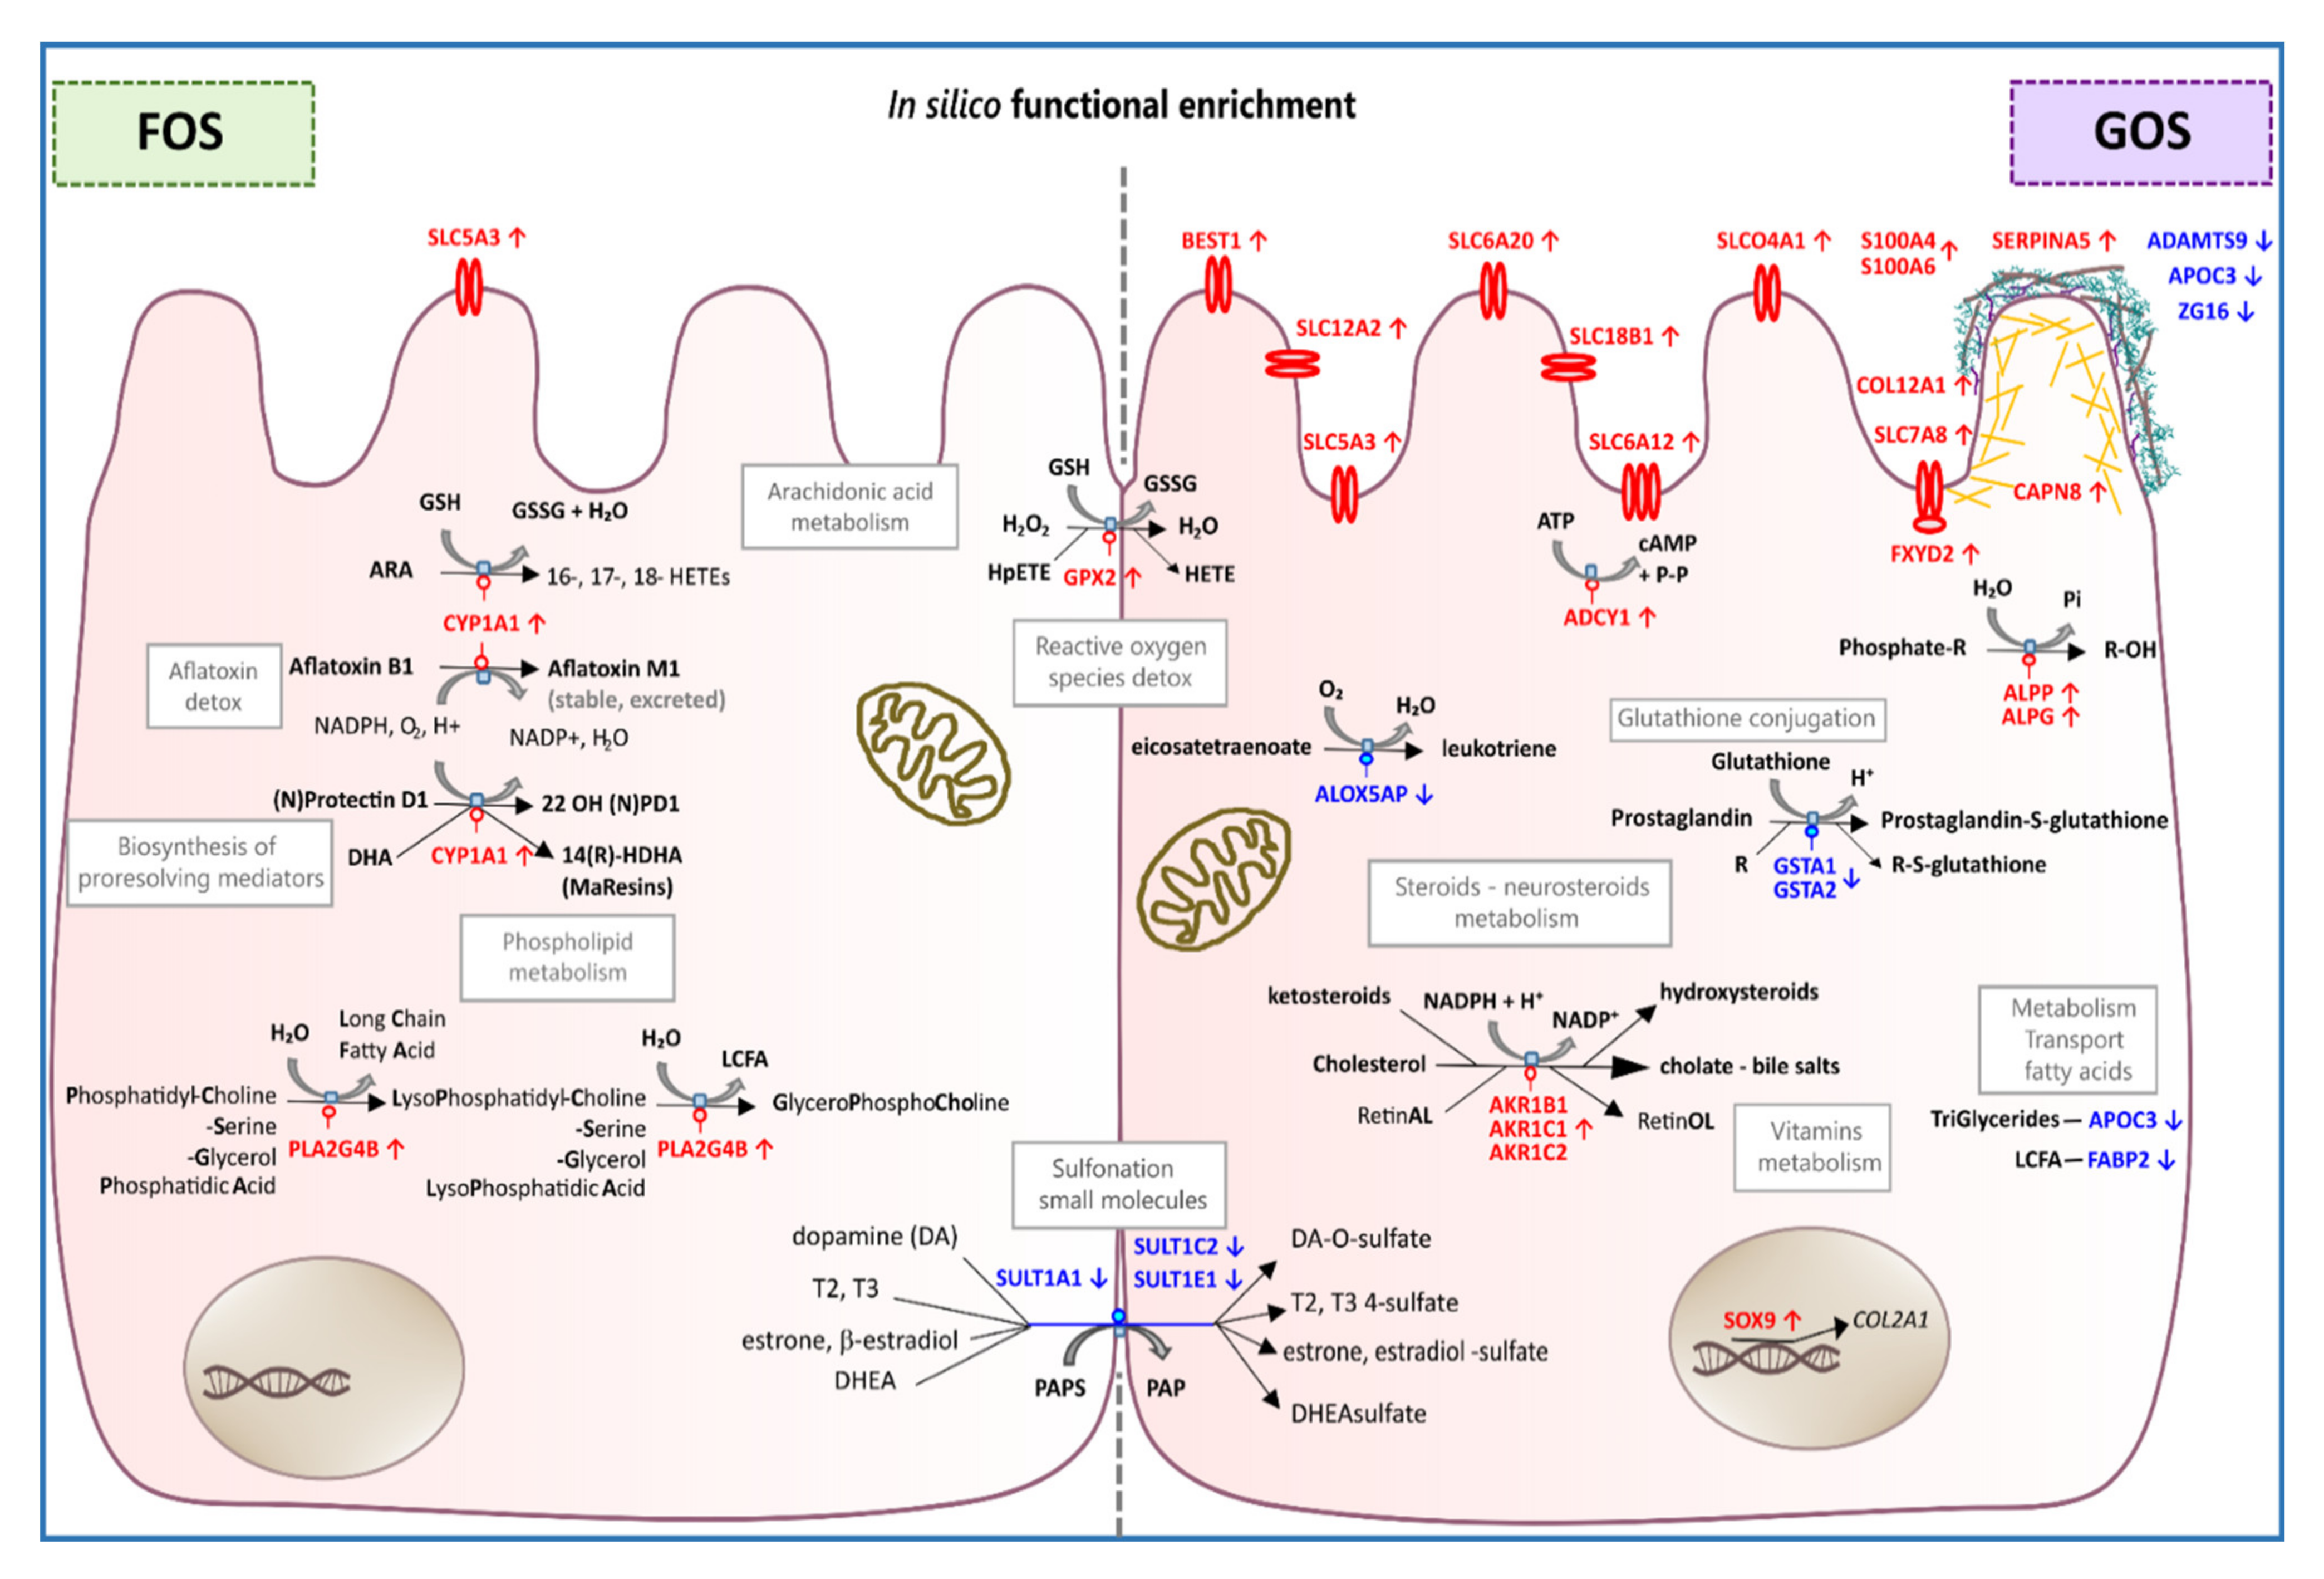
3.5. Functional Analysis of Differentially Expressed Genes

Biological attribute identification and functional interpretation of our data was achieved by implementing bioinformatics tools on gene set enrichment and pathway database analyses based on Gene Ontology (GO) terms and the Kyoto Encyclopedia of Genes and Genomes (KEGG) collection of databases. The KEGG knowledge base links gene catalogues to functional information such as metabolism, membrane transport, signal transduction and cell cycle in pathway assemblies. GO resource provides computable knowledge for biological functions of genes and gene products structured within biological process, molecular function and cellular component classes.
GO classification of the 89 differentially expressed (DE) genes associated with GOS exposure placed the up-regulated genes within 10 GO terms (Figure 5) describing metabolic processes (daunorubicin, doxorubicin and progesterone metabolic processes, alkaline phosphatase activity and digestion), cell membrane transport (transepithelial chloride transport, amino acid transmembrane transport) and tissue homeostasis. KEGG analysis of the gene sets (Table 5) indicated the up-regulated gene-associated pathways were enriched for metabolic processes featuring folate biosynthesis (hsa00790), thiamine metabolism (hsa00730), thyroid hormone synthesis (hsa04918), protein digestion and absorption (hsa04974), membrane transport with salivary (hsa04970) and pancreatic (hsa04972) secretion. The GOS down-regulated genes were placed in five GO terms (Figure 5) that identified processes related to sulfation, 3’-phosphoadenosine-5’-phosphosulfate sulfotransferase, glutathione derivative biosynthesis, glutathione peroxidase activity and triglyceride catabolism. The down-regulated GO terms were further identified in KEGG (Table 5) as reduced glutathione metabolism (hsa00480), chemical carcinogenesis (hsa05204), drug and xenobiotics metabolism-cytochrome P450 (hsa00982 and hsa00980). A further seven DE genes were enriched in a unique GO cell compartment described as the collagen-containing extracellular matrix (GO:0062023, p–adj.= 0.018) involving three down-regulated and four up-regulated genes (Table 6).
Gene Ontology analysis of the 12 DE genes linked with FOS treatment revealed bioprocesses (Figure 5) involved in flavonoid metabolism, IRE1-mediated unfolded protein response and steroid metabolism represented by the genes SULT1A3 (FC = –1.6, p–adj. = 0.0178), CYP1A1 (FC = +1.8, p-adj. < 1.10−12 ) and PLA2G4B (FC = +3.7, p–adj. = 0.008). Analysis of the KEGG pathways (Table 5) revealed increases in pathways linked with ovarian steroidogenesis (hsa04913), arachidonic acid metabolism (hsa00590) and general metabolic pathways (hsa01100). GO analysis also identified the mitochondrial inner membrane (GO:0005743) as a unique cell compartment, as represented by three up-regulated genes CYP1A1, PLA2G4B and NDUFC2-KCTD14 (p–adj. = 0.002, Table 6).

4. Discussion

Non-digestible oligosaccharides are prebiotics able to selectively stimulate the components of gut microbiota beneficial to host health [47]. A consequence of non-digestion is that they will reach the colon intact to exert any non-prebiotic effects on the intestinal epithelium. In this study, we addressed the hypothesis that oligosaccharides could directly affect the transcriptome of epithelial cells representative of the intestinal mucosa and have exploited RNA-seq methodology to describe the transcriptome of confluent Caco–2 cell monolayers exposed to the GOS and FOS.
The Caco–2 cell line model was chosen for its ability to form tight junctions and microvilli, thus expressing enzymes and transporters characteristic of enterocytes [48,49]. A number of in vitro studies have evaluated the impact of various prebiotics on the cell barrier integrity when subject to pathogen-induced barrier disruptions [50,51], inflammation-inducing cytokines and lipopolysaccharides [52] or toxin-induced challenge with the mycotoxin deoxynivalenol [53]. Here, exposure to GOS (1.4% w/v) increased trans-epithelial electrical resistance of the monolayer suggesting GOS can improve the integrity of the tights junctions. FOS (2% w/v) exposed cells similarly increased trans-epithelial electrical resistance despite marginally failing to meet significance. We sought to understand these effects and any wider transcriptional responses to GOS and FOS by establishing differential gene expression using RNA-seq. Differential expression was determined in prebiotic-treated Caco–2 cell monolayers with respect to tailored mock exposure to the saccharides present in the GOS and FOS preparations.
Differentially expressed genes were used as the basis for in silico approaches to assess the functional consequences. The biological significance of a given fold-change is likely to depend on the gene and on the experimental context, and for this reason, universal thresholds are not applied for the bioinformatic interrogation of transcriptomic data [54,55,56]. We have adopted a stringent statistical approach through the use of Benjamini and Hochberg’s false discovery rate correction for multiple testing to establish the criteria of FDR adjusted probability p-adj < 0.05 and an inclusive absolute fold change ≥ 1.5 to identify differential gene expression. We opted for the inclusive value of ≥ 1.5-fold change since it has been demonstrated that the enrichment of biologically relevant functions can occur at low fold changes in RNA levels when appropriate statistical methods are employed [57]. However, despite steady-state observations that protein levels are generally determined by transcript concentrations, there are frequent differences observed between transcriptomic and proteomic assessments of expression during cellular transitions [58]. A total of 89 DE genes were identified between GOS and mock treated cells, whereas for FOS exposure the number was reduced to 12 DE genes. The RNA-seq data from both experiments were validated by RT-qPCR using specific primer sets. Strong correlations were observed between the fold-change determined for the two methods with R2 = 0.96 for GOS and R2 = 0.92 for FOS treatments. The DE data were used for GO term enrichment and KEGG analyses to identify transcriptional pathways responding to prebiotic oligosaccharide exposure. Modulation of the pathways identified are discussed below and are summarized in Figure 6 for reference.

4.1. FOS Treatment Associated with 12 Differentially Expressed Genes

FOS treatment resulted in 12 DE genes comprising of four down-regulated and eight up-regulated genes. GO terms identified the up-regulated genes SULT1A3, CYP1A1 and PLA2G4B as related to flavonoid metabolism, IRE1-mediated unfolded protein response and steroid metabolism. Interrogation of the KEGG database confirmed these three genes are functional in ovarian steroidogenesis and arachidonic acid metabolism (FDR q–val < 0.001) and general metabolic pathways (FDR q–val = 0.013). CYP1A1 encodes a Cytochrome P450 monooxygenase exhibiting high catalytic activity for steroid hormones [59] and hydroxylation of certain polyunsaturated fatty acids (PUFA) [60], whereas PLA2G4B encodes phospholipase A2 that preferentially catalyzes hydrolysis of arachidonoyl phospholipids to release lysophospholipids and fatty acids, with a preference for arachidonoyl phospholipids. The products of these genes also form a nexus with the phosphatidylinositol 4-kinases products of AC104662.2 and PI4K2B around cell signaling, lipid and membrane trafficking pathways [61]. In the absence of direct evidence for any transcriptional changes of the genes encoding tight junction proteins to affect the increases in TEER observed, it is conceivable that FOS exposure results in compositional changes in membrane sterols and phospholipids that affect the physical properties of the cell membrane, altering rigidity/fluidity leading to stabilization or disruption [62]. This contrasts with the direct effect, although not attributed to oligosaccharides, reported on the expression of CLDN4, encoding the epithelial cell tight junction protein Claudin 4, in Caco–2 cells exposed to complex food homogenates of apple, broccoli and button mushroom [63].

4.2. GOS Treatment Associated with 53 up-Regulated Genes

GOS treatment led to 53 up-regulated genes that associated with 10 GO terms. Genes AKR1C1, AKR1C2 and AKR1B1 were related to the terms daunorubicin and doxorubicin metabolic process, cellular response to jasmonic acid stimulus, progesterone metabolic process and digestion (FDR q-val < 0.005). These genes encode enzymes harboring oxidoreductase and aldo-keto reductase activities that target steroids and prostaglandins with varying levels of bile acid-binding affinity. Progesterone metabolic process and cellular response to jasmonic acid stimulus relate also to up-regulation of AKR1C1 and AKR1C2 genes due to their catalytic activity related to androgens inactivation (progesterone and testosterone respectively). Despite its plant origin, jasmonic acid is an oxylipin-signaling molecule often considered a structural and functional analogue to prostaglandins in animals. Mammalian eicosanoids and oxylipins such as prostaglandins and leukotrienes are active signaling molecules derived from oxygenated PUFAs and are potent regulators of host immune responses. Notably, mammalian prostaglandins and leukotrienes (products of arachidonic acid metabolism) can polarize macrophages, modulate T helper cell immune responses, stimulate chemokine production, phagocytosis, lymphocyte proliferation and leukocyte chemotaxis [64].
GO also associated AKR1C1 and AKR1C2 with CAPN8 within digestion processes. CAPN8 encodes tissue-specific calpain 8a (cytosolic calcium-dependent cysteine protease), which in mice is reported to be expressed specifically in the mucus-secreting pit cells of the gastric mucosa as well as in a subset of goblet cells in the small intestine [65]. Calpains are also implicated in membrane trafficking processes due to their localization in endoplasmic reticulum, Golgi and lipid rafts [66,67]. The KEGG protein digestion and absorption pathway (hsa04974) identified the genes SLC7A8, COL12A1 and FXYD2, which respectively encode L-type amino acid transporter 2, collagen type XII alpha 1 chain and Na/K-transporting ATPase subunit gamma suggesting specific amino acid transport and focused structural protein remodeling. The KEGG pancreatic secretion (hsa04972) and salivary secretion (hsa04970) pathways featured the up-regulated genes SLC12A2 encoding a basolateral Na-K-Cl symporter and ADCY1 encoding Ca2+/calmodulin-activated adenylyl cyclase. These activities are linked as Ca2+ and cAMP can regulate intestinal Na-K-Cl symporter activity [68]. Related to this, the GO terms transepithelial chloride transport (FDR q-val < 0.001) and amino acid transport (FDR q-val < 0.05) identified genes for ion channel and solute carrier proteins (BEST1, SLC12A2, SLC6A20, SLC7A8 and SLC6A12). Several solute carrier encoding genes were up-regulated (SLC7A8, SLC6A20, SLC6A12, SLCO4A1, SLC12A2, SLC5A3 and BEST1) that feature in Reactome pathway analyses related to amino acid transport across the plasma membrane and the transport of small molecules. Two bioprocesses relevant to the digestion pathway were enriched in KEGG folate biosynthesis (hsa00790) and thiamine metabolism (hsa00730) pathways. Genes ALPP and ALPG encoding intestinal and placental-like alkaline phosphatase respectively were identified with AKR1B1 encoding aldo-keto reductase. AKR1B1 in association with SOX9 was identified as enriched constituents of the GO tissue homeostasis pathway. SOX9 encodes SRY-Box Transcription Factor 9 that binds to the COL2A1 promoter to activate cartilaginous tissue-specific Collagen Type II Alpha 1 Chain protein expression, which has an essential role in skeletal development and contributes to the ability of cartilage to resist compressive forces. Collectively, these data are consistent with the hypothesis that GOS elicits energy-dependent transmembrane trafficking of solutes in Caco–2 cell monolayers accompanied by collagen and cytoplasmic membrane remodeling that may be linked to the observed increases in TEER.

4.3. GOS Treatment Associated with 36 Down-Regulated Genes

Of 36 DE genes found down-regulated following GOS exposure, seven DE genes were annotated in enriched GO bioprocess terms associated with sulfation and 3’-phosphoadenosine 5’-phosphosulfate metabolic process (genes SULT1E1 and SULT1C2), glutathione peroxidase activity and derivative biosynthetic process (genes GSTA2, GSTA1 and ALOX5AP), and triglyceride catabolic process (genes APOC3 and FABP2). All these genes encode proteins related to fatty acid and arachidonic acid metabolism. Genes SULT1E1 and SULT1C2, encode sulfotransferases responsible for sulphate conjugation of many hormones (such as estrogens), neurotransmitters and xenobiotic compounds. GSTA2 and GSTA1 encode alpha-glutathione S-transferases (GSTs) involved in the synthesis of prostaglandins (PGs) and leukotrienes and are thus responsible for the metabolization of electrophilic compounds including carcinogens, therapeutic drugs and the by-products of oxidative stress. Notably, through eicosanoid metabolites GSTs can play a central role as regulators of transcription factor peroxisome proliferator-activated receptor γ (PPARγ) [69,70]. In mammals, overexpression of GSTs in tumor cells has been implicated with resistance to various anti-cancer agents and chemical carcinogens and in microbes, plants and mammals, expression of GSTs are up-regulated by exposure to pro-oxidants, thus suggesting that induction of GST is an evolutionary conserved response of cells to oxidative stress [71]. ALOX5AP encodes arachidonate 5-lipoxygenase activating protein required for leukotriene biosynthesis by 5-lipoxygenase (ALOX5). The products of LOX metabolism either represent biologically active eicosanoid metabolites such as hydroperoxy–eicosatetraenoic acids (HPETEs) or give rise to the production of reactive oxygen species (ROS). A functional role has also been attributed to lipoxygenase-catalyzed arachidonic and linoleic acid metabolism in cancer development [72,73]. APOC3 encodes apolipoprotein C3, a protein component of the triglyceride (TG)-rich lipoproteins (TRLs) and FABP2 encodes intestinal-type Fatty Acid-Binding Protein—an intracellular fatty acid-binding protein that participates in the uptake, metabolism and transport of long-chain fatty acids. This lends further support to the reconfiguration of fatty acid metabolism in response to GOS treatment whilst maintaining homeostasis.
GO cell compartment analysis identified the collagen-containing extracellular matrix based on the down-regulation of APOC3, ZG16 and ADAMTS9 and up-regulation of COL12A1, S100A4, S100A6 and SERPINA5. Gene APOC3 encodes a liver and small intestine-secreted apolipoprotein C-III (apoC-III) found with triglyceride-rich lipoproteins, such that increases in apoC-III levels induces the development of hypertriglyceridemia and overexpression can contribute to coronary heart disease in humans [74,75]. Following exposure to GOS, APOC3 was down-regulated thus suggesting that a reduction in apoC-III levels could be beneficial for triglyceridemia. However, ZG16 and ADAMTS9, which have been ascribed roles in the control of cancer development, were also down-regulated. Zymogen granule protein 16 (ZG16) is one of the most significantly down-regulated genes in colorectal cancer (CRC) and harbors a jacalin-like lectin domain. Lectins are carbohydrate-binding proteins able to detect subtle differences between complex carbohydrate structures, thus recognizing specific sugars to carry out various functions including cell attachment, migration and invasion. Amongst these, some galectins share an affinity for simple β-galactoside moieties [76]. ZG16 may be an important component of the protective mucus layer, which helps separate host epithelium from commensal bacteria in the colon [77]. The high similarity of ZG16 to jacalin suggests that the human homologue may play an important role in colon cancer immunity. The loss of ZG16 associated with CRC development has led to the hypothesis that ZG16 reduction may disrupt well-organized bacterial surveillance systems to facilitate bacterial invasion of host tissues and cause local inflammatory changes, which may constitute an increased risk for the development of cancer [78]. ADAMTS9 encodes a member of the ADAMTS (a disintegrin and metalloproteinase with thrombospondin motifs) protein family, a secreted mammalian metalloprotease that localizes to the cell-surface and/or extracellular matrix. The extracellular matrix is continuously remodeled by coordinated biosynthesis and proteolysis of its components. Active proteolytic ADAMTS9 has been shown to interact with fibronectin and disrupt fibril networks [79]. Furthermore, it has been suggested ADAMTS9 contributes to the suppression of tumorigenesis by decreasing cell proliferation, inducing cell apoptosis and inhibiting angiogenesis through regulating the AKT/mTOR signaling pathway, whilst methylation of ADAMTS9 genes is associated with poor survival of gastric cancer patients [80].
Collagen-containing extracellular matrix enriched genes S100A4 and S100A6 were found to be up-regulated following treatment with GOS. Proteins S100A4 and S100A6 are members of the S100 calcium binding protein family that exert biological functions via interactions with target proteins. Many kinds of cells including fibroblasts, immune cells, and cancer cells can produce S100A4, which are released into the extracellular space in response to various stimuli such as activated normal T cell expression and secreted factors (RANTES) produced by the tumor cells. S100A4 could be involved in the regulation of cell proliferation and differentiation, apoptosis, Ca2+ homeostasis, and energy metabolism [81]. Sun et al. demonstrated that mice deficient in S100A4 exhibited impaired humoral and cellular immunity after mucosal immunization using Cholera toxin as adjuvant, revealing a reduced production of Th1, Th2 and Th17 cytokines [82]. Protein S100A6 has been described in a limited number of cell types in adult normal tissues and in several tumor cell types. As an intracellular protein, S100A6 has been implicated in the regulation of several cellular functions, such as proliferation, apoptosis, cytoskeleton dynamics and cellular response to different stress factors. S100A6 can be secreted/released by certain cell types which points to extracellular effects of the protein such as antimicrobial activity [83]. Similar up-regulation was observed for gene SERPINA5 encoding Protein C inhibitor (PCI), a serine protease inhibitor of serpin type that is found in most tissues and fluids, including blood plasma, seminal plasma and the urine of humans [84]. As an antimicrobial agent, PCI has the ability to disrupt the bacterial cell wall to cause death by interacting with lipid membranes leading to permeabilization of bacterial pathogens [85]. PCI also inhibits proteases of the blood coagulation and fibrinolysis system, whilst in cancer cells it suppresses tumor invasion by inhibiting urokinase-type plasminogen activators and inhibits tumor growth and metastasis, which are independent of its protease-inhibitory activity [86]. Lastly, COL12A1 encoded collagen XII is a member of the family of fibril-associated collagens with an interrupted triple helix (FACIT) structure. Mutations in the collagen XII gene associated with extracellular matrix-related myopathy, as the protein functions to preserve muscle and bone architecture through collagen fibril organization [87,88].

5. Conclusions

In this study, the direct effects of GOS and FOS on colonic epithelial cells were assessed through changes in monolayer transepithelial resistance and transcriptome analysis. Results suggest GOS have the potential to directly increase integrity of the epithelial barrier. Transcriptome data suggest TEER increased independent of specific tight junction protein expression but could be due to sterol/fatty acid compositional changes associated with transporter-dependent remodeling of the cell membrane. Specific candidate pathways group the genes involved in digestion and transepithelial transport, which contribute to intestinal cell integrity and function.
Carbohydrates have enormous potential to encode biological information. It is conceivable that GOS and FOS can crosstalk with cells using lectin molecules as the interface. Typically, lectins and their complimentary carbohydrate are located on the surfaces of opposing cells, which can be of the same type or different types. Such interactions are required for cell differentiation, development and pathological states. These results highlight concerted effects on transmembrane trafficking, differences in xenobiotic biotransformation, and the production of antimicrobial agents.
GOS and FOS treatments shared relatively few differentially expressed genes, suggesting they have different modes of action. Our strategy has produced a comprehensive database of gene expression profiles of Caco–2 cell monolayers exposed to oligosaccharide food ingredients, allowing further work to link gene expression signatures of cultured cells to their mode of action, and thus potentially facilitating product choice in human or animal intervention studies.

Supplementary Materials

The following are available online at https://www.mdpi.com/2072-6643/12/5/1281/s1, Supplementary Table S1: GOS and FOS gene expression browser, Table S2: RT-qPCR raw data.

Author Contributions

Conceptualization, N.M.F. and I.F.C.; methodology, G.M.F.L. and I.F.C.; software, G.M.F.L.; validation, G.M.F.L. and I.F.C.; formal analysis, G.M.F.L. and I.F.C.; investigation, G.M.F.L.; resources, N.M.F. and I.F.C.; data curation, G.M.F.L. and I.F.C.; writing—original draft preparation, G.M.F.L.; writing—review and editing, G.M.F.L., N.M.F. and I.F.C.; visualization, G.M.F.L.; supervision, I.F.C.; project administration, G.M.F.L., N.M.F. and I.F.C.; funding acquisition, N.M.F. and I.F.C. All authors have read and agreed to the published version of the manuscript.

Funding

This research was funded by Saputo Dairy UK.

Acknowledgments

We thank Dr. Victoria Wright and Dr. Nadine Holmes of the Queen’s Medical Centre DeepSeq lab at the University of Nottingham (UK) for their support for RNA sequencing and Prof. Richard Emes for his support with the NIPA enrichment R script.

Conflicts of Interest

The authors declare that this study received funding from Saputo Dairy UK. The funders had the following involvement with the study: NMF conceived the idea and contributed to the prebiotics supply and review of the manuscript. The funders had no role in the design of the study, in the collection, analyses, or interpretation of data. The remaining authors declare that the research was conducted in the absence of any conflict of interest.

References

  1. Gibson, G.R.; Hutkins, R.; Sanders, M.E.; Prescott, S.L.; Reimer, R.A.; Salminen, S.J.; Scott, K.; Stanton, C.; Swanson, K.S.; Cani, P.D.; et al. Expert consensus document: The International Scientific Association for Probiotics and Prebiotics (ISAPP) consensus statement on the definition and scope of prebiotics. Nat. Rev. Gastroenterol. Hepatol. 2017, 14, 491–502. [Google Scholar] [CrossRef] [PubMed] [Green Version]
  2. Gibson, G.R.; Roberfroid, M.B. Dietary modulation of the human colonic microbiota: Introducing the concept of prebiotics. J. Nutr. 1995, 125, 1401–1412. [Google Scholar] [CrossRef] [PubMed]
  3. Macfarlane, S.; Macfarlane, G.T.; Cummings, J.H. Review article: Prebiotics in the gastrointestinal tract. Aliment. Pharmacol. Ther. 2006, 24, 701–714. [Google Scholar] [CrossRef] [PubMed]
  4. Schley, P.D.; Field, C.J. The immune-enhancing effects of dietary fibres and prebiotics. Br. J. Nutr. 2002, 87, S221–S230. [Google Scholar] [CrossRef] [PubMed]
  5. Van Leeuwen, S.S.; Kuipers, B.J.H.; Dijkhuizen, L.; Kamerling, J.P. Comparative structural characterization of 7 commercial galacto-oligosaccharide (GOS) products. Carbohydr. Res. 2016, 425, 48–58. [Google Scholar] [CrossRef] [PubMed]
  6. Martins, G.N.; Ureta, M.M.; Tymczyszyn, E.E.; Castilho, P.C.; Gomez-Zavaglia, A. Technological aspects of the production of fructo and galacto-oligosaccharides. Enzymatic synthesis and hydrolysis. Front. Nutr. 2019, 6, 78. [Google Scholar] [CrossRef]
  7. Niness, K.R. Inulin and Oligofructose: What are they? J. Nutr. 1999, 129, S1402–S1406. [Google Scholar] [CrossRef] [Green Version]
  8. Paganini, D.; Uyoga, M.A.; Cercamondi, C.I.; Moretti, D.; Mwasi, E.; Schwab, C.; Bechtler, S.; Mutuku, F.M.; Galetti, V.; Lacroix, C.; et al. Consumption of galacto-oligosaccharides increases iron absorption from a micronutrient powder containing ferrous fumarate and sodium iron EDTA: A stable-isotope study in Kenyan infants. Am. J. Clin. Nutr. 2017, 106, 1020–1031. [Google Scholar] [CrossRef] [Green Version]
  9. Hughes, C.; Davoodi-Semiromi, Y.; Colee, J.C.; Culpepper, T.; Dahl, W.J.; Mai, V.; Christman, M.C.; Langkamp-Henken, B. Galactooligosaccharide supplementation reduces stress-induced gastrointestinal dysfunction and days of cold or flu: A randomized, double-blind, controlled trial in healthy university students. Am. J. Clin. Nutr. 2011, 93, 1305–1311. [Google Scholar] [CrossRef] [Green Version]
  10. Schmidt, K.; Cowen, P.J.; Harmer, C.J.; Tzortzis, G.; Errington, S.; Burnet, P.W.J. Prebiotic intake reduces the waking cortisol response and alters emotional bias in healthy volunteers. Psychopharmacology (Berlin) 2015, 232, 1793–1801. [Google Scholar] [CrossRef] [Green Version]
  11. Liu, F.; Li, P.; Chen, M.; Luo, Y.; Prabhakar, M.; Zheng, H.; He, Y.; Qi, Q.; Long, H.; Zhang, Y.; et al. Fructooligosaccharide (FOS) and galactooligosaccharide (GOS) increase Bifidobacterium but reduce butyrate producing bacteria with adverse glycemic metabolism in healthy young population. Sci. Rep. 2017, 7, 11789. [Google Scholar] [CrossRef] [PubMed]
  12. Richards, P.J.; Flaujac Lafontaine, G.M.; Connerton, P.L.; Liang, L.; Asiani, K.; Fish, N.M.; Connerton, I.F. Galacto-oligosaccharides modulate the juvenile gut microbiome and innate immunity to improve broiler chicken performance. mSystems 2020, 5, e00827-19. [Google Scholar] [CrossRef] [PubMed] [Green Version]
  13. Ashraf, S.; Zaneb, H.; Masood, S.; Yousaf, S.; Usman, M.M.; Rehman, H.F.; Sikandar, A.; Rehman, H. Influence of β-galacto-oligosaccharide on growth performance and components of intestinal barrier in broilers during heat stress. S. Afr. J. Anim. Sci. 2017, 47, 616–625. [Google Scholar] [CrossRef] [Green Version]
  14. Varasteh, S.; Braber, S.; Akbari, P.; Garssen, J.; Fink-Gremmels, J. Differences in susceptibility to heat stress along the chicken intestine and the protective effects of galacto- oligosaccharides. PLoS ONE 2015, 10, e0138975. [Google Scholar] [CrossRef] [Green Version]
  15. Flaujac Lafontaine, G.M.; Richards, P.J.; Connerton, P.L.; O’Kane, P.M.; Ghaffar, N.M.; Cummings, N.J.; Fish, N.M.; Connerton, I.F. Prebiotic driven increases in IL-17A do not prevent Campylobacter jejuni colonization of chickens. Front. Microbiol. 2020, 10, 3033. [Google Scholar] [CrossRef] [Green Version]
  16. Alizadeh, A.; Akbari, P.; Difilippo, E.; Schols, H.A.; Ulfman, L.H.; Schoterman, M.H.C.; Garssen, J.; Fink-Gremmels, J.; Braber, S. The piglet as a model for studying dietary components in infant diets: Effects of galacto-oligosaccharides on intestinal functions. Br. J. Nutr. 2016, 115, 605–618. [Google Scholar] [CrossRef] [Green Version]
  17. Tian, S.; Wang, J.; Yu, H.; Wang, J.; Zhu, W. Changes in ileal microbial composition and microbial metabolism by an early-life galacto-oligosaccharides intervention in a neonatal porcine model. Nutrients 2019, 11, 1753. [Google Scholar] [CrossRef] [Green Version]
  18. Le Dréan, G.; Pocheron, A.L.; Billard, H.; Grit, I.; Pagniez, A.; Parnet, P.; Chappuis, E.; Rolli-Derkinderen, M.; Michel, C. Neonatal consumption of oligosaccharides greatly increases L-cell density without significant consequence for adult eating behavior. Nutrients 2019, 11, 1967. [Google Scholar] [CrossRef] [Green Version]
  19. Perdijk, O.; Van Baarlen, P.; Fernandez-Gutierrez, M.M.; Van Den Brink, E.; Schuren, F.H.J.; Brugman, S.; Savelkoul, H.F.J.; Kleerebezem, M.; Neerven, R.J.J. Van Sialyllactose and galactooligosaccharides promote epithelial barrier functioning and distinctly modulate microbiota composition and short chain fatty acid production in vitro. Front. Immunol. 2019, 10, 94. [Google Scholar] [CrossRef] [Green Version]
  20. Akbari, P.; Braber, S.; Alizadeh, A.; Verheijden, K.A.; Schoterman, M.H.; Kraneveld, A.D.; Garssen, J.; Fink-Gremmels, J. Galacto-oligosaccharides protect the intestinal barrier by maintaining the tight junction network and modulating the inflammatory responses after a challenge with the mycotoxin deoxynivalenol in Human Caco-2 cell monolayers and B6C3F1 mice. J. Nutr. 2015, 145, 1604–1613. [Google Scholar] [CrossRef] [Green Version]
  21. Searle, L.E.J.; Cooley, W.A.; Jones, G.; Nunez, A.; Crudgington, B.; Weyer, U.; Dugdale, A.H.; Tzortzis, G.; Collins, J.W.; Woodward, M.J.; et al. Purified galactooligosaccharide, derived from a mixture produced by the enzymic activity of Bifidobacterium bifidum, reduces Salmonella enterica serovar Typhimurium adhesion and invasion in vitro and in vivo. J. Med. Microbiol. 2010, 59, 1428–1439. [Google Scholar] [CrossRef]
  22. Whisner, C.M.; Martin, B.R.; Schoterman, M.H.C.; Nakatsu, C.H.; McCabe, L.D.; McCabe, G.P.; Wastney, M.E.; van den Heuvel, E.G.H.M.; Weaver, C.M. Galacto-oligosaccharides increase calcium absorption and gut bifidobacteria in young girls: A double-blind cross-over trial. Br. J. Nutr. 2013, 110, 1292–1303. [Google Scholar] [CrossRef]
  23. Van Den Heuvel, E.G.H.M.; Muys, T.; Van Dokkum, W.; Schaafsma, G. Oligofructose stimulates calcium absorption in adolescents. Am. J. Clin. Nutr. 1999, 69, 544–548. [Google Scholar] [CrossRef] [PubMed] [Green Version]
  24. Zafar, T.A.; Weaver, C.M.; Zhao, Y.; Martin, B.R.; Wastney, M.E. Nondigestible oligosaccharides increase calcium absorption and suppress bone resorption in ovariectomized rats. J. Nutr. 2004, 134, 399–402. [Google Scholar] [CrossRef] [PubMed] [Green Version]
  25. Fransen, F.; Sahasrabudhe, N.M.; Elderman, M.; Bosveld, M.; El Aidy, S.; Hugenholtz, F.; Borghuis, T.; Kousemaker, B.; Winkel, S.; van der Gaast-de Jongh, C.; et al. β2→1-fructans modulate the immune system in vivo in a microbiota-dependent and -independent fashion. Front. Immunol. 2017, 8, 16. [Google Scholar] [CrossRef] [Green Version]
  26. Babu, U.S.; Sommers, K.; Harrison, L.M.; Balan, K.V. Effects of fructooligosaccharide-inulin on Salmonella-killing and inflammatory gene expression in chicken macrophages. Vet. Immunol. Immunopathol. 2012, 149, 92–96. [Google Scholar] [CrossRef]
  27. Srinivasan, B.; Kolli, A.R.; Esch, M.B.; Abaci, H.E.; Shuler, M.L.; Hickman, J.J. TEER measurement techniques for in vitro barrier model systems. J. Lab. Autom. 2015, 20, 107–126. [Google Scholar] [CrossRef] [Green Version]
  28. Natoli, M.; Zucco, F.; Felsani, A.; Leoni, B.D.; D’Agnano, I. Good Caco-2 cell culture practices. Toxicol. Vitr. 2012, 26, 1243–1246. [Google Scholar] [CrossRef]
  29. Benjamini, Y.; Hochberg, Y. Controlling the False Discovery Rate: A practical and powerful approach to multiple testing. J. R. Stat. Soc. Ser. B 1995, 57, 289–300. [Google Scholar] [CrossRef]
  30. Metsalu, T.; Vilo, J. ClustVis: A web tool for visualizing clustering of multivariate data using Principal Component Analysis and heatmap. Nucleic Acids Res. 2015, 43, W566–W570. [Google Scholar] [CrossRef]
  31. Minguet, E.G.; Segard, S.; Charavay, C.; Parcy, F. MORPHEUS, a webtool for transcription factor binding analysis using position weight matrices with dependency. PLoS ONE 2015, 10, e0135586. [Google Scholar] [CrossRef] [PubMed] [Green Version]
  32. Heberle, H.; Meirelles, V.G.; da Silva, F.R.; Telles, G.P.; Minghim, R. InteractiVenn: A web-based tool for the analysis of sets through Venn diagrams. BMC Bioinform. 2015, 16, 169. [Google Scholar] [CrossRef] [PubMed]
  33. Ashburner, M.; Ball, C.A.; Blake, J.A.; Botstein, D.; Butler, H.; Cherry, J.M.; Davis, A.P.; Dolinski, K.; Dwight, S.S.; Eppig, J.T.; et al. Gene ontology: Tool for the unification of biology. Nat. Genet. 2000, 25, 25–29. [Google Scholar] [CrossRef] [PubMed] [Green Version]
  34. Carbon, S.; Douglass, E.; Dunn, N.; Good, B.; Harris, N.L.; Lewis, S.E.; Mungall, C.J.; Basu, S.; Chisholm, R.L.; Dodson, R.J.; et al. The Gene Ontology Resource: 20 years and still GOing strong. Nucleic Acids Res. 2019, 47, D330–D338. [Google Scholar]
  35. Kanehisa, M. KEGG: Kyoto Encyclopedia of Genes and Genomes. Nucleic Acids Res. 2000, 28, 27–30. [Google Scholar] [CrossRef]
  36. Durinck, S.; Moreau, Y.; Kasprzyk, A.; Davis, S.; De Moor, B.; Brazma, A.; Huber, W. BioMart and Bioconductor: A powerful link between biological databases and microarray data analysis. Bioinformatics 2005, 21, 3439–3440. [Google Scholar] [CrossRef] [Green Version]
  37. Durinck, S.; Spellman, P.T.; Birney, E.; Huber, W. Mapping identifiers for the integration of genomic datasets with the R/ Bioconductor package biomaRt. Nat. Protoc. 2009, 4, 1184–1191. [Google Scholar] [CrossRef] [Green Version]
  38. Luo, W.; Friedman, M.S.; Shedden, K.; Hankenson, K.D.; Woolf, P.J. GAGE: Generally applicable gene set enrichment for pathway analysis. BMC Bioinform. 2009, 10, 161. [Google Scholar] [CrossRef] [Green Version]
  39. Luo, W.; Brouwer, C. Pathview: An R/Bioconductor package for pathway-based data integration and visualization. Bioinformatics 2013, 29, 1830–1831. [Google Scholar] [CrossRef] [PubMed] [Green Version]
  40. Bustin, S.A.; Benes, V.; Garson, J.A.; Hellemans, J.; Huggett, J.; Kubista, M.; Mueller, R.; Nolan, T.; Pfaffl, M.W.; Shipley, G.L.; et al. The MIQE guidelines: Minimum information for publication of quantitative real-time PCR experiments. Clin. Chem. 2009, 55, 611–622. [Google Scholar] [CrossRef] [Green Version]
  41. Ye, J.; Coulouris, G.; Zaretskaya, I.; Cutcutache, I.; Rozen, S.; Madden, T.L. Primer-BLAST: A tool to design target-specific primers for polymerase chain reaction. BMC Bioinform. 2012, 13, 134. [Google Scholar] [CrossRef] [PubMed] [Green Version]
  42. Connerton, P.L.; Richards, P.J.; Lafontaine, G.M.; O’Kane, P.M.; Ghaffar, N.; Cummings, N.J.; Smith, D.L.; Fish, N.M.; Connerton, I.F. The effect of the timing of exposure to Campylobacter jejuni on the gut microbiome and inflammatory responses of broiler chickens. Microbiome 2018, 6, 88. [Google Scholar] [CrossRef] [PubMed]
  43. Pfaffl, M.W. A new mathematical model for relative quantification in real-time RT-PCR. Nucleic Acids Res. 2002, 29, e45. [Google Scholar] [CrossRef] [PubMed]
  44. Larionov, A.; Krause, A.; Miller, W.R. A standard curve based method for relative real time PCR data processing. BMC Bioinform. 2005, 6, 62. [Google Scholar] [CrossRef] [Green Version]
  45. Baggerly, K.A.; Deng, L.; Morris, J.S.; Aldaz, C.M. Differential expression in SAGE: Accounting for normal between-library variation. Bioinformatics 2003, 19, 1477–1483. [Google Scholar] [CrossRef]
  46. Rivals, I.; Personnaz, L.; Taing, L.; Potier, M.C. Enrichment or depletion of a GO category within a class of genes: Which test? Bioinformatics 2007, 23, 401–407. [Google Scholar] [CrossRef]
  47. Roberfroid, M.; Gibson, G.R.; Hoyles, L.; McCartney, A.L.; Rastall, R.; Rowland, I.; Wolvers, D.; Watzl, B.; Szajewska, H.; Stahl, B.; et al. Prebiotic effects: Metabolic and health benefits. Br. J. Nutr. 2010, 104, S1–S63. [Google Scholar] [CrossRef] [Green Version]
  48. Volpe, D.A.; Faustino, P.J.; Ciavarella, A.B.; Asafu-Adjaye, E.B.; Ellison, C.D.; Yu, L.X.; Hussain, A.S. Classification of drug permeability with a Caco-2 cell monolayer assay. Clin. Res. Regul. Aff. 2007, 24, 39–47. [Google Scholar] [CrossRef]
  49. Keemink, J.; Bergström, C.A.S. Caco-2 cell conditions enabling studies of drug absorption from digestible lipid-based formulations. Pharm. Res. 2018, 35, 74. [Google Scholar] [CrossRef] [Green Version]
  50. Wu, R.Y.; Abdullah, M.; Määttänen, P.; Pilar, A.V.C.; Scruten, E.; Johnson-Henry, K.C.; Napper, S.; O’Brien, C.; Jones, N.L.; Sherman, P.M. Protein kinase Cσ signaling is required for dietary prebiotic-induced strengthening of intestinal epithelial barrier function. Sci. Rep. 2017, 7, 40820. [Google Scholar] [CrossRef]
  51. Shoaf, K.; Mulvey, G.L.; Armstrong, G.D.; Hutkins, R.W. Prebiotic galactooligosaccharides reduce adherence of enteropathogenic Escherichia coli to tissue culture cells. Infect. Immun. 2006, 74, 6920–6928. [Google Scholar] [CrossRef] [PubMed] [Green Version]
  52. Putt, K.K.; Pei, R.; White, H.M.; Bolling, B.W. Yogurt inhibits intestinal barrier dysfunction in Caco-2 cells by increasing tight junctions. Food Funct. 2017, 8, 406–414. [Google Scholar] [CrossRef] [PubMed] [Green Version]
  53. Akbari, P.; Braber, S.; Gremmels, H.; Koelink, P.J.; Verheijden, K.A.T.; Garssen, J.; Fink-Gremmels, J. Deoxynivalenol: A trigger for intestinal integrity breakdown. FASEB J. 2014, 28, 2414–2429. [Google Scholar] [CrossRef] [PubMed] [Green Version]
  54. Dalman, M.R.; Deeter, A.; Nimishakavi, G.; Duan, Z.H. Fold change and p-value cutoffs significantly alter microarray interpretations. BMC Bioinform. 2012, 3, S11. [Google Scholar] [CrossRef] [Green Version]
  55. Mccarthy, D.J.; Smyth, G.K. Testing significance relative to a fold-change threshold is a TREAT. Bioinformatics 2009, 25, 765–771. [Google Scholar] [CrossRef] [Green Version]
  56. Schurch, N.J.; Schofield, P.; Gierliński, M.; Cole, C.; Sherstnev, A.; Singh, V.; Wrobel, N.; Gharbi, K.; Simpson, G.G.; Owen-Hughes, T.; et al. How many biological replicates are needed in an RNA-Seq experiment and which differential expression tool should you use? RNA 2016, 22, 839–851. [Google Scholar] [CrossRef] [Green Version]
  57. St Laurent, G.; Shtokalo, D.; Tackett, M.R.; Yang, Z.; Vyatkin, Y.; Milos, P.M.; Seilheimer, B.; McCaffrey, T.A.; Kapranov, P. On the importance of small changes in RNA expression. Methods 2013, 63, 18–24. [Google Scholar] [CrossRef]
  58. Liu, Y.; Beyer, A.; Aebersold, R. On the dependency of cellular protein levels on mRNA abundance. Cell 2016, 165, 535–550. [Google Scholar] [CrossRef] [Green Version]
  59. Badawi, A.F.; Cavalieri, E.L.; Rogan, E.G. Role of human cytochrome P450 1A1, 1A2, 1B1, and 3A4 in the 2-, 4-, and 16α-hydroxylation of 17β-estradiol. Metabolism 2001, 50, 1001–1003. [Google Scholar] [CrossRef]
  60. Lucas, D.; Goulitquer, S.; Marienhagen, J.; Fer, M.; Dreano, Y.; Schwaneberg, U.; Amet, Y.; Corcos, L. Stereoselective epoxidation of the last double bond of polyunsaturated fatty acids by human cytochromes P450. J. Lipid Res. 2010, 51, 1125–1133. [Google Scholar] [CrossRef] [Green Version]
  61. Clayton, E.L.; Minogue, S.; Waugh, M.G. Mammalian phosphatidylinositol 4-kinases as modulators of membrane trafficking and lipid signaling networks. Prog. Lipid Res. 2013, 52, 294–304. [Google Scholar] [CrossRef] [PubMed] [Green Version]
  62. Wenz, J.J. Predicting the effect of steroids on membrane biophysical properties based on the molecular structure. Biochim. Biophys. Acta Biomembr. 2012, 1818, 896–906. [Google Scholar] [CrossRef] [PubMed] [Green Version]
  63. Vreeburg, R.A.M.; Bastiaan-Net, S.; Mes, J.J. Normalization genes for quantitative RT-PCR in differentiated Caco-2 cells used for food exposure studies. Food Funct. 2011, 2, 124–129. [Google Scholar] [CrossRef] [PubMed]
  64. Martínez-Colón, G.J.; Moore, B.B. Prostaglandin E2 as a regulator of immunity to pathogens. Pharmacol. Ther. 2018, 185, 135–146. [Google Scholar] [CrossRef]
  65. Hata, S.; Koyama, S.; Kawahara, H.; Doi, N.; Maeda, T.; Toyama-Sorimachi, N.; Abe, K.; Suzuki, K.; Sorimachi, H. Stomach-specific calpain, nCL-2, localizes in mucus cells and proteolyzes the β-subunit of coatomer complex, β-COP. J. Biol. Chem. 2006, 281, 11214–11224. [Google Scholar] [CrossRef] [Green Version]
  66. Morford, L.A.; Forrest, K.; Logan, B.; Overstreet, L.K.; Goebel, J.; Brooks, W.H.; Roszman, T.L. Calpain II colocalizes with detergent-insoluble rafts on human and Jurkat T-cells. Biochem. Biophys. Res. Commun. 2002, 295, 540–546. [Google Scholar] [CrossRef]
  67. Hood, J.L.; Brooks, W.H.; Rossman, T.L. Differential compartmentalization of the calpain/calpastatin network with the endoplasmic reticulum and Golgi apparatus. J. Biol. Chem. 2004, 279, 43126–43135. [Google Scholar] [CrossRef] [Green Version]
  68. Zhao, W.C.; Zhu, J.X.; Zhang, G.H.; Wong, C.H.; Chung, Y.W.; Chan, H.C. Effect of sodium ferulate on human colonic anion secretion and the underlying signaling mechanism. Biol. Pharm. Bull. 2005, 28, 1608–1611. [Google Scholar] [CrossRef] [Green Version]
  69. Kliewer, S.A.; Sundseth, S.S.; Jones, S.A.; Brown, P.J.; Wisely, G.B.; Koble, C.S.; Devchand, P.; Wahli, W.; Willson, T.M.; Lenhard, J.M.; et al. Fatty acids and eicosanoids regulate gene expression through direct interactions with peroxisome proliferator-activated receptors α and γ. Proc. Natl. Acad. Sci. USA 1997, 94, 4318–4323. [Google Scholar] [CrossRef] [Green Version]
  70. Paumi, C.M.; Smitherman, P.K.; Townsend, A.J.; Morrow, C.S. Glutathione S-Transferases (GSTs) inhibit transcriptional activation by the Peroxisomal Proliferator-Activated Receptor γ (PPARγ) ligand, 15-deoxy-Δ12,14prostaglandin J2 (15-d-PGJ 2). Biochemistry 2004, 43, 2345–2352. [Google Scholar] [CrossRef]
  71. Hayes, J.D.; Flanagan, J.U.; Jowsey, I.R. Glutathione transferases. Annu. Rev. Pharmacol. Toxicol. 2005, 45, 51–88. [Google Scholar] [CrossRef] [PubMed]
  72. Greene, E.R.; Huang, S.; Serhan, C.N.; Panigrahy, D. Regulation of inflammation in cancer by eicosanoids. Prostaglandins Other Lipid Mediat. 2011, 96, 27–36. [Google Scholar] [CrossRef] [PubMed] [Green Version]
  73. Pidgeon, G.P.; Lysaght, J.; Krishnamoorthy, S.; Reynolds, J.V.; O’Byrne, K.; Nie, D.; Honn, K.V. Lipoxygenase metabolism: Roles in tumor progression and survival. Cancer Metastasis Rev. 2007, 26, 503–524. [Google Scholar] [CrossRef] [PubMed]
  74. Qamar, A.; Khetarpal, S.A.; Khera, A.V.; Qasim, A.; Rader, D.J.; Reilly, M.P. Plasma apolipoprotein C-III levels, triglycerides, and coronary artery calcification in type 2 diabetics. Arterioscler. Thromb. Vasc. Biol. 2015, 35, 1880–1888. [Google Scholar] [CrossRef] [Green Version]
  75. Khetarpal, S.A.; Zeng, X.; Millar, J.S.; Vitali, C.; Somasundara, A.V.H.; Zanoni, P.; Landro, J.A.; Barucci, N.; Zavadoski, W.J.; Sun, Z.; et al. A human APOC3 missense variant and monoclonal antibody accelerate apoC-III clearance and lower triglyceride-rich lipoprotein levels. Nat. Med. 2017, 23, 1086–1094. [Google Scholar] [CrossRef]
  76. Hirabayashi, J.; Hashidate, T.; Arata, Y.; Nishi, N.; Nakamura, T.; Hirashima, M.; Urashima, T.; Oka, T.; Futai, M.; Muller, W.E.; et al. Oligosaccharide specificity of galectins: A search by frontal affinity chromatography. Biochim. Biophys. Acta 2002, 1572, 232–254. [Google Scholar] [CrossRef]
  77. Bergström, J.H.; Birchenough, G.M.H.; Katona, G.; Schroeder, B.O.; Schütte, A.; Ermund, A.; Johansson, M.E.V.; Hansson, G.C. Gram-positive bacteria are held at a distance in the colon mucus by the lectin-like protein ZG16. Proc. Natl. Acad. Sci. USA 2016, 113, 13833–13838. [Google Scholar] [CrossRef] [Green Version]
  78. Meng, H.; Li, W.; Boardman, L.A.; Wang, L. Loss of ZG16 is associated with molecular and clinicopathological phenotypes of colorectal cancer. BMC Cancer 2018, 18, 433. [Google Scholar] [CrossRef] [Green Version]
  79. Wang, L.W.; Nandadasa, S.; Annis, D.S.; Dubail, X.J.; Mosher, D.F.; Willard, B.B.; Apte, S.S. A disintegrin-like and metalloproteinase domain with thrombospondin type 1 motif 9 (ADAMTS9) regulates fibronectin fibrillogenesis and turnover. J. Biol. Chem. 2019, 294, 9924–9936. [Google Scholar] [CrossRef]
  80. Du, W.; Wang, S.; Zhou, Q.; Li, X.; Chu, J.; Chang, Z.; Tao, Q.; Ng, E.K.O.; Fang, J.; Sung, J.J.Y.; et al. ADAMTS9 is a functional tumor suppressor through inhibiting AKT/mTOR pathway and associated with poor survival in gastric cancer. Oncogene 2013, 32, 3319–3328. [Google Scholar] [CrossRef] [Green Version]
  81. Fei, F.; Qu, J.; Zhang, M.; Li, Y.; Zhang, S. S100A4 in cancer progression and metastasis: A systematic review. Oncotarget 2017, 8, 73219–73239. [Google Scholar] [CrossRef] [PubMed] [Green Version]
  82. Sun, J.B.; Holmgren, J.; Larena, M.; Terrinoni, M.; Fang, Y.; Bresnick, A.R.; Xiang, Z. Deficiency in calcium-binding protein S100A4 impairs the adjuvant action of cholera toxin. Front. Immunol. 2017, 8, 1119. [Google Scholar] [CrossRef] [PubMed] [Green Version]
  83. Büchau, A.S.; Hassan, M.; Kukova, G.; Lewerenz, V.; Kellermann, S.; Würthner, J.U.; Wolf, R.; Walz, M.; Gallo, R.L.; Ruzicka, T. S100A15, an antimicrobial protein of the skin: Regulation by E. coli through toll-like receptor 4. J. Invest. Dermatol. 2007, 127, 2596–2604. [Google Scholar] [CrossRef] [Green Version]
  84. Yang, H.; Geiger, M. Cell penetrating SERPINA5 (Protein C inhibitor, PCI): More questions than answers. Semin. Cell Dev. Biol. 2017, 62, 187–193. [Google Scholar] [CrossRef]
  85. Malmström, E.; Mörgelin, M.; Malmsten, M.; Johansson, L.; Norrby-Teglund, A.; Shannon, O.; Schmidtchen, A.; Meijers, J.C.M.; Herwald, H. Protein C inhibitor-A novel antimicrobial agent. PLoS Pathog. 2009, 5, e1000698. [Google Scholar] [CrossRef] [Green Version]
  86. Akita, N.; Ma, N.; Okamoto, T.; Asanuma, K.; Yoshida, K.; Nishioka, J.; Shimaoka, M.; Suzuki, K.; Hayashi, T. Host protein C inhibitor inhibits tumor growth, but promotes tumor metastasis, which is closely correlated with hypercoagulability. Thromb. Res. 2015, 135, 1203–1208. [Google Scholar] [CrossRef]
  87. Chiquet, M.; Birk, D.E.; Bönnemann, C.G.; Koch, M. Collagen XII: Protecting bone and muscle integrity by organizing collagen fibrils. Int. J. Biochem. Cell Biol. 2014, 53, 51–54. [Google Scholar] [CrossRef] [Green Version]
  88. Hicks, D.; Farsani, G.T.; Laval, S.; Collins, J.; Sarkozy, A.; Martoni, E.; Shah, A.; Zou, Y.; Koch, M.; Bönnemann, C.G.; et al. Mutations in the collagen XII gene define a new form of extracellular matrix-related myopathy. Hum. Mol. Genet. 2014, 23, 2353–2363. [Google Scholar] [CrossRef] [Green Version]
Figure 1. GOS and FOS effect on trans-epithelial resistance of Caco–2 monolayers. Polarized confluent Caco–2 monolayers were exposed for 24 h to GOS, FOS (2% v/v) or their respective mock media. GOS increased significantly the monolayer TEER (+33.62%, p < 0.001), while the TEER increase induced by FOS exposure was not statistically significant (+28.68%, p = 0.054). Data are expressed as means ± SD and were tested using ANOVA t-test, ***p < 0.001 (n = 3).
Nutrients 12 01281 g001
Figure 2. Differentially expressed genes associated with GOS treatment. (A) Volcano plot of genes differentially expressed between GOS and GOS mock treatment (n = 3). The abscissa represents log2 fold changes in gene expression, the ordinate represents statistical significance of the variations in gene expression, expressed as -log10(p-values). (B) Principal component scatter plot showing variance of the biological replicates for each treatment (n = 3). Axis x and y show principal components 1 (PC1) and 2 (PC2) that explain 77.1% and 14.8% of the total variance respectively. Prediction ellipses indicate probability 0.95 that a new observation from the same group will fall inside the ellipse; N = 6 data points. (C). Heatmap displaying differentially expressed genes for GOS and mock treatments. Rows and columns are clustered using Pearson’s correlation distance and average linkage. Data are presented as normalized transcripts count (TPM) with |FC| ≥ 1.5 and q-value < 0.05.
Nutrients 12 01281 g002
Figure 3. Differentially expressed genes associated with FOS treatment. (A) Volcano plot of genes differentially expressed between FOS and FOS mock treatment (n = 3). The abscissa represents log2 fold changes in gene expression, the ordinate represents statistical significance of the variations in gene expression, expressed as -log10 (p-values). (B) Principal component scatter plot showing variance of the biological replicates for each treatment (n = 3). Axis x and y show principal components 1 (PC1) and 2 (PC2) that explain 74.8% and 13% of the total variance, respectively. Prediction ellipses indicate probability 0.95 that a new observation from the same group will fall inside the ellipse; N = 6 data points. (C) Heatmap displaying differentially expressed genes for FOS and mock treatments. Rows and columns are clustered using Pearson’s correlation distance and average linkage. Data are presented as the normalized transcripts count (TPM) with |FC| ≥ 1.5 and q-value < 0.05. (D) Venn diagram showing the overlap of differentially expressed genes between GOS and FOS treatments. Data are presented as the number of genes with |FC| ≥ 1.5 and q–value < 0.05.
Nutrients 12 01281 g003
Figure 4. Validation of RNA-seq by RT-qPCR. The abscissa represents RT-qPCR Fold Change in gene expression, the ordinate represents RNA-seq Fold Change in gene expression. GOS gene expression; −∙−∙ GOS gene expression linear trend line; FOS gene expression; . FOS gene expression linear trend line.
Nutrients 12 01281 g004
Figure 5. Gene Ontology (GO) enrichment analysis of differentially expressed genes of oligosaccharides treated compared to mock treated Caco–2 cells. Differentially expressed genes (FDR p–adj. < 0.05, |FC| ≥ 1.5) were clustered according to GO bioprocesses classification. GOS up-regulated; GOS down-regulated; FOS up-regulated.
Nutrients 12 01281 g005
Figure 6. Summary of the pathway associations of the differentially expressed genes (FDR p-adj. < 0.05, |FC| ≥ 1.5) identified as responding to the prebiotic oligosaccharides FOS or GOS in confluent colonic Caco–2 cells. Pathways were deduced from GO enrichment and KEGG analyses. Up-regulated functions are marked in red text and the down-regulated, in blue text.
Nutrients 12 01281 g006
Table 1. Nutrabiotic® galacto-oligosaccharides (GOS) and Orafti®L95 fructo-oligosaccharides (FOS) syrup composition.
Composition
Nutrabiotic® GOS75% (w/w) dry solids (ds)
Galacto-oligosaccharides66.5 (w/w ds)
Lactose10.1 (w/w ds)
Glucose21.8 (w/w ds)
Galactose1.6 (w/w ds)
Orafti® L95 FOS74.7% (w/w) dry solids
Fructo-oligosaccharides94.8 (w/w ds)
Fructose3 (w/w ds)
Sucrose2 (w/w ds)
Glucose0.2 (w/w ds)
Table 2. Culture media composition.
MediaBasic media* supplementation
Cell growth & confluence
+ 10% (v/v) FBS
+ antibiotics 100 U/mL (penicillin, streptomycin)
Conditioning & treatment
GOS 2%+ 2% (v/v) Nutrabiotic® GOS
FOS 2%+ 2% (v/v) Orafti® L95 FOS
GOS mock+ 0.67 % (m/m) mono- and di-saccharides (glucose 4.796 g/L, galactose 0.352 g/L, lactose 2.126 g/L)
FOS mock+ 0.104 % (m/m) mono- and di-saccharides (glucose 0.044 g/L, fructose 0.660 g/L, sucrose 0.421 g/L)
* basic media: Dulbecco’s MEM medium (DMEM), L-glutamine 2mM, MEM non-essential amino acids supplement 1x, Fetal Bovine Serum (FBS).
Table 3. Primer sequences for RNA-seq validation by qPCR.
Target GenePrimer Sequence (5’–3’)Product Size (bp)NCBI
Accession
RNA–Seq
Identifier
CAPN8F: GGTCTAGGTGACTGCTGGCT
R: AGCAGCTGTCCATTCTTGGT
197NM_001143962.2ENSG00000203697
COL12A1F: GGCAAGGCTATCCAGGTTCC
R: TAAGCACGTGCGCAAACATC
106NM_004370.6ENSG00000111799
CYP1A1F: CCCCCACAGCACAACAAGAG
R: GGGTGAGAAACCGTTCAGGT
146NM_000499.5ENSG00000140465
F13BF: GGACACTTCCTCCTGAGTGTGT
R: CGTCTGCAACAGCCCCATTC
81NM_001994.3ENSG00000143278
GALNT16F: CTGACCTTCGTGGAGGGTTC
R: GGTCTGTCCGGGTCATCTTC
84NM_020692.3ENSG00000100626
GPX2F: TTTCAATACGTTCCGGGGCA
R: CTGACAGTTCTCCTGATGTCCA
169NM_002083ENSG00000176153
RGPD5F: CAAGAAATTGCCTGTGCCCC
R: TCCATCGAGGTGGTGTTTCG
215NM_005054.3ENSG00000015568
SLC5A3F: ATGCAGCGGGGTTGGTACA
R: AGCAACACAGCAGGGTCAAA
235NM_006933.7ENSG00000198743
SULT1A3F: CGGTCTCCTACTACCATTTCC
R: AGGACCCGTAGGACACTTC
108NM_177552.3ENSG00000261052
ACTBF: CTGGAACGGTGAAGGTGACA
R: AAGGGACTTCCTGTAACAATGCA
140NM_001101.5
GAPDHF: GGAGTCCACTGGCGTCTTCAC
R: GAGGCATTGCTGATGATCTTGAGG
165NM_002046.7
PUM1F: TGAGGTGTGCACCATGAAC
R: CAGAATGTGCTTGCCATAGG
187NM_014676.2
Table 4. Summary of sequencing reads mapped to the human reference genome. RNA sequencing was strand-specific and only reverse strand reads were mapped to the reference genome Homo sapiens Hg38. FOS (1–3) and GOS (1–3) are oligosaccharide-treated groups, the experiment specific control treatment groups are referred to as “mock” (1–3); each treatment consists of three independent biological replicates (labelled 1–3) that were created from a pool of three technical replicates (n = 3).
Raw Read CountIgnored Reads (Wrong Strand)Reads Paired and MappedFragments Mapped to GenesFragments Mapped as IntergenicProtein Coding Genes
FOS experimentmock147,141,326615,415 (1.30%)88.25%95.87%4.13%96.47%
mock249,710,422771,068 (1.55%)87.24%95.81%4.19%96.54%
mock344,983,458717,544 (1.59%)89.62%95.86%4.14%96.64%
FOS149,264,466842,951 (1.71%)85.56%95.47%4.53%96.35%
FOS251,905,580749,101 (1.44%)86.80%95.64%4.36%96.46%
FOS349,519,788688,065 (1.39%)89.41%95.46%4.54%96.59%
GOS experimentmock162,474,912819,911 (1.31%)89.96%95.73%4.27%96.47%
mock245,810,896589,565 (1.29%)91.01%95.86%4.14%96.59%
mock349,459,368649,851 (1.31%)88.43%95.88%4.12%96.48%
GOS1134,054,0242,460,936 (1.83%)89.29%95.78%4.22%96.54%
GOS259,524,1101,153,619 (1.94%)87.68%95.87%4.13%96.49%
GOS356,118,898809,112 (1.44%)90.74%95.53%4.47%96.61%
Table 5. Kyoto Encyclopedia of Genes and Genomes (KEGG) pathway analysis. Enriched pathways among the differentially expressed genes were identified by KEGG analysis. Differentially expressed gene false discovery rate (FDR) p-adj.< 0.05 and absolute value of fold change ≥1.5.
KEGG PathwayFDR q.valEnriched GeneProtein Coding AliasFold Change (mRNAseq)FDR p–Value (mRNAseq)
GOS (UP)
hsa00790 Folate biosynthesis0.0003AKR1B1Aldo-Keto Reductase1.81 × 10−11
ALPPIntestinal Alkaline Phosphatase2.14 × 10−10
ALPGPlacental-Like Alkaline Phosphatase2.12 × 10−7
hsa00730 Thiamine metabolism0.0025ALPP
ALPG
hsa04918 Thyroid hormone synthesis0.0170GPX2Glutathione Peroxidase-Gastrointestinal2.1<1 × 10⁻¹²
ADCY1Ca2+/Calmodulin-Activated Adenylyl Cyclase1.55 × 10−4
FXYD2Sodium/Potassium-Transporting ATPase Subunit Gamma1.80.010
hsa04970 Salivary secretion0.0359SLC12A2Basolateral Na-K-Cl Symporter1.50.004
ADCY1
FXYD2
hsa04974 Protein digestion and absorption0.0359SLC7A8L-Type Amino Acid Transporter 21.69 × 10⁻⁷
COL12A1Collagen Type XII Alpha 1 Chain1.82 × 10−12
FXYD2
hsa04972 Pancreatic secretion0.0495SLC12A2
ADCY1
FXYD2
GOS (DOWN)
hsa00480 Glutathione metabolism0.002ODC1Ornithine Decarboxylase 1−1.51 × 10⁻¹¹
GSTA2Glutathione S-Transferase Alpha 2−1.54 × 10⁻⁵
GSTA1Glutathione S-Transferase Alpha 1−1.50.008
hsa00982 Drug metabolism - cytochrome P0.005GSTA2
hsa00980 Metabolism of xenobiotics by cytochrome P0.007GSTA1
hsa05204 Chemical carcinogenesis0.009ADH6Alcohol Dehydrogenase 6 (Class V)−1.70.004
FOS (UP)
hsa04913 Ovarian steroidogenesis0.0001CYP1A1Cytochrome P450 Family 1 Subfamily A Member 1 (Aryl Hydrocarbon Hydroxylase)1.8<1 × 10⁻¹²
PLA2G4BPhospholipase A2 Group IVB3.70.008
hsa00590 Arachidonic acid metabolism0.0002PLA2G4B
GPX2Gastrointestinal Glutathione Peroxidase1.50.002
hsa01100 Metabolic pathways0.0130NDUFC2-KCTD14NDUFC2-KCTD14 Readthrough Transcript Protein (NADH Dehydrogenase (Ubiquinone) 1 Subunit C2, Isoform 2)3.70.039
AC104662.2predicted type II PI4 kinase protein family (PI4K2B)28.20.009
PLA2G4B
CYP1A1
Table 6. Cell compartment GO enrichment analysis of differentially expressed genes.
GO Cell Compartment EnrichmentFDR q.valEnriched GeneProtein Coding AliasFold Change (mRNAseq)FDR
p–Value (mRNAseq )
GOS
GO:0062023 Collagen-containing extracellular matrix0.018ZG16Zymogen Granule Protein 16 (Jacalin-Like Lectin Domain Containing)−1.69 × 10⁻⁷
APOC3Apolipoprotein C3−1.53 × 10⁻⁵
ADAMTS9A Disintegrin And Metalloproteinase with ThromboSpondin Motifs 9−1.54 × 10⁻²
SERPINA5Serine (Or Cysteine) Proteinase Inhibitor, clade A (Alpha-1 Antiproteinase, Antitrypsin), Member 52.1<1 × 10⁻¹²
COL12A1Collagen type XII Proteoglycan1.82 × 10−12
S100A4S100 Calcium Binding Protein A41.72 × 10−10
S100A6S100 Calcium-Binding Protein A6 (Calcyclin)1.55 × 10⁻⁵
FOS
GO:0005743 Mitochondrial inner membrane0.002CYP1A1Cytochrome P450 Family 1 Subfamily A Member 1 (Aryl Hydrocarbon Hydroxylase)1.8<1 × 10⁻¹²
PLA2G4BPhospholipase A2 Group IVB3.70.008
NDUFC2-KCTD14NDUFC2-KCTD14 Readthrough Transcript Protein (NADH Dehydrogenase (Ubiquinone) 1 Subunit C2, Isoform 2)3.70.039

