
Association between Fat-Free Mass and Brain Size in Extremely Preterm Infants

 , , ,
, , ,
Abstract
:1. Introduction
2. Materials and Methods
2.1. Body Composition
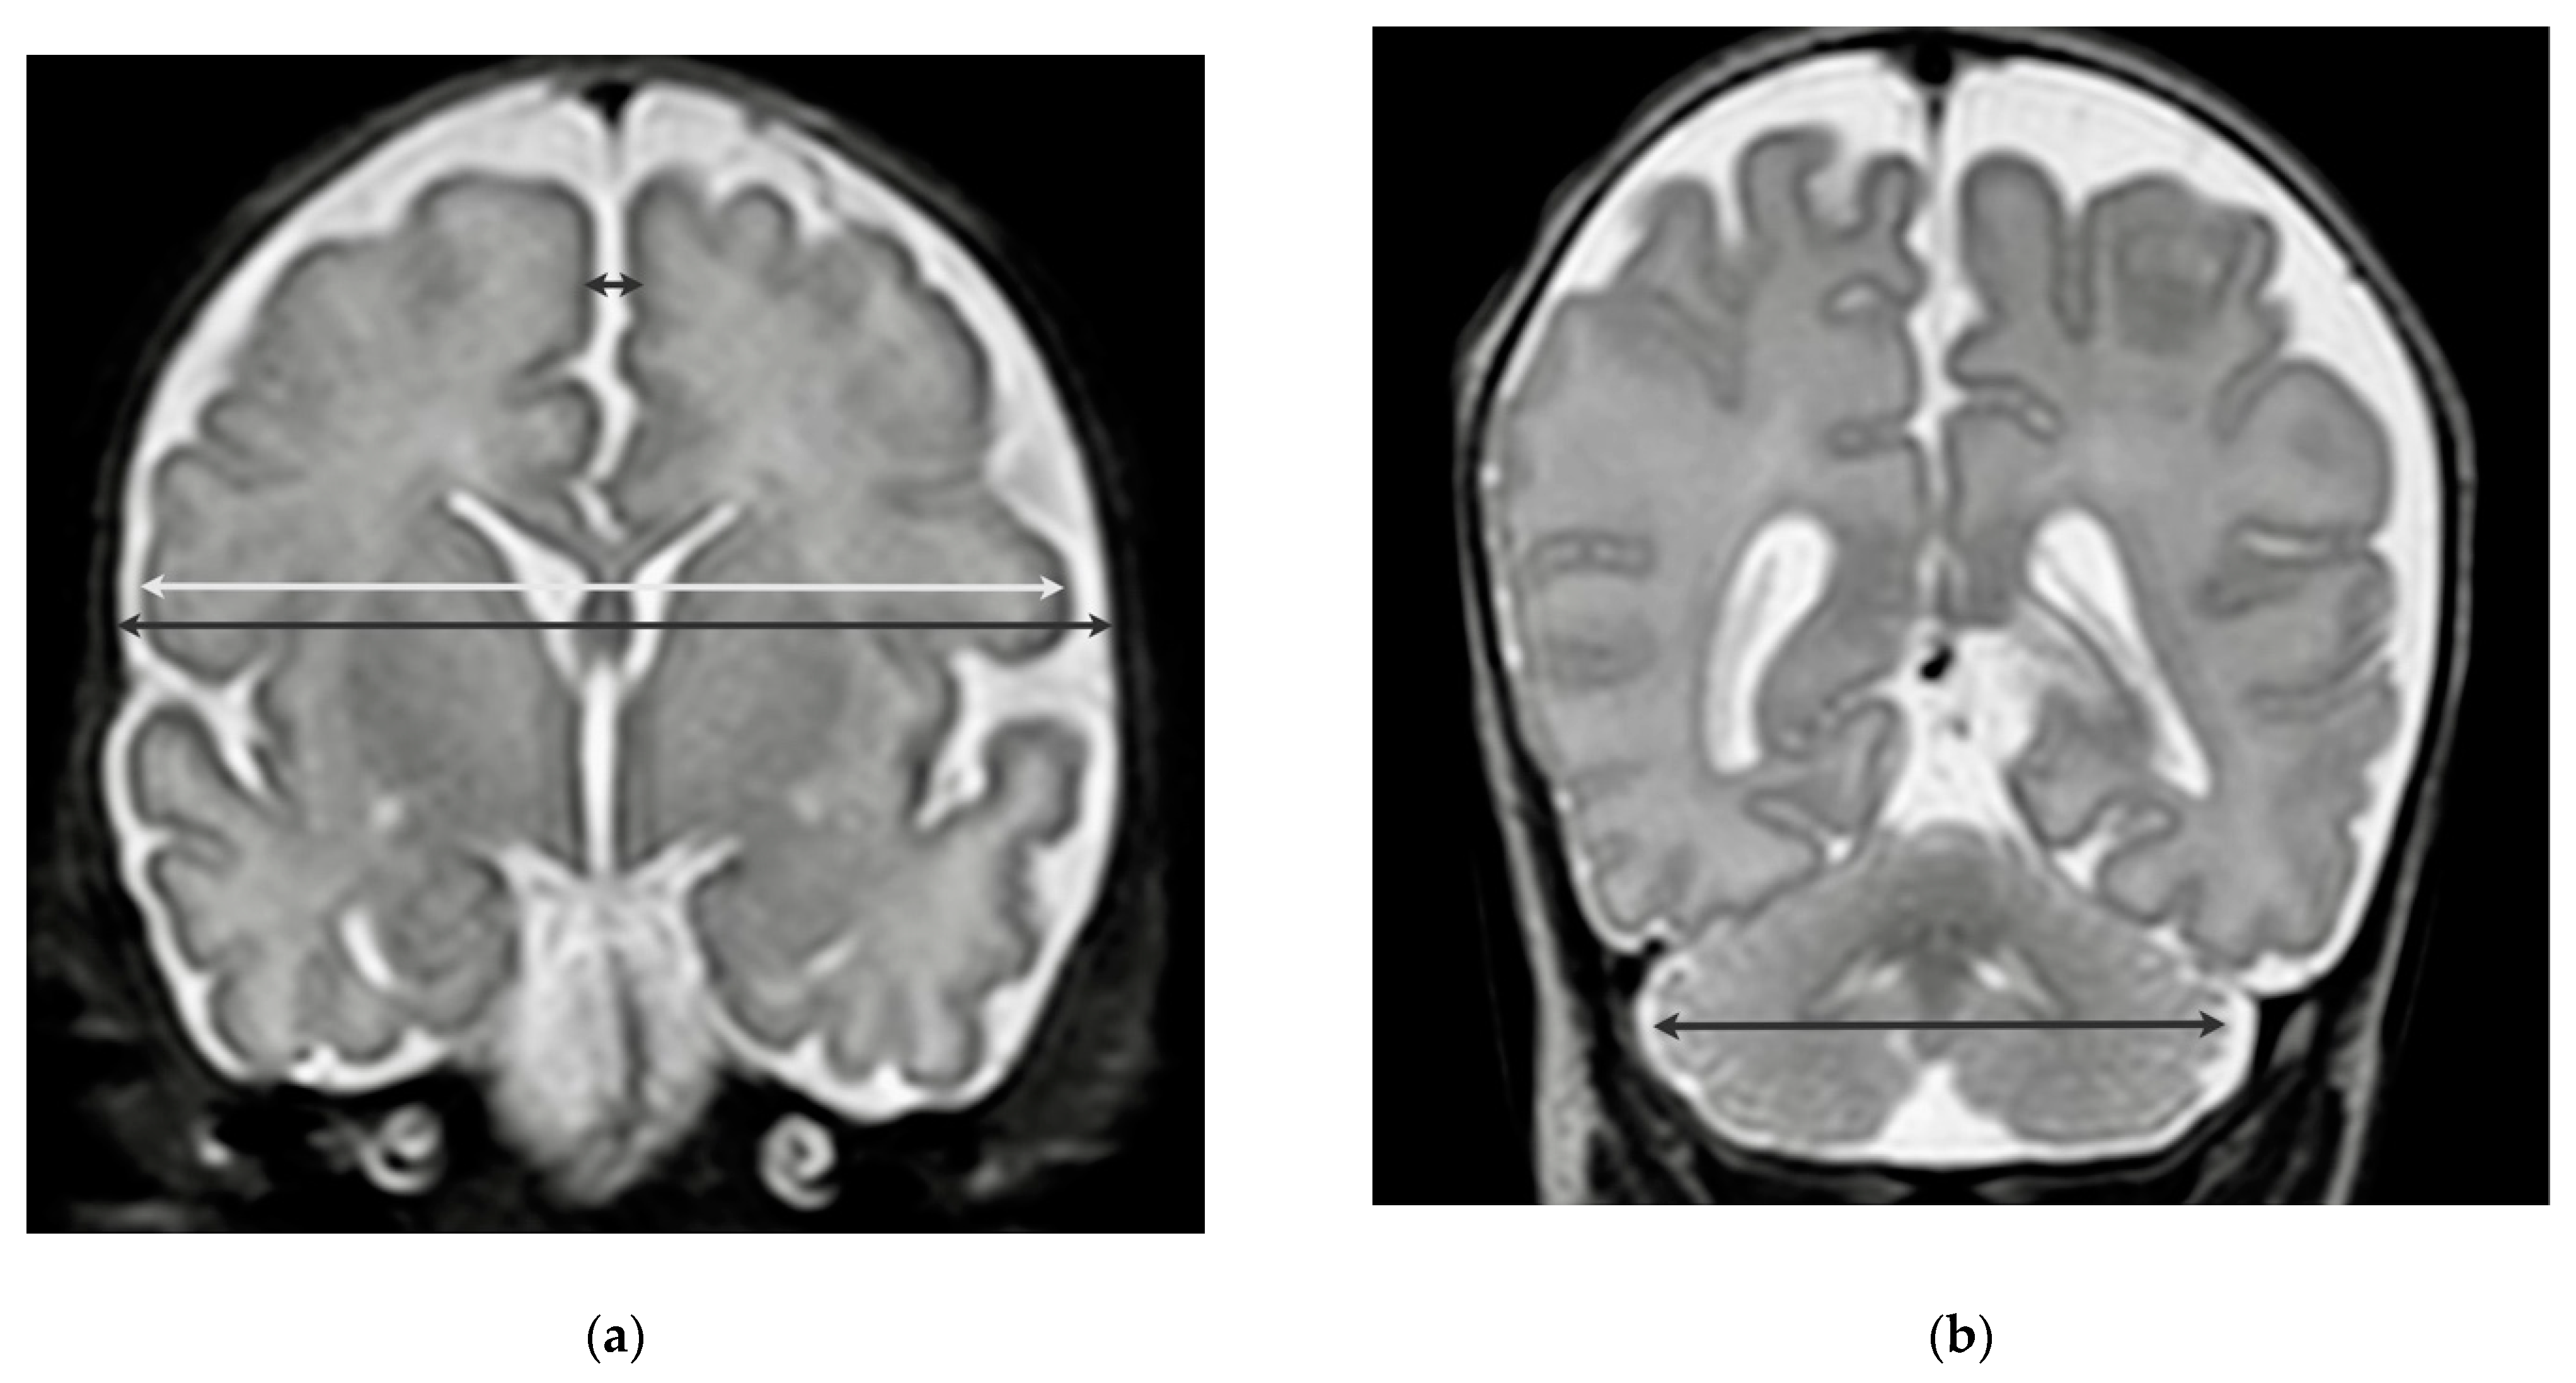
2.2. Neuroimaging
2.3. Statistics
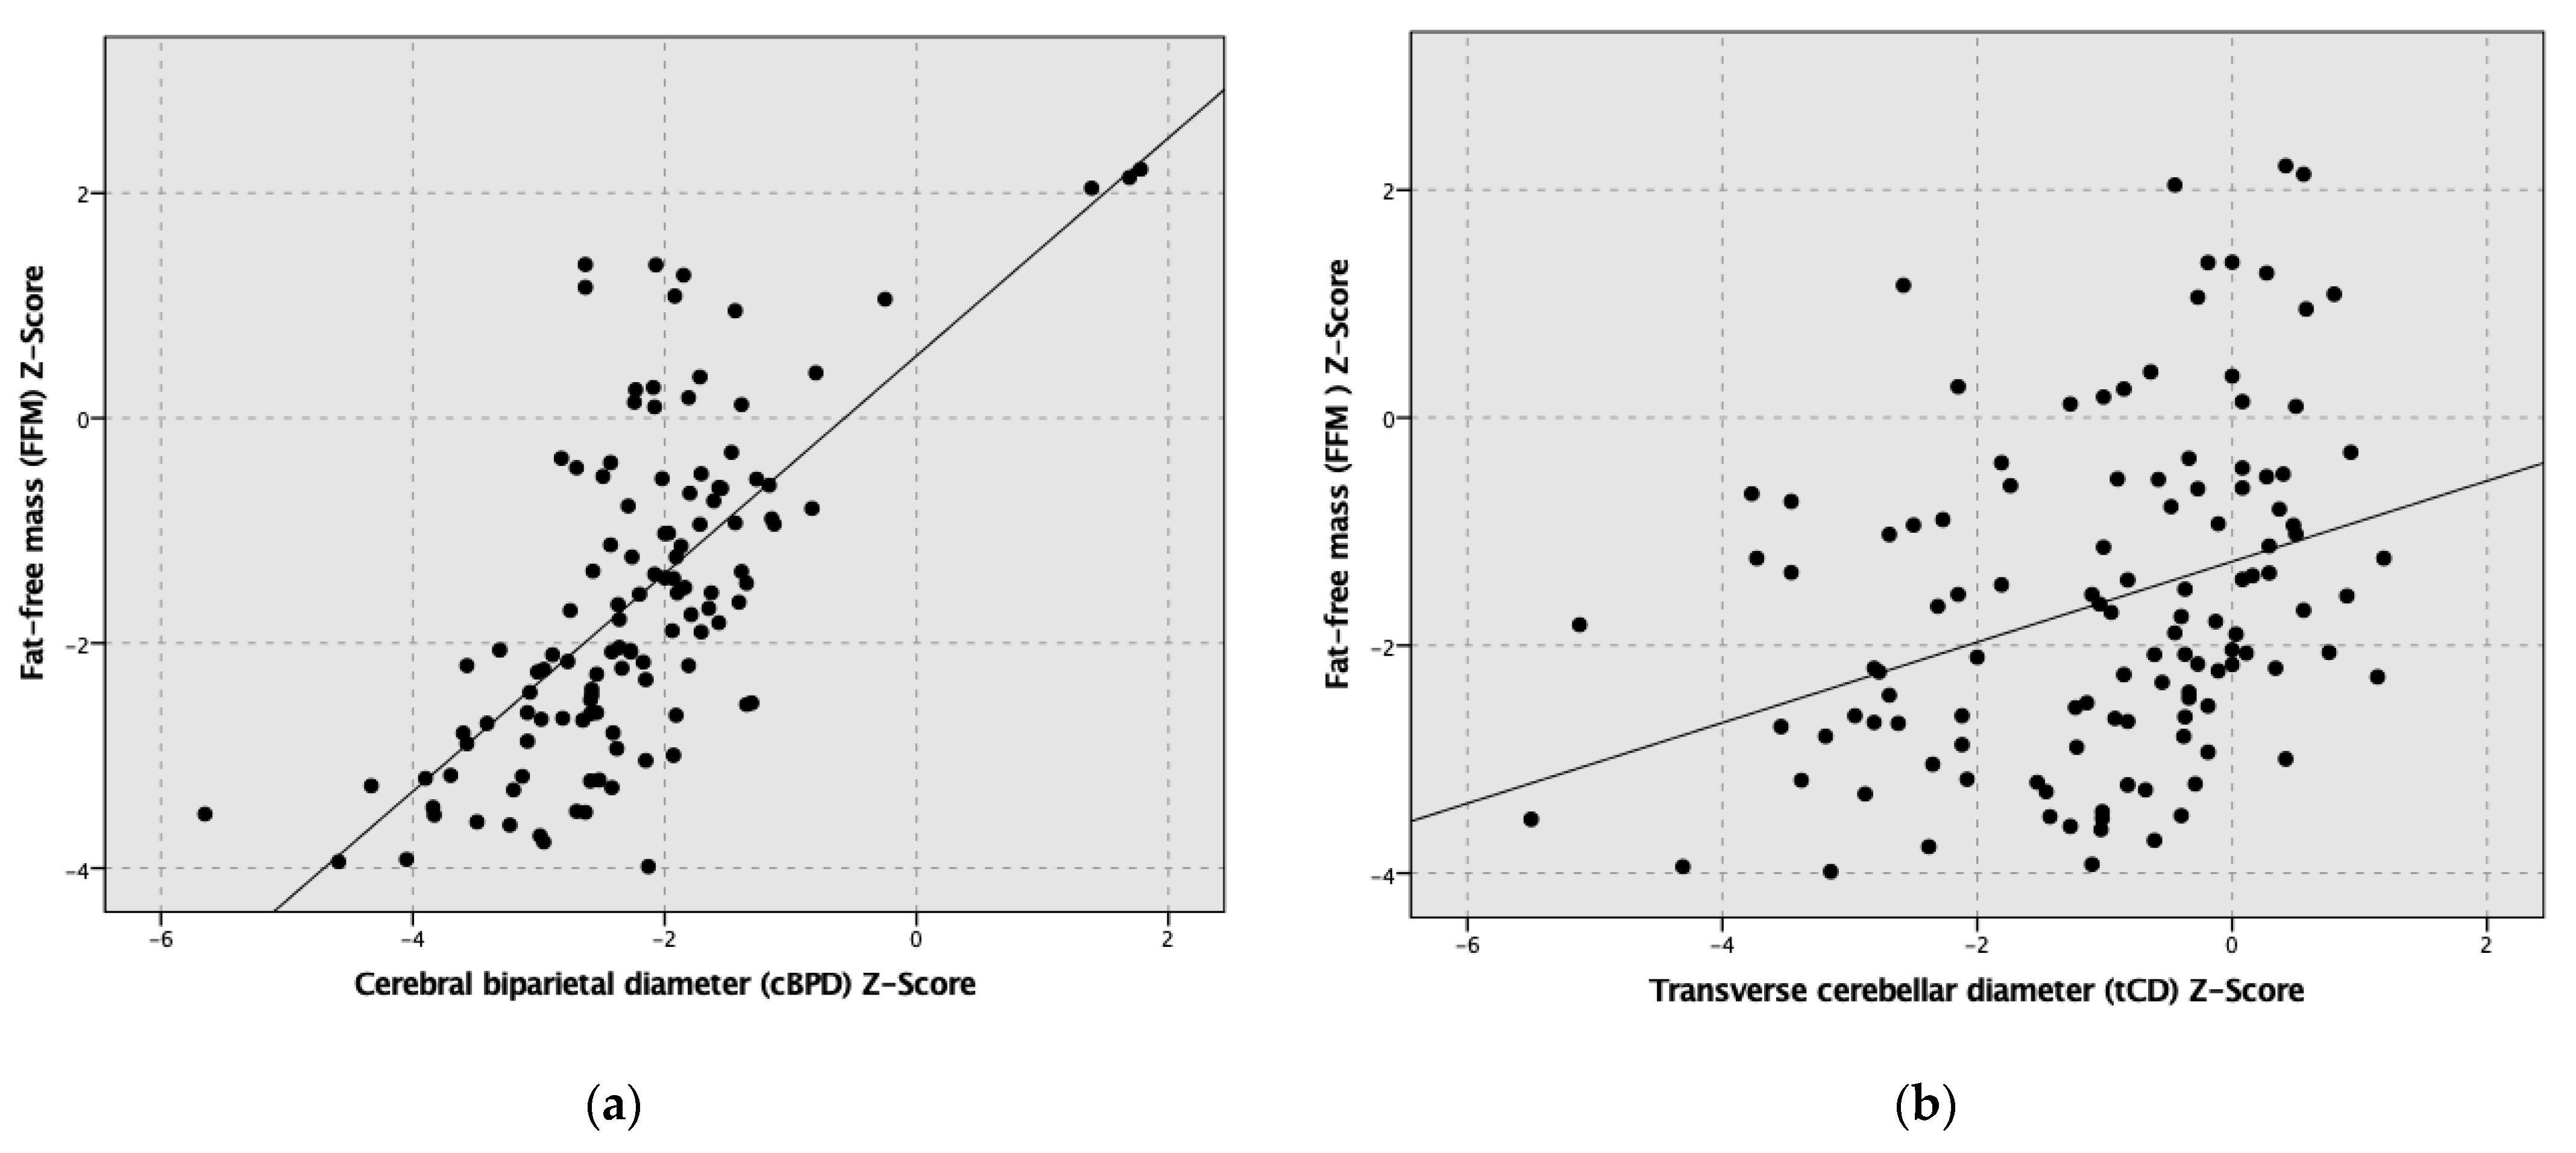
3. Results
4. Discussion
5. Conclusions
Author Contributions
Funding
Institutional Review Board Statement
Informed Consent Statement
Data Availability Statement
Conflicts of Interest
References
- Mercier, C.E.; Dunn, M.S.; Ferrelli, K.R.; Howard, D.B.; Soll, R.F.; Vermont Oxford Network EIF-USG. Neurodevelopmental outcome of extremely low birth weight infants from the Vermont Oxford network: 1998–2003. Neonatology 2010, 97, 329–338. [Google Scholar] [CrossRef] [Green Version]
- Kumar, R.K.; Singhal, A.; Vaidya, U.; Banerjee, S.; Anwar, F.; Rao, S. Optimizing Nutrition in Preterm Low Birth Weight Infants-Consensus Summary. Front. Nutr. 2017, 4, 20. [Google Scholar] [CrossRef] [PubMed] [Green Version]
- Agostoni, C.; Buonocore, G.; Carnielli, V.P.; De Curtis, M.; Darmaun, D.; Decsi, T.; Domellof, M.; Embleton, N.D.; Fusch, C.; Genzel-Boroviczeny, O.; et al. Enteral nutrient supply for preterm infants: Commentary from the European Society of Paediatric Gastroenterology, Hepatology and Nutrition Committee on Nutrition. J. Pediatr. Gastroenterol. Nutr. 2010, 50, 85–91. [Google Scholar] [CrossRef]
- Coviello, C.; Keunen, K.; Kersbergen, K.J.; Groenendaal, F.; Leemans, A.; Peels, B.; Isgum, I.; Viergever, M.A.; de Vries, L.S.; Buonocore, G.; et al. Effects of early nutrition and growth on brain volumes, white matter microstructure, and neurodevelopmental outcome in preterm newborns. Pediatr. Res. 2018, 83, 102–110. [Google Scholar] [CrossRef] [PubMed] [Green Version]
- van Beek, P.E.; Claessens, N.H.P.; Makropoulos, A.; Groenendaal, F.; de Vries, L.S.; Counsell, S.J.; Benders, M. Increase in Brain Volumes after Implementation of a Nutrition Regimen in Infants Born Extremely Preterm. J. Pediatr. 2020, 223, 57–63.e55. [Google Scholar] [CrossRef]
- Cheong, J.L.; Hunt, R.W.; Anderson, P.J.; Howard, K.; Thompson, D.K.; Wang, H.X.; Bear, M.J.; Inder, T.E.; Doyle, L.W. Head growth in preterm infants: Correlation with magnetic resonance imaging and neurodevelopmental outcome. Pediatrics 2008, 121, e1534–e1540. [Google Scholar] [CrossRef] [PubMed]
- Woodward, L.J.; Anderson, P.J.; Austin, N.C.; Howard, K.; Inder, T.E. Neonatal MRI to predict neurodevelopmental outcomes in preterm infants. N. Engl. J. Med. 2006, 355, 685–694. [Google Scholar] [CrossRef] [PubMed] [Green Version]
- Cormack, B.E.; Harding, J.E.; Miller, S.P.; Bloomfield, F.H. The Influence of Early Nutrition on Brain Growth and Neurodevelopment in Extremely Preterm Babies: A Narrative Review. Nutrients 2019, 11, 2029. [Google Scholar] [CrossRef] [Green Version]
- Ramel, S.E.; Haapala, J.; Super, J.; Boys, C.; Demerath, E.W. Nutrition, Illness and Body Composition in Very Low Birth Weight Preterm Infants: Implications for Nutritional Management and Neurocognitive Outcomes. Nutrients 2020, 12, 145. [Google Scholar] [CrossRef] [Green Version]
- Norris, T.; Ramel, S.E.; Catalano, P.; Caoimh, C.N.; Roggero, P.; Murray, D.; Fields, D.A.; Demerath, E.W.; Johnson, W. New charts for the assessment of body composition, according to air-displacement plethysmography, at birth and across the first 6 mo of life. Am. J. Clin. Nutr. 2019, 109, 1353–1360. [Google Scholar] [CrossRef]
- Gallagher, D.; Andres, A.; Fields, D.A.; Evans, W.J.; Kuczmarski, R.; Lowe, W.L.; Lumeng, J.C., Jr.; Oken, E.; Shepherd, J.A.; Sun, S.; et al. Body Composition Measurements from Birth through 5 Years: Challenges, Gaps, and Existing & Emerging Technologies-A National Institutes of Health workshop. Obes. Rev. 2020, 21, e13033. [Google Scholar] [PubMed]
- Ramel, S.E.; Gray, H.L.; Christiansen, E.; Boys, C.; Georgieff, M.K.; Demerath, E.W. Greater Early Gains in Fat-Free Mass, but Not Fat Mass, Are Associated with Improved Neurodevelopment at 1 Year Corrected Age for Prematurity in Very Low Birth Weight Preterm Infants. J. Pediatr. 2016, 173, 108–115. [Google Scholar] [CrossRef]
- Urlando, A.; Dempster, P.; Aitkens, S. A new air displacement plethysmograph for the measurement of body composition in infants. Pediatr. Res. 2003, 53, 486–492. [Google Scholar] [CrossRef] [Green Version]
- Ma, G.; Yao, M.; Liu, Y.; Lin, A.; Zou, H.; Urlando, A.; Wong, W.W.; Nommsen-Rivers, L.; Dewey, K.G. Validation of a new pediatric air-displacement plethysmograph for assessing body composition in infants. Am. J. Clin. Nutr. 2004, 79, 653–660. [Google Scholar] [CrossRef] [PubMed] [Green Version]
- Garel, C.; Chantrel, E.; Elmaleh, M.; Brisse, H.; Sebag, G. Fetal MRI: Normal gestational landmarks for cerebral biometry, gyration and myelination. Childs. Nerv. Syst. 2003, 19, 422–425. [Google Scholar] [CrossRef] [PubMed]
- Nguyen The Tich, S.; Anderson, P.J.; Shimony, J.S.; Hunt, R.W.; Doyle, L.W.; Inder, T.E. A novel quantitative simple brain metric using MR imaging for preterm infants. AJNR Am. J. Neuroradiol. 2009, 30, 125–131. [Google Scholar] [CrossRef] [PubMed] [Green Version]
- Kidokoro, H.; Neil, J.J.; Inder, T.E. New MR imaging assessment tool to define brain abnormalities in very preterm infants at term. AJNR Am. J. Neuroradiol. 2013, 34, 2208–2214. [Google Scholar] [CrossRef]
- Gale, C.; Logan, K.M.; Jeffries, S.; Parkinson, J.R.; Santhakumaran, S.; Uthaya, S.; Durighel, G.; Alavi, A.; Thomas, E.L.; Bell, J.D.; et al. Sexual dimorphism in relation to adipose tissue and intrahepatocellular lipid deposition in early infancy. Int. J. Obes 2015, 39, 629–632. [Google Scholar] [CrossRef] [PubMed] [Green Version]
- Uthaya, S.; Thomas, E.L.; Hamilton, G.; Dore, C.J.; Bell, J.; Modi, N. Altered adiposity after extremely preterm birth. Pediatr. Res. 2005, 57, 211–215. [Google Scholar] [CrossRef] [Green Version]
- Modi, N.; Thomas, E.L.; Harrington, T.A.; Uthaya, S.; Dore, C.J.; Bell, J.D. Determinants of adiposity during preweaning postnatal growth in appropriately grown and growth-restricted term infants. Pediatr. Res. 2006, 60, 345–348. [Google Scholar] [CrossRef] [PubMed] [Green Version]
- Wang, N.; Cui, L.; Liu, Z.; Wang, Y.; Zhang, Y.; Shi, C.; Cheng, Y. Optimizing parenteral nutrition to achieve an adequate weight gain according to the current guidelines in preterm infants with birth weight less than 1500 g: A prospective observational study. BMC Pediatr. 2021, 21, 303. [Google Scholar] [CrossRef] [PubMed]
- Richardson, D.K.; Corcoran, J.D.; Escobar, G.J.; Lee, S.K. SNAP-II and SNAPPE-II: Simplified newborn illness severity and mortality risk scores. J. Pediatr. 2001, 138, 92–100. [Google Scholar] [CrossRef] [PubMed]
- Pfister, K.M.; Gray, H.L.; Miller, N.C.; Demerath, E.W.; Georgieff, M.K.; Ramel, S.E. Exploratory study of the relationship of fat-free mass to speed of brain processing in preterm infants. Pediatr. Res. 2013, 74, 576–583. [Google Scholar] [CrossRef] [PubMed]
- Vasu, V.; Durighel, G.; Thomas, E.L.; Malamateniou, C.; Bell, J.D.; Rutherford, M.A.; Modi, N. Preterm nutritional intake and MRI phenotype at term age: A prospective observational study. BMJ Open 2014, 4, e005390. [Google Scholar] [CrossRef] [PubMed]
- Paviotti, G.; De Cunto, A.; Zennaro, F.; Boz, G.; Travan, L.; Cont, G.; Bua, J.; Demarini, S. Higher growth, fat and fat-free masses correlate with larger cerebellar volumes in preterm infants at term. Acta Paediatr. 2017, 106, 918–925. [Google Scholar] [CrossRef]
- Bell, K.A.; Matthews, L.G.; Cherkerzian, S.; Palmer, C.; Drouin, K.; Pepin, H.L.; Ellard, D.; Inder, T.E.; Ramel, S.E.; Belfort, M.B. Associations of Growth and Body Composition with Brain Size in Preterm Infants. J. Pediatr. 2019, 214, 20–26.e22. [Google Scholar] [CrossRef] [PubMed]
- Costa-Orvay, J.A.; Figueras-Aloy, J.; Romera, G.; Closa-Monasterolo, R.; Carbonell-Estrany, X. The effects of varying protein and energy intakes on the growth and body composition of very low birth weight infants. Nutr. J. 2011, 10, 140. [Google Scholar] [CrossRef] [PubMed] [Green Version]
- Pfister, K.M.; Zhang, L.; Miller, N.C.; Ingolfsland, E.C.; Demerath, E.W.; Ramel, S.E. Early body composition changes are associated with neurodevelopmental and metabolic outcomes at 4 years of age in very preterm infants. Pediatr. Res. 2018, 84, 713–718. [Google Scholar] [CrossRef]
- Binder, C.; Longford, N.; Gale, C.; Modi, N.; Uthaya, S. Body Composition following Necrotising Enterocolitis in Preterm Infants. Neonatology 2018, 113, 242–248. [Google Scholar] [CrossRef] [PubMed]
- Schneider, J.; Fischer Fumeaux, C.J.; Duerden, E.G.; Guo, T.; Foong, J.; Graz, M.B.; Hagmann, P.; Chakravarty, M.M.; Huppi, P.S.; Beauport, L.; et al. Nutrient Intake in the First Two Weeks of Life and Brain Growth in Preterm Neonates. Pediatrics 2018, 141, e20172169. [Google Scholar] [CrossRef] [PubMed] [Green Version]
- Latal-Hajnal, B.; von Siebenthal, K.; Kovari, H.; Bucher, H.U.; Largo, R.H. Postnatal growth in VLBW infants: Significant association with neurodevelopmental outcome. J. Pediatr. 2003, 143, 163–170. [Google Scholar] [CrossRef] [Green Version]

| Patient group (n = 118) | |
| Male, % (n) | 61.0 (72/118) |
| Gestational age, weeks | 26.1 (24.5, 27.0) |
| Anthropometry at birth | |
| Weight, gram | 770 (645, 923) |
| Length, cm | 33.0 (31.0, 35.0) |
| Head circumference, cm | 23.5 (22.0, 25.0) |
| Weight, Z-Score | 0.1 (−0.6, 0.5) |
| Length, Z-Score | 0.1 (−0.5, 0.7) |
| Head circumference, Z-Score | 0.0 (−0.5, 0.7) |
| Small for gestational age (<10th percentile), % (n) | 10.2 (12/118) |
| Cesarean delivery, % (n) | 84.7 (100/118) |
| APGAR Score, 5 min | 9 (8, 9) |
| APGAR Score, 10 min | 9 (9, 9) |
| Umbilical artery, pH | 7.32 (7.28, 7.36) |
| SNAPP-II Score | 9.0 (0, 9) |
| Necrotizing enterocolitis (stage ≥ 2), % (n) | 5.1 (6/118) |
| Intraventricular hemorrhage (stage > 2), % (n) | 10.2 (12/118) |
| Treatment for posthemorrhagic hydrocephalus, % (n) | 3.4 (4/118) |
| Culture proven septicemia, % (n) | 17.8 (21/118) |
| Parenteral nutrition, days | 26 (17, 36) |
| Exclusively mother’s milk at discharge, % (n) | 66.1 (78/118) |
| Patient Group (n = 118) | |
|---|---|
| Body composition parameters | |
| Postmenstrual age, weeks | 41.4 (40.0, 44.5) |
| FFM, percentage | 79.6 (75.1, 83.1) |
| FM, percentage | 20.5 (16.9, 24.9) |
| FFM, gram | 2716 (2300, 3141) |
| FM, gram | 702 (515, 947) |
| FFM, Z-Score | −1.8 (−2.7, −0.7) |
| FM, Z-Score | 1.1 (0.4, 1.8) |
| Weight, gram | 3473 (2920, 4023) |
| Weight, Z-Score | −1.0 (−1.6, −0.5) |
| Length, cm | 50.0 (48.4, 53.6) |
| Length, Z-Score | −1.2 (−2.1, −0.4) |
| Head circumference, cm | 35 (33, 36) |
| Head circumference, Z-Score | −0.7 (−1.4, −0.2) |
| Neuroimaging parameters | |
| Postmenstrual age, weeks | 37.4 (36.4, 38.6) |
| cBPD, mm | 71.1 (68.9, 74.1) |
| bBPD, mm | 76.2 (73.7, 79.5) |
| IHD, mm | 2.5 (2.0, 3.0) |
| tCD, mm | 47.6 (45.7, 49.4) |
| cBPD, Z-Score | −2.3 (−2.8, −1.8) |
| bBPD, Z-Score | −2.2 (−2.9, −1.7) |
| IHD, Z-Score | 0,3 (−0.3, 0.8) |
| tCD, Z-Score | −0.7 (−2.1, 0.0) |
| Impaired brain growth (cBPD), % (n) 1 | 67.8 (80/118) |
| Impaired brain growth (IHD), % (n) 1 | 8.5 (10/118) |
| Impaired brain growth (cBPD+IHD), % (n) 1 | 3.4 (4/118) |
Publisher’s Note: MDPI stays neutral with regard to jurisdictional claims in published maps and institutional affiliations. |
© 2021 by the authors. Licensee MDPI, Basel, Switzerland. This article is an open access article distributed under the terms and conditions of the Creative Commons Attribution (CC BY) license (https://creativecommons.org/licenses/by/4.0/).
Share and Cite
Binder, C.; Buchmayer, J.; Thajer, A.; Giordano, V.; Schmidbauer, V.; Harreiter, K.; Klebermass-Schrehof, K.; Berger, A.; Goeral, K. Association between Fat-Free Mass and Brain Size in Extremely Preterm Infants. Nutrients 2021, 13, 4205. https://doi.org/10.3390/nu13124205
Binder C, Buchmayer J, Thajer A, Giordano V, Schmidbauer V, Harreiter K, Klebermass-Schrehof K, Berger A, Goeral K. Association between Fat-Free Mass and Brain Size in Extremely Preterm Infants. Nutrients. 2021; 13(12):4205. https://doi.org/10.3390/nu13124205
Chicago/Turabian StyleBinder, Christoph, Julia Buchmayer, Alexandra Thajer, Vito Giordano, Victor Schmidbauer, Karin Harreiter, Katrin Klebermass-Schrehof, Angelika Berger, and Katharina Goeral. 2021. "Association between Fat-Free Mass and Brain Size in Extremely Preterm Infants" Nutrients 13, no. 12: 4205. https://doi.org/10.3390/nu13124205