
Acacia Gum Is Well Tolerated While Increasing Satiety and Lowering Peak Blood Glucose Response in Healthy Human Subjects

 ,
,
Abstract
1. Introduction
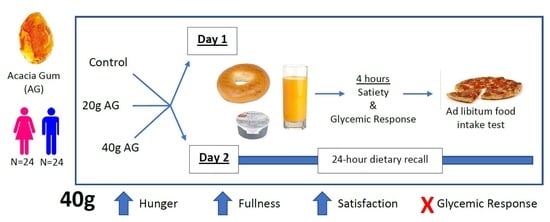
2. Materials & Methods
- Treatment A (Control): 1 plain bagel, 1 oz (28.3 g) of cream cheese, and 8 fl. oz of orange juice
- Treatment B: 1 plain bagel, 1 oz (28.3 g) of cream cheese, and 8 fl. oz of orange juice with 20 g of AG dissolved
- Treatment C: 1 plain bagel, 1 oz (28.3 g) of cream cheese, and 8 fl. oz of orange juice with 40 g of AG dissolved
3. Results
4. Discussion
5. Conclusions
Author Contributions
Funding
Institutional Review Board Statement
Informed Consent Statement
Data Availability Statement
Acknowledgments
Conflicts of Interest
References
- Hopping, B.N.; Erber, E.; Grandinetti, A.; Verheus, M.; Kolonel, L.N.; Maskarinec, G. Dietary Fiber, Magnesium, and Glycemic Load Alter Risk of Type 2 Diabetes in a Multiethnic Cohort in Hawaii. J. Nutr. 2010, 140, 68–74. [Google Scholar] [CrossRef]
- Fujii, H.; Iwase, M.; Ohkuma, T.; Ogata-Kaizu, S.; Ide, H.; Kikuchi, Y.; Idewaki, Y.; Joudai, T.; Hirakawa, Y.; Uchida, K.; et al. Impact of dietary fiber intake on glycemic control, cardiovascular risk factors and chronic kidney disease in Japanese patients with type 2 diabetes mellitus: The Fukuoka Diabetes Registry. Nutr. J. 2013, 12, 159. [Google Scholar] [CrossRef] [PubMed]
- Velázquez-López, L.; Muñoz-Torres, A.V.; García-Peña, C.; López-Alarcón, M.; Islas-Andrade, S.; Escobedo-De La Peña, J. Fiber in diet is associated with improvement of glycated hemoglobin and lipid profile in mexican patients with type 2 diabetes. J. Diabetes Res. 2016, 2016, 1–9. [Google Scholar] [CrossRef] [PubMed]
- Jung, C.-H.; Choi, K.M. Impact of High-Carbohydrate Diet on Metabolic Parameters in Patients with Type 2 Diabetes. Nutrients 2017, 9, 322. [Google Scholar] [CrossRef]
- Kim, E.K.; Oh, T.J.; Kim, L.-K.; Cho, Y.M. Improving Effect of the Acute Administration of Dietary Fiber-Enriched Cereals on Blood Glucose Levels and Gut Hormone Secretion. J. Korean Med. Sci. 2016, 31, 222. [Google Scholar] [CrossRef]
- National Center for Health Statistics, Division of Analysis and Epidemiology. Table 53. Selected Health Conditions and Risk Factors, by Age: United States, Selected Years 1988–1994 through 2015–2016; National Center for Health Statistics: Hyattsville, MD, USA, 2017.
- Clark, M.J.; Slavin, J.L. The effect of fiber on satiety and food intake: A systematic review. J. Am. Coll. Nutr. 2013, 32, 200–211. [Google Scholar] [CrossRef] [PubMed]
- Howarth, N.C.; Saltzman, E.; Roberts, S.B. Dietary Fiber and Weight Regulation. Nutr. Rev. 2001, 59, 129–139. [Google Scholar] [CrossRef]
- Slavin, J. Position of the American Dietetic Association: Health Implications of Dietary Fiber. J. Am. Diet. Assoc. 2008, 108, 1716–1731. [Google Scholar] [CrossRef]
- Kimm, S.Y.S. The Role of Dietary Fiber in the Development and Treatment of Childhood Obesity. Pediatrics 1995, 96, 1010–1014. [Google Scholar]
- Ludwig, D.S.; Pereira, M.A.; Kroenke, C.H.; Hilner, J.E.; Van Horn, L.; Slattery, M.L.; David, R.; Jacobs, J. Dietary Fiber, Weight Gain, and Cardiovascular Disease Risk Factors in Young Adults. JAMA 1999, 282, 1539. [Google Scholar] [CrossRef] [PubMed]
- Nelson, L.H.; Tucker, L.A. Diet Composition Related to Body Fat in a Multivariate Study of 203 Men. J. Am. Diet. Assoc. 1996, 96, 771–777. [Google Scholar] [CrossRef]
- U.S. Department of Agriculture; U.S. Department of Health and Human Services. Dietary Guidelines for Americans 2010, 7th ed.; U.S. Government Printing Office: Washington, DC, USA, 2010; ISBN 978-0615449913.
- Slavin, J.; Green, H. Dietary fibre and satiety. Nutr. Bull. 2007, 32, 32–42. [Google Scholar] [CrossRef]
- Monsivais, P.; Carter, B.E.; Christiansen, M.; Perrigue, M.M.; Drewnowski, A. Soluble fiber dextrin enhances the satiating power of beverages. Appetite 2011, 56, 9–14. [Google Scholar] [CrossRef] [PubMed]
- Salleh, S.; Fairus, A.; Zahary, M.; Bhaskar Raj, N.; Mhd Jalil, A. Unravelling the Effects of Soluble Dietary Fibre Supplementation on Energy Intake and Perceived Satiety in Healthy Adults: Evidence from Systematic Review and Meta-Analysis of Randomised-Controlled Trials. Foods 2019, 8, 15. [Google Scholar] [CrossRef] [PubMed]
- Meyer, K.A.; Kushi, L.H.; Jacobs, D.R.; Slavin, J.; Sellers, T.A.; Folsom, A.R. Carbohydrates, dietary fiber, and incident type 2 diabetes in older women. Am. J. Clin. Nutr. 2000, 71, 921–930. [Google Scholar] [CrossRef] [PubMed]
- Thompson, S.V.; Hannon, B.A.; An, R.; Holscher, H.D. Effects of isolated soluble fiber supplementation on body weight, glycemia, and insulinemia in adults with overweight and obesity: A systematic review and meta-analysis of randomized controlled trials. Am. J. Clin. Nutr. 2017, 106, 1514–1528. [Google Scholar] [CrossRef]
- Poutanen, K.S.; Dussort, P.; Erkner, A.; Fiszman, S.; Karnik, K.; Kristensen, M.; Marsaux, C.F.M.; Miquel-Kergoat, S.; Pentikäinen, S.P.; Putz, P.; et al. A review of the characteristics of dietary fibers relevant to appetite and energy intake outcomes in human intervention trials. Am. J. Clin. Nutr. 2017, 106, 747–754. [Google Scholar] [CrossRef] [PubMed]
- Ali, B.H.; Ziada, A.; Blunden, G. Biological effects of gum arabic: A review of some recent research. Food Chem. Toxicol. 2009, 47, 1–8. [Google Scholar] [CrossRef]
- Calame, W.; Thomassen, F.; Hull, S.; Viebke, C.; Siemensma, A.D. Evaluation of satiety enhancement, including compensation, by blends of gum arabic. A methodological approach. Appetite 2011, 57, 358–364. [Google Scholar] [CrossRef]
- Babiker, R.; Elmusharaf, K.; Keogh, M.B.; Saeed, A.M. AO—Babiker, R.O. Effect of Gum Arabic (Acacia Senegal) supplementation on visceral adiposity index (VAI) and blood pressure in patients with type 2 diabetes mellitus as indicators of cardiovascular disease (CVD): A randomized and placebo-controlled clinical trial. Lipids Health Dis. 2018, 17, 56. [Google Scholar] [CrossRef]
- Babiker, R.; Merghani, T.H.; Elmusharaf, K.; Badi, R.M.; Lang, F.; Saeed, A.M. Effects of gum Arabic ingestion on body mass index and body fat percentage in healthy adult females: Two-arm randomized, placebo controlled, double-blind trial. Nutr. J. 2012, 11, 1–7. [Google Scholar] [CrossRef]
- Babiker, R.; Elmusharaf, K.; Keogh, M.B.; Banaga, A.S.I.; Saeed, A.M. Metabolic effect of Gum Arabic (Acacia Senegal) in patients with Type 2 Diabetes Mellitus (T2DM): Randomized, placebo controlled double blind trial. Funct. Foods Heal. Dis. 2017, 7, 219–231. [Google Scholar] [CrossRef]
- Hu, J.-L.L.; Nie, S.-P.P.; Li, N.; Min, F.-F.F.; Li, C.; Gong, D.; Xie, M.-Y.Y. Effect of Gum Arabic on Glucose Levels and Microbial Short-Chain Fatty Acid Production in White Rice Porridge Model and Mixed Grain Porridge Model. J. Agric. Food Chem. 2014, 62, 6408–6416. [Google Scholar] [CrossRef]
- Calame, W.; Weseler, A.R.; Viebke, C.; Flynn, C.; Siemensma, A.D. Gum arabic establishes prebiotic functionality in healthy human volunteers in a dose-dependent manner. Br. J. Nutr. 2008, 100, 1269. [Google Scholar] [CrossRef]
- Glover, D.A.; Ushida, K.; Phillips, A.O.; Riley, S.G. Acacia(sen) SUPERGUMTM (Gum arabic): An evaluation of potential health benefits in human subjects. Food Hydrocoll. 2009, 23, 2410–2415. [Google Scholar] [CrossRef]
- Doi, Y.; Ichihara, T.; Hagiwara, A.; Imai, N.; Tamano, S.; Orikoshi, H.; Ogasawara, K.; Sasaki, Y.; Nakamura, M.; Shirai, T. A ninety-day oral toxicity study of a new type of processed gum arabic, from Acacia tree (Acacia senegal) exudates, in F344 rats. Food Chem. Toxicol. 2006, 44, 560–566. [Google Scholar] [CrossRef]
- Scientific Evaluation of the Evidence on the Beneficial Physiological Effects of Isolated or Synthetic Non-digestible Carbohydrates Submitted as a Citizen Petition (21 CFR 10.30): Guidance for Industry; United States Food and Drug Administration: College Park, MD, USA, 2018; pp. 1–19.
- Korczak, R.; Lindeman, K.; Thomas, W.; Slavin, J.L. Bran fibers and satiety in women who do not exhibit restrained eating. Appetite 2014, 80, 257–263. [Google Scholar] [CrossRef]
- Stunkard, A.; Messick, S. The Three-Factor Eating Questionnaire to measure dietary restraint, disinhibition and hunger. J. Psychosom. Res. 1985, 29, 71–83. [Google Scholar] [CrossRef]
- Sharma, R.D. Hypoglycemic effect of gum acacia in healthy human subjects. Nutr. Res. 1985, 5, 1437–1441. [Google Scholar] [CrossRef]
- Brand-Miller, J.C.; Stockmann, K.; Atkinson, F.; Petocz, P.; Denyer, G. Glycemic index, postprandial glycemia, and the shape of the curve in healthy subjects: Analysis of a database of more than 1000 foods. Am. J. Clin. Nutr. 2009, 89, 97–105. [Google Scholar] [CrossRef]
- Willis, H.J.; Thomas, W.; Eldridge, A.L.; Harkness, L.; Green, H.; Slavin, J.L. Glucose and insulin do not decrease in a dose-dependent manner after increasing doses of mixed fibers that are consumed in muffins for breakfast. Nutr. Res. 2011, 31, 42–47. [Google Scholar] [CrossRef] [PubMed]
- Wolever, T.M.S.; Van Klinken, B.J.W.; Spruill, S.E.; Jenkins, A.L.; Chu, Y.F.; Harkness, L. Effect of serving size and addition of sugar on the glycemic response elicited by oatmeal: A randomized, cross-over study. Clin. Nutr. ESPEN 2016, 16, 48–54. [Google Scholar] [CrossRef] [PubMed]
- Mendes-Soares, H.; Raveh-Sadka, T.; Azulay, S.; Edens, K.; Ben-Shlomo, Y.; Cohen, Y.; Ofek, T.; Bachrach, D.; Stevens, J.; Colibaseanu, D.; et al. Assessment of a Personalized Approach to Predicting Postprandial Glycemic Responses to Food Among Individuals Without Diabetes. JAMA Netw. Open 2019, 2, e188102. [Google Scholar] [CrossRef] [PubMed]
- Panahi, S.; Ezatagha, A.; Vuksan, V.; Panahi, S.; Ezatagha, A.; Temelli, F.; Vasanthan, T. β-Glucan from Two Sources of Oat Concentrates Affect Postprandial Glycemia in Relation to the Level of Viscosity. J. Am. Coll. Nutr. 2007, 26, 639–644. [Google Scholar] [CrossRef]
- Anderson, D.M.W.; Ashby, P.; Busuttil, A.; Eastwood, M.A.; Hobson, B.M.; Ross, A.H.M.; Street, C.A. Subchronic effects of gum arabic (Acacia) in the rat. Toxicol. Lett. 1982, 14, 221–227. [Google Scholar] [CrossRef]
- Melnick, R.L.; Huff, J.; Haseman, J.K.; Dieter, M.P.; Grieshaber, C.K.; Wyand, D.S.; Russfield, A.B.; Murthy, A.S.K.; Fleischman, R.W.; Lilja, H.S. Chronic effects of agar, guar gum, gum arabic, locust-bean gum, or tara gum in F344 rats and B6C3F1 mice. Food Chem. Toxicol. 1983, 21, 305–311. [Google Scholar] [CrossRef]
- Ushida, K.; Hatanaka, H.; Inoue, R.; Tsukahara, T.; Phillips, G.O. Effect of long term ingestion of gum arabic on the adipose tissues of female mice. Food Hydrocoll. 2011, 25, 1344–1349. [Google Scholar] [CrossRef]
- Ahmed, A.A.; Musa, H.H.; Fedail, J.S.; Sifaldin, A.Z.; Musa, T.H. Gum arabic decreased visceral adipose tissue associated with downregulation of 11β-hydroxysteroid dehydrogenase type I in liver and muscle of mice. Bioact. Carbohydr. Diet. Fibre 2015, 6, 31–36. [Google Scholar] [CrossRef]
- US Department of Agriculture; US Department of Health and Human Services. Dietary Guidelines for Americans 2015–2020, 8th ed.; U.S. Government Printing Office: Washington, DC, USA, 2015.


| Treatment A | Treatment B | Treatment C | p Value | ||||||||||
|---|---|---|---|---|---|---|---|---|---|---|---|---|---|
| N | Mean | SD | N | Mean | SD | N | Mean | SD | Overall | A vs. B | A vs. C | B vs. C | |
| Bloating AUC | 47 | 5.4 | 7.9 | 48 | 6.9 | 10.8 | 46 | 12.3 | 15.0 | 0.0008 | 0.71 | 0.0009 | 0.01 |
| Nausea AUC | 47 | 0.5 | 1.9 | 48 | 0.6 | 2.9 | 46 | 1.9 | 6.2 | 0.11 | |||
| Flatulence AUC | 47 | 4.0 | 7.4 | 48 | 7.8 | 11.1 | 46 | 11.5 | 15.5 | 0.002 | 0.18 | 0.001 | 0.14 |
| Diarrhea/loose stools AUC | 47 | 0.5 | 1.8 | 48 | 1.2 | 4.1 | 46 | 2.1 | 6.6 | 0.22 | |||
| Constipation AUC | 47 | 0.9 | 3.7 | 48 | 1.4 | 5.5 | 46 | 3.2 | 7.2 | 0.054 | 0.86 | 0.056 | 0.17 |
| GI rumbling AUC | 47 | 6.4 | 8.8 | 48 | 7.4 | 10.1 | 46 | 11.4 | 14.3 | 0.011 | 0.81 | 0.012 | 0.056 |
| GI cramping AUC | 47 | 2.0 | 5.7 | 48 | 1.6 | 4.8 | 46 | 4.1 | 10.1 | 0.11 | |||
| Visual Appeal | 44 | 0.21 | 0.19 | 46 | 0.28 | 0.21 | 43 | 0.28 | 0.23 | 0.048 | 0.086 | 0.078 | 1 |
| Smell | 44 | 0.25 | 0.17 | 46 | 0.28 | 0.18 | 44 | 0.28 | 0.18 | 0.39 | |||
| Taste | 44 | 0.20 | 0.15 | 46 | 0.22 | 0.17 | 44 | 0.23 | 0.19 | 0.37 | |||
| Aftertaste | 44 | 0.63 | 0.26 | 46 | 0.59 | 0.26 | 44 | 0.58 | 0.26 | 0.49 | |||
| Overall Palatability | 44 | 0.22 | 0.16 | 46 | 0.24 | 0.20 | 44 | 0.28 | 0.22 | 0.11 | |||
| Treatment A (Control) | Treatment B | Treatment C | p Value | |||||||
|---|---|---|---|---|---|---|---|---|---|---|
| Glucose Outcomes | N | Mean | SD | N | Mean | SD | N | Mean | SD | - |
| AUC (time is in hour) | 48 | 419.0 | 31.4 | 48 | 417.9 | 34.0 | 47 | 418.9 | 36.8 | 0.94 |
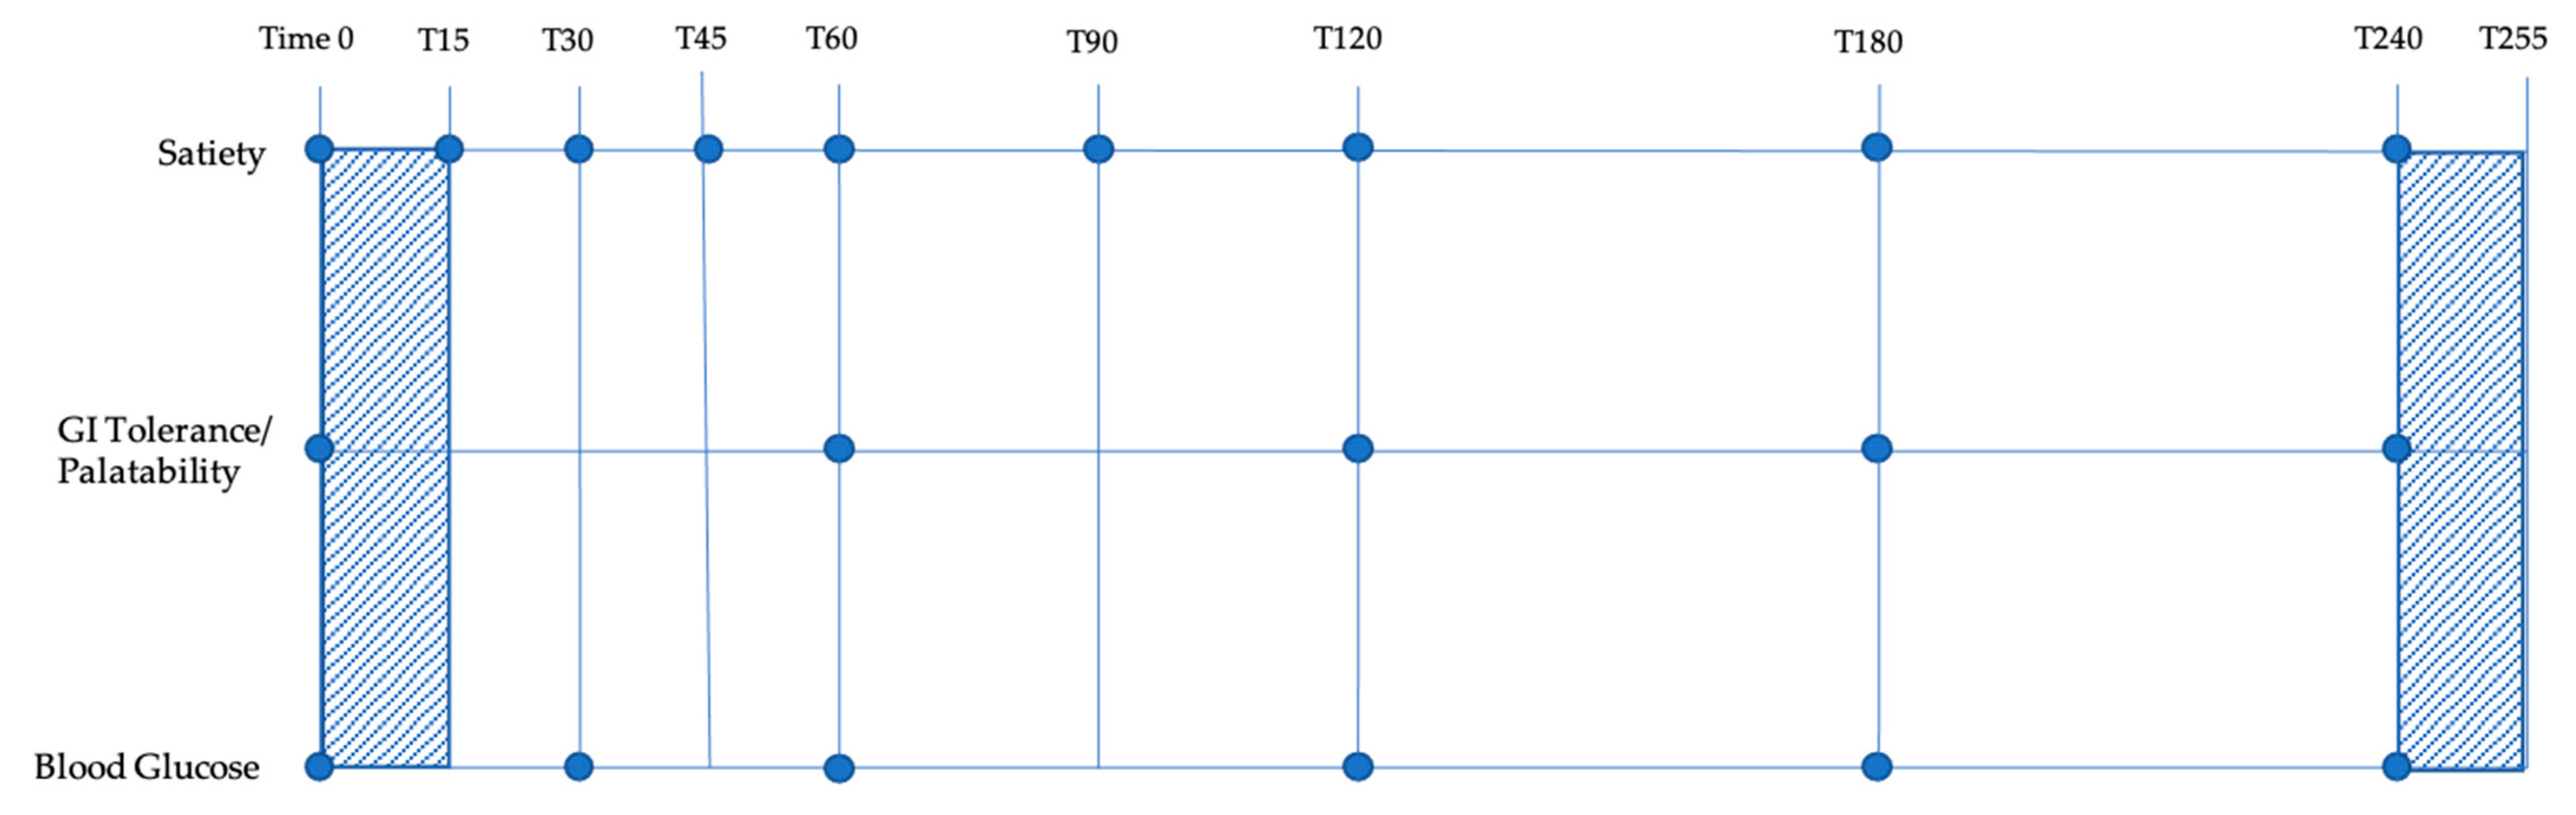
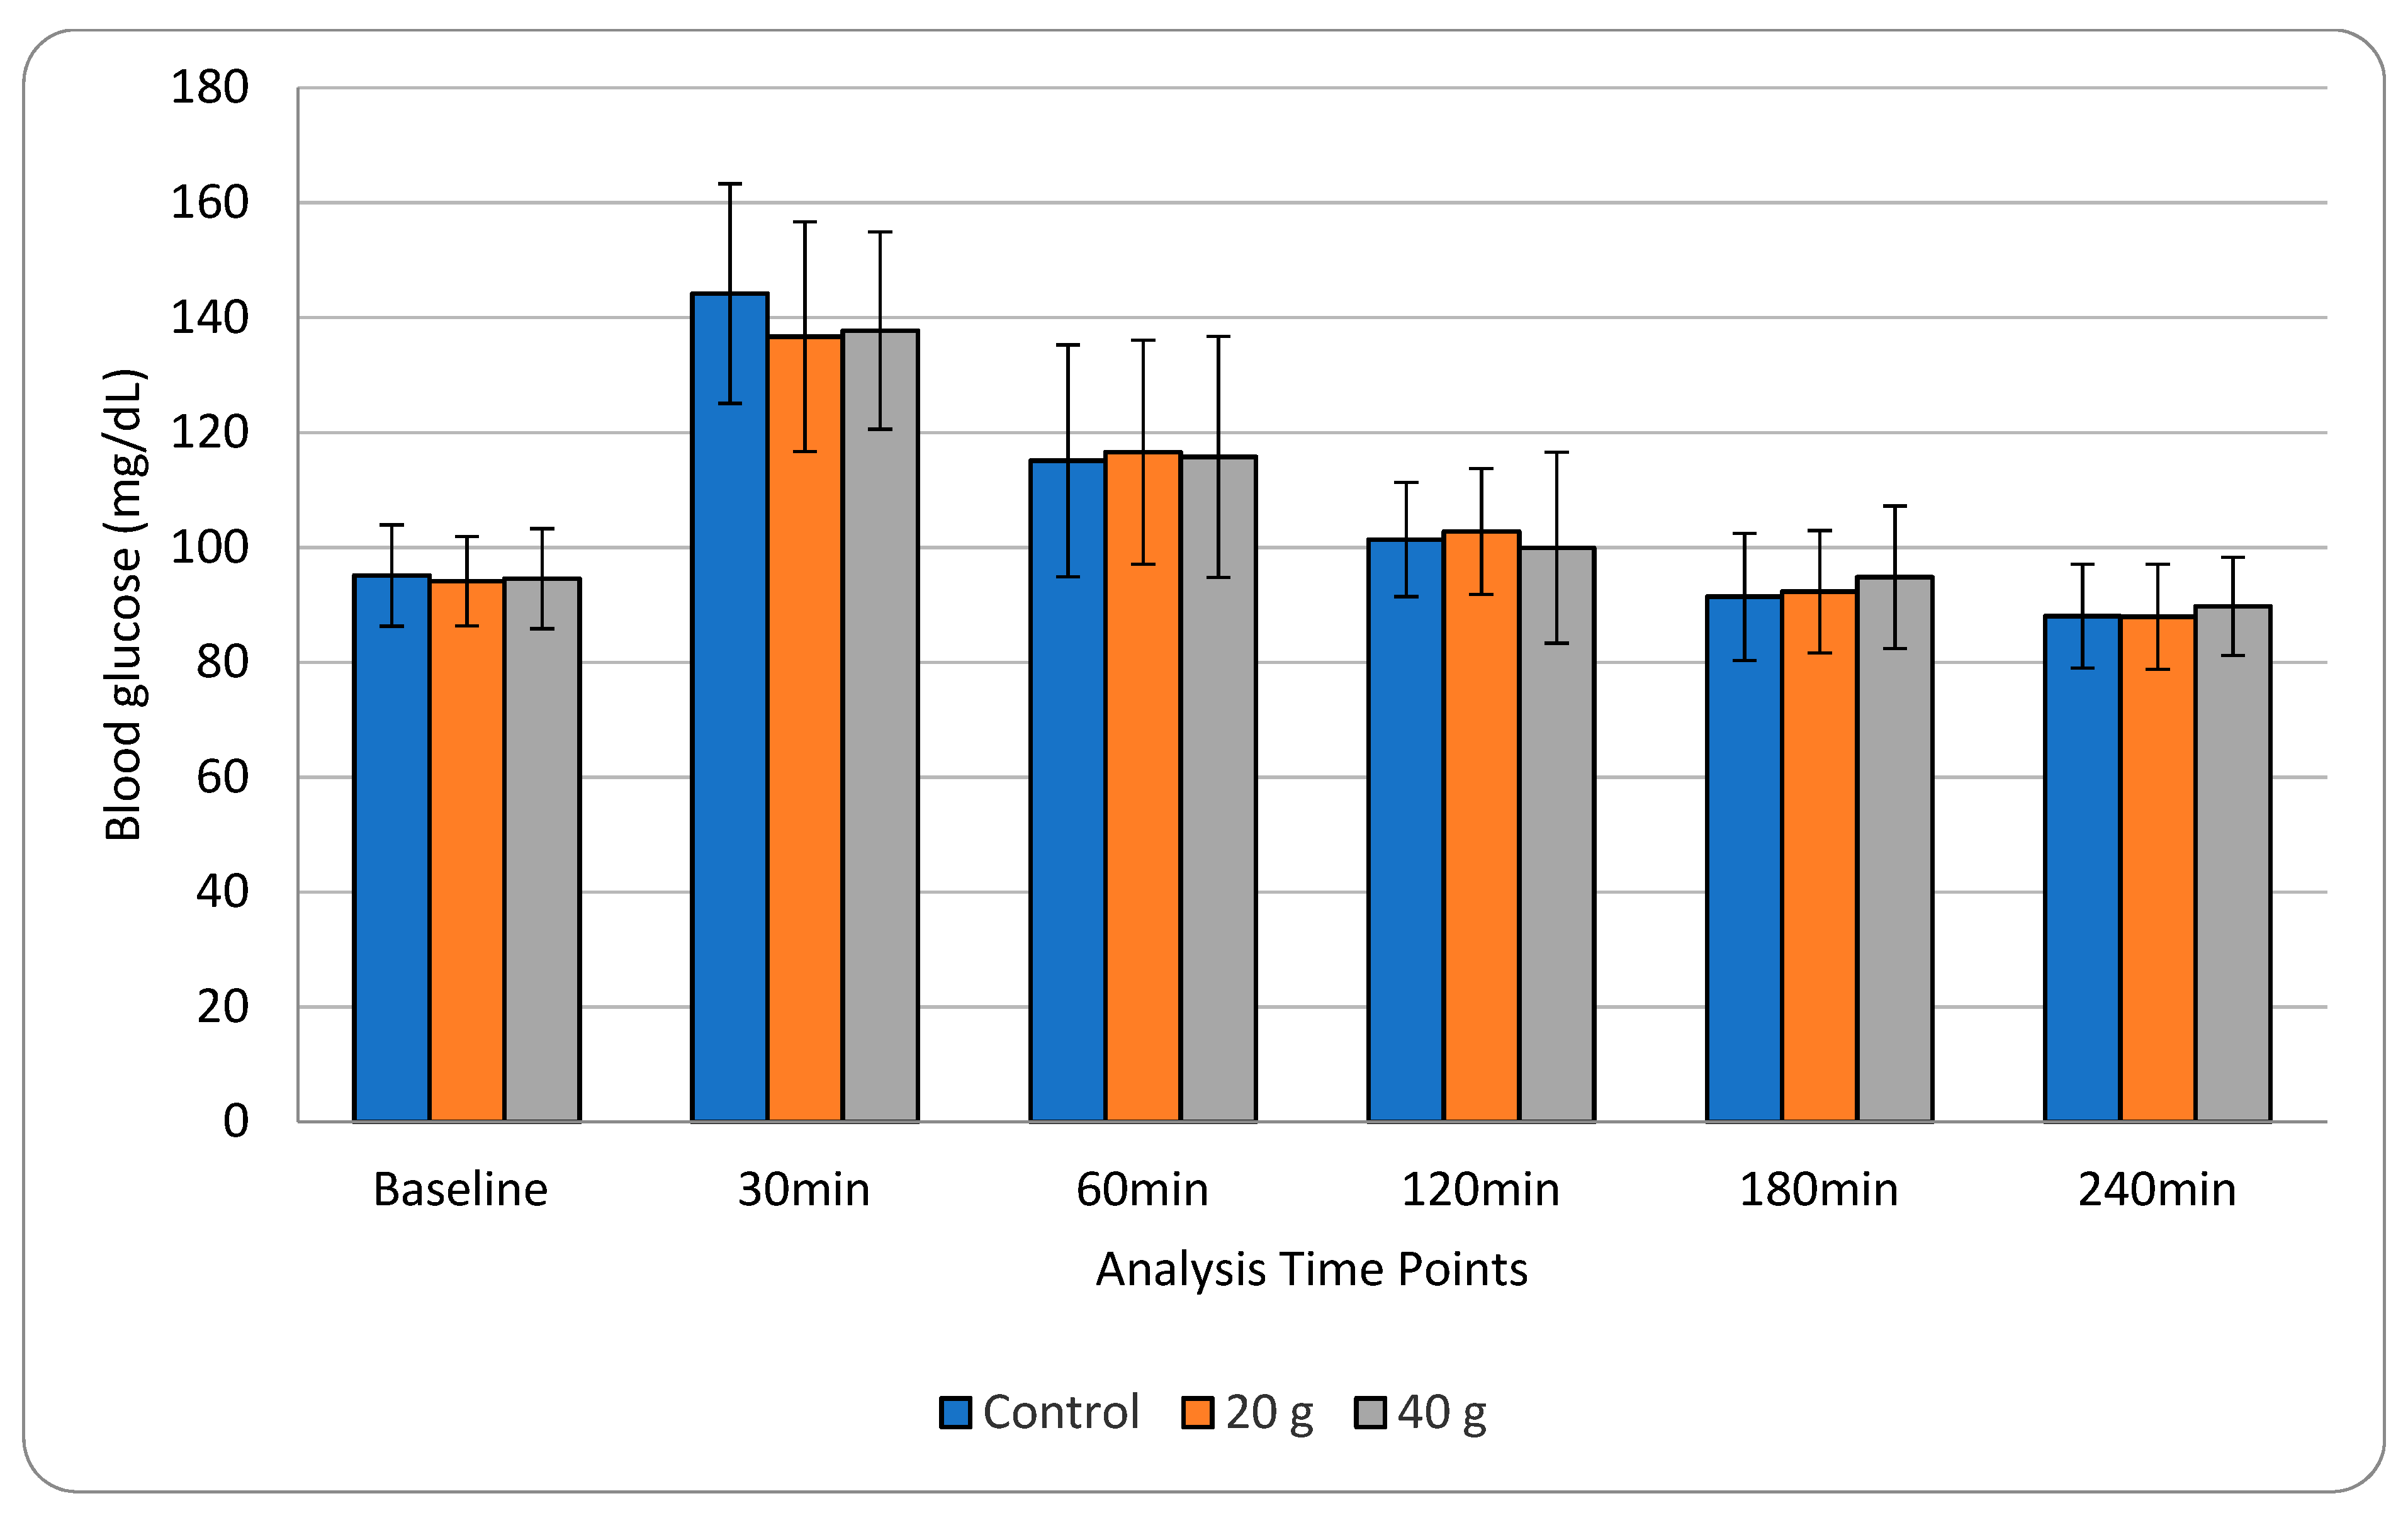
| Baseline | 48 | 95.1 | 8.8 | 48 | 92.6 | 14.5 | 48 | 94.5 | 8.6 | 0.49 |
| 30 min | 48 | 144.2 | 19.1 | 48 | 136.7 | 20.0 | 48 | 137.9 | 17.0 | Overall: 0.011 |
| A vs. B: 0.013 | ||||||||||
| A vs. C: 0.055 | ||||||||||
| B vs. C: 0.84 | ||||||||||
| Baseline to 30 min change | 48 | 49.1 | 18.3 | 48 | 44.1 | 23.5 | 48 | 43.5 | 15.9 | 0.16 |
| Baseline to 60 min change | 48 | 20.0 | 21.0 | 48 | 23.9 | 21.8 | 48 | 21.9 | 21.6 | 0.57 |
| Baseline to 120 min change | 48 | 6.3 | 12.0 | 48 | 10.1 | 16.1 | 48 | 5.2 | 18.1 | 0.28 |
| Baseline to 180 min change | 48 | −3.7 | 10.3 | 48 | −0.3 | 16.1 | 48 | 0.3 | 13.3 | 0.27 |
| Baseline to 240 min change | 48 | −7.1 | 10.2 | 48 | −4.7 | 16.7 | 47 | −4.8 | 10.3 | 0.56 |
| Treatment A | Treatment B | Treatment C | p value | |||||||||||
|---|---|---|---|---|---|---|---|---|---|---|---|---|---|---|
| Outcome | N | Mean | SD | N | Mean | SD | N | Mean | SD | Overall | A vs B | A vs C | B vs C | |
| Overall AUC | Hunger | 42 | 1.9 | 0.55 | 38 | 1.85 | 0.55 | 43 | 1.75 | 0.54 | 0.22 | |||
| Satisfaction | 43 | 1.87 | 0.51 | 39 | 1.79 | 0.59 | 44 | 1.91 | 0.58 | 0.45 | ||||
| Fullness | 43 | 1.82 | 0.54 | 39 | 1.79 | 0.61 | 44 | 1.96 | 0.68 | 0.15 | ||||
| Volume | 43 | 2.2 | 0.6 | 39 | 2.26 | 0.68 | 44 | 2.12 | 0.72 | 0.37 | ||||
| Baseline | Hunger | 48 | 0.69 | 0.23 | 48 | 0.63 | 0.25 | 48 | 0.67 | 0.22 | 0.31 | |||
| Satisfaction | 48 | 0.22 | 0.22 | 48 | 0.22 | 0.22 | 48 | 0.19 | 0.16 | 0.58 | ||||
| Fullness | 48 | 0.18 | 0.21 | 48 | 0.22 | 0.24 | 48 | 0.17 | 0.18 | 0.4 | ||||
| Volume | 48 | 0.75 | 0.2 | 48 | 0.72 | 0.2 | 48 | 0.75 | 0.16 | 0.58 | ||||
| 15 minutes | Hunger | 48 | 0.31 | 0.26 | 48 | 0.26 | 0.24 | 48 | 0.2 | 0.19 | 0.025 | 0.3 | 0.019 | 0.42 |
| Satisfaction | 48 | 0.6 | 0.24 | 48 | 0.63 | 0.25 | 48 | 0.71 | 0.21 | 0.014 | 0.59 | 0.011 | 0.13 | |
| Fullness | 48 | 0.6 | 0.25 | 48 | 0.68 | 0.24 | 48 | 0.71 | 0.23 | 0.004 | 0.051 | 0.003 | 0.59 | |
| Volume | 48 | 0.41 | 0.26 | 48 | 0.37 | 0.26 | 48 | 0.36 | 0.26 | 0.33 | ||||
| 30 minutes | Hunger | 46 | 0.3 | 0.24 | 47 | 0.24 | 0.2 | 46 | 0.2 | 0.19 | 0.016 | 0.2 | 0.012 | 0.45 |
| Satisfaction | 47 | 0.66 | 0.21 | 48 | 0.66 | 0.2 | 47 | 0.69 | 0.22 | 0.59 | ||||
| Fullness | 47 | 0.68 | 0.21 | 48 | 0.69 | 0.2 | 47 | 0.71 | 0.22 | 0.59 | ||||
| Volume | 47 | 0.37 | 0.26 | 48 | 0.36 | 0.26 | 47 | 0.32 | 0.26 | 0.41 | ||||
| 45 minutes | Hunger | 45 | 0.29 | 0.19 | 44 | 0.25 | 0.19 | 46 | 0.25 | 0.22 | 0.29 | |||
| Satisfaction | 46 | 0.66 | 0.18 | 45 | 0.66 | 0.2 | 46 | 0.65 | 0.23 | 0.98 | ||||
| Fullness | 46 | 0.65 | 0.2 | 45 | 0.66 | 0.22 | 46 | 0.68 | 0.24 | 0.62 | ||||
| Volume | 46 | 0.39 | 0.24 | 45 | 0.37 | 0.24 | 46 | 0.37 | 0.27 | 0.74 | ||||
| 60 minutes | Hunger | 47 | 0.34 | 0.21 | 47 | 0.3 | 0.22 | 46 | 0.27 | 0.22 | 0.12 | |||
| Satisfaction | 48 | 0.6 | 0.19 | 48 | 0.6 | 0.21 | 47 | 0.62 | 0.24 | 0.78 | ||||
| Fullness | 48 | 0.6 | 0.21 | 48 | 0.61 | 0.21 | 47 | 0.64 | 0.24 | 0.44 | ||||
| Volume | 48 | 0.42 | 0.24 | 48 | 0.42 | 0.24 | 47 | 0.36 | 0.26 | 0.13 | ||||
| 90 minutes | Hunger | 47 | 0.38 | 0.2 | 45 | 0.34 | 0.22 | 46 | 0.31 | 0.21 | 0.11 | |||
| Satisfaction | 47 | 0.57 | 0.2 | 45 | 0.55 | 0.2 | 47 | 0.58 | 0.23 | 0.83 | ||||
| Fullness | 47 | 0.55 | 0.22 | 45 | 0.53 | 0.23 | 47 | 0.62 | 0.21 | 0.071 | ||||
| Volume | 47 | 0.47 | 0.22 | 45 | 0.47 | 0.22 | 47 | 0.41 | 0.25 | 0.19 | ||||
| 120 minutes | Hunger | 47 | 0.44 | 0.23 | 47 | 0.43 | 0.22 | 47 | 0.41 | 0.23 | 0.73 | |||
| Satisfaction | 47 | 0.47 | 0.19 | 47 | 0.47 | 0.21 | 47 | 0.51 | 0.23 | 0.51 | ||||
| Fullness | 47 | 0.46 | 0.22 | 47 | 0.47 | 0.22 | 47 | 0.52 | 0.24 | 0.24 | ||||
| Volume | 47 | 0.54 | 0.21 | 47 | 0.52 | 0.22 | 47 | 0.48 | 0.23 | 0.32 | ||||
| 180 minutes | Hunger | 48 | 0.58 | 0.22 | 46 | 0.59 | 0.21 | 48 | 0.56 | 0.2 | 0.7 | |||
| Satisfaction | 48 | 0.36 | 0.21 | 46 | 0.33 | 0.2 | 48 | 0.36 | 0.18 | 0.49 | ||||
| Fullness | 48 | 0.35 | 0.21 | 46 | 0.32 | 0.21 | 48 | 0.35 | 0.22 | 0.45 | ||||
| Volume | 48 | 0.68 | 0.18 | 46 | 0.7 | 0.17 | 48 | 0.66 | 0.2 | 0.46 | ||||
| 240 minutes | Hunger | 48 | 0.79 | 0.13 | 48 | 0.78 | 0.14 | 48 | 0.73 | 0.16 | 0.035 | 0.84 | 0.036 | 0.13 |
| Satisfaction | 48 | 0.17 | 0.12 | 48 | 0.18 | 0.12 | 48 | 0.2 | 0.13 | 0.34 | ||||
| Fullness | 48 | 0.17 | 0.17 | 48 | 0.18 | 0.16 | 48 | 0.24 | 0.21 | 0.046 | 0.9 | 0.05 | 0.13 | |
| Volume | 48 | 0.82 | 0.14 | 48 | 0.8 | 0.13 | 48 | 0.79 | 0.15 | 0.26 | ||||
| Treatment A | Treatment B | Treatment C | ||||||||||||||||||
|---|---|---|---|---|---|---|---|---|---|---|---|---|---|---|---|---|---|---|---|---|
| Female | Male | Female | Male | Female | Male | p Value | ||||||||||||||
| Outcome | N | Mean | SD | N | Mean | SD | N | Mean | SD | N | Mean | SD | N | Mean | SD | N | Mean | SD | ||
| Overall AUC | Hunger | 21 | 1.88 | 0.5 | 21 | 1.92 | 0.6 | 20 | 1.8 | 0.57 | 18 | 1.92 | 0.54 | 22 | 1.57 | 0.51 | 21 | 1.93 | 0.52 | 0.14 |
| Satisfaction | 22 | 1.88 | 0.4 | 21 | 1.86 | 0.61 | 21 | 1.72 | 0.6 | 18 | 1.86 | 0.58 | 23 | 2.06 | 0.55 | 21 | 1.75 | 0.58 | 0.033 | |
| Fullness | 22 | 1.84 | 0.46 | 21 | 1.79 | 0.62 | 21 | 1.73 | 0.64 | 18 | 1.86 | 0.59 | 23 | 2.12 | 0.68 | 21 | 1.8 | 0.66 | 0.048 | |
| Volume | 22 | 2.16 | 0.43 | 21 | 2.24 | 0.75 | 21 | 2.25 | 0.62 | 18 | 2.27 | 0.77 | 23 | 1.93 | 0.6 | 21 | 2.32 | 0.79 | 0.039 | |
| Baseline | Hunger | 24 | 0.71 | 0.19 | 24 | 0.68 | 0.27 | 24 | 0.62 | 0.28 | 24 | 0.65 | 0.23 | 24 | 0.65 | 0.24 | 24 | 0.69 | 0.2 | 0.79 |
| Satisfaction | 24 | 0.21 | 0.23 | 24 | 0.23 | 0.22 | 24 | 0.19 | 0.21 | 24 | 0.25 | 0.22 | 24 | 0.19 | 0.18 | 24 | 0.18 | 0.14 | 0.64 | |
| Fullness | 24 | 0.18 | 0.24 | 24 | 0.18 | 0.19 | 24 | 0.18 | 0.22 | 24 | 0.27 | 0.26 | 24 | 0.2 | 0.22 | 24 | 0.15 | 0.14 | 0.23 | |
| Volume | 24 | 0.76 | 0.2 | 24 | 0.74 | 0.21 | 24 | 0.73 | 0.2 | 24 | 0.72 | 0.2 | 24 | 0.72 | 0.17 | 24 | 0.78 | 0.16 | 0.41 | |
| 15 minutes | Hunger | 24 | 0.26 | 0.21 | 24 | 0.35 | 0.3 | 24 | 0.23 | 0.23 | 24 | 0.28 | 0.25 | 24 | 0.18 | 0.2 | 24 | 0.23 | 0.19 | 0.69 |
| Satisfaction | 24 | 0.66 | 0.19 | 24 | 0.54 | 0.28 | 24 | 0.58 | 0.28 | 24 | 0.69 | 0.2 | 24 | 0.72 | 0.2 | 24 | 0.7 | 0.22 | 0.008 | |
| Fullness | 24 | 0.67 | 0.19 | 24 | 0.52 | 0.29 | 24 | 0.68 | 0.24 | 24 | 0.67 | 0.24 | 24 | 0.74 | 0.21 | 24 | 0.69 | 0.24 | 0.084 | |
| Volume | 24 | 0.37 | 0.21 | 24 | 0.45 | 0.3 | 24 | 0.37 | 0.25 | 24 | 0.37 | 0.27 | 24 | 0.32 | 0.23 | 24 | 0.39 | 0.28 | 0.55 | |
| 30 minutes | Hunger | 22 | 0.27 | 0.24 | 24 | 0.33 | 0.24 | 23 | 0.23 | 0.22 | 24 | 0.26 | 0.18 | 22 | 0.13 | 0.13 | 24 | 0.27 | 0.22 | 0.16 |
| Satisfaction | 23 | 0.71 | 0.17 | 24 | 0.61 | 0.25 | 24 | 0.68 | 0.2 | 24 | 0.64 | 0.21 | 23 | 0.73 | 0.2 | 24 | 0.66 | 0.23 | 0.54 | |
| Fullness | 23 | 0.73 | 0.16 | 24 | 0.62 | 0.23 | 24 | 0.71 | 0.2 | 24 | 0.66 | 0.2 | 23 | 0.77 | 0.19 | 24 | 0.65 | 0.24 | 0.24 | |
| Volume | 23 | 0.32 | 0.24 | 24 | 0.43 | 0.28 | 24 | 0.35 | 0.25 | 24 | 0.38 | 0.27 | 23 | 0.29 | 0.24 | 24 | 0.36 | 0.27 | 0.47 | |
| 45 minutes | Hunger | 23 | 0.22 | 0.13 | 22 | 0.36 | 0.22 | 23 | 0.2 | 0.2 | 21 | 0.31 | 0.18 | 23 | 0.16 | 0.15 | 23 | 0.34 | 0.25 | 0.53 |
| Satisfaction | 24 | 0.69 | 0.16 | 22 | 0.63 | 0.21 | 24 | 0.68 | 0.22 | 21 | 0.64 | 0.18 | 23 | 0.7 | 0.21 | 23 | 0.6 | 0.24 | 0.57 | |
| Fullness | 24 | 0.67 | 0.19 | 22 | 0.63 | 0.21 | 24 | 0.69 | 0.22 | 21 | 0.61 | 0.22 | 23 | 0.75 | 0.2 | 23 | 0.61 | 0.27 | 0.25 | |
| Volume | 24 | 0.38 | 0.22 | 22 | 0.41 | 0.27 | 24 | 0.35 | 0.25 | 21 | 0.39 | 0.24 | 23 | 0.33 | 0.26 | 23 | 0.42 | 0.29 | 0.68 | |
| 60 minutes | Hunger | 23 | 0.31 | 0.2 | 24 | 0.37 | 0.23 | 23 | 0.23 | 0.21 | 24 | 0.36 | 0.21 | 22 | 0.16 | 0.14 | 24 | 0.38 | 0.24 | 0.027 |
| Satisfaction | 24 | 0.63 | 0.17 | 24 | 0.58 | 0.22 | 24 | 0.63 | 0.22 | 24 | 0.58 | 0.2 | 23 | 0.69 | 0.22 | 24 | 0.56 | 0.25 | 0.29 | |
| Fullness | 24 | 0.66 | 0.17 | 24 | 0.55 | 0.23 | 24 | 0.66 | 0.2 | 24 | 0.55 | 0.21 | 23 | 0.72 | 0.21 | 24 | 0.57 | 0.24 | 0.74 | |
| Volume | 24 | 0.39 | 0.22 | 24 | 0.44 | 0.27 | 24 | 0.37 | 0.24 | 24 | 0.47 | 0.24 | 23 | 0.26 | 0.2 | 24 | 0.44 | 0.28 | 0.12 | |
| 90 minutes | Hunger | 24 | 0.31 | 0.17 | 23 | 0.44 | 0.21 | 22 | 0.28 | 0.21 | 23 | 0.41 | 0.22 | 23 | 0.23 | 0.18 | 23 | 0.39 | 0.2 | 0.62 |
| Satisfaction | 24 | 0.6 | 0.18 | 23 | 0.53 | 0.22 | 22 | 0.57 | 0.22 | 23 | 0.52 | 0.18 | 24 | 0.6 | 0.24 | 23 | 0.55 | 0.22 | 0.96 | |
| Fullness | 24 | 0.59 | 0.24 | 23 | 0.51 | 0.21 | 22 | 0.57 | 0.25 | 23 | 0.5 | 0.21 | 24 | 0.67 | 0.2 | 23 | 0.56 | 0.21 | 0.81 | |
| Volume | 24 | 0.43 | 0.2 | 23 | 0.52 | 0.24 | 22 | 0.44 | 0.23 | 23 | 0.5 | 0.22 | 24 | 0.35 | 0.24 | 23 | 0.47 | 0.25 | 0.57 | |
| 120 minutes | Hunger | 23 | 0.41 | 0.23 | 24 | 0.47 | 0.23 | 24 | 0.39 | 0.21 | 23 | 0.47 | 0.22 | 24 | 0.33 | 0.23 | 23 | 0.49 | 0.19 | 0.37 |
| Satisfaction | 23 | 0.49 | 0.18 | 24 | 0.45 | 0.21 | 24 | 0.49 | 0.22 | 23 | 0.45 | 0.21 | 24 | 0.6 | 0.21 | 23 | 0.41 | 0.2 | 0.059 | |
| Fullness | 23 | 0.47 | 0.24 | 24 | 0.44 | 0.21 | 24 | 0.48 | 0.24 | 23 | 0.47 | 0.2 | 24 | 0.59 | 0.25 | 23 | 0.45 | 0.2 | 0.25 | |
| Volume | 23 | 0.52 | 0.18 | 24 | 0.56 | 0.24 | 24 | 0.49 | 0.23 | 23 | 0.55 | 0.21 | 24 | 0.4 | 0.22 | 23 | 0.57 | 0.22 | 0.19 | |
| 180 minutes | Hunger | 24 | 0.61 | 0.2 | 24 | 0.55 | 0.24 | 23 | 0.59 | 0.24 | 23 | 0.6 | 0.19 | 24 | 0.57 | 0.21 | 24 | 0.56 | 0.19 | 0.53 |
| Satisfaction | 24 | 0.35 | 0.19 | 24 | 0.37 | 0.24 | 23 | 0.32 | 0.21 | 23 | 0.33 | 0.18 | 24 | 0.38 | 0.18 | 24 | 0.33 | 0.18 | 0.48 | |
| Fullness | 24 | 0.35 | 0.2 | 24 | 0.36 | 0.23 | 23 | 0.31 | 0.24 | 23 | 0.33 | 0.17 | 24 | 0.37 | 0.24 | 24 | 0.32 | 0.19 | 0.49 | |
| Volume | 24 | 0.69 | 0.11 | 24 | 0.67 | 0.22 | 23 | 0.71 | 0.13 | 23 | 0.68 | 0.2 | 24 | 0.63 | 0.2 | 24 | 0.69 | 0.2 | 0.2 | |
| 240 minutes | Hunger | 24 | 0.8 | 0.13 | 24 | 0.78 | 0.13 | 24 | 0.82 | 0.09 | 24 | 0.74 | 0.17 | 24 | 0.74 | 0.17 | 24 | 0.72 | 0.15 | 0.28 |
| Satisfaction | 24 | 0.15 | 0.11 | 24 | 0.19 | 0.13 | 24 | 0.15 | 0.1 | 24 | 0.21 | 0.13 | 24 | 0.19 | 0.13 | 24 | 0.21 | 0.14 | 0.48 | |
| Fullness | 24 | 0.13 | 0.13 | 24 | 0.22 | 0.2 | 24 | 0.12 | 0.1 | 24 | 0.24 | 0.18 | 24 | 0.22 | 0.21 | 24 | 0.26 | 0.21 | 0.39 | |
| Volume | 24 | 0.81 | 0.15 | 24 | 0.82 | 0.14 | 24 | 0.81 | 0.1 | 24 | 0.78 | 0.15 | 24 | 0.79 | 0.15 | 24 | 0.78 | 0.15 | 0.6 | |
| Treatment A | Treatment B | Treatment C | ||||||||
|---|---|---|---|---|---|---|---|---|---|---|
| Outcome | N | Mean | SD | N | Mean | SD | N | Mean | SD | p Value |
| AL Pizza calories | 48 | 756.5 | 274.1 | 47 | 741.7 | 229.7 | 48 | 737.0 | 243.5 | 0.75 |
| 24-hr Total calories | 48 | 1790 | 749 | 48 | 1625 | 642 | 48 | 1590 | 691 | 0.12 |
| Female: Total calories | 24 | 1721 | 762 | 24 | 1516 | 612 | 24 | 1676 | 732 | 0.16 |
| Male: Total calories | 24 | 1859 | 747 | 24 | 1734 | 666 | 24 | 1505 | 651 | 0.16 |
Publisher’s Note: MDPI stays neutral with regard to jurisdictional claims in published maps and institutional affiliations. |
© 2021 by the authors. Licensee MDPI, Basel, Switzerland. This article is an open access article distributed under the terms and conditions of the Creative Commons Attribution (CC BY) license (http://creativecommons.org/licenses/by/4.0/).
Share and Cite
Larson, R.; Nelson, C.; Korczak, R.; Willis, H.; Erickson, J.; Wang, Q.; Slavin, J. Acacia Gum Is Well Tolerated While Increasing Satiety and Lowering Peak Blood Glucose Response in Healthy Human Subjects. Nutrients 2021, 13, 618. https://doi.org/10.3390/nu13020618
Larson R, Nelson C, Korczak R, Willis H, Erickson J, Wang Q, Slavin J. Acacia Gum Is Well Tolerated While Increasing Satiety and Lowering Peak Blood Glucose Response in Healthy Human Subjects. Nutrients. 2021; 13(2):618. https://doi.org/10.3390/nu13020618
Chicago/Turabian StyleLarson, Riley, Courtney Nelson, Renee Korczak, Holly Willis, Jennifer Erickson, Qi Wang, and Joanne Slavin. 2021. "Acacia Gum Is Well Tolerated While Increasing Satiety and Lowering Peak Blood Glucose Response in Healthy Human Subjects" Nutrients 13, no. 2: 618. https://doi.org/10.3390/nu13020618
APA StyleLarson, R., Nelson, C., Korczak, R., Willis, H., Erickson, J., Wang, Q., & Slavin, J. (2021). Acacia Gum Is Well Tolerated While Increasing Satiety and Lowering Peak Blood Glucose Response in Healthy Human Subjects. Nutrients, 13(2), 618. https://doi.org/10.3390/nu13020618