
Regional Difference in the Association between the Trajectory of Selenium Intake and Hypertension: A 20-Year Cohort Study

 , and
, and 
Abstract
:
1. Introduction
2. Methods
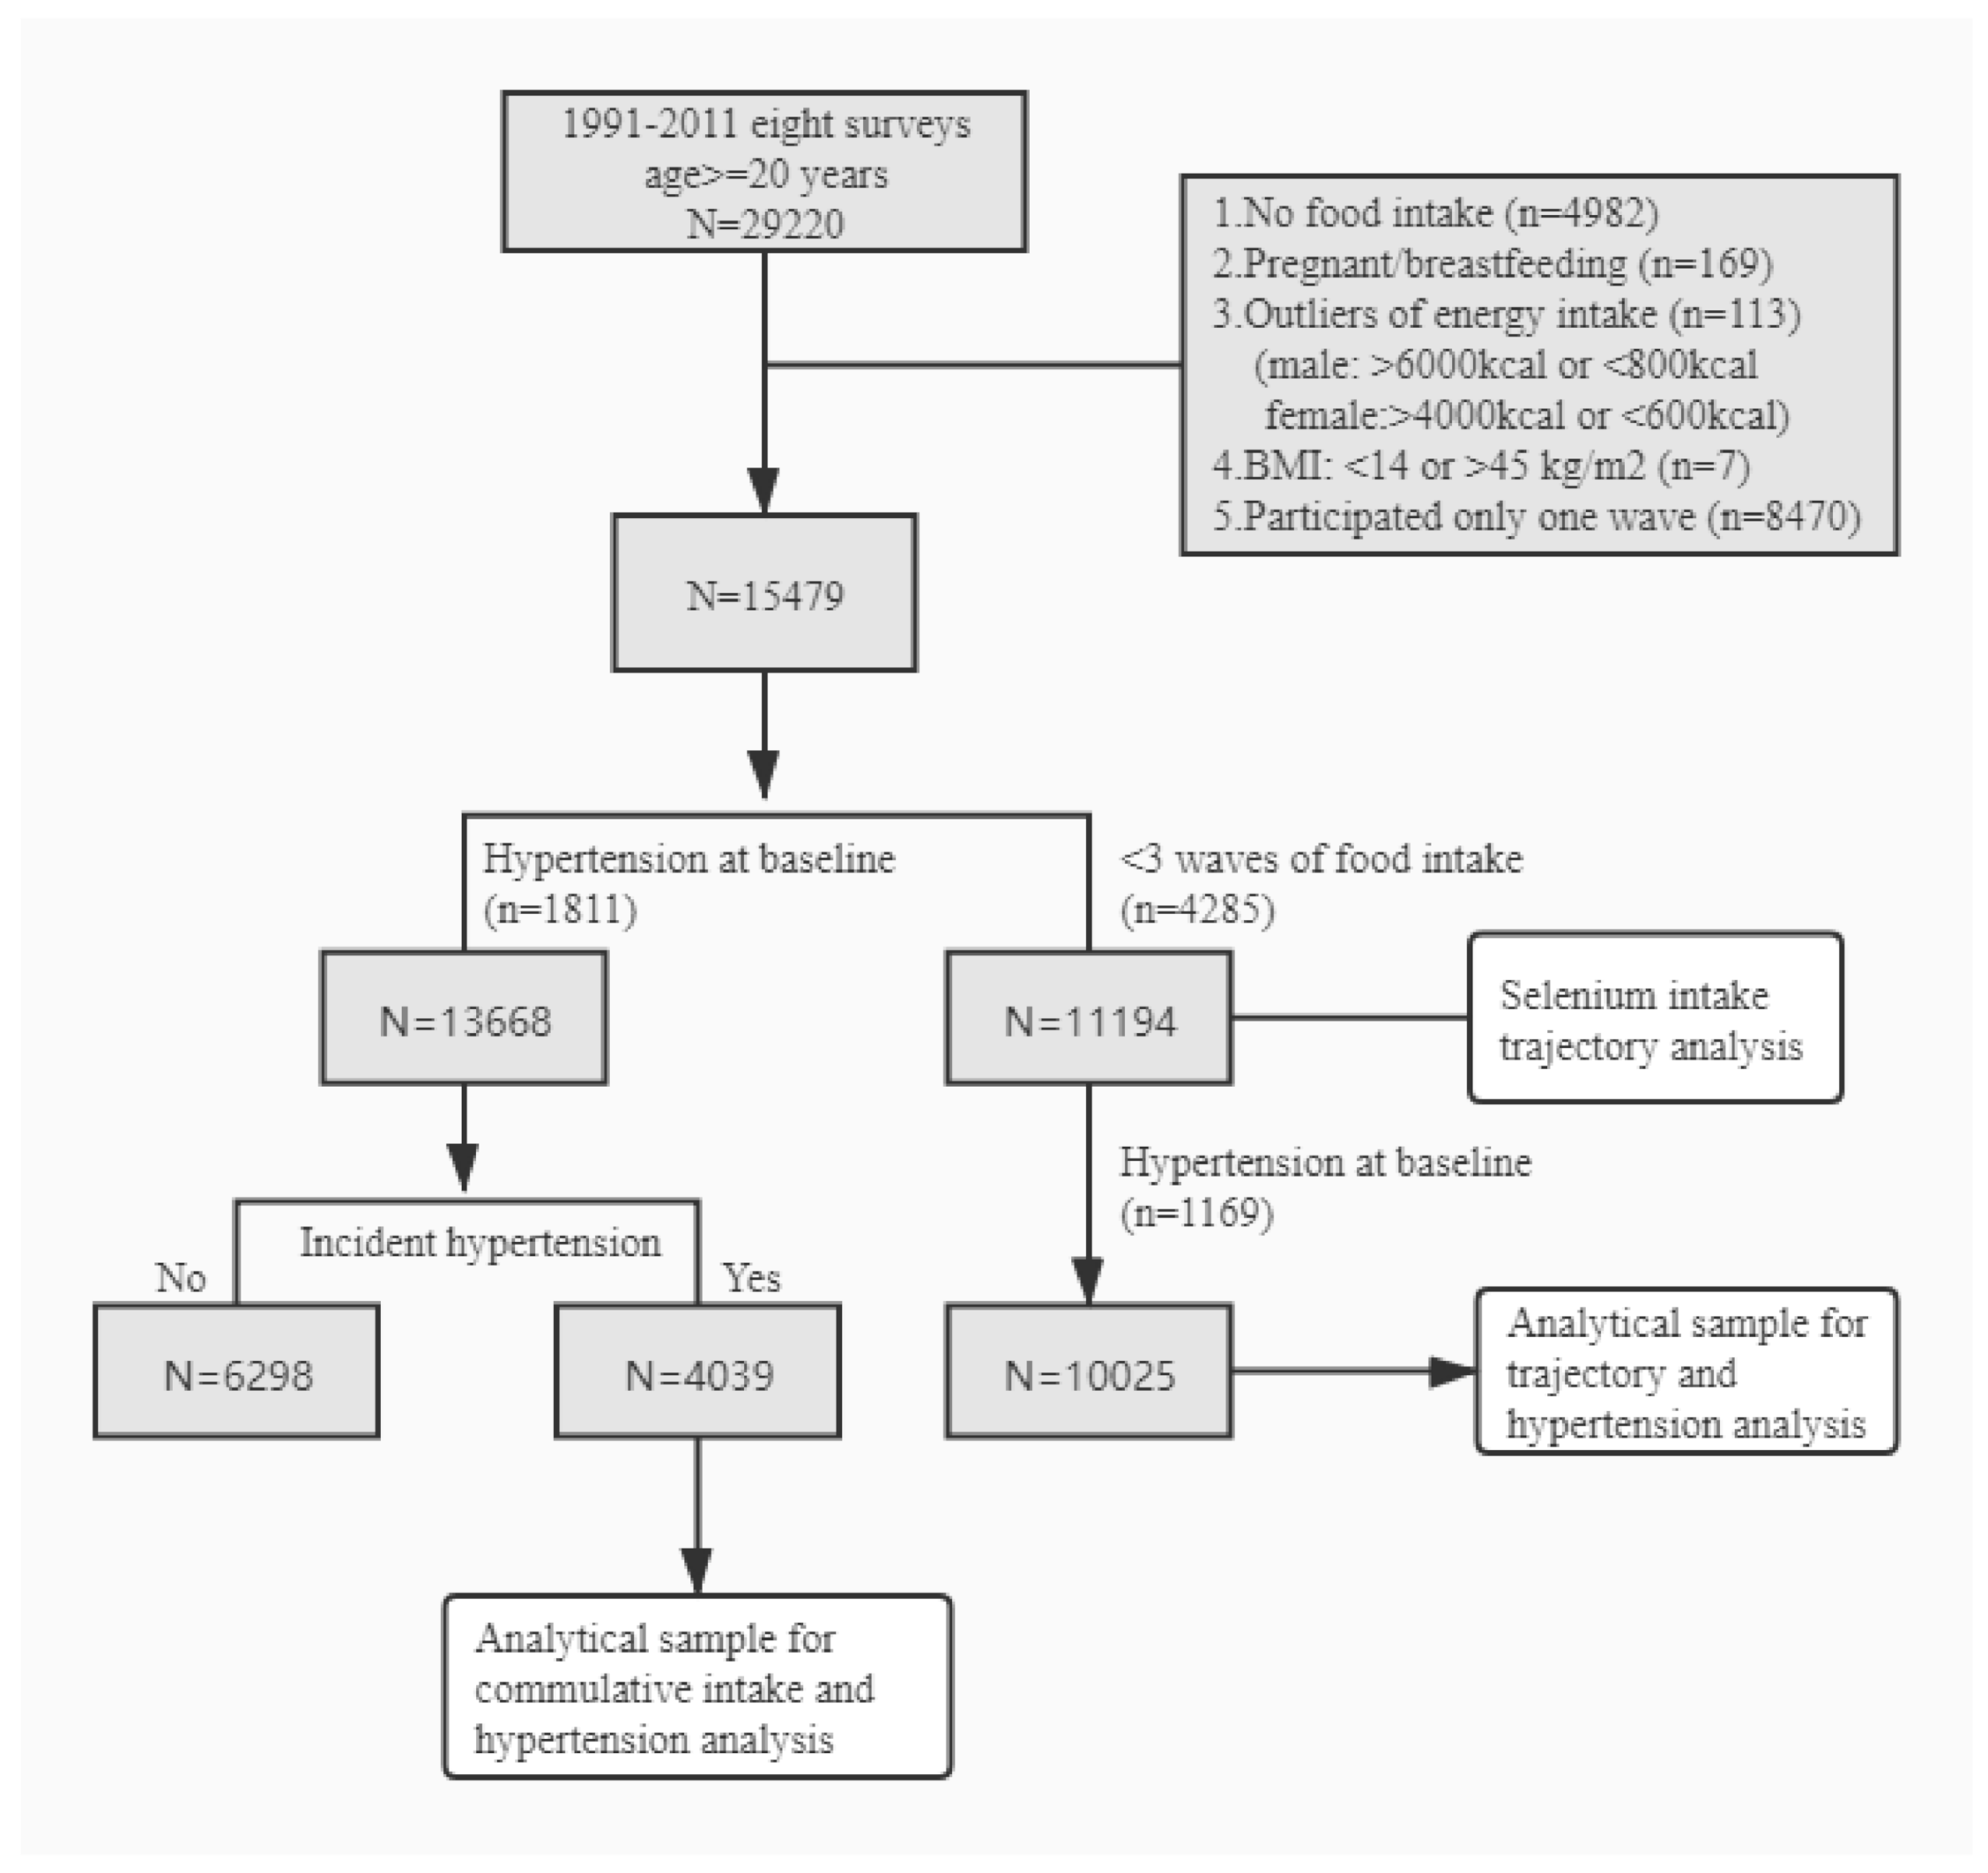
2.1. Study Sample
2.2. Outcome Variable: Hypertension
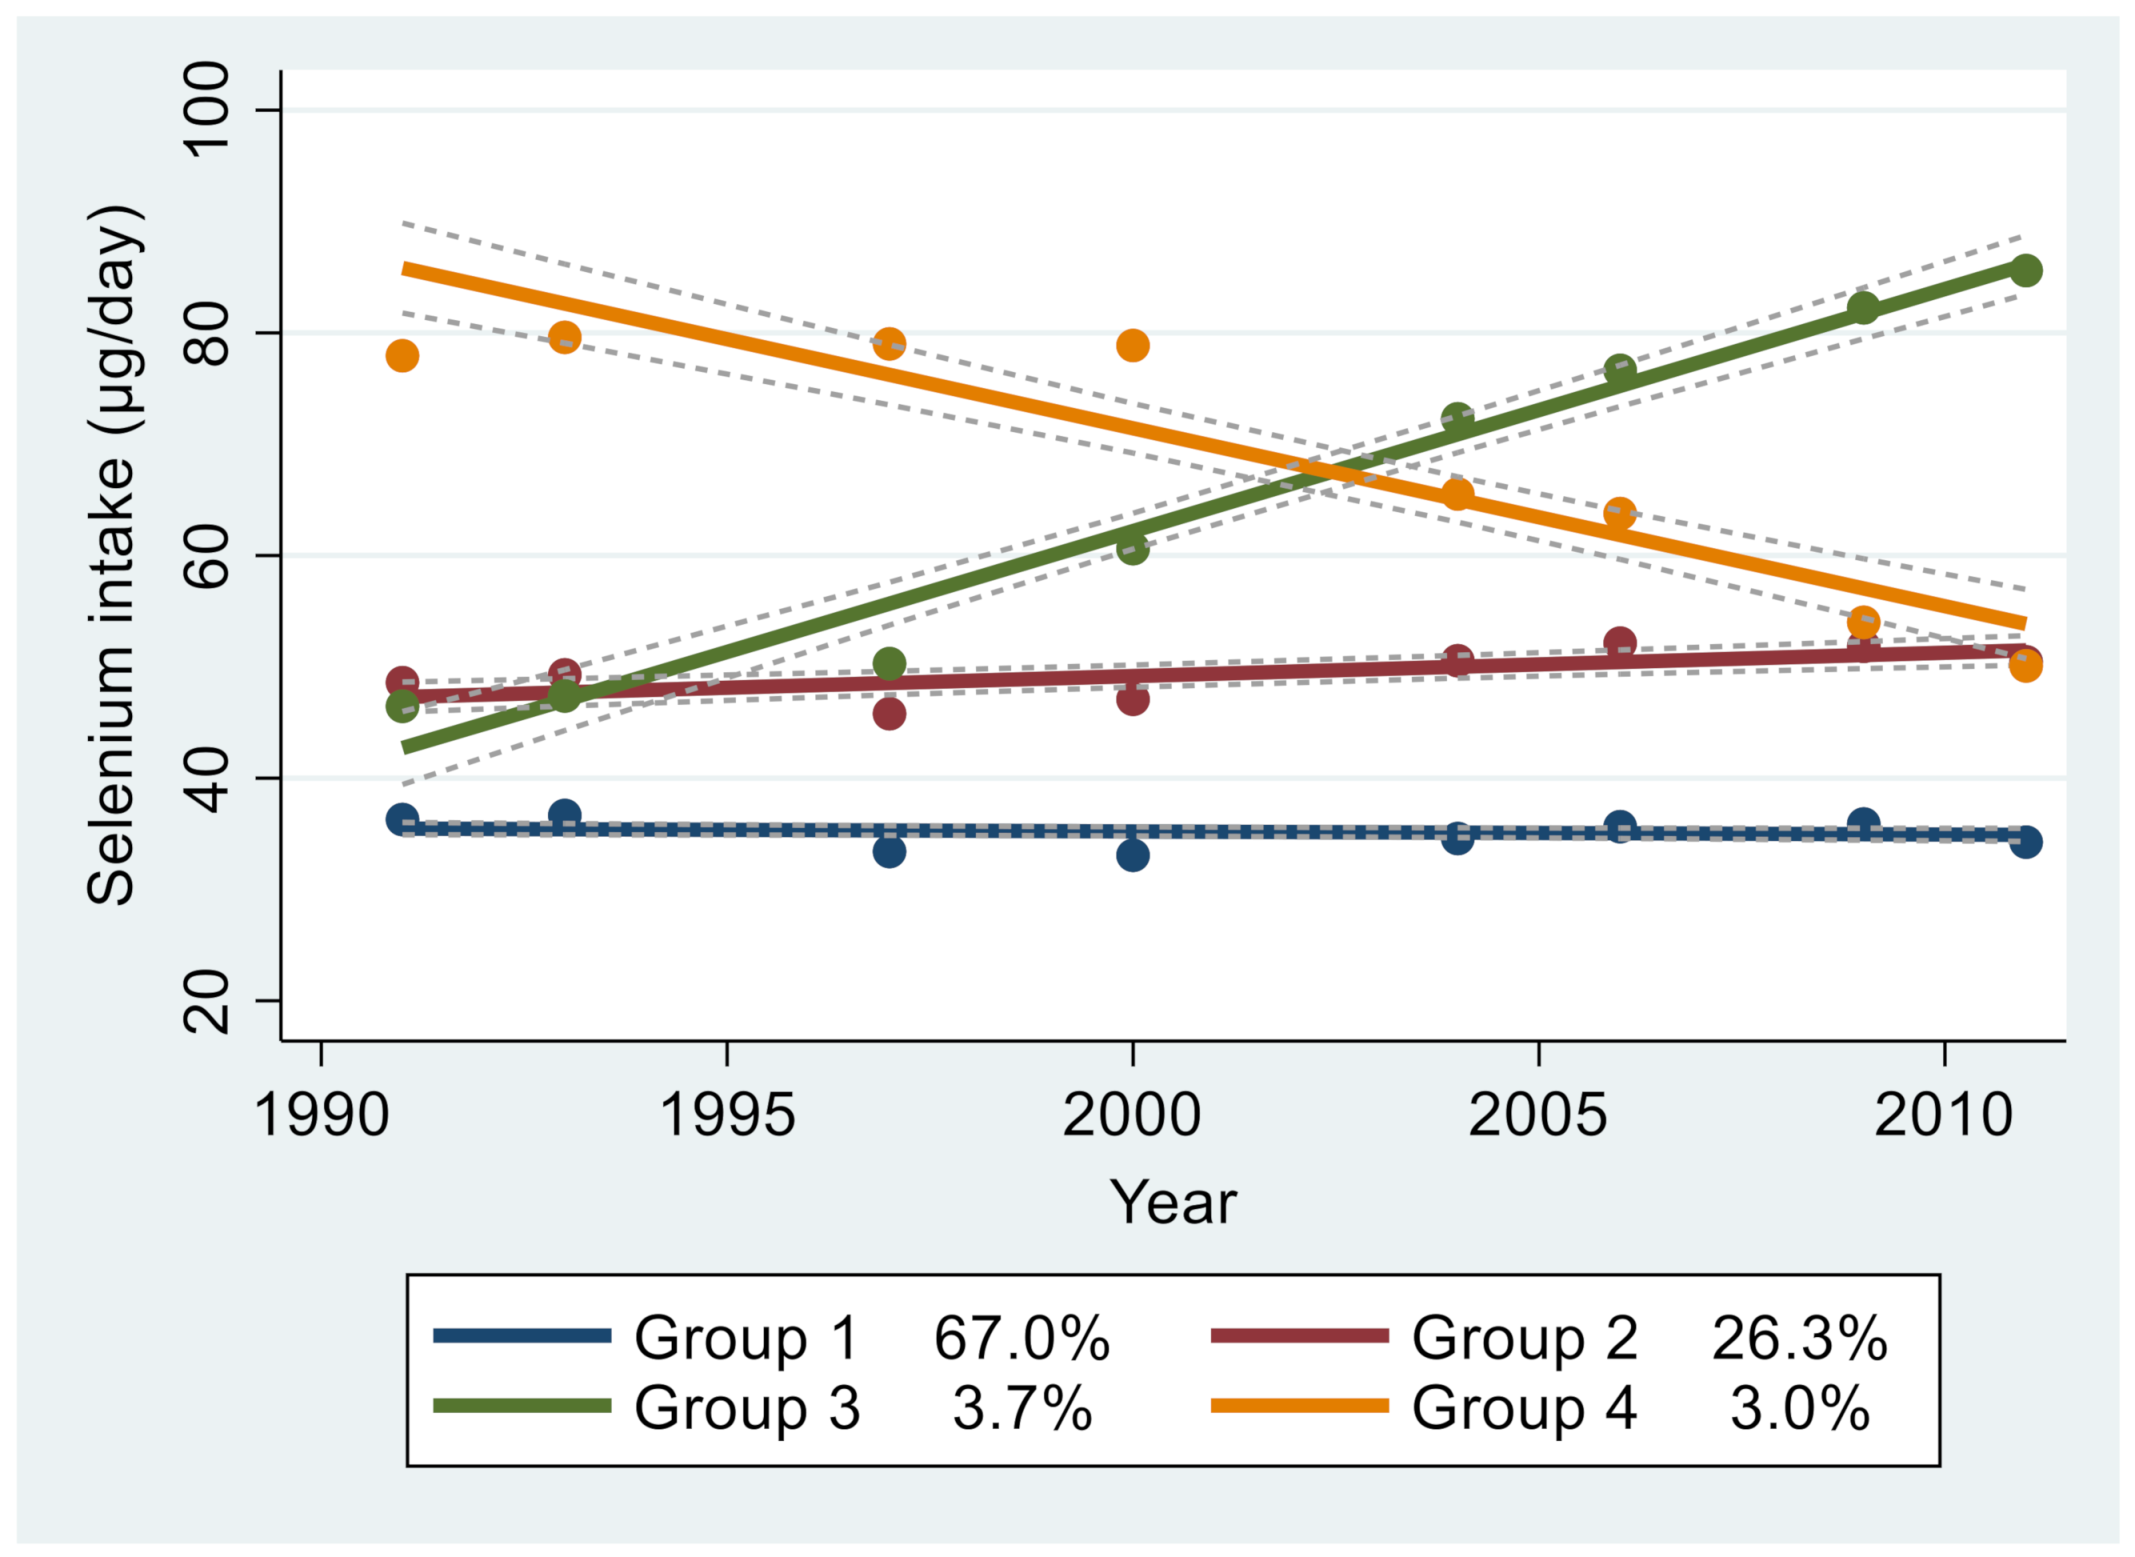
2.3. Exposure Variables: Selenium Intake
2.4. Covariates
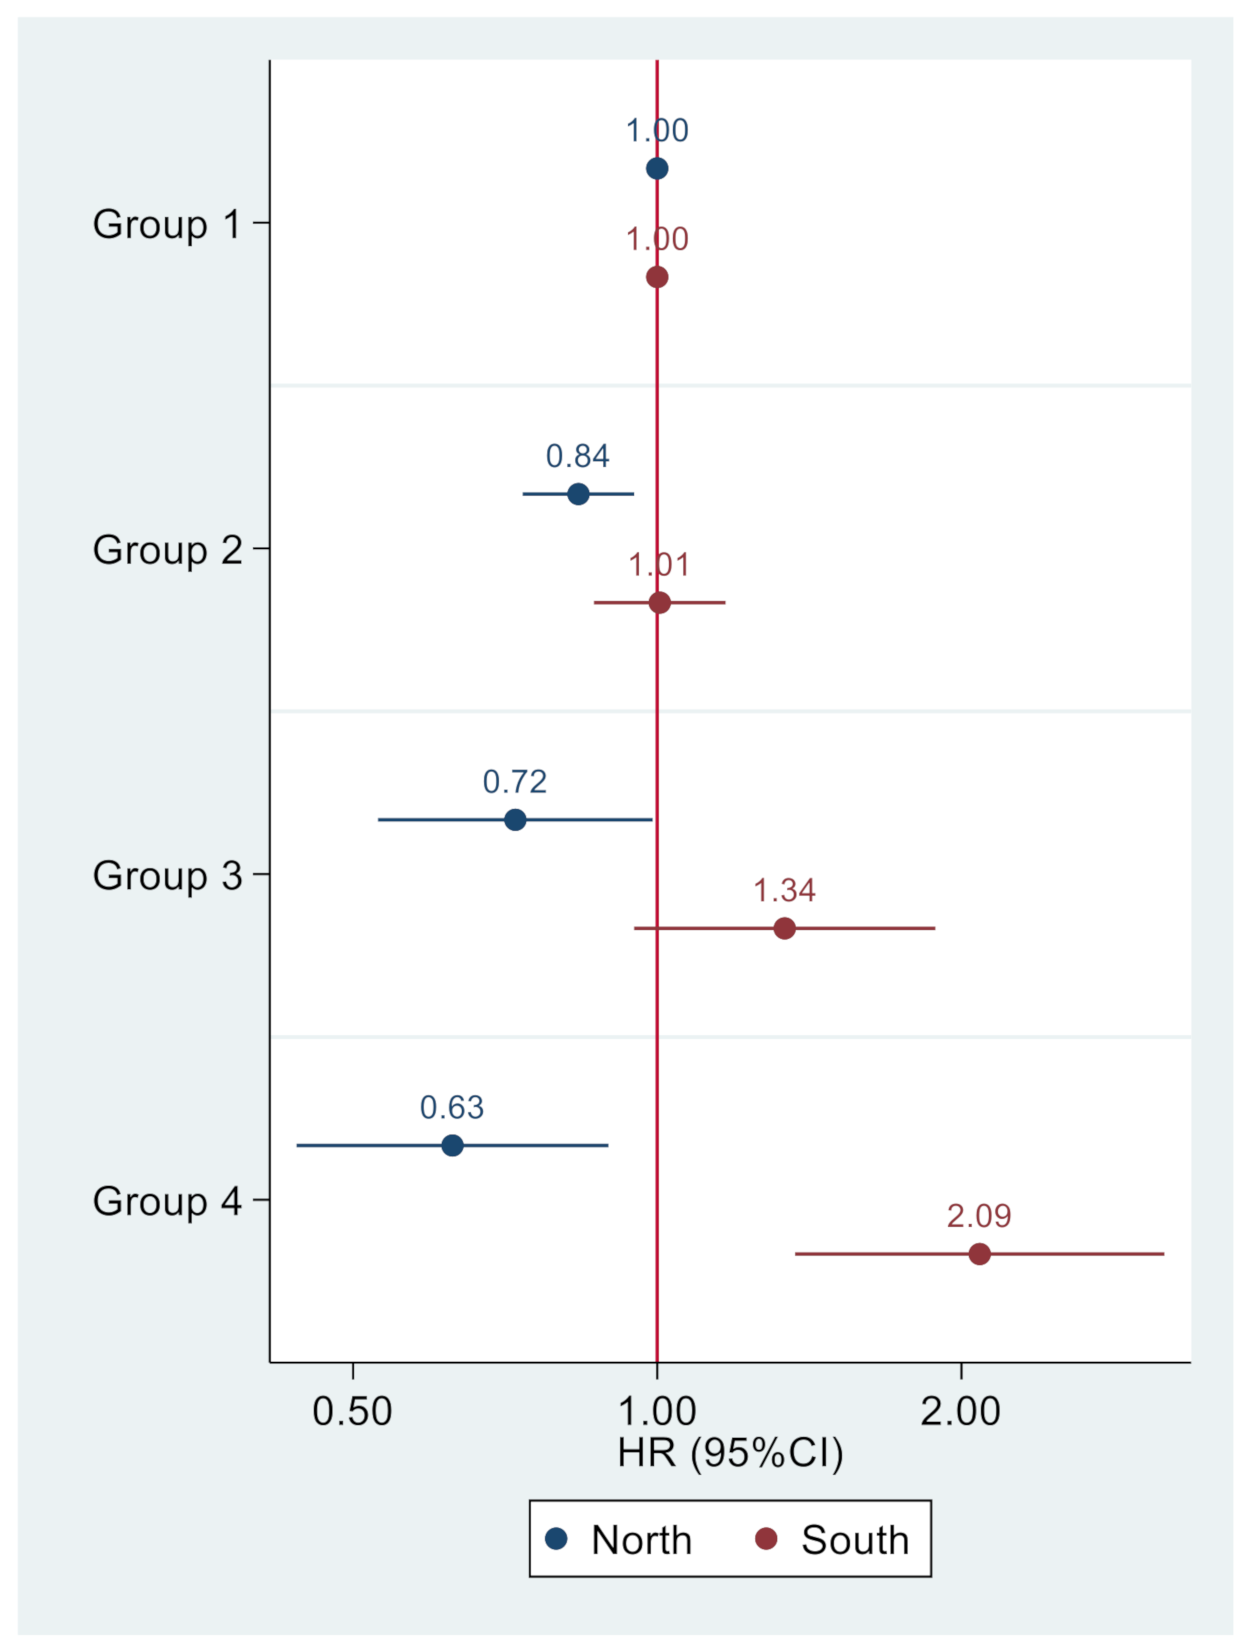
2.5. Statistical Analysis
3. Results
4. Discussion
5. Conclusions
Supplementary Materials
Author Contributions
Funding
Institutional Review Board Statement
Informed Consent Statement
Data Availability Statement
Acknowledgments
Conflicts of Interest
Abbreviations
References
- WHO. Global Status Report on Noncommunicable Diseases 2014. Available online: https://apps.who.int/iris/bitstream/handle/10665/148114/9789241564854_eng.pdf?sequence=1 (accessed on 9 October 2020).
- Wang, Z.; Chen, Z.; Zhang, L.; Wang, X.; Hao, G.; Zhang, Z.; Shao, L.; Tian, Y.; Dong, Y.; Zheng, C.; et al. Status of hypertension in China: Results from the china hypertension survey, 2012–2015. Circulation 2018, 137, 2344–2356. [Google Scholar] [CrossRef] [PubMed]
- Ndanuko, R.N.; Tapsell, L.C.; Charlton, K.E.; Neale, E.P.; Batterham, M.J. Dietary patterns and blood pressure in adults: A systematic review and meta-analysis of randomized controlled trials. Adv. Nutr. 2016, 7, 76–89. [Google Scholar] [CrossRef] [PubMed]
- Rayman, M.P. Selenium and human health. Lancet 2012, 379, 1256–1268. [Google Scholar] [CrossRef]
- Kieliszek, M.; Błażejak, S. Current knowledge on the importance of selenium in food for living organisms: A review. Molecules 2016, 21, 609. [Google Scholar] [CrossRef] [Green Version]
- Schomburg, L. Dietary selenium and human health. Nutrients 2016, 9, 22. [Google Scholar] [CrossRef] [Green Version]
- Jones, G.D.; Droz, B.; Greve, P.; Gottschalk, P.; Poffet, D.; McGrath, S.P.; Seneviratne, S.I.; Smith, P.; Winkel, L.H. Selenium deficiency risk predicted to increase under future climate change. Proc. Natl. Acad. Sci. USA 2017, 114, 2848–2853. [Google Scholar] [CrossRef] [Green Version]
- Li, S.; Bañuelos, G.S.; Wu, L.; Shi, W. The changing selenium nutritional status of Chinese residents. Nutrients 2014, 6, 1103–1114. [Google Scholar] [CrossRef] [Green Version]
- Benstoem, C.; Goetzenich, A.; Kraemer, S.; Borosch, S.; Manzanares, W.; Hardy, G.; Stoppe, C. Selenium and its supplementation in cardiovascular disease—What do we know? Nutrients 2015, 7, 3094–3118. [Google Scholar] [CrossRef] [Green Version]
- Loscalzo, J. Keshan disease, selenium deficiency, and the selenoproteome. N. Engl. J. Med. 2014, 370, 1756–1760. [Google Scholar] [CrossRef]
- Kuruppu, D.; Hendrie, H.C.; Yang, L.; Gao, S. Selenium levels and hypertension: A systematic review of the literature. Public Health Nutr. 2014, 17, 1342–1352. [Google Scholar] [CrossRef]
- Retondario, A.; Fernandes, R.; Rockenbach, G.; Alves, M.A.; Bricarello, L.P.; Trindade, E.; Vasconcelos, F.A.G. Selenium intake and metabolic syndrome: A systematic review. Clin. Nutr. 2019, 38, 603–614. [Google Scholar] [CrossRef]
- MacFarquhar, J.K.; Broussard, D.L.; Melstrom, P.; Hutchinson, R.; Wolkin, A.; Martin, C.; Burk, R.F.; Dunn, J.R.; Green, A.L.; Hammond, R.; et al. Acute selenium toxicity associated with a dietary supplement. Arch. Intern. Med. 2010, 170, 256–261. [Google Scholar] [CrossRef] [Green Version]
- Yang, Y. China Food Composition Tables (Standard Edition), 6th ed.; Peking University Medical Press: Beijing, China, 2018; Volume 1. [Google Scholar]
- Hu, F.B.; Stampfer, M.J.; Rimm, E.; Ascherio, A.; Rosner, B.A.; Spiegelman, D.; Willett, W.C. Dietary fat and coronary heart disease: A comparison of approaches for adjusting for total energy intake and modeling repeated dietary measurements. Am. J. Epidemiol. 1999, 149, 531–540. [Google Scholar] [CrossRef] [Green Version]
- Zhai, F.Y.; Du, S.F.; Wang, Z.H.; Zhang, J.G.; Du, W.W.; Popkin, B.M. Dynamics of the Chinese diet and the role of urbanicity, 1991–2011. Obes. Rev. 2014, 15, 16–26. [Google Scholar] [CrossRef] [Green Version]
- Zhou, B.F. Effect of body mass index on all-cause mortality and incidence of cardiovascular diseases—Report for meta-analysis of prospective studies open optimal cut-off points of body mass index in Chinese adults. Biomed. Environ. Sci. BES 2002, 15, 245–252. [Google Scholar]
- Zhou, B.F. Predictive values of body mass index and waist circumference for risk factors of certain related diseases in Chinese adults—Study on optimal cut-off points of body mass index and waist circumference in Chinese adults. Biomed. Environ. Sci. BES 2002, 15, 83–96. [Google Scholar]
- Shi, Z.; Taylor, A.W.; Riley, M.; Byles, J.; Liu, J.; Noakes, M. Association between dietary patterns, cadmium intake and chronic kidney disease among adults. Clin. Nutr. 2018, 37, 276–284. [Google Scholar] [CrossRef]
- Chinese Nutrition Society. Chinese DRIs Handbook; Standards Press of China: Beijing, China, 2013. [Google Scholar]
- Nawrot, T.S.; Staessen, J.A.; Roels, H.A.; Den Hond, E.; Thijs, L.; Fagard, R.H.; Dominiczak, A.F.; Struijker-Boudier, H.A. Blood pressure and blood selenium: A cross-sectional and longitudinal population study. Eur. Heart J. 2007, 28, 628–633. [Google Scholar] [CrossRef] [Green Version]
- Su, L.; Jin, Y.; Unverzagt, F.W.; Liang, C.; Cheng, Y.; Hake, A.M.; Kuruppu, D.; Ma, F.; Liu, J.; Chen, C.; et al. Longitudinal association between selenium levels and hypertension in a rural elderly Chinese cohort. J. Nutr. Health Aging 2016, 20, 983–988. [Google Scholar] [CrossRef] [Green Version]
- Liu, L.; Lin, G.; Wang, H.; Zhang, B.; Du, S. Selenium exposure and incident hypertension among Chinese adults (P24-020-19). Curr. Dev. Nutr. 2019, 3. [Google Scholar] [CrossRef] [Green Version]
- Wei, J.; Zeng, C.; Gong, Q.Y.; Li, X.X.; Lei, G.H.; Yang, T.B. Associations between dietary antioxidant intake and metabolic syndrome. PLoS ONE 2015, 10, e0130876. [Google Scholar] [CrossRef] [PubMed]
- Li, Y.; Guo, H.; Wu, M.; Liu, M. Serum and dietary antioxidant status is associated with lower prevalence of the metabolic syndrome in a study in Shanghai, China. Asia Pac. J. Clin. Nutr. 2013, 22, 60–68. [Google Scholar] [CrossRef] [PubMed]
- Kieliszek, M. Selenium-fascinating microelement, properties and sources in food. Molecules 2019, 24, 1298. [Google Scholar] [CrossRef] [PubMed] [Green Version]
- Thomson, C.D. Assessment of requirements for selenium and adequacy of selenium status: A review. Eur. J. Clin. Nutr. 2004, 58, 391–402. [Google Scholar] [CrossRef] [Green Version]
- Yuan, L.; Yin, X.; Zhu, Y.; Li, F.; Huang, Y.; Liu, Y.; Lin, Z. Selenium in plants and soils, and selenosis in Enshi, China: Implications for selenium biofortification. In Phytoremediation and Biofortification: Two Sides of One Coin; Yin, X., Yuan, L., Eds.; Springer: Dordrecht, The Netherlands, 2012; pp. 7–31. [Google Scholar] [CrossRef]
- Sun, G.-X.; Meharg, A.A.; Li, G.; Chen, Z.; Yang, L.; Chen, S.-C.; Zhu, Y.-G. Distribution of soil selenium in China is potentially controlled by deposition and volatilization? Sci. Rep. 2016, 6, 20953. [Google Scholar] [CrossRef] [Green Version]
- Zagrodzki, P.; Laszczyk, P. Selenium and cardiovascular disease: Selected issues. Postepy Hig. I Med. Dosw. 2006, 60, 624–631. [Google Scholar]
- Kim, J.E.; Choi, S.I.; Lee, H.R.; Hwang, I.S.; Lee, Y.J.; An, B.S.; Lee, S.H.; Kim, H.J.; Kang, B.C.; Hwang, D.Y. Selenium significantly inhibits adipocyte hypertrophy and abdominal fat accumulation in OLETF rats via induction of fatty acid beta-oxidation. Biol. Trace Elem. Res. 2012, 150, 360–370. [Google Scholar] [CrossRef]
- Wang, Y.; Gao, X.; Pedram, P.; Shahidi, M.; Du, J.; Yi, Y.; Gulliver, W.; Zhang, H.; Sun, G. Significant beneficial association of high dietary selenium intake with reduced body fat in the coding study. Nutrients 2016, 8, 24. [Google Scholar] [CrossRef]
- Cavedon, E.; Manso, J.; Negro, I.; Censi, S.; Serra, R.; Busetto, L.; Vettor, R.; Plebani, M.; Pezzani, R.; Nacamulli, D.; et al. Selenium supplementation, body mass composition, and leptin levels in patients with obesity on a balanced mildly hypocaloric diet: A pilot study. Int. J. Endocrinol. 2020, 2020, 4802739. [Google Scholar] [CrossRef]
- Pei, L.; Wu, J.; Wang, Z.; Wang, X.; Chen, Z.; Li, J.; Zhang, L.; Fan, R.; Zhang, Z.; Dong, Y.; et al. Geographic variations and potential macro-environmental exposure of hypertension: From the China hypertension survey. J. Hypertens. 2020, 38, 829–838. [Google Scholar] [CrossRef]
- Zhang, J.G.; Wang, Z.H.; Wang, H.J.; Du, W.W.; Su, C.; Zhang, J.; Jiang, H.R.; Zhai, F.Y.; Zhang, B. Dietary patterns and their associations with general obesity and abdominal obesity among young Chinese women. Eur. J. Clin. Nutr. 2015, 69, 1009–1014. [Google Scholar] [CrossRef]
- Kaushal, N.; Kudva, A.K.; Patterson, A.D.; Chiaro, C.; Kennett, M.J.; Desai, D.; Amin, S.; Carlson, B.A.; Cantorna, M.T.; Prabhu, K.S. Crucial role of macrophage selenoproteins in experimental colitis. J. Immunol. 2014, 193, 3683–3692. [Google Scholar] [CrossRef] [Green Version]
- Fairweather-Tait, S.J.; Bao, Y.; Broadley, M.R.; Collings, R.; Ford, D.; Hesketh, J.E.; Hurst, R. Selenium in human health and disease. Antioxid. Redox Signal. 2011, 14, 1337–1383. [Google Scholar] [CrossRef]
- Rodriguez-Iturbe, B.; Pons, H.; Johnson, R.J. Role of the immune system in hypertension. Physiol. Rev. 2017, 97, 1127–1164. [Google Scholar] [CrossRef]
- Bastola, M.M.; Locatis, C.; Maisiak, R.; Fontelo, P. Selenium, copper, zinc and hypertension: An analysis of the National Health and Nutrition Examination Survey (2011–2016). BMC Cardiovasc. Disord. 2020, 20, 45. [Google Scholar] [CrossRef] [Green Version]
- Laclaustra, M.; Navas-Acien, A.; Stranges, S.; Ordovas, J.M.; Guallar, E. Serum selenium concentrations and hypertension in the US Population. Circ. Cardiovasc. Qual. Outcomes 2009, 2, 369–376. [Google Scholar] [CrossRef] [Green Version]


| Factor | Q1 | Q2 | Q3 | Q4 | p-Value |
|---|---|---|---|---|---|
| N | 3453 | 3385 | 3423 | 3407 | |
| Se intake (µg/day), mean (SD) | 21.0 (5.1) | 33.2 (2.8) | 43.8 (3.6) | 68.3 (25.2) | <0.001 |
| Energy intake (kcal/day), mean (SD) | 2054.1 (588.7) | 2329.0 (557.9) | 2572.3 (611.3) | 2902.0 (759.2) | <0.001 |
| Fat intake (g/day), mean (SD) | 49.7 (29.2) | 60.8 (32.8) | 68.7 (35.4) | 85.2 (42.5) | <0.001 |
| Protein intake (g/day), mean (SD) | 54.6 (15.5) | 66.9 (15.0) | 77.8 (17.4) | 94.8 (24.9) | <0.001 |
| Carbohydrate intake (g/day), mean (SD) | 344.3 (120.2) | 375.1 (118.6) | 405.4 (137.1) | 431.3 (164.2) | <0.001 |
| Sodium intake (g/day), mean (SD) | 5.7 (6.5) | 5.9 (4.9) | 6.4 (4.7) | 7.3 (5.6) | <0.001 |
| Traditional dietary pattern, mean (SD) | 0.0 (0.8) | −0.1 (1.0) | −0.1 (1.1) | 0.0 (1.4) | <0.001 |
| Modern dietary pattern, mean (SD) | −0.6 (0.5) | −0.4 (0.7) | −0.2 (0.8) | 0.3 (1.1) | <0.001 |
| Age (years), mean (SD) | 40.7 (15.6) | 39.7 (14.6) | 38.5 (13.5) | 37.8 (13.1) | <0.001 |
| BMI (kg/m2), mean (SD) | 21.5 (2.8) | 21.8 (2.8) | 22.2 (2.9) | 22.4 (3.0) | <0.001 |
| BMI ≥24 (kg/m2) | 17.6% | 19.4% | 24.2% | 26.0% | <0.001 |
| Sex | <0.001 | ||||
| Males | 38.1% | 44.3% | 51.3% | 61.5% | |
| Females | 61.9% | 55.7% | 48.7% | 38.5% | |
| Income | <0.001 | ||||
| Low | 39.5% | 32.0% | 26.0% | 21.7% | |
| Medium | 33.3% | 33.9% | 33.4% | 30.1% | |
| High | 27.1% | 34.1% | 40.6% | 48.1% | |
| Education | <0.001 | ||||
| Low | 55.0% | 47.7% | 41.1% | 35.0% | |
| Medium | 30.5% | 32.4% | 33.5% | 36.3% | |
| High | 14.5% | 19.9% | 25.3% | 28.7% | |
| Diabetes | 4.7% | 6.4% | 7.2% | 8.6% | 0.55 |
| Urbanization | <0.001 | ||||
| Low | 49.4% | 42.3% | 38.7% | 32.4% | |
| Medium | 29.5% | 29.8% | 29.1% | 30.3% | |
| High | 21.1% | 27.9% | 32.2% | 37.3% | |
| Smoking | <0.001 | ||||
| Non smoker | 72.0% | 68.8% | 65.2% | 59.0% | |
| Ex-smokers | 1.8% | 1.5% | 1.6% | 1.8% | |
| Current smokers | 26.2% | 29.7% | 33.2% | 39.2% | |
| Physical activity (MET-hrs/week), mean (SD) | 208.8 (175.2) | 211.0 (182.9) | 206.4 (180.3) | 191.7 (156.0) | <0.001 |
| Se Intake (g/Day) | |||||
|---|---|---|---|---|---|
| Q1 | Q2 | Q3 | Q4 | p for Trend | |
| A. Cumulative average Se intake | |||||
| Cases | 1028 | 1002 | 1005 | 1004 | |
| Person-years | 34,193 | 32,834 | 32,891 | 32,169 | |
| Incident rate (per 1000) | 30.1 | 30.5 | 30.6 | 31.2 | |
| Model 1 | 1.00 | 0.98 (0.90–1.07) | 1.03 (0.94–1.12) | 1.19 (1.09–1.31) | <0.001 |
| Model 2 | 1.00 | 0.92 (0.83–1.02) | 0.93 (0.83–1.03) | 1.01 (0.90–1.13) | 0.861 |
| Model 3 | 1.00 | 0.91 (0.82–1.01) | 0.90 (0.80–1.00) | 0.96 (0.85–1.08) | 0.445 |
| B. Baseline Se intake | |||||
| Cases | 1056 | 962 | 1039 | 982 | |
| Person-years | 34,317 | 33,326 | 33,265 | 31,179 | |
| Incident rate (per 1000) | 30.8 | 28.9 | 31.2 | 31.5 | |
| Model 1 | 1.00 | 0.97 (0.89–1.05) | 1.10 (1.01–1.20) | 1.15 (1.05–1.25) | <0.001 |
| Model 2 | 1.00 | 0.93 (0.84–1.03) | 1.00 (0.90–1.10) | 1.00 (0.90–1.11) | 0.672 |
| Model 3 | 1.00 | 0.92 (0.83–1.01) | 0.97 (0.88–1.07) | 0.97 (0.87–1.07) | 0.762 |
| C. Most recent Se intake | |||||
| Cases | 1050 | 942 | 1023 | 1024 | |
| Person-years | 33,568 | 33,011 | 33,348 | 32,160 | |
| Incident rate (per 1000) | 31.3 | 28.5 | 30.7 | 31.8 | |
| Model 1 | 1.00 | 1.02 (0.93–1.12) | 1.17 (1.07–1.28) | 1.27 (1.15–1.40) | <0.001 |
| Model 2 | 1.00 | 0.93 (0.84–1.03) | 1.03 (0.93–1.15) | 1.11 (0.99–1.24) | 0.030 |
| Model 3 | 1.00 | 0.92 (0.83–1.02) | 1.01 (0.91–1.13) | 1.08 (0.95–1.22) | 0.121 |
| Q1 | Q2 | Q3 | Q4 | p for Interaction | |
|---|---|---|---|---|---|
| BMI status | |||||
| Normal | 1.00 | 0.92 (0.81–1.04) | 0.88 (0.77–1.02) | 1.03 (0.88–1.21) | 0.496 |
| Overweight/obese | 1.00 | 0.88 (0.74–1.05) | 0.92 (0.78–1.10) | 0.89 (0.74–1.07) | |
| Region | |||||
| North | 1.00 | 0.94 (0.80–1.11) | 0.82 (0.69–0.97) | 0.84 (0.70–1.00) | 0.001 |
| South | 1.00 | 0.89 (0.77–1.03) | 0.96 (0.82–1.13) | 1.11 (0.93–1.33) | |
| Income | |||||
| Low | 1.00 | 0.84 (0.71–1.00) | 0.91 (0.75–1.10) | 0.87 (0.69–1.09) | 0.541 |
| Medium | 1.00 | 0.97 (0.81–1.15) | 0.89 (0.73–1.07) | 0.96 (0.78–1.18) | |
| High | 1.00 | 0.94 (0.78–1.13) | 0.94 (0.78–1.13) | 1.03 (0.85–1.26) | |
| Sex | |||||
| Males | 1.00 | 0.84 (0.71–0.99) | 0.85 (0.72–1.00) | 0.91 (0.77–1.08) | 0.677 |
| Females | 1.00 | 0.97 (0.85–1.11) | 0.94 (0.81–1.09) | 0.99 (0.84–1.18) | |
| Urbanization level | |||||
| Low | 1.00 | 0.83 (0.70–0.99) | 0.95 (0.80–1.14) | 0.94 (0.76–1.16) | 0.241 |
| Medium | 1.00 | 0.88 (0.74–1.04) | 0.81 (0.68–0.98) | 0.98 (0.80–1.19) | |
| High | 1.00 | 1.08 (0.88–1.32) | 0.98 (0.80–1.21) | 1.02 (0.82–1.27) |
Publisher’s Note: MDPI stays neutral with regard to jurisdictional claims in published maps and institutional affiliations. |
© 2021 by the authors. Licensee MDPI, Basel, Switzerland. This article is an open access article distributed under the terms and conditions of the Creative Commons Attribution (CC BY) license (https://creativecommons.org/licenses/by/4.0/).
Share and Cite
Xie, C.; Xian, J.; Zeng, M.; Cai, Z.; Li, S.; Zhao, Y.; Shi, Z. Regional Difference in the Association between the Trajectory of Selenium Intake and Hypertension: A 20-Year Cohort Study. Nutrients 2021, 13, 1501. https://doi.org/10.3390/nu13051501
Xie C, Xian J, Zeng M, Cai Z, Li S, Zhao Y, Shi Z. Regional Difference in the Association between the Trajectory of Selenium Intake and Hypertension: A 20-Year Cohort Study. Nutrients. 2021; 13(5):1501. https://doi.org/10.3390/nu13051501
Chicago/Turabian StyleXie, Changxiao, Jinli Xian, Mao Zeng, Zhengjie Cai, Shengping Li, Yong Zhao, and Zumin Shi. 2021. "Regional Difference in the Association between the Trajectory of Selenium Intake and Hypertension: A 20-Year Cohort Study" Nutrients 13, no. 5: 1501. https://doi.org/10.3390/nu13051501