Article

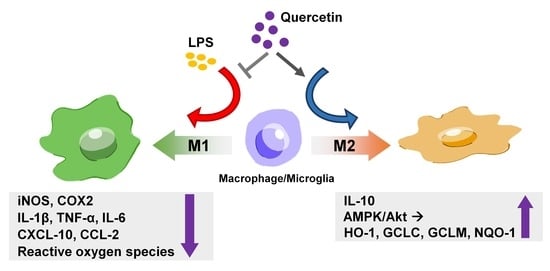
Regulatory Effects of Quercetin on M1/M2 Macrophage Polarization and Oxidative/Antioxidative Balance

1
Department of Medical Laboratory Science and Biotechnology, Asia University, Taichung 413305, Taiwan
2
Institute of New Drug Development, China Medical University, Taichung 404328, Taiwan
3
Graduate Institute of Biomedical Sciences, China Medical University, Taichung 404328, Taiwan
4
Department of Pharmacology, School of Medicine, College of Medicine, China Medical University, Taichung 404328, Taiwan
5
Department of Photonics and Communication Engineering, Asia University, Taichung 413305, Taiwan
6
Department of Physiology, School of Medicine, China Medical University, Taichung 404328, Taiwan
7
Laboratory for Neural Repair, China Medical University Hospital, Taichung 404327, Taiwan
8
Biomedical Technology R&D Center, China Medical University Hospital, Taichung 404327, Taiwan
9
Department of General Surgery, Taichung Tzu Chi Hospital, Buddhist Tzu Chi Medical Foundation, Taichung 427213, Taiwan
10
Department of Biochemistry, School of Medicine, China Medical University, Taichung 404328, Taiwan
11
Department of Biological Science and Technology, China Medical University, Taichung 404328, Taiwan
*
Authors to whom correspondence should be addressed.
Nutrients 2022, 14(1), 67; https://doi.org/10.3390/nu14010067
Submission received: 12 November 2021 / Revised: 16 December 2021 / Accepted: 21 December 2021 / Published: 24 December 2021
(This article belongs to the Special Issue The Impact of Nutrition on Brain Metabolism and Disease)

Abstract

:
Macrophage polarization plays essential and diverse roles in most diseases, such as atherosclerosis, adipose tissue inflammation, and insulin resistance. Homeostasis dysfunction in M1/M2 macrophage polarization causes pathological conditions and inflammation. Neuroinflammation is characterized by microglial activation and the concomitant production of pro-inflammatory cytokines, leading to numerous neurodegenerative diseases and psychiatric disorders. Decreased neuroinflammation can be obtained by using natural compounds, including flavonoids, which are known to ameliorate inflammatory responses. Among flavonoids, quercetin possesses multiple pharmacological applications and regulates several biological activities. In the present study, we found that quercetin effectively inhibited the expression of lipocalin-2 in both macrophages and microglial cells stimulated by lipopolysaccharides (LPS). The production of nitric oxide (NO) and expression levels of the pro-inflammatory cytokines, inducible nitric oxide synthase (iNOS) and cyclooxygenase (COX)-2, were also attenuated by quercetin treatment. Our results also showed that quercetin significantly reduced the expression levels of the M1 markers, such as interleukin (IL)-6, tumor necrosis factor (TNF)-α, and IL-1β, in the macrophages and microglia. The M1 polarization-associated chemokines, C–C motif chemokine ligand (CCL)-2 and C-X-C motif chemokine ligand (CXCL)-10, were also effectively reduced by the quercetin treatment. In addition, quercetin markedly reduced the production of various reactive oxygen species (ROS) in the microglia. The microglial phagocytic ability induced by the LPS was also effectively reduced by the quercetin treatment. Importantly, the quercetin increased the expression levels of the M2 marker, IL-10, and the endogenous antioxidants, heme oxygenase (HO)-1, glutamate-cysteine ligase catalytic subunit (GCLC), glutamate-cysteine ligase modifier subunit (GCLM), and NAD(P)H quinone oxidoreductase-1 (NQO1). The enhancement of the M2 markers and endogenous antioxidants by quercetin was activated by the AMP-activated protein kinase (AMPK) and Akt signaling pathways. Together, our study reported that the quercetin inhibited the effects of M1 polarization, including neuroinflammatory responses, ROS production, and phagocytosis. Moreover, the quercetin enhanced the M2 macrophage polarization and endogenous antioxidant expression in both macrophages and microglia. Our findings provide valuable information that quercetin may act as a potential drug for the treatment of diseases related to inflammatory disorders in the central nervous system.

Graphical Abstract

1. Introduction

Macrophages have been categorized into at least two main polarization phenotypes: M1-polarized macrophages and M2-activated macrophages [1]. In addition, M1-type activation leads to the production of pro-inflammatory cytokines and reactive oxygen species (ROS), and M1-activated macrophages are correlated with the upregulation of ROS, which triggers macrophage activation and proinflammatory cytokine expression [2]. Conversely, the activation of M2-polarized macrophages produces neurotrophic factors [3] and secretes anti-inflammatory cytokines, such as interleukin (IL)-10, which leads to anti-inflammatory effects [4,5]. M2-macrophage polarization plays a central role in infection by limiting the immune response to pathogens, thereby preventing damage to the host [6]. In addition, chemokines, C–C motif chemokine ligand (CCL)-2 [7] and C-X-C motif chemokine ligand (CXCL)-10 [8], have been reported to be associated with Th1 immune responses. A recent report also found that the induction of CCL2 and CXCL10 secretions in macrophages exaggerated the host-derived immune responses [9]. Moreover, the heterogeneity of macrophage polarization plays a critical role in several diseases, such as atherosclerosis [10], pulmonary infection [11], and obesity-associated metabolic diseases [12]. Proinflammatory M1 macrophages also elevated the secretion of chemokines, which are thought to recruit leukocytes to areas of inflammation [13].
In the central nervous system (CNS), the microglia are the resident macrophages that are pivotal for maintaining immune defense [14]. Uncontrolled microglial activation boosts neuroinflammatory reactions and triggers neuronal death, which are pathological features of various neurodegenerative diseases [5,15] and cognitive dysfunction [4,16]. Under the influence of either a proinflammatory or anti-inflammatory microenvironment, the activated microglia polarize into two major types, M1-inflammatory or M2-anti-inflammatory phenotype [17]. Microglial polarization to the M1 state produces proinflammatory mediators, thus contributing to tissue inflammation, which may lead to neurodegenerative [18] and psychiatric disorders [4,5]. Activated microglial cells strongly elicit the phagocytosis of debris, preventing secondary inflammatory responses and promoting tissue regeneration [19]. Our previous study showed that elevated M2 macrophage genes expressions by natural products [20] or chemical compounds [21] effectively reduced the neuroinflammatory response. Therefore, developing compounds to regulate the shift in M1/M2 polarization has been suggested as a beneficial therapeutic strategy for neurological diseases [22,23].
Increasing evidence has shown that lipocalin-2 (also known as neutrophil gelatinase-associated lipocalin; NGAL) regulates various pathophysiological conditions. Previously, we analyzed the cytokine array and found that lipocalin-2 was upregulated in zymosan (derived from yeast cell wall)-stimulated alveolar macrophages [24]. Moreover, the macrophages from lipocalin-2 knockout mice display less pro-inflammatory and increased anti-inflammatory protein expression [25]. Urinary lipocalin-2 has been suggested as a risk factor for chronic kidney disease progression [26]. Remarkably, lipocalin-2 neutralization enhanced the expression of M2-related genes in a mouse cardiac ischemia-reperfusion injury model [27]. Importantly, lipocalin-2 has also been recognized as an amplifier of M1-polarization in microglial cells [28]. Furthermore, neuroinflammation-associated impairment of motor function and cognitive behavior was also diminished in the lipocalin-2-deficient mice [28]. Lipocalin 2 in the CNS is primarily released under inflammatory conditions and enhances morphological transformation and cell migration [29]. Importantly, the lipocalin-2-deficient mice showed suppressed M1 activated macrophages and enhanced the M2 response [28]. Our recent findings also showed that increased levels of lipocalin-2 in the CNS may contribute to astrogliosis and cognitive and behavioral changes [30], and exogenous lipocalin-2 in the brain impaired cognitive function and evoked anxiety-like behaviors in the animal models [30].
Quercetin, a natural polyphenol, is the most abundant flavonoid found in vegetables and fruits [31]. Quercetin has been reported to possess several biological properties, including antioxidative and anti-inflammatory effects [32]. Due to the antioxidative and anti-inflammatory properties of quercetin, the consumption of quercetin has been recently reported to exert potential human health benefits [33]. Notably, quercetin has been suggested to improve insulin resistance by inhibiting the synthesis and secretion of proinflammatory mediators [33]. Exogenous quercetin contributes to many physiological functions that may prevent and treat inflammatory, metabolic, and ischemic diseases [34]. Importantly, quercetin exerts neuroprotective effects in neurodegenerative diseases [35,36]. Recent reports have suggested that quercetin is a potential dietary supplement for modulating neuroinflammation and preventing various neurological disorders [33]. Using quercetin as a dietary supplement in humans was well tolerated and safe, and adverse effects have rarely been reported [34]. In addition, quercetin protects against obesity-induced hypothalamic inflammation by ameliorating microglia-regulated inflammatory responses via endogenous antioxidant enzyme induction [37]. Diet components and natural herbs express endogenous oxidative or cytoprotective enzymes that exert anti-oxidative stress, protect cells, and prevent inflammatory responses [38,39,40,41]. Moreover, both another group [42] and our previous findings [20,43,44,45] suggested that the up-regulation of endogenous antioxidative and anti-inflammatory enzymes may be a potential therapeutic strategy for neuroinflammation and neurodegenerative diseases.
The present study aimed to investigate the underlying mechanism of quercetin treatment for maintaining homeostasis in inflammatory/anti-inflammatory and oxidative/antioxidative effects. These results provide a better understanding of the role of quercetin in lipocalin-2 expression and M1/M2 polarization in macrophages and microglia. Our findings may help to develop therapeutic strategies for the treatment of neuroinflammation neurodegeneration and other inflammatory-associated diseases.

2. Materials and Methods

2.1. Materials

Primary antibodies against β-actin and phosphor-AktSer743 were purchased from Santa Cruz Biotechnology (Santa Cruz, CA, USA). Antibody against phospho-AMPKThr172 was obtained from Cell Signaling Technology. Primary antibody against iNOS (610431) was purchased from BD Transduction Laboratories (Lexington, KY, USA). Primary antibody against COX-2 (aa 570–598) was obtained from Cayman Chemicals (Ann Arbor, MI, USA). Antibody against HO-1 was purchased from Enzo Life Sciences Inc. (Farmingdale, NY, USA). Antibodies against glyceraldehyde-3-phosphate dehydrogenase (GAPDH), GCLC, GCLM, and NQO1 were purchased from Abcam (Cambridge, MA, USA).

2.2. Cell Culture

RAW264.7 cells were maintained in Dulbecco’s Modified Eagle’s Medium (DMEM) with high glucose (4.5 g/L), 10% fetal bovine serum (FBS), and penicillin/streptomycin (100 U/mL) in a humidified incubator with 5% CO2 and 95% air at 37 °C. The adult mouse microglia cell line (IMG) derived from the adult brain was obtained from the Harvard School of Public Health (Boston, MA, USA). IMG cells expressing a microglial-specific marker fully recapitulates the morphological and functional features of brain microglia. Cells were cultured in DMEM with low glucose (1 g/L), 10% FBS, and penicillin/streptomycin (100 U/mL). The dosage of quercetin chosen for our study were referred to previous studies [46,47,48]. Evidence showed that low-dose quercetin is effective in exerting anti-tumor, anti-fibrotic, and delipidating effects. Therefore, we have set the quercetin treatment from 1 to 10 M. The viability of cells have been checked after indicated treatment (Figure S1.)

2.3. Western Blotting Analysis

Cells were lysed with RIPA buffer containing protease inhibitor cocktail for 30 min on ice. After centrifugation and colleting the supernatants, these protein samples were separated by SDS-PAGE and blots were transferred onto polyvinylidene fluoride membranes. After blocking with nonfat milk, the membranes were probed with primary antibodies overnight. After several washes with phosphate-buffered saline (PBS), the membranes were hybridized with secondary antibodies. The target proteins were visualized by enhanced chemiluminescence using Kodak X-OMAT LS film (Eastman Kodak, Rochester, NY, USA). Quantitative data were aquired by computing the densitometric values using ImageJ software (ImageJ).

2.4. NO Assay

As described in previous publication [49], NO production was measured by examing the presence of nitrite in the culture medium.

2.5. Quantitative Real-Time Polymerase Chain Reaction (PCR)

Total RNA was extracted from cultured cells using TRIzol reagent (Invitrogen, Carlsbad, CA, USA). Target mRNA levels were detected using quantitative real-time PCR by StepOne Real-Time PCR systems (Applied Biosystems, Foster City, CA, USA). 2 μg of total RNA was used for reverse transcription (RT) reaction and convertion to cDNA using the Invitrogen RT Kit. By amplifying DNA using oligonucleotide primers, quantitative real-time PCR was performed by using SYBR Green Master Mixes (Applied Biosystems™, Waltham, Massachusetts, USA). The threshold was set within the linear phase of target gene amplification to calculate the cycle number at which the transcript was detected (denoted as CT).

2.6. Phagocytosis Assay

The protocol for microglial phagocytosis was performed according to our previous study [21]. IMG cells were seeded into 3.5 cm culture dishes (5 × 10⁵ cells/well) and grown for 16 h at 37 °C and 5% CO2. After treatment with quercetin or LPS was administered for another 24 h, and the media were replaced by 1 mL of carboxylate-modified polystyrene fluorescent yellow-green latex beads (YG beads; Cat#L4655; Sigma Aldrich, Louis, MO, USA)-containing media and incubated at 37 °C for another 1 h. After several washes for removing the non-internalized beads, cells were incubated with ethylenediaminetetraacetic acid (EDTA; 2 mM in PBS) for 10 min at 4 °C. Afterwards, the cells were trypsinized, and the phagocytotic activity was quantified by flow cytometry(ACEA Biosciences, Sandiego, CA, USA).

2.7. Statistical Analysis

Statistical analysis was performed by using GraphPad Prism 6.0 (Graph Pad Software Inc, San Diego, CA, USA). Values are presented as mean ± standard error of the mean. Student’s t-test was used for assessing significance of the differences between experimental and control groups. Statistical comparisons of more than two groups were carried out using one-way analysis of variance with the Bonferroni post-hoc test. Significant differences were defined if the p value was <0.05.

3. Results

3.1. Quercetin Suppresses the Expression Levels of Lipocalin-2, Proinflammatory Cytokines, and M1-polarization Marker in Macrophages and Microglial Cells

The mouse macrophage (RAW26.7) and adult mouse microglial (IMG) cells were used to study the anti-neuroinflammatory mechanisms of quercetin. As shown in Figure 1, stimulation with lipopolysaccharides (LPS) significantly increased the lipocalin-2 expression in both the macrophages (Figure 1A) and microglial cells (Figure 1B). In addition, the treatment with quercetin abrogated LPS-induced lipocalin-2 expression in a concentration-dependent manner (Figure 1A,B). Moreover, the treatment with quercetin also inhibited inducible nitric oxide synthase (iNOS) (Figure 2A,C) and the cyclooxygenase (COX)-2 (Figure 2A,D) protein expression levels induced by LPS in macrophages in a concentration-dependent manner. The quercetin treatment significantly reduced the LPS-induced nitric oxide (NO) production (Figure 2B). In adult mouse microglial cells, the treatment with quercetin significantly inhibited the expression of iNOS (Figure 3A,C) and COX-2 (Figure 3A,D). The enhancement of NO production was also reduced by the quercetin treatment in the microglial cells (Figure 3B). Moreover, the mRNA expression of iNOS and COX-2 induced by LPS was reduced in a concentration-dependent manner by the quercetin treatment (Figure 3E,F). We further determined the effects of quercetin on the M1 polarization in the macrophages and microglial cells. Administration of quercetin significantly attenuated the M1 polarization markers, including IL-1β (Figure 4A), tumor necrosis factor (TNF)-α (Figure 4C), and IL-6 (Figure 4E), in the macrophages. In addition, our results also show that quercetin effectively antagonizes LPS-induced IL-1β (Figure 4B), tumor necrosis factor (TNF)-α (Figure 4D), and IL-6 (Figure 4F) in microglial cells. Furthermore, the enhancement of CXCL10 (Figure 5A) and CCL2 (Figure 5B) expression in the mouse macrophages was effectively reduced by the treatment with quercetin. In addition, the treatment with quercetin enhanced CXCL10 (Figure 5C), and CCL2 (Figure 5D) were also reduced in the adult mouse brain microglia. These results indicated that LPS-primed M1 phenothypes were antagonized by quercetin.

3.2. Quercetin Treatment Decreases the Production of Various ROS in Microglial Cells

To determine the effect of quercetin on the ROS production, cells were treated with hydrogen peroxide (H2O2); 2, 2′-azobis (2-amidinopropane) hydrochloride (AAPH); and iron plus H2O2, and the ROS production was determined. The ROS production was enhanced by approximately four- to six-fold (Figure 6A–C). Moreover, the administration of quercetin effectively antagonized the H2O2 production in a concentration-dependent manner (Figure 6A). The AAPH-stimulated ROOs. production was also markedly inhibited by the quercetin treatment (Figure 6B). In addition, quercetin significantly reduced the iron + H2O2–increased HO. production (Figure 6C). Our results showed that quercetin treatment downregulated the ROS production, such as H2O2, ROO, and HO, in a concentration-dependent manner.

3.3. Quercetin Reduces the Phagocytic Activity in Microglial Cells

Next, we determined whether the quercetin treatment affected microglial phagocytosis. As shown in Figure 7A,E, the treatment with LPS significantly reduced un-phagocytic populations and enhanced the phagocytic ability of the engulfed ≥2 YG beads in microglia. In addition, the quercetin treatment alone did not affect microglial phagocytosis in either the one or >2 beads (Figure 7A,E). Furthermore, the treatment with quercetin 1 μM slightly regulated LPS-induced microglial phagocytosis (Figure 7B). Moreover, the treatment with quercetin at concentrations of 5 and 10 μM dramatically attenuated LPS-induced microglial phagocytosis by >2 beads (Figure 7C,D). These results indicated that quercetin effectively reduced microglial phagocytosis, and the treatment with quercetin alone did not affect the phagocytic ability.

3.4. Quercetin Upregulates M2 Polarization and Endogenous Antioxidant Expression via the AMP-Activated Protein Kinase (AMPK) and Akt Signaling Pathways

We have previously demonstrated that the induction of M2 polarization [21] and endogenous antioxidants [43,45] plays important roles in maintaining inflammatory/anti-inflammatory and oxidative/antioxidative homeostasis. Next, we determined the effects of quercetin on the M2 polarization in macrophages and microglial cells. In particular, the stimulation of the quercetin concentration-dependently upregulated the expression of the M2-polarized marker IL-10 in both the macrophages (Figure 8A) and microglial cells (Figure 8B). In addition, the M2 phenotype cell surface marker CD206 was also upregulated by quercetin measured by flow cytometry (Supplementary Figure S2). As shown in Figure 9, the treatment with quercetin increased the mRNA expression of endogenous antioxidants, including heme oxygenase (HO)-1, glutamate-cysteine ligase catalytic subunit (GCLC), glutamate-cysteine ligase modifier subunit (GCLM), and NAD(P)H quinone oxidoreductase-1 (NQO1), in the microglial cells. In addition, quercetin also upregulated the protein levels of these endogenous antioxidants in the microglial cells in a concentration-dependent manner (Figure 10). It has been reported that quercetin activates AMPK, which triggers anti-inflammatory responses for obesity treatment [50]. Moreover, quercetin has also been found to modulate inflammatory processes through a variety of signaling pathways, including the phosphatidylinositol-3-phosphate kinase (PI3K)/Akt signaling pathway [33]. As shown in Figure 11, the stimulation with quercetin increased the AMPK (Figure 11A) and Akt (Figure 11B) activation. Moreover, treatment with an AMPK inhibitor (compound C) and an Akt inhibitor effectively antagonized the quercetin-associated IL-10 expression (Figure 11C). In addition, the enhancement of HO-1 (Figure 11D), GCLC (Figure 11E), GCLM (Figure 11F), and NQO1 (Figure 11G) were reduced by both compound C and the Akt inhibitor. Our findings indicate that quercetin upregulates the M2 polarization and endogenous antioxidant expression through the AMPK and Akt signaling pathways.

4. Discussion

Recent studies have suggested that the different polarization of macrophage phenotypes contributes to metabolic homeostasis in several diseases, including obesity, atherosclerosis, insulin resistance, and cancer. M1 macrophages have been recognized to contribute to insulin resistance, whereas M2 macrophages protect against insulin resistance [51]. Adipose tissue macrophages stimulated by free fatty acids, produce CCL2 that promote the recruitment of proinflammatory monocytes to the inflamed tissue [52], but L-10 may protect adipocytes from obesity, causing insulin resistance [53]. In the CNS, M2 microglia activation has been reported to suppress the inflammatory molecules that improve hippocampal spatial learning in a mouse model [54]. In addition, it has been reported that the increased production of IL-10 exerts anti-inflammatory and analgesic effects [55]. Furthermore, IL-10 inhibits IL-6 production by preventing nuclear translocation of nuclear factor (NF)-κB in the microglia [56]. Numerous studies have also reported that quercetin has therapeutic potential for brain disorders. Treatment with quercetin has been found to have anticonvulsant activity, which correlates with its brain concentration [57]. In addition, quercetin has also been reported to contribute to antidepressive effects through the inhibition of antioxidant effects [58]. Moreover, treatment with quercetin has also been reported to attenuate hypothalamic–pituitary–adrenal (HPA) axis dysregulation in a mild traumatic brain injury mouse model [58]. Importantly, oral administration of quercetin reduced insoluble Aβ levels in the cortex of amyloid transgenic mouse models [59]. Importantly, quercetin treatment improves functional recovery after spinal cord injury by inhibiting macrophages/microglia polarization to M1, thereby protecting the cell survival of oligodendrocytes [60]. The present study showed that treatment with quercetin effectively reduced the proinflammatory and oxidative effects in the macrophages and microglial cells.
Although ROS in macrophages are essential for the uptake and clearance of dying cells, the intracellular ROS production in macrophages is thought to be involved in the phagocytic process [61]. High levels of ROS may cause macrophage apoptosis that is harmful to macrophages [62], which has been observed to increase the expression of endogenous antioxidants for adaptive survival [63]. Induction of ROS in murine macrophage RAW264.7 cell and primary peritoneal macrophages increased the phagocytic activity [64]. Interestingly, H2O2 has been observed to serve as a chemoattractant to facilitate macrophage recruitment to monocytes [65]. Moreover, ROS triggered CCL2-induced hyperalgesia, which was attenuated in the presence of SOD in a rodent model [66]. Furthermore, the mitochondria-derived ROS have also been found to be activated by IL-1β secretion [67]; the treatment with quercetin decreases the ROS production induced by IL-1β [68]. Interestingly, quercetin has also been found to suppress ROS via microbiota exerting a neuroprotective effect [69]. Importantly, oxidized LDL has been recognized to stimulate the M1 macrophage activation and further support monocyte recruitment, which may lead to atherosclerosis [70]. It is widely believed that cytoprotective protein expression exerts antioxidant effects and participates in cell protection [71]. Many endogenous antioxidants are involved in maintaining redox homeostasis and against CNS diseases, including HO-1, GCLC, GCLM, and NQO-1 [72]. Our results showed that the administration of quercetin reduced the ROS production and increased the expression of various endogenous antioxidants.
In the CNS system, the inhibition of ROS production, M1-like pro-inflammatory phenotype, and elevation of the M2-like macrophage activation IL-10 improved spinal cord injury [73]. Using immunomodulation targets, IL-10 production has been considered as a therapeutic potentiation in several neurodegenerative diseases, including Alzheimer’s disease, Parkinson’s disease, and multiple sclerosis [74]. Exogenous interleukin-10 administration decreases inflammatory extent and improves motor function after a spinal cord injury [75]. M2 microglia protect the neighboring cells by secreting trophic factors such as IL-10 for repairing brain [76]. Furthermore, the findings of HO-1 downstream of IL-10 reveals new possibilities for better therapeutic approaches for treating inflammatory diseases [77]. The protective effect of IL-10- against LPS-induced septic shock in mice was markedly attenuated by cotreating with the HO inhibitor [77]. Induction of HO-1 by natural or synthetic antioxidants drives M1 to M2 switching and improves kidney function in diabetes [78]. The anti-inflammatory effect of the antidepressant amitriptyline on morphine tolerance is regulated by HO-1 signal transduction, possibly by increasing IL-10 production [79]. In our previous report, the activation of the endogenous antioxidant enzyme HO-1 exhibits anti-neuroinflammatory effects on the microglial cells [20,43,44,45] and neuroprotection against neurotoxin-induced cell death [80]. In addition, our previous report [20,81] also demonstrated that the elevation of HO-1 expression polarizes the macrophage/microglia toward the M2 phenotype. Moreover, quercetin reduces microglia-mediated inflammatory responses in obesity through HO-1 induction [37] and protects glial cells by reducing the ROS production and inducing HO-1 expression [82]. Our results showed that treatment with quercetin markedly reduced proinflammatory cytokine expression and increased the expression of the M2 marker IL-10 in both macrophages and the microglial cells.
In the CNS system, lipocalin-2 knockout mice with cerebral ischemia have been found to have smaller infarct volumes and better neurological functions, but the unexpected activation of astrocytes was not observed [83]. Recently, lipocalin-2 has been demonstrated to play a crucial role in pathological conditions, especially in pathological progression associated with cognition [84,85]. Elevated ItI It has been reported that lipocalin-2 is upregulated in a mouse’s hippocampus under psychological stress and modulates stress-induced neuronal excitability and anxious behavior [86], which has also been considered as a potential biomarker in Alzheimer’s disease and other aging-related cognitive decline [87]. Lipocalin 2-null mice demonstrate not only anxious and depressive-like behaviors, but also cognitive and memory impairments [88]. Clinically, lipocalin-2 in cerebrospinal fluid is a convincing biomarker for the differential diagnosis between vascular dementia and neurodegenerative dementias [89]. Furthermore, single prolonged stress-enhanced activation on astrocyte in rat can last for days, augmenting the vulnerability of abnormal fear learning [90]. A recent study reported that Parkinson’s disease patients are more responsive to lipocalin-2 stimulation for reactive astrocytosis [91]. We recently reported that increased lipocalin-2 in the CNS contributes to astrogliosis as well as cognitive and behavioral dysfunction [30], and increased lipocalin-2 in the brain impaired cognitive function and evoked anxiety-like behaviors in animal models [30]. To the best of our knowledge, the present study is the first to report that treatment with quercetin significantly reduced the lipocalin-2 expression in both macrophages and microglial cells.
Phagocytosis in the central nervous system is normally exerted by the phagocytic cells, especially microglia and macrophages [92].The phagocytic removal of debris by microglia has been proposed to be of biological significance and is associated with the progression of neurological diseases, such as Alzheimer’s disease (AD) [93,94], Huntington’s disease (HD) [95] and Parkinson’s disease (PD) [96], as well as trauma and stroke [3]. Although it remains to be elucidated whether this phagocytic behavior is beneficial or detrimental during various stages of brain diseases or injury, many studies have demonstrated that the efficient clearance of debris by the microglia creates a favorable environment for subsequent reconstruction and reorganization of neuronal networking in a diseased brain [3,97]. For example, clearing the extracellular accumulation of β-amyloid (Aβ) via phagocytosis of Aβ by the activated microglia has been observed in experimental AD models [98,99,100] and modulating the activity of microglial phagocytosis might be a potential target for AD or the treatment for other brain injuries [3,100,101]. Notably, these beneficial microglial functions often involve changes in the morphology and protein expression, yet their function is distinct from that of classic pro-inflammatory responses. Activated microglia release cytokines and chemokines and execute phagocytosis activity [100]. In particular, phagocytosis has been proposed as a form of cell death caused by the phagocytosis of viable cells, resulting in their destruction [92]. The activation of microglial cells strongly elicits the phagocytosis of debris to prevent secondary inflammatory responses and tissue degeneration [19]. To the best of our knowledge, this study is the first to show the effects of quercetin on the proinflammatory stimuli-induced phagocytic ability in microglial cells.

5. Conclusions

Our findings indicate that treatment with quercetin effectively reduces the M1 inflammatory responses that stimulate NO production, proinflammatory cytokine expression, and lipocalin-2 production in both macrophages and microglial cells. The chemokines, CCL2 and CXCL10, were also inhibited by quercetin treatment. In addition, quercetin inhibits the production of ROS, such as H2O2, ROO, and HO. The microglial phagocytic ability induced by the proinflammatory stimuli was also reduced by the quercetin treatment; however, quercetin effectively increased the expression levels of the M2 marker, IL-10, in both the macrophages and microglial cells. Importantly, our results also showed that the treatment with quercetin upregulated a variety of endogenous antioxidants, including HO-1, GCLM, GCLC, and NQO1. Therefore, our results indicate that quercetin may be a useful therapeutic target for the treatment of neuroinflammation-associated disorders and other inflammatory-associated diseases owing to its role in the modulation of inflammatory homeostasis that could contribute to maintaining M1/M2 polarization and oxidation/antioxidation effects.

Supplementary Materials

The following are available online at https://www.mdpi.com/article/10.3390/nu14010067/s1, Figure S1: Effects of quercetin on cell viability in macrophages and microglial cells, Figure S2: Quercetin induces cell surface CD206 expression on macrophages.

Author Contributions

Conceptualization, W.-L.Y. and C.-F.T.; methodology, W.-L.Y., G.-W.C., Y.-C.C., C.-K.S. and C.-F.T.; resources, W.-L.Y., D.-Y.L., L.-Y.Y. and C.-F.T.; data curation, G.-W.C., C.-K.S. and Y.-C.C.; writing—original draft preparation, W.-L.Y. and C.-F.T.; writing—review and editing, W.-L.Y., D.-Y.L., L.-Y.Y. and C.-F.T.; supervision, W.-L.Y. and C.-F.T.; funding acquisition, W.-L.Y., J.-H.C. and C.-F.T. All authors have read and agreed to the published version of the manuscript.

Funding

This work is supported in part by grants from the Ministry of Science and Technology (MOST108-2320-B-468-003- and MOST 109-2320-B-468-005-), China Medical University (CMU107-S-48, CMU107-ASIA-16 and CMU109-MOST-02), and China Medical University Hospital (DMR-105-053, DMR-109-068 and DMR-110-096).

Institutional Review Board Statement

The study does not involve humans.

Informed Consent Statement

Not applicable.

Data Availability Statement

Data are available from the corresponding author on reasonable request.

Conflicts of Interest

The authors declare that they have no competing interests.

References

  1. Gordon, S.; Martinez, F.O. Alternative activation of macrophages: Mechanism and functions. Immunity 2010, 32, 593–604. [Google Scholar] [CrossRef] [Green Version]
  2. Song, M.G.; Ryoo, I.G.; Choi, H.Y.; Choi, B.H.; Kim, S.T.; Heo, T.H.; Lee, J.Y.; Park, P.H.; Kwak, M.K. NRF2 Signaling Negatively Regulates Phorbol-12-Myristate-13-Acetate (PMA)-Induced Differentiation of Human Monocytic U937 Cells into Pro-Inflammatory Macrophages. PLoS ONE 2015, 10, e0134235. [Google Scholar] [CrossRef]
  3. Kim, J.Y.; Kim, N.; Yenari, M.A. Mechanisms and potential therapeutic applications of microglial activation after brain injury. CNS Neurosci. Ther. 2015, 21, 309–319. [Google Scholar] [CrossRef]
  4. Nakagawa, Y.; Chiba, K. Diversity and plasticity of microglial cells in psychiatric and neurological disorders. Pharmacol. Ther. 2015, 154, 21–35. [Google Scholar] [CrossRef] [PubMed]
  5. Bagheri, H.; Ghasemi, F.; Barreto, G.E.; Sathyapalan, T.; Jamialahmadi, T.; Sahebkar, A. The effects of statins on microglial cells to protect against neurodegenerative disorders: A mechanistic review. BioFactors (Oxf. Engl.) 2019, 46, 309–325. [Google Scholar] [CrossRef] [PubMed]
  6. Saraiva, M.; O’Garra, A. The regulation of IL-10 production by immune cells. Nat. Rev. Immunol. 2010, 10, 170–181. [Google Scholar] [CrossRef] [PubMed] [Green Version]
  7. Kanda, H.; Tateya, S.; Tamori, Y.; Kotani, K.; Hiasa, K.; Kitazawa, R.; Kitazawa, S.; Miyachi, H.; Maeda, S.; Egashira, K.; et al. MCP-1 contributes to macrophage infiltration into adipose tissue, insulin resistance, and hepatic steatosis in obesity. J. Clin. Investig. 2006, 116, 1494–1505. [Google Scholar] [CrossRef] [PubMed]
  8. Oo, Y.H.; Adams, D.H. The role of chemokines in the recruitment of lymphocytes to the liver. J. Autoimmun. 2010, 34, 45–54. [Google Scholar] [CrossRef] [PubMed] [Green Version]
  9. Song, X.; Gao, X.; Wang, Y.; Raja, R.; Zhang, Y.; Yang, S.; Li, M.; Yao, Z.; Wei, L. HCV Core Protein Induces Chemokine CCL2 and CXCL10 Expression Through NF-κB Signaling Pathway in Macrophages. Front. Immunol. 2021, 12, 654998. [Google Scholar] [CrossRef] [PubMed]
  10. Peled, M.; Fisher, E.A. Dynamic Aspects of Macrophage Polarization during Atherosclerosis Progression and Regression. Front. Immunol. 2014, 5, 579. [Google Scholar] [CrossRef] [PubMed] [Green Version]
  11. Leopold Wager, C.M.; Wormley, F.L., Jr. Classical versus alternative macrophage activation: The Ying and the Yang in host defense against pulmonary fungal infections. Mucosal Immunol. 2014, 7, 1023–1035. [Google Scholar] [CrossRef] [PubMed] [Green Version]
  12. Kitade, H.; Sawamoto, K.; Nagashimada, M.; Inoue, H.; Yamamoto, Y.; Sai, Y.; Takamura, T.; Yamamoto, H.; Miyamoto, K.; Ginsberg, H.N.; et al. CCR5 plays a critical role in obesity-induced adipose tissue inflammation and insulin resistance by regulating both macrophage recruitment and M1/M2 status. Diabetes 2012, 61, 1680–1690. [Google Scholar] [CrossRef] [Green Version]
  13. Traves, P.G.; Luque, A.; Hortelano, S. Macrophages, inflammation, and tumor suppressors: ARF, a new player in the game. Mediat. Inflamm. 2012, 2012, 568783. [Google Scholar] [CrossRef] [PubMed]
  14. Lull, M.E.; Block, M.L. Microglial activation and chronic neurodegeneration. Neurotherapeutics 2010, 7, 354–365. [Google Scholar] [CrossRef] [Green Version]
  15. Cragnolini, A.B.; Lampitella, G.; Virtuoso, A.; Viscovo, I.; Panetsos, F.; Papa, M.; Cirillo, G. Regional brain susceptibility to neurodegeneration: What is the role of glial cells? Neural Regen. Res. 2020, 15, 838–842. [Google Scholar] [CrossRef] [PubMed]
  16. Carlessi, A.S.; Borba, L.A.; Zugno, A.I.; Quevedo, J.; Reus, G.Z. Gut microbiota-brain axis in depression: The role of neuroinflammation. Eur. J. Neurosci. 2021, 53, 222–235. [Google Scholar] [CrossRef]
  17. Porro, C.; Cianciulli, A.; Calvello, R.; Panaro, M.A. Reviewing the Role of Resveratrol as a Natural Modulator of Microglial Activities. Curr. Pharm. Des. 2015, 21, 5277–5291. [Google Scholar] [CrossRef] [PubMed]
  18. Tang, Y.; Le, W. Differential Roles of M1 and M2 Microglia in Neurodegenerative Diseases. Mol. Neurobiol. 2016, 53, 1181–1194. [Google Scholar] [CrossRef]
  19. Xia, C.Y.; Zhang, S.; Gao, Y.; Wang, Z.Z.; Chen, N.H. Selective modulation of microglia polarization to M2 phenotype for stroke treatment. Int. Immunopharmacol. 2015, 25, 377–382. [Google Scholar] [CrossRef] [PubMed]
  20. Lin, H.Y.; Huang, B.R.; Yeh, W.L.; Lee, C.H.; Huang, S.S.; Lai, C.H.; Lin, H.; Lu, D.Y. Antineuroinflammatory effects of lycopene via activation of adenosine monophosphate-activated protein kinase-α1/heme oxygenase-1 pathways. Neurobiol. Aging 2014, 35, 191–202. [Google Scholar] [CrossRef]
  21. Wu, L.H.; Huang, B.R.; Lai, S.W.; Lin, C.; Lin, H.Y.; Yang, L.Y.; Lu, D.Y. SIRT1 activation by minocycline on regulation of microglial polarization homeostasis. Aging (Albany NY) 2020, 12, 17990–18007. [Google Scholar] [CrossRef]
  22. Lisboa, S.F.; Gomes, F.V.; Guimaraes, F.S.; Campos, A.C. Microglial Cells as a Link between Cannabinoids and the Immune Hypothesis of Psychiatric Disorders. Front. Neurol. 2016, 7, 5. [Google Scholar] [CrossRef] [Green Version]
  23. Sugama, S.; Takenouchi, T.; Cho, B.P.; Joh, T.H.; Hashimoto, M.; Kitani, H. Possible roles of microglial cells for neurotoxicity in clinical neurodegenerative diseases and experimental animal models. Inflamm. Allergy Drug Targets 2009, 8, 277–284. [Google Scholar] [CrossRef] [PubMed]
  24. Li, Y.Z.; Chen, J.H.; Tsai, C.F.; Yeh, W.L. Anti-inflammatory Property of Imperatorin on Alveolar Macrophages and Inflammatory Lung Injury. J. Nat. Prod. 2019, 82, 1002–1008. [Google Scholar] [CrossRef] [PubMed]
  25. Chen, H.Z.; Guo, S.; Li, Z.Z.; Lu, Y.; Jiang, D.S.; Zhang, R.; Lei, H.; Gao, L.; Zhang, X.; Zhang, Y.; et al. A critical role for interferon regulatory factor 9 in cerebral ischemic stroke. J. Neurosci. 2014, 34, 11897–11912. [Google Scholar] [CrossRef] [PubMed] [Green Version]
  26. Anderson, A.H.; Xie, D.; Wang, X.; Baudier, R.L.; Orlandi, P.; Appel, L.J.; Dember, L.M.; He, J.; Kusek, J.W.; Lash, J.P.; et al. Novel Risk Factors for Progression of Diabetic and Nondiabetic CKD: Findings From the Chronic Renal Insufficiency Cohort (CRIC) Study. Am. J. Kidney Dis. 2021, 77, 56–73.e1. [Google Scholar] [CrossRef]
  27. Cheng, L.; Xing, H.; Mao, X.; Li, L.; Li, X.; Li, Q. Lipocalin-2 promotes m1 macrophages polarization in a mouse cardiac ischaemia-reperfusion injury model. Scand. J. Immunol. 2015, 81, 31–38. [Google Scholar] [CrossRef] [PubMed] [Green Version]
  28. Jang, E.; Lee, S.; Kim, J.H.; Kim, J.H.; Seo, J.W.; Lee, W.H.; Mori, K.; Nakao, K.; Suk, K. Secreted protein lipocalin-2 promotes microglial M1 polarization. FASEB J. 2013, 27, 1176–1190. [Google Scholar] [CrossRef] [PubMed] [Green Version]
  29. Lee, S.; Jha, M.K.; Suk, K. Lipocalin-2 in the Inflammatory Activation of Brain Astrocytes. Crit. Rev. Immunol. 2015, 35, 77–84. [Google Scholar] [CrossRef] [PubMed]
  30. Chen, Y.H.; Xie, S.Y.; Chen, C.W.; Lu, D.Y. Electroacupuncture improves repeated social defeat stress-elicited social avoidance and anxiety-like behaviors by reducing Lipocalin-2 in the hippocampus. Mol. Brain 2021, 14, 150. [Google Scholar] [CrossRef]
  31. Shankar, G.M.; Antony, J.; Anto, R.J. Quercetin and Tryptanthrin: Two Broad Spectrum Anticancer Agents for Future Chemotherapeutic Interventions. Enzymes 2015, 37, 43–72. [Google Scholar] [CrossRef] [PubMed]
  32. Li, Y.; Yao, J.; Han, C.; Yang, J.; Chaudhry, M.T.; Wang, S.; Liu, H.; Yin, Y. Quercetin, Inflammation and Immunity. Nutrients 2016, 8, 167. [Google Scholar] [CrossRef] [PubMed]
  33. Benameur, T.; Soleti, R.; Porro, C. The Potential Neuroprotective Role of Free and Encapsulated Quercetin Mediated by miRNA against Neurological Diseases. Nutrients 2021, 13, 1318. [Google Scholar] [CrossRef]
  34. Andres, S.; Pevny, S.; Ziegenhagen, R.; Bakhiya, N.; Schäfer, B.; Hirsch-Ernst, K.I.; Lampen, A. Safety Aspects of the Use of Quercetin as a Dietary Supplement. Mol. Nutr. Food Res. 2018, 62, 1700447. [Google Scholar] [CrossRef]
  35. Jeong, E.; Lee, J.Y. Intrinsic and extrinsic regulation of innate immune receptors. Yonsei Med. J. 2011, 52, 379–392. [Google Scholar] [CrossRef] [PubMed] [Green Version]
  36. Gan, L.; Johnson, J.A. Oxidative damage and the Nrf2-ARE pathway in neurodegenerative diseases. Biochim. Biophys. Acta 2014, 1842, 1208–1218. [Google Scholar] [CrossRef] [Green Version]
  37. Yang, J.; Kim, C.S.; Tu, T.H.; Kim, M.S.; Goto, T.; Kawada, T.; Choi, M.S.; Park, T.; Sung, M.K.; Yun, J.W.; et al. Quercetin Protects Obesity-Induced Hypothalamic Inflammation by Reducing Microglia-Mediated Inflammatory Responses via HO-1 Induction. Nutrients 2017, 9, 650. [Google Scholar] [CrossRef] [PubMed] [Green Version]
  38. Jeong, G.S.; Lee, D.S.; Li, B.; Lee, H.J.; Kim, E.C.; Kim, Y.C. Effects of sappanchalcone on the cytoprotection and anti-inflammation via heme oxygenase-1 in human pulp and periodontal ligament cells. Eur. J. Pharmacol. 2010, 644, 230–237. [Google Scholar] [CrossRef]
  39. Choi, H.G.; Lee, D.S.; Li, B.; Choi, Y.H.; Lee, S.H.; Kim, Y.C. Santamarin, a sesquiterpene lactone isolated from Saussurea lappa, represses LPS-induced inflammatory responses via expression of heme oxygenase-1 in murine macrophage cells. Int. Immunopharmacol. 2012, 13, 271–279. [Google Scholar] [CrossRef]
  40. Choy, C.S.; Hu, C.M.; Chiu, W.T.; Lam, C.S.; Ting, Y.; Tsai, S.H.; Wang, T.C. Suppression of lipopolysaccharide-induced of inducible nitric oxide synthase and cyclooxygenase-2 by Sanguis Draconis, a dragon’s blood resin, in RAW 264.7 cells. J. Ethnopharmacol. 2008, 115, 455–462. [Google Scholar] [CrossRef] [PubMed]
  41. Tsoyi, K.; Jang, H.J.; Lee, Y.S.; Kim, Y.M.; Kim, H.J.; Seo, H.G.; Lee, J.H.; Kwak, J.H.; Lee, D.U.; Chang, K.C. (+)-Nootkatone and (+)-valencene from rhizomes of Cyperus rotundus increase survival rates in septic mice due to heme oxygenase-1 induction. J. Ethnopharmacol. 2011, 137, 1311–1317. [Google Scholar] [CrossRef]
  42. Jazwa, A.; Cuadrado, A. Targeting heme oxygenase-1 for neuroprotection and neuroinflammation in neurodegenerative diseases. Curr. Drug Targets 2010, 11, 1517–1531. [Google Scholar] [CrossRef] [PubMed]
  43. Chuang, J.Y.; Chang, P.C.; Shen, Y.C.; Lin, C.; Tsai, C.F.; Chen, J.H.; Yeh, W.L.; Wu, L.H.; Lin, H.Y.; Liu, Y.S.; et al. Regulatory effects of fisetin on microglial activation. Molecules 2014, 19, 8820–8839. [Google Scholar] [CrossRef] [Green Version]
  44. Lu, D.Y.; Huang, B.R.; Yeh, W.L.; Lin, H.Y.; Huang, S.S.; Liu, Y.S.; Kuo, Y.H. Anti-neuroinflammatory effect of a novel caffeamide derivative, KS370G, in microglial cells. Mol. Neurobiol. 2013, 48, 863–874. [Google Scholar] [CrossRef]
  45. Tsai, C.F.; Kuo, Y.H.; Yeh, W.L.; Wu, C.Y.; Lin, H.Y.; Lai, S.W.; Liu, Y.S.; Wu, L.H.; Lu, J.K.; Lu, D.Y. Regulatory effects of caffeic acid phenethyl ester on neuroinflammation in microglial cells. Int. J. Mol. Sci. 2015, 16, 5572–5589. [Google Scholar] [CrossRef] [Green Version]
  46. Eseberri, I.; Miranda, J.; Lasa, A.; Churruca, I.; Portillo, M.P. Doses of Quercetin in the Range of Serum Concentrations Exert Delipidating Effects in 3T3-L1 Preadipocytes by Acting on Different Stages of Adipogenesis, but Not in Mature Adipocytes. Oxidative Med. Cell. Longev. 2015, 1–11. [Google Scholar] [CrossRef] [PubMed]
  47. Zhang, Y.; Wang, J.; Zhou, S.; Xie, Z.; Wang, C.; Gao, Y.; Zhou, J.; Zhang, X.; Li, Q. Flavones hydroxylated at 5, 7, 3’ and 4’ ameliorate skin fibrosis via inhibiting activin receptor-like kinase 5 kinase activity. Cell Death Dis. 2019, 10, 124. [Google Scholar] [CrossRef] [PubMed]
  48. Xu, W.; Xie, S.; Chen, X.; Pan, S.; Qian, H.; Zhu, X. Effects of Quercetin on the Efficacy of Various Chemotherapeutic Drugs in Cervical Cancer Cells. Drug Des. Dev. Ther. 2021, 15, 577–588. [Google Scholar] [CrossRef]
  49. Lin, H.-Y.; Tang, C.-H.; Chen, Y.-H.; Wei, I.-H.; Chen, J.-H.; Lai, C.-H.; Lu, D.-Y. Peptidoglycan enhances proinflammatory cytokine expression through the TLR2 receptor, MyD88, phosphatidylinositol 3-kinase/AKT and NF-kappaB pathways in BV-2 microglia. Int. Immunopharmacol. 2010, 10, 883–891. [Google Scholar] [CrossRef]
  50. Nabavi, S.F.; Russo, G.L.; Daglia, M.; Nabavi, S.M. Role of quercetin as an alternative for obesity treatment: You are what you eat! Food Chem. 2015, 179, 305–310. [Google Scholar] [CrossRef]
  51. McNelis, J.C.; Olefsky, J.M. Macrophages, immunity, and metabolic disease. Immunity 2014, 41, 36–48. [Google Scholar] [CrossRef] [PubMed] [Green Version]
  52. Chawla, A.; Nguyen, K.D.; Goh, Y.P. Macrophage-mediated inflammation in metabolic disease. Nat. Rev. Immunol. 2011, 11, 738–749. [Google Scholar] [CrossRef] [PubMed] [Green Version]
  53. Lumeng, C.N.; Bodzin, J.L.; Saltiel, A.R. Obesity induces a phenotypic switch in adipose tissue macrophage polarization. J. Clin. Investig. 2007, 117, 175–184. [Google Scholar] [CrossRef] [PubMed] [Green Version]
  54. Guerrero, A.R.; Uchida, K.; Nakajima, H.; Watanabe, S.; Nakamura, M.; Johnson, W.E.; Baba, H. Blockade of interleukin-6 signaling inhibits the classic pathway and promotes an alternative pathway of macrophage activation after spinal cord injury in mice. J. Neuroinflamm. 2012, 9, 40. [Google Scholar] [CrossRef] [PubMed] [Green Version]
  55. Chou, T.C. Anti-inflammatory and analgesic effects of paeonol in carrageenan-evoked thermal hyperalgesia. Br. J. Pharm. 2003, 139, 1146–1152. [Google Scholar] [CrossRef]
  56. Heyen, J.R.; Ye, S.; Finck, B.N.; Johnson, R.W. Interleukin (IL)-10 inhibits IL-6 production in microglia by preventing activation of NF-kappaB. Brain Res. Mol. Brain Res. 2000, 77, 138–147. [Google Scholar] [CrossRef]
  57. Nieoczym, D.; Socała, K.; Raszewski, G.; Wlaź, P. Effect of quercetin and rutin in some acute seizure models in mice. Prog. Neuro-Psychopharmacol. Biol. Psychiatry 2014, 54, 50–58. [Google Scholar] [CrossRef]
  58. Holzmann, I.; da Silva, L.M.; Corrêa da Silva, J.A.; Steimbach, V.M.; de Souza, M.M. Antidepressant-like effect of quercetin in bulbectomized mice and involvement of the antioxidant defenses, and the glutamatergic and oxidonitrergic pathways. Pharmacol. Biochem. Behav. 2015, 136, 55–63. [Google Scholar] [CrossRef]
  59. Zhang, X.; Hu, J.; Zhong, L.; Wang, N.; Yang, L.; Liu, C.C.; Li, H.; Wang, X.; Zhou, Y.; Zhang, Y.; et al. Quercetin stabilizes apolipoprotein E and reduces brain Aβ levels in amyloid model mice. Neuropharmacology 2016, 108, 179–192. [Google Scholar] [CrossRef]
  60. Fan, H.; Tang, H.B.; Shan, L.Q.; Liu, S.C.; Huang, D.G.; Chen, X.; Chen, Z.; Yang, M.; Yin, X.H.; Yang, H.; et al. Quercetin prevents necroptosis of oligodendrocytes by inhibiting macrophages/microglia polarization to M1 phenotype after spinal cord injury in rats. J. Neuroinflamm. 2019, 16, 206. [Google Scholar] [CrossRef] [Green Version]
  61. Tan, H.Y.; Wang, N.; Li, S.; Hong, M.; Wang, X.; Feng, Y. The Reactive Oxygen Species in Macrophage Polarization: Reflecting Its Dual Role in Progression and Treatment of Human Diseases. Oxidative Med. Cell. Longev. 2016, 2016, 2795090. [Google Scholar] [CrossRef] [PubMed] [Green Version]
  62. Dey, N.; Sinha, M.; Gupta, S.; Gonzalez, M.N.; Fang, R.; Endsley, J.J.; Luxon, B.A.; Garg, N.J. Caspase-1/ASC inflammasome-mediated activation of IL-1β-ROS-NF-κB pathway for control of Trypanosoma cruzi replication and survival is dispensable in NLRP3-/- macrophages. PLoS ONE 2014, 9, e111539. [Google Scholar] [CrossRef] [PubMed]
  63. Essler, S.; Dehne, N.; Brune, B. Role of sestrin2 in peroxide signaling in macrophages. FEBS Lett. 2009, 583, 3531–3535. [Google Scholar] [CrossRef] [PubMed] [Green Version]
  64. Lo, H.M.; Chen, C.L.; Yang, C.M.; Wu, P.H.; Tsou, C.J.; Chiang, K.W.; Wu, W.B. The carotenoid lutein enhances matrix metalloproteinase-9 production and phagocytosis through intracellular ROS generation and ERK1/2, p38 MAPK, and RARβ activation in murine macrophages. J. Leukoc. Biol. 2013, 93, 723–735. [Google Scholar] [CrossRef]
  65. Niethammer, P.; Grabher, C.; Look, A.T.; Mitchison, T.J. A tissue-scale gradient of hydrogen peroxide mediates rapid wound detection in zebrafish. Nature 2009, 459, 996–999. [Google Scholar] [CrossRef] [PubMed]
  66. Hackel, D.; Pflucke, D.; Neumann, A.; Viebahn, J.; Mousa, S.; Wischmeyer, E.; Roewer, N.; Brack, A.; Rittner, H.L. The connection of monocytes and reactive oxygen species in pain. PLoS ONE 2013, 8, e63564. [Google Scholar] [CrossRef] [Green Version]
  67. Liu, Q.; Zhang, D.; Hu, D.; Zhou, X.; Zhou, Y. The role of mitochondria in NLRP3 inflammasome activation. Mol. Immunol. 2018, 103, 115–124. [Google Scholar] [CrossRef]
  68. Sharma, V.; Mishra, M.; Ghosh, S.; Tewari, R.; Basu, A.; Seth, P.; Sen, E. Modulation of interleukin-1beta mediated inflammatory response in human astrocytes by flavonoids: Implications in neuroprotection. Brain Res. Bull. 2007, 73, 55–63. [Google Scholar] [CrossRef] [PubMed]
  69. Xie, J.; Song, W.; Liang, X.; Zhang, Q.; Shi, Y.; Liu, W.; Shi, X. Protective effect of quercetin on streptozotocin-induced diabetic peripheral neuropathy rats through modulating gut microbiota and reactive oxygen species level. Biomed. Pharm. 2020, 127, 110147. [Google Scholar] [CrossRef] [PubMed]
  70. Botham, K.M.; Wheeler-Jones, C.P. Postprandial lipoproteins and the molecular regulation of vascular homeostasis. Prog. Lipid Res. 2013, 52, 446–464. [Google Scholar] [CrossRef]
  71. Costa, L.G.; Garrick, J.M.; Roquè, P.J.; Pellacani, C. Mechanisms of Neuroprotection by Quercetin: Counteracting Oxidative Stress and More. Oxidative Med. Cell. Longev. 2016, 2016, 2986796. [Google Scholar] [CrossRef] [Green Version]
  72. Sun, Y.; Yang, T.; Leak, R.K.; Chen, J.; Zhang, F. Preventive and Protective Roles of Dietary Nrf2 Activators Against Central Nervous System Diseases. CNS Neurol. Disord. Drug Targets 2017, 16, 326–338. [Google Scholar] [CrossRef] [PubMed] [Green Version]
  73. Sabirzhanov, B.; Li, Y.; Coll-Miro, M.; Matyas, J.J.; He, J.; Kumar, A.; Ward, N.; Yu, J.; Faden, A.I.; Wu, J. Inhibition of NOX2 signaling limits pain-related behavior and improves motor function in male mice after spinal cord injury: Participation of IL-10/miR-155 pathways. Brain Behav. Immun. 2019, 80, 73–87. [Google Scholar] [CrossRef] [PubMed]
  74. Lobo-Silva, D.; Carriche, G.M.; Castro, A.G.; Roque, S.; Saraiva, M. Balancing the immune response in the brain: IL-10 and its regulation. J. Neuroinflamm. 2016, 13, 297. [Google Scholar] [CrossRef] [PubMed] [Green Version]
  75. Hellenbrand, D.J.; Reichl, K.A.; Travis, B.J.; Filipp, M.E.; Khalil, A.S.; Pulito, D.J.; Gavigan, A.V.; Maginot, E.R.; Arnold, M.T.; Adler, A.G.; et al. Sustained interleukin-10 delivery reduces inflammation and improves motor function after spinal cord injury. J. Neuroinflamm. 2019, 16, 93. [Google Scholar] [CrossRef]
  76. Jiang, M.; Wang, H.; Jin, M.; Yang, X.; Ji, H.; Jiang, Y.; Zhang, H.; Wu, F.; Wu, G.; Lai, X.; et al. Exosomes from MiR-30d-5p-ADSCs Reverse Acute Ischemic Stroke-Induced, Autophagy-Mediated Brain Injury by Promoting M2 Microglial/Macrophage Polarization. Cell. Physiol. Biochem. 2018, 47, 864–878. [Google Scholar] [CrossRef]
  77. Lee, T.S.; Chau, L.Y. Heme oxygenase-1 mediates the anti-inflammatory effect of interleukin-10 in mice. Nat. Med. 2002, 8, 240–246. [Google Scholar] [CrossRef]
  78. Landis, R.C.; Quimby, K.R.; Greenidge, A.R. M1/M2 Macrophages in Diabetic Nephropathy: Nrf2/HO-1 as Therapeutic Targets. Curr. Pharm. Des. 2018, 24, 2241–2249. [Google Scholar] [CrossRef]
  79. Tai, Y.H.; Tsai, R.Y.; Lin, S.L.; Yeh, C.C.; Wang, J.J.; Tao, P.L.; Wong, C.S. Amitriptyline suppresses neuroinflammation-dependent interleukin-10-p38 mitogen-activated protein kinase-heme oxygenase-1 signaling pathway in chronic morphine-infused rats. Anesthesiology 2009, 110, 1379–1389. [Google Scholar] [CrossRef] [Green Version]
  80. Lin, H.Y.; Yeh, W.L.; Huang, B.R.; Lin, C.; Lai, C.H.; Lin, H.; Lu, D.Y. Desipramine protects neuronal cell death and induces heme oxygenase-1 expression in Mes23.5 dopaminergic neurons. PLoS ONE 2012, 7, e50138. [Google Scholar] [CrossRef]
  81. Lin, C.; Lin, H.Y.; Chen, J.H.; Tseng, W.P.; Ko, P.Y.; Liu, Y.S.; Yeh, W.L.; Lu, D.Y. Effects of paeonol on anti-neuroinflammatory responses in microglial cells. Int. J. Mol. Sci. 2015, 16, 8844–8860. [Google Scholar] [CrossRef] [Green Version]
  82. Chen, T.J.; Jeng, J.Y.; Lin, C.W.; Wu, C.Y.; Chen, Y.C. Quercetin inhibition of ROS-dependent and -independent apoptosis in rat glioma C6 cells. Toxicology 2006, 223, 113–126. [Google Scholar] [CrossRef] [PubMed]
  83. Zhao, N.; Xu, X.; Jiang, Y.; Gao, J.; Wang, F.; Xu, X.; Wen, Z.; Xie, Y.; Li, J.; Li, R.; et al. Lipocalin-2 may produce damaging effect after cerebral ischemia by inducing astrocytes classical activation. J. Neuroinflamm. 2019, 16, 168. [Google Scholar] [CrossRef]
  84. Pinyopornpanish, K.; Chattipakorn, N.; Chattipakorn, S.C. Lipocalin-2: Its perspectives in brain pathology and possible roles in cognition. J. Neuroendocr. 2019, 31, e12779. [Google Scholar] [CrossRef] [PubMed]
  85. Dekens, D.W.; Naude, P.J.; Engelborghs, S.; Vermeiren, Y.; Van Dam, D.; Oude Voshaar, R.C.; Eisel, U.L.; De Deyn, P.P. Neutrophil Gelatinase-Associated Lipocalin and its Receptors in Alzheimer’s Disease (AD) Brain Regions: Differential Findings in AD with and without Depression. J. Alzheimers Dis. 2017, 55, 763–776. [Google Scholar] [CrossRef] [Green Version]
  86. Mucha, M.; Skrzypiec, A.E.; Schiavon, E.; Attwood, B.K.; Kucerova, E.; Pawlak, R. Lipocalin-2 controls neuronal excitability and anxiety by regulating dendritic spine formation and maturation. Proc. Natl. Acad. Sci. USA 2011, 108, 18436–18441. [Google Scholar] [CrossRef] [PubMed] [Green Version]
  87. Ferreira, A.C.; Da Mesquita, S.; Sousa, J.C.; Correia-Neves, M.; Sousa, N.; Palha, J.A.; Marques, F. From the periphery to the brain: Lipocalin-2, a friend or foe? Prog. Neurobiol. 2015, 131, 120–136. [Google Scholar] [CrossRef] [Green Version]
  88. Ferreira, A.C.; Pinto, V.; Da Mesquita, S.; Novais, A.; Sousa, J.C.; Correia-Neves, M.; Sousa, N.; Palha, J.A.; Marques, F. Lipocalin-2 is involved in emotional behaviors and cognitive function. Front. Cell. Neurosci. 2013, 7, 122. [Google Scholar] [CrossRef] [Green Version]
  89. Llorens, F.; Hermann, P.; Villar-Pique, A.; Diaz-Lucena, D.; Nagga, K.; Hansson, O.; Santana, I.; Schmitz, M.; Schmidt, C.; Varges, D.; et al. Cerebrospinal fluid lipocalin 2 as a novel biomarker for the differential diagnosis of vascular dementia. Nat. Commun. 2020, 11, 619. [Google Scholar] [CrossRef] [Green Version]
  90. Lai, S.; Wu, G.; Jiang, Z. Glycyrrhizin Treatment Facilitates Extinction of Conditioned Fear Responses After a Single Prolonged Stress Exposure in Rats. Cell. Physiol. Biochem. 2018, 45, 2529–2539. [Google Scholar] [CrossRef]
  91. Sonninen, T.M.; Hamalainen, R.H.; Koskuvi, M.; Oksanen, M.; Shakirzyanova, A.; Wojciechowski, S.; Puttonen, K.; Naumenko, N.; Goldsteins, G.; Laham-Karam, N.; et al. Metabolic alterations in Parkinson’s disease astrocytes. Sci. Rep. 2020, 10, 14474. [Google Scholar] [CrossRef] [PubMed]
  92. Brown, G.C.; Neher, J.J. Eaten alive! Cell death by primary phagocytosis: ‘phagoptosis’. Trends Biochem. Sci. 2012, 37, 325–332. [Google Scholar] [CrossRef]
  93. Neumann, H.; Kotter, M.R.; Franklin, R.J.M. Debris clearance by microglia: An essential link between degeneration and regeneration. Brain A J. Neurol. 2009, 132, 288–295. [Google Scholar] [CrossRef]
  94. Prokop, S.; Miller, K.R.; Heppner, F.L. Microglia actions in Alzheimer’s disease. Acta Neuropathol. 2013, 126, 461–477. [Google Scholar] [CrossRef] [PubMed]
  95. Sarkar, S.; Ravikumar, B.; Rubinsztein, D.C. Autophagic clearance of aggregate-prone proteins associated with neurodegeneration. Methods Enzymol. 2009, 453, 83–110. [Google Scholar] [CrossRef]
  96. Long-Smith, C.M.; Sullivan, A.M.; Nolan, Y.M. The influence of microglia on the pathogenesis of Parkinson’s disease. Prog. Neurobiol. 2009, 89, 277–287. [Google Scholar] [CrossRef] [PubMed]
  97. Su, P.; Zhang, J.; Wang, D.; Zhao, F.; Cao, Z.; Aschner, M.; Luo, W. The role of autophagy in modulation of neuroinflammation in microglia. Neuroscience 2016, 319, 155–167. [Google Scholar] [CrossRef] [PubMed]
  98. Jiang, T.; Zhang, Y.D.; Gao, Q.; Zhou, J.S.; Zhu, X.C.; Lu, H.; Shi, J.Q.; Tan, L.; Chen, Q.; Yu, J.T. TREM1 facilitates microglial phagocytosis of amyloid beta. Acta Neuropathol. 2016, 132, 667–683. [Google Scholar] [CrossRef] [PubMed]
  99. Cho, M.H.; Cho, K.; Kang, H.J.; Jeon, E.Y.; Kim, H.S.; Kwon, H.J.; Kim, H.M.; Kim, D.H.; Yoon, S.Y. Autophagy in microglia degrades extracellular beta-amyloid fibrils and regulates the NLRP3 inflammasome. Autophagy 2014, 10, 1761–1775. [Google Scholar] [CrossRef] [Green Version]
  100. Fu, R.; Shen, Q.; Xu, P.; Luo, J.J.; Tang, Y. Phagocytosis of microglia in the central nervous system diseases. Mol. Neurobiol. 2014, 49, 1422–1434. [Google Scholar] [CrossRef] [Green Version]
  101. Derecki, N.C.; Katzmarski, N.; Kipnis, J.; Meyer-Luehmann, M. Microglia as a critical player in both developmental and late-life CNS pathologies. Acta Neuropathol. 2014, 128, 333–345. [Google Scholar] [CrossRef] [PubMed] [Green Version]
Figure 1. Inhibitory effects of quercetin on lipocalin-2 expression in macrophages and microglial cells. Mouse macrophage (RAW264.7) (A) and adult mouse microglial (IMG) (B) cells were stimulated with various concentrations of quercetin (1, 5, or 10 μM) for 30 min followed by stimulation with lipopolysaccharides (LPS) (50 ng/mL) for another 6 h. The mRNA levels of of lipocalin-2 were analyzed by real-time polymerase chain reaction (PCR) and normalized to β-actin. Each bar represents the mean ± standard error of the mean (SEM) (n = 3). Note: *** p < 0.005, ** p < 0.01 compared with the control group. ### p < 0.005, ## p < 0.01, # p < 0.05 compared with the LPS alone group.
Nutrients 14 00067 g001
Figure 2. Inhibitory effects of quercetin on inducible nitric oxide synthase (iNOS) and cyclooxygenase (COX)-2 expression levels in macrophages. RAW264.7 cells were stimulated with various concentrations of quercetin (1, 5, or 10 μM) for 30 min followed by stimulation with LPS (50 ng/mL) for another 24 h. iNOS and COX-2 protein levels were determined by western blotting analysis (A). Quantitative results are shown in (C,D). (B) The supernatant was collected to determine nitric oxide (NO) production by the Griess reaction. Each bar represents the mean ± SEM of n = 3–4. Note: *** p < 0.005, ** p < 0.01 compared with the control group. ### p < 0.005, ## p < 0.01 compared with the LPS alone group.
Nutrients 14 00067 g002
Figure 3. Inhibitory effects of quercetin on iNOS and COX-2 expression levels in microglial cells. IMG cells were stimulated with various concentrations of quercetin (1, 5, or 10 μM) for 30 min, followed by stimulation with LPS (50 ng/mL) for another 24 or 6 h. iNOS and COX-2 protein levels were determined by western blotting analysis (A). (B) The supernatant was collected to determine NO production by the Griess reaction. Quantitative results are shown in (C) and (D). mRNA levels of iNOS (E) and COX-2 (F) were analyzed by real-time PCR and normalized to β-actin. Each bar represents the mean ± SEM of n = 3–4. *** p < 0.005, ** p < 0.01 compared with the control group. Note: ### p < 0.005, ## p < 0.01, # p < 0.05 compared with the LPS alone group.
Nutrients 14 00067 g003
Figure 4. Inhibitory effects of quercetin on the expression of proinflammatory mediators in macrophages and microglial cells. RAW264.7 (A,C,E) and IMG (B,D,F) cells were stimulated with various concentrations of quercetin (1, 5, or 10 μM) for 30 min followed by stimulation with LPS (50 ng/mL) for another 6 h. mRNA levels of interleukin (IL)-1β (A,B), tumor necrosis factor (TNF)-α (C,D), and IL-6 (E,F) were analyzed by real-time PCR and normalized to β-actin. Each bar represents the mean ± SEM of n = 3–4. ***p < 0.005, **p < 0.01 compared with the control group. Note: ### p < 0.005, ## p < 0.01, # p < 0.05 compared with the LPS alone group.
Nutrients 14 00067 g004
Figure 5. Inhibitory effects of quercetin on the expression of inflammatory mediators in macrophages and microglial cells. RAW264.7 (A,B) and IMG (C,D) cells were stimulated with various concentrations of quercetin (1, 5, or 10 μM) for 30 min followed by stimulation with LPS (50 ng/mL) for another 6 h. mRNA levels of C-X-C motif chemokine ligand (CXCL)-10 (A,C) and C–C motif chemokine ligand (CCL)-2 (B,D) were analyzed by real-time PCR and normalized to β-actin. Each bar represents the mean ± SEM (n = 3). Note: *** p < 0.005 compared with the control group. ### p < 0.005, ## p < 0.01, # p < 0.05 compared with the LPS alone group.
Nutrients 14 00067 g005
Figure 6. Effects of quercetin on reactive oxygen species (ROS) production in microglial cells. IMG cells were stimulated with various concentrations of quercetin (1, 5, or 10 μM) for 30 min followed by stimulation with 5 mM hydrogen peroxide (H2O2) (A), 5 mM 2, 2′-azobis (2-amidinopropane) hydrochloride (AAPH) (B), or 1 mM iron(II) plus 0.5 mM H2O2 (C) for another 90 min. Following incubation with 10 μM 2′, 7′-dichlorodihydrofluorescein diacetate (DCFH-DA) for 40 min, dichlorofluorescein (DCF) fluorescence intensity was detected by flow cytometry. Each bar represents the mean ± SEM (n = 4). *** p < 0.005 compared with the control group. Note: ### p < 0.005, ## p < 0.01, # p < 0.05 compared with the stimulated group alone.
Nutrients 14 00067 g006
Figure 7. Effects of quercetin on the phagocytic ability of microglial cells. (A) IMG cells were stimulated either with quercetin (10 μM) or LPS (10 ng/mL) alone for 24 h. In figure B to D, following LPS (10 ng/mL) stimulation, cells were also co-treated with quercetin (1 μM in (B); 5 μM in (C); 10 μM in (D)) for 24 h. By monitoring the degree of fluorescence intensity by flow cytometry, populations of microglia that engulfed 0, 1, 2, or more beads can be differentiated. The quantitative results were shown in (E). Each bar represents the mean ± SEM of n = 4. Note: *** p < 0.005, * p < 0.05 compared with the control group. ## p < 0.01, # p < 0.05 compared with the LPS alone group.
Nutrients 14 00067 g007
Figure 8. Effects of quercetin on the expression levels of anti-inflammation gene IL-10 in macrophages and microglial cells. RAW264.7 (A) and IMG (B) cells were stimulated with various concentrations of quercetin (1, 5, or 10 μM) for 6 h. The mRNA levels IL-10 were analyzed by real-time PCR and normalized to β-actin. Each bar represents the mean ± SEM (n = 3). Note: ** p < 0.01, * p < 0.05 compared with the control group.
Nutrients 14 00067 g008
Figure 9. Effects of quercetin on the expression levels of endogenous antioxidants in microglial cells. IMG cells were stimulated with various concentrations of quercetin (1, 5, or 10 μM) for 6 h. mRNA levels of heme oxygenase (HO)-1 (A), glutamate-cysteine ligase catalytic subunit (GCLC) (B), glutamate-cysteine ligase modifier subunit (GCLM) (C), and NAD(P)H quinone oxidoreductase-1 (NQO1) (D) were analyzed by real-time PCR and normalized to β-actin. Each bar represents the mean ± SEM of n = 3–4. Note: *** p < 0.005, ** p < 0.01, compared with the control group.
Nutrients 14 00067 g009
Figure 10. Quercetin promotes the expression of endogenous antioxidants in microglial cells. IMG cells were stimulated with various concentrations of quercetin (1, 5, or 10 μM) for 24 h. HO-1, GCLC, GCLM, and NQO1 protein levels were determined by western blotting analysis (A,B). The quantitative results of HO-1 (C), GCLC (D), GCLM (E), and NQO1 (F) were determined using ImageJ software. Each bar represents the mean ± SEM (n = 3). Note: *** p < 0.001, ** p < 0.01, * p < 0.05 compared with the control group.
Nutrients 14 00067 g010
Figure 11. AMP-activated protein kinase (AMPK) and Akt signaling pathways are involved in the expression of quercetin-upregulated endogenous antioxidants. IMG cells were treated with quercetin (10 μM) for the indicated time periods (30, 60, or 120 min). The phosphorylated levels of AMPK (A) and Akt (B) were determined by western blotting analysis. Cells were treated with the AMPK inhibitor compound C (15 μM) or Akt inhibitor (10 μM) for 30 min and then stimulated with quercetin (10 μM) for 6 h. mRNA levels of IL-10 (C), HO-1 (D), GCLC (E), GCLM (F), and NQO1 (G) were analyzed by real-time PCR and normalized to β-actin. Each bar represents the mean ± SEM of n = 3–4. *** p < 0.005 compared with the control group. Note: ### p < 0.005, ## p < 0.01 compared with the quercetin alone group.
Nutrients 14 00067 g011
Publisher’s Note: MDPI stays neutral with regard to jurisdictional claims in published maps and institutional affiliations.

