
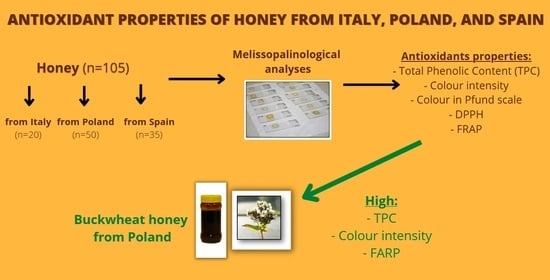
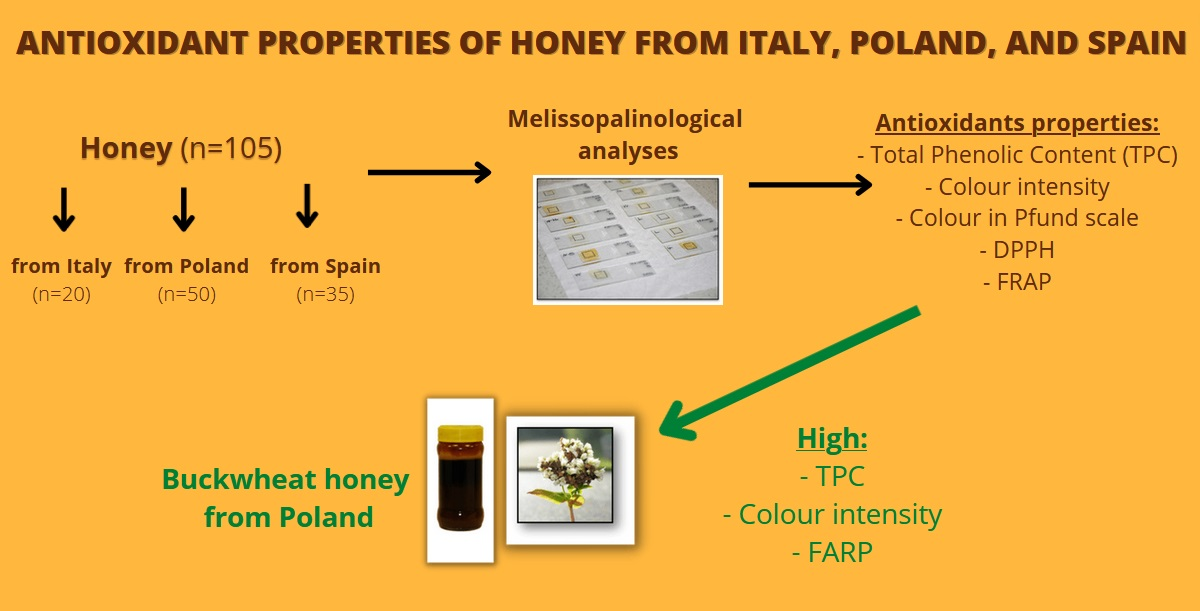
Comparative Analysis of Antioxidant Properties of Honey from Poland, Italy, and Spain Based on the Declarations of Producers and Their Results of Melissopalinological Analysis

 ,
,  ,
,  , , and
Abstract
:
1. Introduction
2. Materials and Methods
2.1. Materials
2.2. Methods
2.2.1. Determination of Variety
2.2.2. Determination of Water Content
2.2.3. Determination of Electrical Conductivity
2.2.4. Determination of Total Phenolic Content
2.2.5. Determination of Color Intensity (CI)
2.2.6. Determination of Color in Pfund Scale (CP)
2.2.7. Determination of Radical Scavenging Capacity by DPPH Assay (DPPH)
2.2.8. Determination of FRAP
2.3. Statistical Analysis
3. Results
4. Discussion
5. Conclusions
Author Contributions
Funding
Institutional Review Board Statement
Informed Consent Statement
Data Availability Statement
Acknowledgments
Conflicts of Interest
References
- European Commision. Honey. Detailed Information on Honey Production in the European Union. Available online: https://ec.europa.eu/info/food-farming-fisheries/animals-and-animal-products/animal-products/honey_en (accessed on 6 March 2022).
- Dybova-Jachowicz, S.; Sadowska, A. Palinologia [Palynology]; IB PAN: Kraków, Poland, 2003. [Google Scholar]
- Official Journal of the European Communities. COUNCIL DIRECTIVE 2001/110/EC of 20 December 2001 Relating to Honey. Available online: https://eur-lex.europa.eu/legal-content/EN/TXT/PDF/?uri=CELEX:32001L0110&from=EN (accessed on 1 April 2022).
- Oddo, L.P.; Bogdanov, S. Determination of honey botanical origin: Problems and issue. Apidologie 2004, 35, S2–S3. [Google Scholar] [CrossRef] [Green Version]
- Urząd Ochrony Konkurencji i Konsumentów [The Office of Competition and Consumer Protection]. Informacja o wynikach kontroli jakości handlowej miodu [Information on the Results of the Commercial Quality Control of Honey]. Available online: https://uokik.gov.pl/raporty_z_kontroli_inspekcji_handlowej.php?pytanie=4349#faq4349 (accessed on 1 April 2022).
- Pospiech, M.; Javůrková, Z.; Hrabec, P.; Štarha, P.; Ljasovská, S.; Bednář, J.; Tremlová, B. Identification of pollen taxa by different microscopy techniques. PLoS ONE 2021, 16, e0256808. [Google Scholar] [CrossRef] [PubMed]
- Niaz, K.; Maqbool, F.; Bahadar, H.; Abdollahi, M. Health Benefits of Manuka Honey as an Essential Constituent for Tissue Regeneration. Curr. Drug. Metab. 2017, 18, 881–892. [Google Scholar] [CrossRef] [PubMed]
- Moskwa, J.; Borawska, M.H.; Markiewicz-Zukowska, R.; Puscion-Jakubik, A.; Naliwajko, S.K.; Socha, K.; Soroczynska, J. Polish natural bee honeys are anti-proliferative and anti-metastatic agents in human glioblastoma multiforme U87MG cell line. PLoS ONE 2014, 9, e90533. [Google Scholar] [CrossRef]
- Martinello, M.; Mutinelli, F. Antioxidant Activity in Bee Products: A Review. Antioxidants 2021, 10, 71. [Google Scholar] [CrossRef]
- Cianciosi, D.; Forbes-Hernández, T.Y.; Afrin, S.; Gasparrini, M.; Reboredo-Rodriguez, P.; Manna, P.P.; Zhang, J.; Bravo Lamas, L.; Martínez Flórez, S.; Agudo Toyos, P.; et al. Phenolic Compounds in Honey and Their Associated Health Benefits: A Review. Molecules 2018, 23, 2322. [Google Scholar] [CrossRef] [Green Version]
- Louveaux, J.; Maurizio, A.; Vorwohl, G. Methods of melissopalynology. Bee World 1978, 59, 139–157. [Google Scholar] [CrossRef]
- Regulation of the Minister of Agriculture and Rural Development Dated 14 January 2009. On Methods of Analysis Related to the Performance Evaluation of Honey [In Polish, Rozporządzenie Ministra Rolnictwa i Rozwoju Wsi z dnia 14 stycznia 2009 r. w sprawie metod analiz związanych z dokonywaniem oceny miodu]. 2009; Dz.U. 2009 nr 17 poz. 94. Available online: https://isap.sejm.gov.pl/isap.nsf/DocDetails.xsp?id=WDU20090170094 (accessed on 25 March 2022).
- Zhou, J.; Yang, Q.; Zhu, X.; Lin, T.; Hao, D.; Xu, J. Antioxidant activities of Clerodendrum cyrtophyllum Turcz leaf extracts and their major components. PLoS ONE 2020, 15, e0234435. [Google Scholar] [CrossRef]
- Beretta, G.; Granata, P.; Ferrero, M.; Orioli, M.; Facino, R.M. Standarization of antioxidant properties of honey by a combination of spectrophotometric/fluorimetric assays and chemometrics. Anal. Chim. Acta 2005, 533, 185–191. [Google Scholar] [CrossRef]
- White, J.W. Instrumental Color Classification of Honey: Collaborative Study. J. Assoc. Off. Anal. Chem. 1984, 67, 1129–1131. [Google Scholar] [CrossRef]
- Sánchez-Moreno, C.; Larrauri, J.A.; Saura-Calixto, F. A procedure to measure the antiradical efficiency of polyphenols. J. Sci. Food Agric. 1998, 76, 270–276. [Google Scholar] [CrossRef]
- Benzie, I.F.; Strain, J.J. The ferric reducing ability of plasma (FRAP) as a measure of “antioxidant power”: The FRAP assay. Anal. Biochem. 1996, 239, 70–76. [Google Scholar] [CrossRef] [PubMed] [Green Version]
- Halagarda, M.; Groth, S.; Popek, S.; Rohn, S.; Pedan, V. Antioxidant Activity and Phenolic Profile of Selected Organic and Conventional Honeys from Poland. Antioxidants 2020, 9, 44. [Google Scholar] [CrossRef] [PubMed] [Green Version]
- Lim, Y.Y.; Lim, T.T.; Tee, J.J. Antioxidant properties of several tropical fruits: A comparative study. Food Chem. 2007, 103, 1003–1008. [Google Scholar] [CrossRef]
- Wilczyńska, A. Phenolic content and antioxidant activity of different types of Polish honey—A short report. Pol. J. Food Nutr. Sci. 2010, 60, 309–313. [Google Scholar]
- Alzahrani, H.A.; Boukraa, L.; Bellik, Y.; Abdellah, F.; Bakhotmah, B.A.; Kolayli, S.; Sahin, H. Evaluation of the antioxidant activity of three varieties of honey from different botanical and geographical origins. Glob. J. Health Sci. 2012, 4, 191–196. [Google Scholar] [CrossRef] [Green Version]
- Bodor, Z.; Benedek, C.; Urbin, A.; Szabo, D.; Sipos, L. Colour of honey: Can we trust the Pfund scale?—An alternative graphical tool covering the whole visible spectra. LWT—Food Sci. Technol. 2021, 149, 111859. [Google Scholar] [CrossRef]
- Kishore, R.K.; Halim, A.S.; Syazana, M.S.; Sirajudeen, K.N. Tualang honey has higher phenolic content and greater radical scavenging activity compared with other honey sources. Nutr. Res. 2011, 31, 322–325. [Google Scholar] [CrossRef]
- Deng, J.; Liu, R.; Lu, Q.; Hao, P.; Xu, A.; Zhang, J.; Tan, J. Biochemical properties, antibacterial and cellular antioxidant activities of buckwheat honey in comparison to manuka honey. Food Chem. 2018, 252, 243–249. [Google Scholar] [CrossRef]
- Gheldof, N.; Wang, X.H.; Engeseth, N.J. Buckwheat honey increases serum antioxidant capacity in humans. J. Agric. Food Chem. 2003, 51, 1500–1505. [Google Scholar] [CrossRef]
- Nešović, M.; Gašić, U.; Tosti, T.; Horvacki, N.; Šikoparija, B.; Nedić, N.; Blagojević, S.; Ignjatović, L.; Tešić, Ž. Polyphenol profile of buckwheat honey, nectar and pollen. R. Soc. Open Sci. 2020, 7, 201576. [Google Scholar] [CrossRef] [PubMed]


| The Origin of the Samples | Variety of Samples |
|---|---|
| Italy (n = 20) | chestnut (n = 5), eucalyptus (n = 5), lemon (n = 5), orange (n = 5) |
| Poland (n = 50) | acacia (n = 5), buckwheat (n = 5), dandelion (n = 5), heather (n = 5), honeydew coniferous (n = 5), honeydew deciduous (n = 5), linden (n = 5), phacelia (n = 5), rape (n = 5), raspberry (n = 5) |
| Spain (n = 35) | almond (n = 5), chestnut (n = 5), heath (n = 5), lavender (n = 5), orange (n = 5), rosemary (n = 5), thyme (n = 5) |
| Varieties Declared by Beekeepers | The Origin of the Samples | Percentage of Correctly Classified Samples | Percentage of Incorrectly Classified Samples |
|---|---|---|---|
| chestnut | Italy | 100 | 0 |
| eucalyptus | 60 | 40 | |
| lemon | 20 | 80 | |
| orange | 40 | 60 | |
| acacia | Poland | 0 | 100 |
| buckwheat | 100 | 0 | |
| dandelion | 0 | 100 | |
| heather | 60 | 40 | |
| honeydew coniferous | 100 | 0 | |
| honeydew deciduous | 40 | 60 | |
| linden | 80 | 20 | |
| phacelia | 60 | 40 | |
| rape | 100 | 0 | |
| raspberry | 0 | 100 | |
| almond | Spain | 20 | 80 |
| chestnut | 100 | 0 | |
| heath | 80 | 20 | |
| lavender | 100 | 0 | |
| orange | 60 | 40 | |
| rosemary | 80 | 20 | |
| thyme | 80 | 20 | |
| TOTAL | 62 | 38 |
| Varieties Declared by Beekeepers (Sign) | Total Phenolic Content | Color Intensity | Color in Pfund Scale | DPPH | FRAP (Equivalent µM of Fe2+/mL of Sample) |
|---|---|---|---|---|---|
| (mg GAE/100 g) | (mAU) | (mm Pfund) | (%) | ||
| Av. ± SD Min–Max Med. Q1–Q3 | |||||
| THE ORIGIN OF THE SAMPLES: ITALY | |||||
| chestnut (A) | 95.1 ± 16.7 | 0.346 ± 0.241 | 121.8 ± 12.98 | 63.5 ± 3.4 | 0.222 ± 0.030 |
| 78.58–114.00 | 0.156–0.694 | 104.7–140.4 | 58.1–67.4 | 0.193–0.265 | |
| 87.4 | 0.192 | 123.1 | 64.4 | 0.216 | |
| 83.38–112.20 | 0.185–0.506 | 116.6–124.4 | 63.0–64.8 | 0.197–0.237 | |
| eucalyptus (B) | 53.53 ± 10.6 | 0.263 ± 0.081 | 103.2 ± 24.5 | 60.6 ± 10.8 | 0.170 ± 0.048 |
| 47.64–72.41 | 0.176–0.376 | 80.6–142.2 | 43.2–71.0 | 0.118–0.214 | |
| 48.91 | 0.275 | 100.4 | 64.1 | 0.188 | |
| 47.99–50.73 | 0.194–0.292 | 84.8–107.8 | 57.7–66.8 | 0.119–0.210 | |
| lemon (C) | 21.47 ± 2.94 | 0.134 ± 0.111 | 44.5 ± 21.7 | 31.5 ± 10.2 | 0.014 ± 0.008 |
| 18.01–24.34 | 0.051–0.323 | 31.7–83.1 | 15.2–42.1 | 0.006–0.0248 | |
| 21.89 | 0.12 | 35.1 | 32 | 0.011 | |
| 18.90–24.23 | 0.054–0.126 | 35.1–37.3 | 30.8–37.6 | 0.008–0.019 | |
| orange (D) | 29.84 ± 5.41 | 0.222 ± 0.310 | 43.1 ± 15.7 | 46.4 ± 8.3 | 0.066 ± 0.027 |
| 22.89–36.04 | 0.080–0.776 | 33.5–71.1 | 35.4–57.4 | 0.047–0.113 | |
| 29.58 | 0.08 | 37 | 44.2 | 0.06 | |
| 26.49–34.21 | 0.075–0.108 | 35.8–38.1 | 44.2–51.5 | 0.051–0.059 | |
| TOTAL | 49.99 ± 30.83 | 0.241 ± 0.206 | 78.1 ± 40.0 | 50.5 ± 15.3 | 0.118 ± 0.089 |
| 18.01–114.00 | 0.050–0.776 | 31.7–142.2 | 15.2–71.0 | 0.006–0.265 | |
| 41.84 | 0.18 | 81.8 | 54.4 | 0.115 | |
| 24.28–75.49 | 0.094–0.307 | 36.4–112.2 | 39.9–64.2 | 0.036–0.204 | |
| THE ORIGIN OF THE SAMPLES: POLAND | |||||
| acacia (E) | 21.29 ± 5.97 | 0.043 ± 0.014 | 21.9 ± 21.7 | 34.2 ± 16.0 | 0.026 ± 0.023 |
| 14.70–28.15 | 0.025–0.050 | 0.1–49.8 | 9.3–51.0 | 0.004–0.061 | |
| 24.04 | 0.045 | 25.3 | 37.1 | 0.026 *** E/F | |
| 15.31–24.26 | 0.033–0.052 | 0.1–34.0 | 30.0–43.6 | 0.006–0.031 | |
| buckwheat (F) | 212.63 ± 37.71 | 1.421 ± 0.724 | 248.2 ± 63.98 | 39.1 ± 15.0 | 0.391 ± 0.014 |
| 167.75–261.05 | 0.770–2.605 | 182.8–351.1 | 21.1–57.9 | 0.370–0.407 | |
| 213.05 *** C/F, ** D/F, *** E/F | 1.138 *** E/F | 237.3 ** C/F | 43.5 | 0.394 *** C/F, * D/F | |
| 184.95–236.35 | 1.015–1.578 | 212.2–257.8 | 26.6–46.3 | 0.383–0.400 | |
| dandelion (G) | 46.84 ± 13.85 | 0.206 ± 0.118 | 133.8 ± 47.6 | 49.0 ± 16.0 | 0.125 ± 0.059 |
| 34.70–68.85 | 0.111–0.379 | 87.4–211.3 | 30.1–67.1 | 0.090–0.229 | |
| 40.75 | 0.133 | 127.9 | 53.1 | 0.1 | |
| 38.23–51.71 | 0.130–0.279 | 104.7–137.6 | 34.7–59.9 | 0.098–0.108 | |
| heather (H) | 82.32 ± 25.65 | 0.353 ± 0.089 | 122.6 ± 22.9 | 46.0 ± 34.3 | 0.152 ± 0.050 |
| 49.42–116.60 | 0.265–0.471 | 90.2–149.6 | 6.8–100.0 | 0.118–0.238 | |
| 76.48 | 0.351 | 120.9 | 45 | 0.141 | |
| 71.72–97.37 | 0.271–0.406 | 113.9–138.3 | 30.3–47.9 | 0.120–0.142 | |
| honeydew coniferous (I) | 98.38 ± 23.03 | 0.517 ± 0.151 | 244.8 ± 171.8 | 54.8 ± 20.5 | 0.276 ± 0.079 |
| 64.57–120.75 | 0.309–0.643 | 77.9–518.8 | 24.4–74.2 | 0.152–0.343 | |
| 109.35 | 0.61 | 244.8 | 61.1 | 0.312 | |
| 85.25–112.00 | 0.404–0.622 | 122.3–259.4 | 44.4–69.7 | 0.243–0.328 | |
| honeydew deciduous (J) | 76.42 ± 17.98 | 0.402 ± 0.157 | 150.0 ± 29.3 | 67.3 ± 5.0 | 0.189 ± 0.052 |
| 45.58–92.41 | 0.237–0.559 | 126.4–200.1 | 59.3–71.5 | 0.107–0.242 | |
| 82.60 * C/J | 0.424 * E/J | 138.2 | 68.5 | 0.199 * C/J | |
| 78.42–83.08 | 0.244–0.549 | 134.8–150.4 | 65.8–71.3 | 0.178–0.219 | |
| linden (K) | 51.80 ± 21.79 | 0.186 ± 0.169 | 78.4 ± 14.3 | 59.6 ± 10.5 | 0.100 ± 0.049 |
| 36.61–89.66 | 0.098–0.489 | 61.0–100.8 | 51.0–76.7 | 0.074–0.188 | |
| 42.02 | 0.109 | 76.4 | 53.9 | 0.077 | |
| 40.04–50.70 | 0.108–0.128 | 75.7–78.7 | 53.8–62.9 | 0.077–0.082 | |
| phacelia (L) | 42.97 ± 28.67 | 0.158 ± 0.207 | 76.3 ± 61.3 | 61.5 ± 24.3 | 0.098 ± 0.084 |
| 25.17–93.74 | 0.050–0.528 | 32.9–184.5 | 39.6–100.0 | 0.042–0.44 | |
| 30.96 | 0.06 | 55.6 *** C/L, ** G/L | 50.2 | 0.057 | |
| 28.62–36.39 | 0.058–0.095 | 51.4–56.9 | 47.3–70.2 | 0.051–0.094 | |
| rape (M) | 30.61 ± 3.24 | 0.064 ± 0.014 | 62.0 ± 17.6 | 49.9 ± 7.1 | 0.056 ± 0.012 |
| 27.28–35.96 | 0.050–0.080 | 44.4–85.3 | 43.0–58.1 | 0.043–0.075 | |
| 29.88 * F/M | 0.063 ** F/M | 61.7 | 48.7 | 0.056 ** F/M | |
| 29.26–30.69 | 0.051–0.078 | 45.6–72.9 | 43.3–56.2 | 0.046–0.058 | |
| raspberry (N) | 48.72 ± 16.14 | 0.162 ± 0.061 | 91.6 ± 23.6 | 63.66 ± 15.33 | 0.164 ± 0.050 |
| 34.13–73.20 | 0.107–0.246 | 70.1–126.7 | 45.95–79.39 | 0.118–0.240 | |
| 40.82 | 0.14 | 79.4 | 62.25 | 0.166 | |
| 38.64–56.85 | 0.113–0.204 | 77.2–104.7 | 51.74–78.97 | 0.121–0.173 | |
| TOTAL | 71.20 ± 56.32 | 0.351 ± 0.453 | 122.9 ± 92.8 | 52.5 ± 19.5 | 0.157 ± 0.114 |
| 14.70–261.05 | 0.025–2.605 | 0.1–518.8 | 6.8–100.0 | 0.004–0.407 | |
| 50.06 | 0.22 | 102.7 | 51.4 | 0.119 | |
| 34.13–89.66 | 0.080–0.471 | 61.7–149.6 | 43.3–65.8 | 0.074–0.238 | |
| THE ORIGIN OF THE SAMPLES: SPAIN | |||||
| almond (O) | 68.14 ± 13.89 | 0.290 ± 0.113 | 138.4 ± 22.7 | 67.0 ± 6.57 | 0.149 ± 0.050 |
| 44.06–77.78 | 0.117–0.381 | 116.8–176.6 | 59.3–74.3 | 0.067–0.206 | |
| 73.98 | 0.336 | 131.5 | 65.8 | 0.158 | |
| 68.79–76.13 | 0.238–0.377 | 129.8–137.3 | 62.6–73.2 | 0.152–0.159 | |
| chestnut (P) | 116.06 ± 14.67 | 1.043 ± 0.383 | 186.5 ± 43.1 | 43.0 ± 21.7 | 0.275 ± 0.043 |
| 100.14–129.95 | 0.665–1.441 | 136.8–236.7 | 10.5–66.9 | 0.218–0.317 | |
| 121.40 ** C/P, ** E/P | 1.021 * C/P, *** E/P, ** M/P | 198.4 | 40.3 | 0.288 * C/P, * D/P, * E/P | |
| 100.61–128.20 | 0.667–1.423 | 147.1–213.5 | 39.2–58.3 | 0.243–0.308 | |
| heath (Q) | 111.06 ± 17.93 | 0.563 ± 0.460 | 255.96 ± 101.71 | 41.1 ± 27.1 | 0.320 ± 0.052 |
| 88.59–131.25 | 0.045–0.957 | 137.8–403.69 | 8.8–63.5 | 0.244–0.367 | |
| 105.84 ** C/Q, * E/Q | 0.851 | 251.6 * C/Q | 57.73 | 0.348 ** C/Q, ** E/Q | |
| 102.20–127.40 | 0.079–0.886 | 192.1–294.6 | 14.3–61.2 | 0.290–0.351 | |
| lavender (R) | 53.23 ± 7.95 | 0.238 ± 0.111 | 130.3 ± 39.8 | 60.4 ± 13.9 | 0.154 ± 0.041 |
| 40.65–62.57 | 0.116–0.408 | 92.2–187.6 | 39.0–71.9 | 0.092–0.207 | |
| 54.73 | 0.213 | 113.1 | 68.1 | 0.159 | |
| 52.81–55.38 | 0.176–0.276 | 103.4–154.7 | 53.8–69.3 | 0.148–0.162 | |
| orange (S) | 30.57 ± 3.44 | 0.089 ± 0.027 | 62.8 ± 14.9 | 45.0 ± 13.2 | 0.053 ± 0.017 |
| 27.84–34.48 | 0.071–0.136 | 42.2–84.2 | 21.9–53.6 | 0.034–0.071 | |
| 28.42 *** F/S | 0.076 * F/S | 62.5 | 51.5 | 0.049 ** F/S | |
| 27.93–34.17 | 0.074–0.087 | 62.1–63.2 | 46.3–51.8 | 0.042–0.071 | |
| rosemary (T) | 41.06 ± 17.00 | 0.117 ± 0.052 | 57.6 ± 13.8 | 64.3 ± 20.3 | 0.098 ± 0.068 |
| 23.22–59.64 | 0.051–0.179 | 40.7–78.3 | 38.2–84.9 | 0.015–0.165 | |
| 43.35 | 0.138 | 58.9 | 71 | 0.124 ** L/T, * Q/T | |
| 24.01–55.10 | 0.078–0.142 | 50.8–59.5 | 47.9–79.4 | 0.015–0.165 | |
| thyme (U) | 116.6 ± 42.4 | 0.359 ± 0.192 | 104.0 ± 11.9 | 79.3 ± 2.4 | 0.316 ± 0.038 |
| 92.2–190.8 | 0.195–0.673 | 90.7–118.2 | 75.6–81.8 | 0.276–0.358 | |
| 94.3 * C/U, * E/U | 0.356 | 100.4 ** C/U | 79.7 * C/U, * E/U | 0.314 ** C/U, ** E/U | |
| 92.66–112.95 | 0.210–0.364 | 96.1–114.5 | 78.8–80.7 | 0.281–0.352 | |
| TOTAL | 76.67 ± 39.58 | 0.386 ± 0.382 | 133.6 ± 78.0 | 57.2 ± 20.6 | 0.195 ± 0.110 |
| 23.22–190.80 | 0.045–1.441 | 40.7–403.7 | 8.8–84.9 | 0.015–0.367 | |
| 73.98 | 0.213 | 116.8 | 61.2 | 0.165 | |
| 43.35–102.20 | 0.116–0.665 | 78.3–176.6 | 46.3–73.2 | 0.092–0.290 | |
| Varieties According to the Melissopalinological Analysis (Sign) | Total Phenolic Content | Color Intensity | Color in Pfund Scale | DPPH | FRAP (Equivalent µmoles of Fe2+/mL of Sample) |
|---|---|---|---|---|---|
| (mg GAE/100 g) | (mAU) | (mm Pfund) | (%) | ||
| Av. ± SD Min–Max Med. Q1–Q3 | |||||
| THE ORIGIN OF THE SAMPLES: ITALY | |||||
| chestnut, n = 5 (A) | 95.1 ± 16.7 | 0.346 ± 0.241 | 121.8 ± 12.98 | 63.5 ± 3.4 | 0.222 ± 0.030 |
| 78.58–114.00 | 0156–0.694 | 104.7–140.4 | 58.1–67.4 | 0.193–0.265 | |
| 87.4 | 0.192 | 123.1 | 64.4 | 0.216 | |
| 83.38–112.20 | 0.185–0.506 | 116.6–124.4 | 63.0–64.8 | 0.197–0.237 | |
| eucalyptus, n = 3 (B) | 56.01 ± 14.20 | 0.314 ± 0.054 | 116.8 ± 22.3 | 67.3 ± 3.4 | 0.204 ± 0.013 |
| 47.64–72.41 | 0.275–0.376 | 100.4–142.2 | 64.1–71.0 | 0.188–0.214 | |
| 47.99 | 0.292 | 107.8 | 66.8 | 0.21 | |
| 47.64–72.41 | 0.275–0.376 | 100.4–142.2 | 64.1–71.0 | 0.188–0.214 | |
| lemon, n = 1 (C) | 21.89 | 0.12 | 35.1 | 37.6 | 0.025 |
| - | - | - | - | - | |
| 21.89 | 0.12 | 35.1 | 37.6 | 0.025 | |
| - | - | - | - | - | |
| Lotus corniculatus L., n = 6 (D) | 22.47 ± 3.33 | 0.233 ± 0.285 | 43.3 ± 19.6 | 36.0 ± 12.9 | 0.024 ± 0.020 |
| 18.01–24.49 | 0.051–0.776 | 31.7–83.1 | 15.2–51.5 | 0.006–0.051 | |
| 23.56 *** A/D | 0.099 | 36.4 | 37 | 0.015 | |
| 18.90–24.24 | 0.054–0.230 | 35.1–37.3 | 30.8–44.2 | 0.008–0.047 | |
| multifloral, n = 1 (E) | 50.73 | 0.176 | 84.8 | 43.2 | 0.119 |
| - | - | - | - | - | |
| 50.73 | 0.176 | 84.8 | 43.2 | 0.119 | |
| - | - | - | - | - | |
| orange, n = 3 (F) | 33.28 ± 3.33 | 0.088 ± 0.018 | 47.5 ± 20.5 | 45.6 ± 11.0 | 0.077 ± 0.031 |
| 29.58–36.04 | 0.075–0.108 | 33.5–71.1 | 35.4–57.3 | 0.006–0.113 | |
| 34.21 * A/F | 0.080 * A/F | 38.1 | 44.2 | 0.059 | |
| 29.58–36.04 | 0.075–0.108 | 33.5–71.1 | 35.4–57.3 | 0.006–0.113 | |
| other, n = 1 (G) | 48.91 | 0.194 | 80.6 | 57.7 | 0.118 |
| - | - | - | - | - | |
| 48.91 | 0.194 | 80.6 | 57.7 | 0.118 | |
| - | - | - | - | - | |
| TOTAL | 49.99 ± 30.83 | 0.241 ± 0.206 | 78.1 ± 40.0 | 50.5 ± 15.3 | 0.118 ± 0.089 |
| 18.01–114.00 | 0.050–0.776 | 31.7–142.2 | 15.2–71.0 | 0.006–0.265 | |
| 41.84 | 0.18 | 81.8 | 54.4 | 0.115 | |
| 24.28–75.49 | 0.094–0.307 | 36.4–112.2 | 39.9–64.2 | 0.036–0.204 | |
| THE ORIGIN OF THE SAMPLES: POLAND | |||||
| buckwheat, n = 5 (H) | 212.63 ± 37.71 | 1.421 ± 0.724 | 248.2 ± 64 | 39.1 ± 15.0 | 0.391 ± 0.014 |
| 167.75–261.05 | 0.770–2.605 | 182.8–351.1 | 21.1–57.9 | 0.370–0.407 | |
| 213.05 *** D/H, ** F/H | 1.138 ** D/H, ** F/H | 237.3 | 43.5 | 0.394 *** D/H, ** F/H | |
| 184.95–236.35 | 1.015–1.578 | 212.2–257.8 | 26.6–46.3 | 0.383–0.400 | |
| heather, n = 3 (I) | 80.83 ± 33.80 | 0.314 ± 0.080 | 126.0 ± 31.6 | 33.3 ± 22.9 | 0.133 ± 0.014 |
| 49.42–116.60 | 0.265–0.407 | 90.2–149.6 | 6.8–47.9 | 0.118–0.142 | |
| 76.48 | 0.271 | 138.3 | 45 | 0.141 ** D/I | |
| 49.42–116.60 | 0.265–0.406 | 90.2–149.6 | 6.8–47.9 | 0.118–0.142 | |
| honeydew coniferous, n = 5 (J) | 98.38 ± 23.03 | 0.517 ± 0.151 | 244.8 ± 171.8 | 54.8 ± 20.5 | 0.276 ± 0.079 |
| 64.57–120.75 | 0.309–0.643 | 77.9–518.8 | 24.4–74.2 | 0.152–0.343 | |
| 109.35 * D/J | 0.61 | 244.8 | 61.1 | 0.312 * D/J | |
| 85.25–112.00 | 0.404–0.622 | 122.3–259.4 | 44.4–69.7 | 0.243–0.328 | |
| honeydew deciduous, n = 2 (K) | 87.50 ± 6.94 | 0.486 ± 0.089 | 163.2 ± 52.1 | 70.0 ± 2.2 | 0.221 ± 0.031 |
| 82.60–92.41 | 0.424–0.549 | 126.4–200.1 | 68.5–71.5 | 0.199–0.242 | |
| 87.5 | 0.486 | 163.2 | 70 | 0.221 | |
| 82.60–92.41 | 0.424–0.549 | 126.4–200.1 | 68.5–71.5 | 0.199–0.242 | |
| linden, n = 4 (L) | 54.25 ± 24.35 | 0.206 ± 0.189 | 78.9 ± 16.4 | 61.1 ± 11.5 | 0.105 ± 0.055 |
| 36.61–89.66 | 0.098–0.489 | 61.0–100.8 | 51.0–76.7 | 0.074–0.188 | |
| 45.37 | 0.118 | 77 | 58.4 | 0.079 | |
| 38.32–70.18 | 0.103–0.308 | 68.3–89.5 | 52.4–69.8 | 0.075–0.135 | |
| multiflower, n = 8 (M) | 56.70 ± 32.38 | 0.250 ± 0.190 | 92.3 ± 64.7 | 54.0 ± 29.7 | 0.130 ± 0.101 |
| 14.70–93.37 | 0.025–0.528 | 0.1–184.5 | 9.3–100.0 | 0.004–0.244 | |
| 58.65 | 0.242 | 109.3 | 56.6 | 0.113 | |
| 28.67–83.47.39 | 0.070–0.411 | 38.3–129.5 | 30.1–74.6 | 0.042–0.239 | |
| nectar-honeydew, n = 2 (N) | 80.75 ± 3.30 | 0.401 ± 0.222 | 142.6 ± 11.0 | 68.6 ± 3.9 | 0.198 ± 0.029 |
| 78.42–83.08 | 0.244–0.559 | 134.8–150.4 | 65.8–71.3 | 0.178–0.219 | |
| 80.75 | 0.401 | 142.6 | 68.6 | 0.198 | |
| 78.42–83.08 | 0.244–0.559 | 134.8–150.4 | 65.8–71.3 | 0.178–0.219 | |
| phacelia, n = 3 (O) | 42.97 ± 28.67 | 0.158 ± 0.207 | 76.3 ± 61.3 | 61.5 ± 24.3 | 0.098 ± 0.084 |
| 25.17–93.74 | 0.050–0.528 | 32.9–184.5 | 39.6–100.0 | 0.042–0.44 | |
| 30.96 | 0.060 * H/O | 55.6 * H/O | 50.2 | 0.057 * H/O | |
| 28.62–36.39 | 0.058–0.095 | 51.4–56.9 | 47.3–70.2 | 0.051–0.094 | |
| rape, n = 18 (P) | 36.95 ± 11.79 | 0.118 ± 0.089 | 75.1 ± 32.5 | 53.6 ± 16.7 | 0.094 ± 0.054 |
| 24.04–68.85 | 0.045–0.379 | 25.3–137.6 | 30.1–100.0 | 0.026–0.229 | |
| 34.41 ** A/P, *** H/P | 0.094 ** A/P, * H/P | 72 | 51.4 | 0.092 * A/P, ** H/P | |
| 29.26–40.75 | 0.060–0.133 | 49.8–87.4 | 43.3–59.9 | 0.056–0.118 | |
| TOTAL | 71.20 ± 56.32 | 0.351 ± 0.453 | 122.9 ± 92.8 | 52.5 ± 19.5 | 0.157 ± 0.114 |
| 14.70–261.05 | 0.025–2.605 | 0.1–518.8 | 6.8–100.0 | 0.004–0.407 | |
| 50.06 | 0.22 | 102.7 | 51.4 | 0.119 | |
| 34.13–89.66 | 0.080–0.471 | 61.7–149.6 | 43.3–65.8 | 0.074–0.238 | |
| THE ORIGIN OF THE SAMPLES: SPAIN | |||||
| almond, n = 1 (Q) | 68.8 | 0.377 | 131.5 | 62.6 | 0.159 |
| - | - | - | - | - | |
| 68.8 | 0.377 | 131.5 | 62.6 | 0.159 | |
| - | - | - | - | - | |
| chestnut, n = 5 (R) | 68.14 ± 13.89 | 0.290 ± 0.113 | 138.4 ± 22.7 | 67.0 ± 6.57 | 0.149 ± 0.050 |
| 44.06–77.78 | 0.117–0.381 | 116.8–176.6 | 59.3–74.3 | 0.067–0.206 | |
| 73.98 | 0.336 | 131.5 | 65.8 | 0.158 | |
| 68.79–76.13 | 0.238–0.377 | 129.8–137.3 | 62.6–73.2 | 0.152–0.159 | |
| heath, n = 4 (S) | 106.01 ± 16.08 | 0.465 ± 0.466 | 257.0 ± 117.4 | 37.0 ± 29.4 | 0.312 ± 0.056 |
| 88.59–127.40 | 0.045–0.886 | 137.8–403.7 | 8.8–63.5 | 0.244–0.367 | |
| 104.02 * D/S | 0.465 | 243.3 * D/S | 37.7 | 0.319 | |
| 95.40–116.52 | 0.062–0.868 | 164.9–349.1 | 11.6–62.4 | 0.267–0.357 | |
| lavender, n = 5 (T) | 53.23 ± 7.95 | 0.238 ± 0.111 | 130.3 ± 39.8 | 60.4 ± 13.9 | 0.154 ± 0.041 |
| 40.65–62.57 | 0.116–0.408 | 92.2–187.6 | 39.0–71.9 | 0.092–0.207 | |
| 54.73 | 0.213 | 113.1 | 68.1 | 0.159 | |
| 52.81–55.38 | 0.176–0.276 | 103.4–154.7 | 53.8–69.3 | 0.148–0.162 | |
| multifloral, n = 9 (U) | 70.39 ± 34.72 | 0.290 ± 0.269 | 118.6 ± 65.9 | 65.4 ± 11.8 | 0.172 ± 0.115 |
| 27.84–131.25 | 0.076–0.957 | 42.2–251.6 | 46.3–79.4 | 0.041–0.352 | |
| 73.98 | 0.195 | 116.8 | 65.8 | 0.152 | |
| 44.06–77.78 | 0.136–0.336 | 63.2–137.3 | 57.7–74.3 | 0.071–0.206 | |
| orange, n = 3 (V) | 30.17 ± 3.47 | 0.077 ± 0.009 | 69.6 ± 12.7 | 41.8 ± 17.2 | 0.051 ± 0.018 |
| 27.93–34.17 | 0.071–0.087 | 62.2–84.2 | 21.9–51.8 | 0.034–0.071 | |
| 28.42 | 0.074 ** V/P | 62.5 | 51.5 | 0.049 | |
| 27.93–34.17 | 0.071–0.087 | 62.1–84.2 | 21.9–51.8 | 0.034–0.071 | |
| rosemary, n = 4 (W) | 37.55 ± 17.42 | 0.102 ± 0.045 | 57.3 ± 16.0 | 60.49 ± 21.3 | 0.086 ± 0.070 |
| 23.22–59.64 | 0.051–0.142 | 40.7–78.3 | 38.2–84.9 | 0.015–0.165 | |
| 33.68 | 0.108 | 55.1 | 59.5 | 0.081 | |
| 23.62–51.49 | 0.064–0.140 | 45.7–68.9 | 43.1–77.9 | 0.027–0.144 | |
| thyme, n = 4 (X) | 117.49 ± 48.88 | 0.400 ± 0.195 | 107.3 ± 10.7 | 79.4 ± 2.7 | 0.307 ± 0.038 |
| 92.21–190.80 | 0.210–0.673 | 96.1–118.2 | 75.6–81.8 | 0.276–0.358 | |
| 93.48 * D/X | 0.36 | 107.5 | 80.2 * D/X | 0.298 ** D/X | |
| 92.43–142.55 | 0.283–0.518 | 98.3–116.4 | 77.7–81.2 | 0.279–0.336 | |
| TOTAL | 76.67 ± 39.58 | 0.386 ± 0.382 | 133.6 ± 78.0 | 57.2 ± 20.6 | 0.195 ± 0.110 |
| 23.22–190.80 | 0.045–1.441 | 40.7–403.7 | 8.8–84.9 | 0.015–0.367 | |
| 73.98 | 0.213 | 116.8 | 61.2 | 0.165 | |
| 43.35–102.20 | 0.116–0.665 | 78.3–176.6 | 46.3–73.2 | 0.092–0.290 | |
| Origin | Total Phenolic Content | Color Intensity | Color in Pfund Scale | DPPH | FRAP (Equivalent µM of Fe2+/mL of Sample) |
|---|---|---|---|---|---|
| (Sign) | (mg GAE/100 g) | (mAU) | (mm Pfund) | (%) | |
| Italy (A) | 51.66 ± 32.81 | 0.255 ± 0.221 | 80.1 ± 42.2 | 51.3 ± 16.1 | 0.123 ± 0.094 |
| 18.01–114.0 | 0.051–0,776 | 31.7–142.2 | 15.2–71.0 | 0.006–0.265 | |
| 36.04 | 0.184 | 83.1 | 57.3 | 0.113 | |
| 24.34–78.58 | 0.080–0.323 | 37.0–116.6 | 42.1–64.4 | 0.047–0.210 | |
| Poland (B) | 70.08 ± 58.61 | 0.343 ± 0.470 | 117.3 ± 95.3 | 51.0 ± 19.7 | 0.153 ± 0.118 |
| 14.70–261.05 | 0.025–2.605 | 0.1–518.8 | 6.8–100.0 | 0.004–0.407 | |
| 43.8 | 0.136 | 86.4 | 50.6 | 0.113 | |
| 30.96–89.66 | 0.078–0.406 | 61.0–138.2 | 43.0–61.1 | 0.061–0.238 | |
| Spain (C) | 76.90 ± 40.15 | 0.386 ± 0.388 | 133.7 ± 79.1 | 57.1 ± 20.9 | 0.196 ± 0.111 |
| 23.22–190.00 | 0.045–1.441 | 40.7–403.7 | 8.8–84.9 | 0.015–0.367 | |
| 75.05 | 0.211 | 115.7 * A/C | 60.3 | 0.186 | |
| 43.35–102.20 | 0.116–0.665 | 78.3–176.6 | 46.3–73.2 | 0.092–0.290 |
Publisher’s Note: MDPI stays neutral with regard to jurisdictional claims in published maps and institutional affiliations. |
© 2022 by the authors. Licensee MDPI, Basel, Switzerland. This article is an open access article distributed under the terms and conditions of the Creative Commons Attribution (CC BY) license (https://creativecommons.org/licenses/by/4.0/).
Share and Cite
Puścion-Jakubik, A.; Bielecka, J.; Grabia, M.; Markiewicz-Żukowska, R.; Soroczyńska, J.; Teper, D.; Socha, K. Comparative Analysis of Antioxidant Properties of Honey from Poland, Italy, and Spain Based on the Declarations of Producers and Their Results of Melissopalinological Analysis. Nutrients 2022, 14, 2694. https://doi.org/10.3390/nu14132694
Puścion-Jakubik A, Bielecka J, Grabia M, Markiewicz-Żukowska R, Soroczyńska J, Teper D, Socha K. Comparative Analysis of Antioxidant Properties of Honey from Poland, Italy, and Spain Based on the Declarations of Producers and Their Results of Melissopalinological Analysis. Nutrients. 2022; 14(13):2694. https://doi.org/10.3390/nu14132694
Chicago/Turabian StylePuścion-Jakubik, Anna, Joanna Bielecka, Monika Grabia, Renata Markiewicz-Żukowska, Jolanta Soroczyńska, Dariusz Teper, and Katarzyna Socha. 2022. "Comparative Analysis of Antioxidant Properties of Honey from Poland, Italy, and Spain Based on the Declarations of Producers and Their Results of Melissopalinological Analysis" Nutrients 14, no. 13: 2694. https://doi.org/10.3390/nu14132694